Article

Social Determinants of School-to-School Differences in Opportunity to Learn (OTL): A Cross-National Study

1
Department of Educational Foundations, Organizations, and Policy, School of Education, University of Pittsburgh, Pittsburgh, PA 15260, USA
2
Department of Biology, University of Washington, Seattle, WA 98195, USA
*
Author to whom correspondence should be addressed.
Soc. Sci. 2024, 13(10), 499; https://doi.org/10.3390/socsci13100499
Submission received: 19 July 2024 / Revised: 5 September 2024 / Accepted: 22 September 2024 / Published: 24 September 2024
(This article belongs to the Section Social Stratification and Inequality)

Abstract

:
Do some students learn more than others because they attend School A instead of School B? Or is educational inequality generated elsewhere, from common processes within schools, or outside of formal schooling? Within these paradigmatic questions, this study investigates the social determinants of school-to-school differences in STEM course-taking experiences, a key component of Opportunity to Learn (OTL), in a cross-national setting. Drawing on an internal-development model and social stratification theories, we examine whether observed school-to-school differences in OTL can more clearly be attributed to functional or dysfunctional sources, using a large cross-national sample from TIMSS with 278 observations across 67 countries/regions, dating from 1995 to 2019. Results from Generalized Multilevel Linear Models indicate that variation in school-level OTL comes primarily from variation in school readiness in a given country. Yet, we also observe evidence that supports conflict forces of differentiation. This paper contributes to existing cross-national studies of educational inequality by tracing the fundamental origins of inequality in OTL, locating potentially dysfunctional sources of OTL between schools.

1. Introduction

Cross-national empirical studies of educational inequality address an important overarching question: to what extent do the organizational features of school systems affect inequality in education outcomes? The research speaks to a basic concern that both policymakers and parents would like to know, and that is that particular characteristics of school systems (e.g., the way that students are selected and grouped) may result in variations in achievement and have consequences for enlarging inequality in educational outcomes. In understanding outcomes of educational systems, researchers have examined how the level of inequality in achievement is related to the degree to which education systems stratify students through different opportunities to learn (e.g., Brunello and Checchi 2007; Hanushek and Wößmann 2006; Montt 2011). Yet, what leads to stratified Opportunity to Learn in the first place? In this analysis, we consider school-to-school differences in Opportunity to Learn as a major form of stratification of OTL in the cross-national setting because between-school tracking is predominant in many different countries.
An important theoretical frame for this analysis, taken from classic theories of social stratification, is that there is a basic evolution of social inequality as countries develop, with certain developmental factors first increasing then decreasing inequality writ-large (e.g., both directly and through mechanisms such as the share of urban residents in a country), so the degree of inequality in schooling and other aspects of society can be understood as a departure from that “natural” trend. Much as the recent school effects literature in the summer-learning paradigm (Downey 2020) helps frame and focus social and educational policy on the sources of test-score inequality that really matter, school-to-school differences in Opportunity to Learn should be understood in the context of the fundamental social forces that shape educational systems.
Subsequently, within this basic developmental framework for understanding social and educational inequality, we then apply the conceptual framework proposed by Kelly and Price (2011), who innovatively applied theories of social stratification, including technical-functional theory and conflict theories, to explain the observed school-to-school variations in tracking policies. Technical-functional theory suggests that tracking systems enable teachers to match instruction to students’ skills and target their instruction to an ability-homogeneous groups of students (Hallinan 1994), whereas conflict theories suggest that school systems may also produce dysfunctional inequality that benefits advantaged students. At the system level, a school system may produce inequality in Opportunity to Learn in a functional way, as a result of variation in school academic readiness; that is, the school-to-school differences in Opportunity to Learn may fit the distribution of average academic readiness of each school. On the other hand, school systems may also produce excessive and dysfunctional inequality, such as a tracking system that benefits high-SES students by providing especially rich learning opportunities. Therefore, understanding the reason behind the origin of such inequality may enable us to disentangle the total observed inequality in Opportunity to Learn. Finally, this analysis discusses the role of education policies concerning stratification and standardization in moderating the effect of social inequality on school-to-school differences in Opportunity to Learn.
Using a large cross-national sample with 278 observations across 67 countries/regions, dating from 1995 to 2019, this empirical study contributes to the existing cross-national studies of educational inequality in several ways. First, this study traces the fundamental origin of inequality in Opportunity to Learn across countries; that is, inequality in OTL is theorized to be responsive to the basic evolution of social inequality as countries develop. The extent to which schools differ in the provision of Opportunity to Learn can then be attributed to both functional and conflict dimensions. Second, this analysis utilizes actual curricular content measured in TIMSS and is even more focused on the content of instruction and learning than studies focusing on course/program provision (although specific content is closely linked with course-taking). Third, this study advocates a comprehensive consideration of country-level developmental factors in cross-national studies of educational inequality. It’s worthwhile to note that the term “inequality” speaks to the structure of the unequal distribution of educational resources (i.e., learning opportunities in this study), as opposed to the extent to which the system favors families/students with social advantages (commonly referred to as “inequity”). In this study, we aim to generate a measurement scheme that captures inequality in OTL and traces the fundamental social forces that generate this inequality. Yet, due to data limitations, this analysis does not measure educational inequity.

2. Background Literature

2.1. Cross-National Studies on Educational Inequality

Studies of the institutional structure of educational systems focus on how education is organized for selection and allocation (i.e., how education systems stratify students through differential Opportunity to Learn), which in turn induces variation in various educational outcomes (e.g., Bol et al. 2014; Brunello and Checchi 2007; Buchmann and Dalton 2002; Buchmann and Park 2009; Chmielewski et al. 2013; Parker et al. 2016; Van De Werfhorst and Mijs 2010). Closely related to the present study, foundational research has focused on characterizing curriculum tracking systems and capturing baseline country-to-country variation in tracking systems (e.g., Broaded 1997; Van Houtte 2004).
In his comprehensive empirical work, Montt (2011) established an overarching framework for understanding educational inequalities in the cross-national setting. In particular, Montt (2011) examined the extent to which two important dimensions of educational systems, inequality in Opportunity to Learn and the intensity of schooling, were related to differences in achievement inequality across countries, net of variation in family background, using PISA 2006 data. The framework speaks to the important role of reducing inequality in Opportunity to Learn in decreasing total achievement inequality and equalizing the educational inequality due to SES heterogeneity, in the cross-national setting. Among his indicators of Opportunity to Learn, between-school tracking practices were found to be related to inequality in achievement. Specifically, more tracking programs and earlier tracking, measured at the country level, were associated with greater inequality in achievement, after controlling for intensity of schooling and the SES distribution. Montt (2011) provides a compelling conceptual framework that establishes the theoretical link between variation in Opportunity to Learn and achievement inequality, an important form of educational inequality that both educators and policymakers care about (e.g., Coleman 1968) in a cross-national research setting.
Consistent with Montt (2011), Hanushek and Wößmann (2006) found a similar association between inequality in achievement and tracking practice at the national level. Using PIRLS (for 4th grade data) and TIMSS (for 8th grade data) data, Hanushek and Wößmann (2006) found that countries experienced a greater increase in achievement inequality from 4th grade to 8th grade with highly differentiated secondary education systems, after controlling for inequality in achievement at 4th grade. The gain in achievement inequality was less dramatic among countries with less-differentiated secondary school systems. Huang (2009) found that high-achieving students enjoyed mathematics achievement gains at the expense of achievement loss among low achievers in countries with greater tracking selectivity. Although Huang’s (2009) results were not precisely similar to Montt (2011) or Hanushek and Wößmann (2006), Huang (2009) showed that more intensive tracking at the country level may have enlarged pre-existing achievement gaps between high-achievers and low-achievers. Overall, educational systems with a greater degree of explicit stratification induce greater inequality in achievement where different students are selected and allocated to different instructional contexts.
Another set of empirical studies focuses less on the total variance in educational outcomes, and instead on the degree to which educational systems stratify students from different social origins (e.g., Ammermueller 2005; Marks 2005; Brunello and Checchi 2007; Buchmann and Park 2009). Brunello and Checchi (2007) examined how the effect of family background on various educational outcomes is moderated by stratification, measured as the duration of between-school differentiation within each educational system, using ECHP, ISSP, IALS, and PISA 2003 datasets. They found that the inequality in educational achievement and post-secondary enrollment induced by family background increased with greater duration of tracking (Brunello and Checchi 2007). They also found that the advantage of wealthier families on long-term educational outcomes (i.e., job income) was reduced as the length of tracking increased. In Buchmann and Park’s (2009) study of the relationship between stratification and educational expectations in highly differentiated educational systems using PISA 2003, they identified the critical role of stratification in perpetuating and exacerbating SES inequality.
Overall, research on country-level stratification systems indicate that: more highly elaborated between-school tracking practices are associated with greater inequality in achievement growth. However, although these studies are consistent with conflict-based theories of schooling (where e.g., high-SES students take advantage of tracked systems), they do not actually show that the tracking policies and practices are motivated by, and/or generated from, conflict-based social forces. Moreover, such studies fail to explicitly address the functional and dysfunctional sources of inequality in Opportunity to Learn specific, measured curricular content, which will be the primary focus of this study.

2.2. Developmental Stage, Social Inequality, and Variation in Opportunity to Learn

In Kuznets’ (1955) pioneering analysis of historical trend data from Great Britain, Germany, and the US, he found an inverted U-shape relationship between income inequality (measured by the GINI coefficient) and country developmental stage (measured as GDP per Capita); that is, as countries developed (i.e., approaching advanced industrial societies), income inequality first increased, and then declined. Kuznets’ (1955) analysis created an important framework that linked social inequality with a country’s developmental stage. This framework was later expanded to identify the relationships between income inequality and various social developmental/structural factors beyond just GDP and GDP per capita.
In the late 1990s, Nielsen and Alderson (1995) revisited Kuznets’ framework and proposed an “internal development” model to understand the relationship between inequality and development1 (Nielsen 1994; Nielsen and Alderson 1995; Nielsen and Alderson 1997; Alderson and Nielsen 1999). They argued that country developmental stage should be understood in a more systematic way; that is, internal development factors should be isolated and emphasized to understand their role in generating social inequality as countries developed. The internal-development framework considers three major processes through which a country’s development generates income inequality. First, this model identifies both between- and within-sector inequality as the labor force shifts from the agricultural sector to the industrial sector as countries develop as an important source of inequality. Both sector dualism (capturing income inequality due to between-sector disparities) and the size of the agricultural sector (capturing income inequality within sectors) are considered in this process. Second, this model considers the role of rapid population growth in producing excessive labor supply, which in turn produces income inequality. Third, the internal-development model regards the spread of secondary education as producing an increased supply of skilled labor, which may ultimately contribute to a decrease in income inequality. In the current study, we focus on labor shifts, population growth, and the rate of educational expansion as variables capturing a country’s developmental stage, and consequently, that have a generative effect on social inequality.
Subsequent studies using the internal-development framework have extended our understanding of inequality-generating processes in the post-2000s era. For example, in a recent study revisiting the internal-development framework, Clark (2020) proposed several modifications on the original internal-development framework, including using sector pluralism to consider all three major employment sectors (agriculture, industry, and services), and replacing secondary enrollment with tertiary education enrollment to better reflect the supply structure of skilled labors. In the current study, we adopt Clark’s modified focus on tertiary education instead of secondary education, to better reflect the labor force structure and educational expansion in the current era.
Both Kuznets (1955) original analysis and the internal-development model of inequality (Nielsen 1994; Nielsen and Alderson 1995) focus on the most essential relationships concerning development and income inequality. Can this framework be expanded to educational outcomes and be used to understand the relationships between developmental stage, social inequality, and capacity to equitably allocate educational resources (i.e., Opportunity to Learn)? Much as Cole’s (2018) recent empirical study on political inequality applies the internal-development framework to examine the relationship among development, social inequality (notably, income inequality), and inequality in political power, we apply the internal-development model to understand educational systems. In this study, we argue that the internal-development framework is useful in systematically exploring the relationship between the nature of society in a country and various educational outcomes, and for tracing the fundamental sources of educational inequality through development and social inequality (notably, income inequality).
Based on conceptual models from the literature reviewed thus far, we portray the baseline model in Figure 1. Developmental stage (Box 1) is related to basic social inequality (Box 2), and social inequality in turn produces the variation in school-to-school differences in Opportunity to Learn (Box 3). The relationship between social inequality (Box 2, which includes income inequality and unequal population distribution) and variation in school-level Opportunity to Learn (Box 3) within each country is indicated with Path A1, net of countries’ actual developmental stage (Box 1) measured by three constructs from the internal-development framework.
This model is helpful in tracing the fundamental sources of educational inequality and identifying which countries have greater, lesser, or “appropriate” inequality than anticipated/predicted from this model. Moreover, this baseline model establishes the conceptual framework for later analysis where we consider functional- and conflict-based explanations for between-school tracking. As such, our Hypothesis 1 states that the basic level of educational inequality (i.e., variation in Opportunity to Learn in this study) is responsive to the social distribution of economic and human resources, after considering the generative effects of internal-development factors on basic social inequality (i.e., developmental stage).

2.3. Functional and Conflict Sources of Inequality in Opportunity to Learn

Beyond the basic relationships in Figure 1, we anticipate educational systems are structured by a functional logic. Here, functional paradigms describe a rational and meritocratic view of schooling; schools prepare students with different levels of cognitive skills and effectively sort students into differentiated labor markets. This selection process is seen as a rational way to translate variations in skills and efforts into stratified social positions and occupational spheres. In this analysis, we use the term “functional logic” to describe the way in which schools purposefully match course-taking opportunities at the school level with school-level achievement, in the form of between-school tracking. Thus, we must add measures of achievement to Figure 1 in order to reveal the remaining, “dysfunctional” sources of tracking. The dysfunctional (or often referred to as “conflict”) forces describe the way in which advantaged students and families disproportionally benefit from the system. This inferential approach is well-motivated by the literature on school-to-school differences in tracking in the US setting. In Kelly and Price’s (2011) empirical work on examining the relationship between school compositional characteristics and school-to-school differences in school tracking policies, they examined both functional and conflict sources of tracking that motivated school-to-school variation in tracking policies. Functional forces were identified by the associations between dimensions of tracking and achievement heterogeneity. After adjusting for these functional factors, they then identified conflict forces, where various measures of school composition were hypothesized to motivate more elaborated tracking systems.
Here, we build on Kelly and Price’s (2011) approach, focusing on the core distinction between functional and conflict mechanisms. Technical-functional theory suggests that tracking systems enable teachers to match instruction (e.g., material, academic richness, and pace) to students’ skills and target their instruction to an ability-homogeneous group of students (Hallinan 1994; Oakes 1992). In the cross-national setting, functional explanations for variation in school-level Opportunity to Learn would suggest that schools structure course offerings to match students’ readiness (specifically, achievement prior to secondary education). Therefore, in the current study, we characterize the school-to-school differences in Opportunity to Learn in a country attributable to variation in school-mean academic readiness (see the measurement section for a detailed definition) as a functional process. In contrast, conflict theories of tracking posit that advantaged students maintain their advantages through school tracking systems. For example, opportunity hoarding theory describes the inter-group conflict between, in one case, high-SES families and working/poor families. That is, students from high-SES families limit access to high-track curriculum to maintain their own advantage (Oakes and Lipton 1992; Wells and Oakes 1996). Status competition describes the competition for better educational attainment and labor force success within middle-class and high-SES families (Baker and Stevenson 1986). Such competition processes reflect the preference for pursuing competitive education among middle-class families (Useem 1991) due to a “fear of falling”. Figure 2 revises the model in Figure 1 to include both functional (Path B and C) and dysfunctional pathways (Path A2). While it’s empirically difficult to distinguish between two dysfunctional theories (opportunity hoarding and status competition) in a cross-national setting due to data limitations, conflict theories suggest that, in general, after accounting for the more functional effect of variation in school readiness, the remaining relationship between social inequality and educational inequality indicates a dysfunctional pathway (that is, Path A2 in Figure 2). It’s worthwhile to note that a different path number representing the relationship between social inequality (Box 2) and variation in school-level OTL (Box 3) is used in Figure 2 (Path A2) than in Figure 1 (Path A1) to indicate two different theoretical approaches.
As such, based on the analysis of the literature and proposed frameworks, Hypothesis 2a states that, if the variation in school-level Opportunity to Learn is motivated by functional forces, school-to-school differences in Opportunity to Learn will be explained by variation in school readiness/prior achievement, controlling for social inequality measures. Relatedly, after considering functional forces, if the observed school-to-school differences in Opportunity to Learn are related to conflict mechanisms, Hypothesis 2b alternatively states that we expect greater social inequality to be related to school-to-school differences in Opportunity to Learn.

2.4. Education Policies and Practices as Moderators: The Role of Stratification and Standardization

Early studies on the relationship between education and social stratification provide a comparative framework of how differences in educational systems lead to differences in the way in which students are sorted into the labor force (e.g., Kerckhoff 2001; Maurice et al. 1985; Müller and Karle 1993). Alan Kerckhoff conducted important work in this area, building off classic studies by Turner (1960) and others. Educational systems that differ in dimensions, such as stratification and standardization, vary in “capacity to structure” education trajectories (Kerckhoff 2001). For example, In Germany, school type is clearly associated with students’ post-secondary trajectories, and student’s occupational destinations are highly predictable once they are allocated into secondary education (Kerckhoff 2001; Allmendinger 1989), whereas the American comprehensive school system is known as a less explicitly stratified educational system where students’ future trajectories are not explicitly mapped to enrollment in a given type of secondary school.
The moderation effects of stratification and standardization policies on relationships between family background and educational outcomes has been studied empirically. For example, Brunello and Checchi (2007) found that inequality in educational attainment and post-secondary enrollment induced by family background increased with the practice of stratification (measured as the duration of between-school tracking practice). Studies on the relationship between standardization and educational inequality, however, find that standardization has a counterbalancing effect on the relationships among between-school tracking, social origins, and inequalities in educational outcomes (e.g., Ayalon and Gamoran 2000; Bol et al. 2014; Horn 2009; Park 2008). Park (2008), for example, found that standardization (e.g., national college entrance examination) reduced the effect of social origins on achievement inequality.
Hypothesis 3 states that stratification policies (e.g., longer tracking, early tracking, applying gate-keeper courses) will exacerbate the effect of social inequality on variation in school-level Opportunity to Learn, while standardization policies (e.g., national entrance/exit examination, or national curriculum standards) will attenuate this effect instead. Figure 3 illustrates this hypothesis, focusing on the direct effect of social inequality after accounting for variation in school readiness, the more obviously dysfunctional path from social inequality to Opportunity to Learn.
It’s worthwhile to note that due to data limitations, available measures of stratification and standardization are not fine-grained, making this moderation analysis weaker and more uncertain than the remainder of the model elements shown in Figure 2.

3. Methods

3.1. Measurement

3.1.1. Dependent Measures

In this analysis, we focus on school-to-school differences in Opportunity to Learn as a country-level dependent measure of inequality in OTL. The calculation of the dependent variable relies on teacher-reported curricular topic lists from the Math and Science Teacher Questionnaire of each TIMSS study. As an overview of the calculation process, we first code the difficulty level of each math and science course, and produce cumulative measures at the student-, school-, and finally country-level sequentially. The difficulty coding scheme builds upon individual course-taking reports in TIMSS. The goal for coding the difficulty level of course taking is first to designate a difficulty level for each topic taught, and then to produce a cumulative measure of individual students’ math and science course-taking opportunities at the 8th grade. To measure the overall Opportunity to Learn at the school level, we then calculate school-mean individual students’ course-taking opportunities. Finally, we examine the extent to which school-mean OTL deviates from the country mean by generating country-level variances of the school mean. Although we express these variances in slightly different forms for exposition purposes, throughout the analysis we focus on this singular dependent construct. Subsequent sub-sections describe the methodological details of each step. Figure 4 below summarizes the process.
Unfortunately, the TIMSS dataset does not include transcript data. We recognize that our measure of student course-taking experiences, relying on teacher-reported curricular topic lists, may have greater measurement error than transcript-based measures might have if they were available.

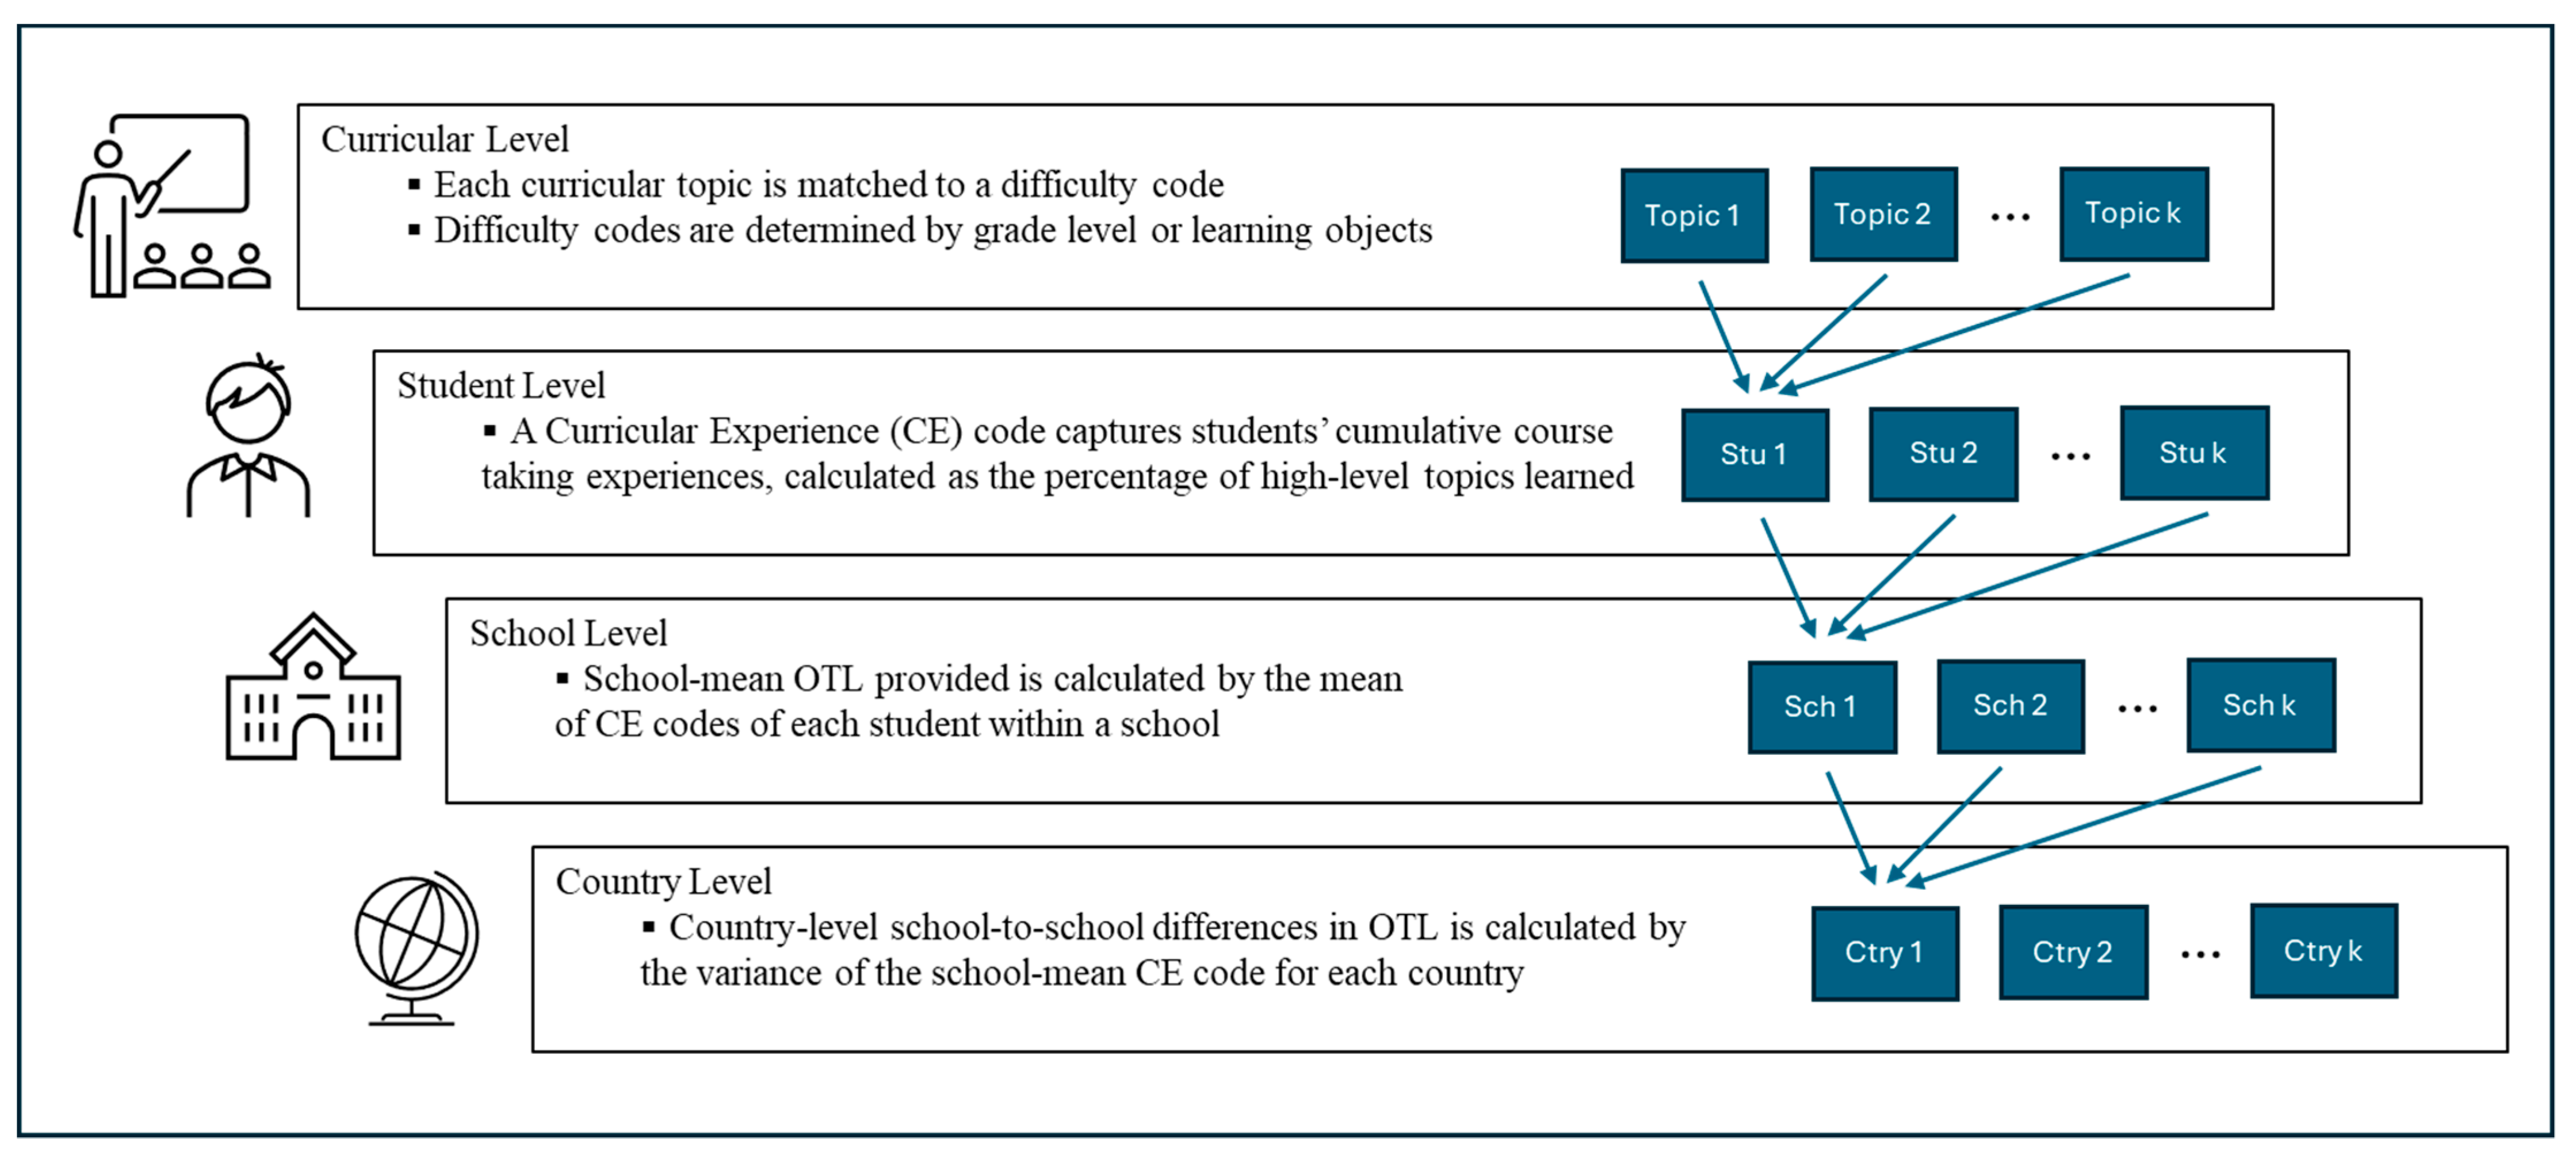
Difficulty Coding of Curricular Topic Report

Students at a given grade level may be exposed to a variety of content, below, above, and “at grade level”. We match each of the math curricular topics reported by the 8th grade teachers in TIMSS to an equivalent target grade level according to a widely used curricular standard in the US, the Common Core Mathematics Standards (CCMS). Curricular topics coded as high-level math topics are usually taught only in advanced middle school classrooms and include topics such as simultaneous equations and concepts like irrational numbers. Mid-level math topics (e.g., simple linear equations or basic statistical topics) are taught in regular, on-grade-level middle school math classes. TIMSS also identified basic mathematics topics that are most commonly taught before middle school but may be present in remedial middle school classes (e.g., computing with whole numbers). We coded these topics as low-level math curricular topics. In a second set of analyses, we focus specifically on middle school Algebra topics, a major focus of middle school mathematics and math reform.
Different in some respects from math topics, science curricular topics are not necessarily associated with a given grade level, especially at the middle school level. Therefore, instead of assigning a difficulty level based on grade-level norms, we use a previously developed science topic coding system that captures how deeply students have learned an array of science content during middle school (Xu and Kelly 2020). To determine the topic code for each topic, we first refer to Science Content Domain documents provided by the TIMSS team. Each topic is further described in this document by several specific learning objectives that enable us to identify how deeply each topic requires students to achieve. Detailed Curricular topic coding is available in Supplemental Tables S1–S6.

Individual Student-Level Measures of Course-Taking Experience

With math and science topics labeled as above, we then assign each student a Curricular Experience (CE) code based on reports by their teachers of the content students are taught in their classrooms. Depending on the organization of the science curriculum in a given school, students may stay in one math/science classroom or experience several different classes throughout middle school. Thus, in many cases multiple teachers report curricular topics for a given student in TIMSS. In this analysis, we label a student as having been exposed to a curricular topic if at least one teacher reports that topics are taught before or at 8th grade. For each student, we then calculate the percentage of high-level math and science topics learned as the summary, Curricular Experience measure, our main dependent variable. This percentage represents the proportion of high-level topics learned out of the total number of high-level curricular topics surveyed in TIMSS, and measure of the breadth and challenge/difficulty level of student course-taking experiences throughout middle school. Additionally, we calculate the percentage of high-level Algebra topics learned throughout middle school as an alternative dependent measure.

Country-Level Measures of Inequality in OTL

To examine school-to-school differences in Opportunity to Learn for each country, we aggregate student-level data to the school level (mean), then calculate the variance of the school-mean CE code (MCE and SCE) for each country. We also calculate the country-mean pairwise school differences in math and science CD code by averaging the difference between each possible pair of schools for each country. Average pairwise differences capture the expected difference in the school mean CE between two randomly selected schools within a country. These pairwise differences are conceptually almost identical to the variance, but for descriptive purposes, express the variability more intuitively than the variance.

3.1.2. Independent Measures

For independent variables, we consider four main categories of predictors: (1) developmental stage factors (Box 1 in Figure 2), (2) basic measures of social inequality (Box 2 in Figure 2), (3) school-to-school differences in school academic readiness (which is functionally related to school-to-school differences in course-taking, Box 4 in Figure 2), and (4) country-level stratification and standardization policies (Ed Policy in Figure 3). The developmental stage is captured by various internal-development processes, including development of the non-agricultural sector, higher education expansion, and the natural population increase rate. The basic level of social inequality is measured using income inequality (GINI coefficient) and a measure of rural/urban duality. School-to-school differences in school readiness are measured by the variance in students’ prior achievement. And finally, educational policy measures include three sets of dummy variables that capture the extent to which a country mandates/uses academic-based promotion, curriculum tracking, and high-stakes examinations. Table 1 provides a full description of independent variables.

3.2. Statistical Analyses

We run a series of Generalized Multilevel Linear Models (GMLM) with the Gamma distribution and logarithmic transformation of independent variables to estimate the school-to-school differences in OTL. Following Montt (2011), we use the Gamma distribution and logarithm transformation to address the positively skewed distribution of the variance of school-mean Curricular Experience (CE). We further use robust standard errors to address the potential misspecification of the link functional form and distribution (i.e., the Gamma distribution) given the likely underlying sampling distribution. The first model examines the relationship between socio-economic disparities within countries and school-to-school differences in OTL, controlling for internal-development factors (development of the non-agricultural sector, educational expansion, population growth, and economic development). The stage 1 model has the general form:
l o g ( σ j t 2 ) = α 0 + β T t + γ X j t + θ D j t + ε j t + τ j
where σ j t 2 are school-to-school differences in OTL measures (variance of school-mean MCE and SCE) for country j at year t. T t is a year indicator. X j t is a set of time-varying measures describing country j’s developmental stage at year t. D j t indicates a set of measures of social inequality measures for country j at year t. The estimation of coefficient θ explores the baseline sources of variation in school-level Opportunity to Learn adjusting for developmental stage.
The second model adds the key covariate related to functional explanations for variation in OTL, the variance of school-mean achievement ( Z j t is a time-varying variable indicating heterogeneity of school academic readiness for country j at year t). The stage 2 model has the form:
l o g ( σ j t 2 ) = α 0 + β T t + γ X j t + θ D j t + δ Z j t + ε j t + τ j
where δ explores the main functional source of variation in school-level Opportunity to Learn using a single indicator of functionalism. Finally, the third model considers the moderation effects of country-level stratification and standardization policies. It has the form ( P j t are education policy indicators at country j at year t):
l o g ( σ j t 2 ) = α 0 + β T t + γ X j t + θ D j t + δ Z j t + ρ D j t × P j t + P j + ε j t + τ j
The cross-product term D j t × P j t captures the interaction between social inequality measures and educational policy. ρ indicates whether the policies measured here moderate the effect of social stratification in producing school-to-school differences in Opportunity to Learn.
To interpret the coefficients from these generalized models, we should note that tables below exhibit raw coefficients that may not be directly interpreted without transformation and calculation. In the results section below, we will mention the raw coefficients first (with the location in the tables), provide the calculation process, and discuss the transformed coefficients in the form of percentage changes.
We also make some modifications to the analytic sample before running model estimations. First, we exclude countries that failed to include relevant valid measures of curricular topics. Under this definition, Algeria, Austria, Bosnia and Herzegovina, Moldova, and the Russian Federation are excluded from model estimations, yielding a new sample size of 278 observations across 67 counties. Second, we use both simple imputation techniques and external data sources to deal with the missing data occurring among independent measures. For countries whose data are completely missing from the World Bank databases, we rely on statistics from each country’s Bureau of Statistics. More commonly, countries only lack data for certain years. We use a simple heuristic imputation to fill in year-missing data by calculating the mean of neighboring years.

4. Results

4.1. Descriptive Statistics

To understand the baseline inequality in course-taking, we first descriptively examine the country-to-country differences in inequality in Opportunity to Learn, including the variance of school-mean math and science Curricular Experience (CE) and the country-mean of average pairwise differences in school-mean MCE and SCE. Using TIMSS 2019 math as an example, we highlight descriptive features of student course-taking. Figure 5 reports the average pairwise differences in school-mean MCE and SCE, respectively, for the 2019 cohort. Among 39 sampled countries and regions from TIMSS 2019, Malaysia, France, Singapore, and Hong Kong have the lowest school-to-school differences in Math Opportunity to Learn with an approximately 10-percentage-point difference in school-mean percentage of high-level math topics learned between two randomly selected schools. Schools from Turkiye, Chile, England, and South Africa, on the other hand, have the highest school-to-school differences in Math Opportunity to Learn with approximately a 30-percentage-point difference in school-mean percentage of high-level math topics learned.2
To further examine the provision of math and science learning opportunities and inequality in OTL for each country, we plot country-mean OTL against inequality in OTL for the 2019 cohort as an example. In Figure 6, the vertical dashed line indicates the grand mean of inequality in Math OTL while the horizontal dashed line represents the grand mean of country-mean math learning opportunities. The mean level of OTL (y-axis) scales from 0 to 1, with 1 being the highest level of OTL provided. Inequality in OTL (x-axis) measures the extent to which OTL of each school deviates from the country mean, with a higher value being a greater inequality. Among all sampled countries in TIMSS 2019, Malaysia, Singapore, Hungary, Indonesia, Israel, and the US, on average, provide students with rich learning opportunities while maintaining relatively low levels of inequality in school-mean Math OTL. France, Iran, Lithuania, and Finland maintain a low level of inequality in OTL, but their mean Math OTL provided is below average. Note that no sampled country has high- or low-level country-mean Math OTL while exhibiting extremely great inequality in OTL. England, Armenia, and South Africa, to name a few, provide above-average Math OTL, but exhibit a moderate-to-high level of inequality in Math OTL.

4.2. Model Estimation Results

Table 2, Table 3, Table 4 and Table 5 report the model estimation results concerning country-level inequality in Math and Science Opportunity to Learn, using Generalized Multilevel Linear Models and population-average models with GEE approaches. Table 2 and Table 3 report generalized multilevel models exploring the sources of variation in Math and Science Curriculum Experiences (MCE and SCE), respectively, with the Gamma distribution and logarithmic transformation, using (1) country internal-development factors, (2) basic measures of social inequality, (3) school-to-school differences in average school readiness, and (4) country-level education policies concerning both stratification and standardization. Table 4 and Table 5 then report results from population-average models, which serve as robustness checks in later analysis.

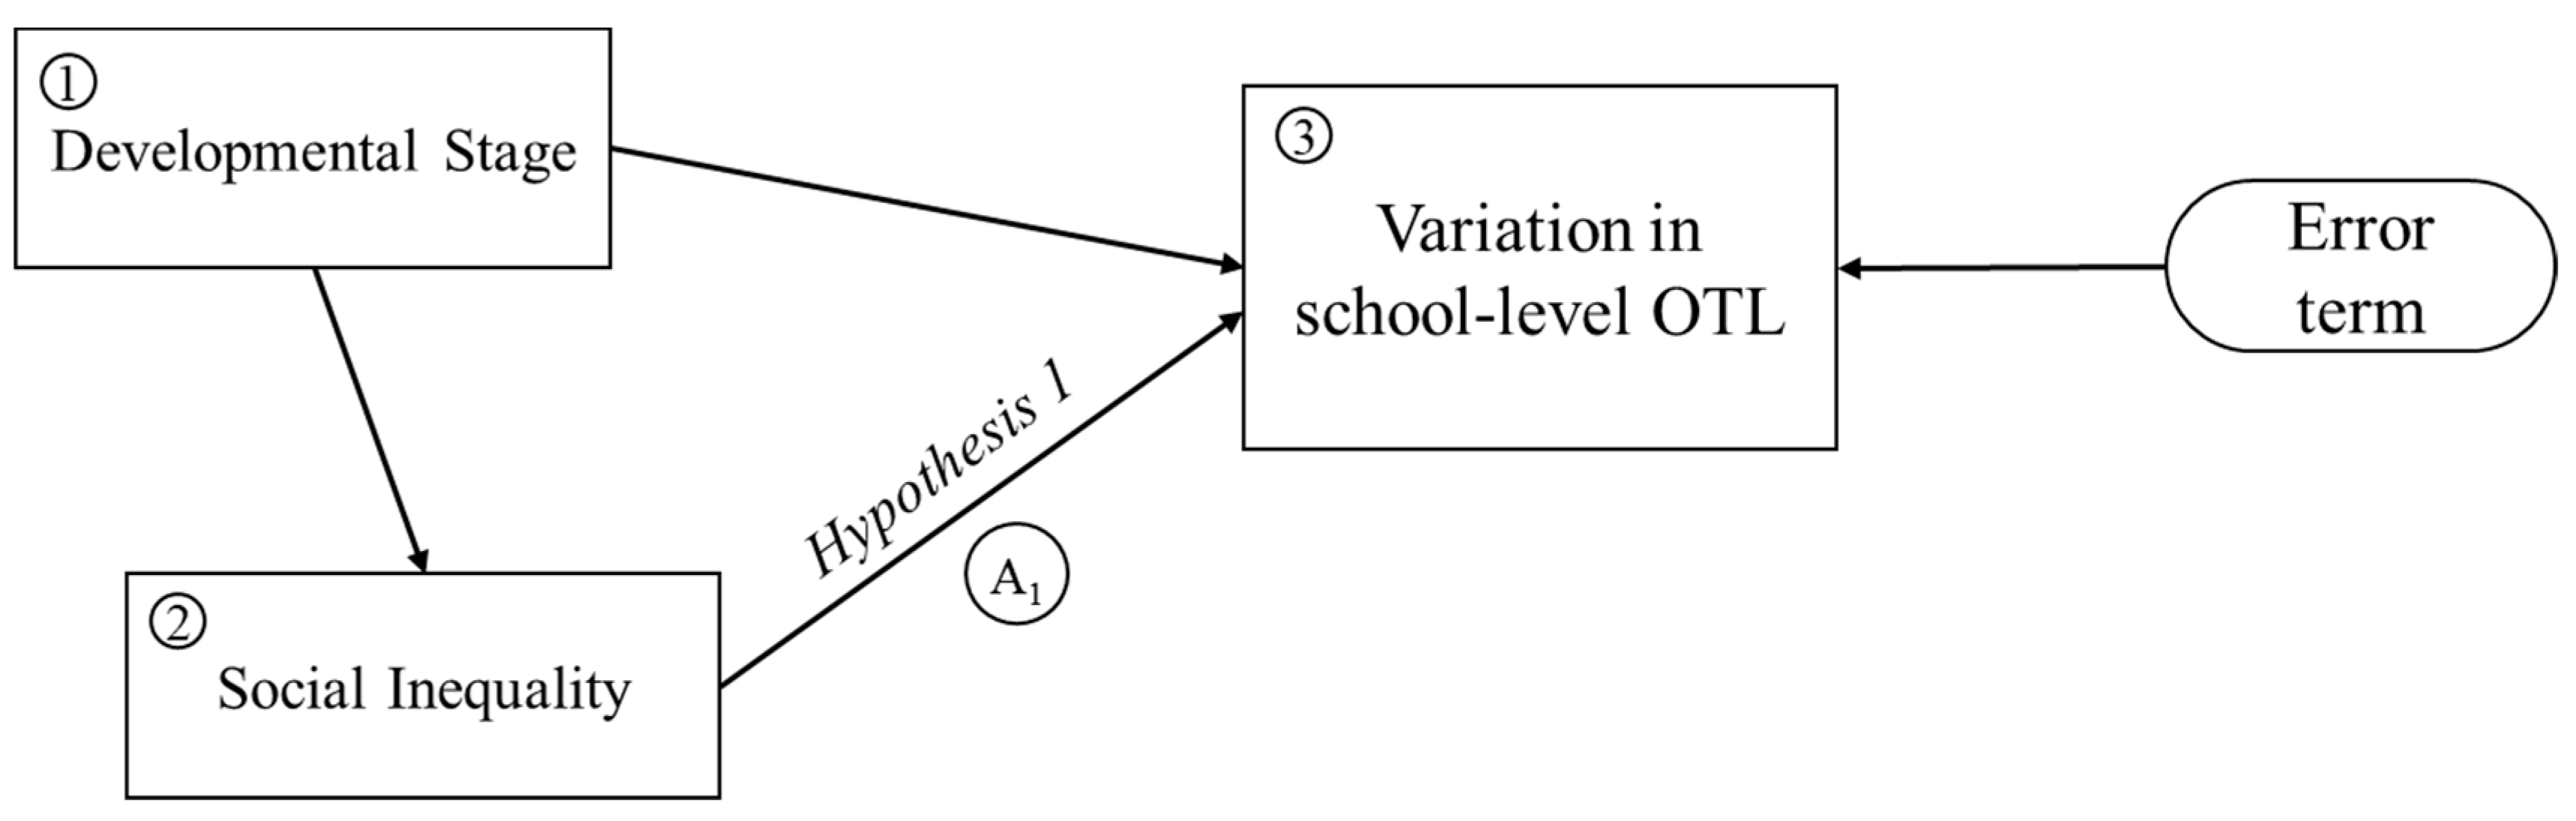
4.2.1. Hypothesis 1: The Role of Social Inequality in Generating Educational Inequality

Hypothesis 1 considers the intra-relationships among (1) a country’s internal-development factors, (2) basic social inequalities, and (3) inequality in learning opportunities. In the baseline conceptual model depicted in Figure 1, a country’s developmental stage generates variation in basic social inequality, and social inequality in turn generates the inequality in Opportunity to Learn. After considering the effect of internal-development factors on social inequality (the evolution of social inequality), Hypothesis 1 states that the level of inequality in OTL should be responsive to basic forms of social inequality (Path A1 in Figure 1).
Models 2 and 3 from Table 2 and Table 3 explicitly address this hypothesis. Model 2 examines the extent to which variation in inequality in OTL might be explained solely by basic social inequality, including urban/rural duality and income inequality, whereas Models 3 further considers all internal-development factors that are in the model. As shown in Table 2, Model 2, among two key elements of basic social inequality, urban/rural duality is positively associated with the variance of school-mean MCE, whereas the partial effect of income inequality beyond urban/rural duality is not significant. Further in Model 3, we show that after considering internal-development factors, urban/rural duality remains positively associated with the variance of school-mean MCE, supporting the hypothesis that the level of inequality in OTL may be responsive to the basic social inequality, net of a country’s development stage. Concerning the effect size in this baseline framework (Figure 1), Model 3, Row 6 indicates the raw coefficient of this relationship (0.140). To revert the coefficient back from logarithmic transformation, we carry out an exponential transformation. The calculation results indicate that a one standard deviation increase in urban/rural duality is related to a 15% increase in the variation in school-mean MCE ( e 0.140 1 = 15.02 % ), without considering the joint effect carried through income inequality. It is worthwhile to note that Model 3 also shows some direct effects of developmental stage on the level of inequality in OTL (Figure 1, Box 1 to Box 3). For example, the development of the non-agricultural sector and population increase are both positively associated with the level of inequality in OTL, while the expansion of tertiary education helps reduce the inequality in Math OTL.
Table 2. Multilevel Models: Country variance of school-mean Mathematics Curriculum Experience (MCE) as a function of internal development, social inequality, functionalism, and educational policy. (Country-level covariates includes inequality in school resources, teacher quality, and geographic regions; n = 278).
Model 1 Model 2Model 3 Model 4Model 5
Year−0.001
(0.009) a
−0.003
(0.008)
−0.006
(0.012)
−0.015
(0.011)
0.006
(0.013)
Construct 1: Developmental Stages
1. Labor shift from agricultural sector (%) −0.005
(0.004)
−0.005
(0.004)
0.002
(0.008)
2. Size of non-agricultural sector (%) 0.011
(0.006) ~
0.017
(0.008) *
0.069
(0.019) **
3. Natural population increase rate (per 1000 people) 0.011
(0.004) **
0.016
(0.005) **
0.007
(0.005)
4. Tertiary education enrollment rate (%) −0.048
(0.013) **
−0.033
(0.012) *
−0.110
(0.030) **
5. GDP per capita (unit: 1000 US$) 0.001
(0.001)
0.002
(001) *
0.002
(0.001) ~
Construct 2: Social Inequality Measures
6. Index of inequality of rural population distribution (Standardized) 0.028
(0.007) **
0.140
(0.068) *
0.177
(0.078) *
0.110
(0.034) **
7. Income GINI coefficient 0.005
(0.023)
0.020
(0.023)
0.033
(0.022)
0.007
(0.022)
8. GINI Square −0.000
(0.000)
−0.000
(0.000)
−0.000
(0.000)
−0.000
(0.000)
Construct 3: Functionalism
9. School-to-school differences in prior math achievement (standard deviation) 0.092
(0.017) ***
0.101
(0.022) ***
Construct 4: Educational Policy
10. Academic-based promotion policies 0.031
(0.059)
11. Promotion × inequality of rural population distribution −0.013
(0.058)
12. Within-school sorting policies −0.033
(0.016) *
13. Sorting × inequality of rural population distribution 0.156
(0.044) **
14. High-stakes exam before 8th grade 0.132
(0.112)
15. High-stakes exam × inequality of rural population distribution −0.058
(0.033) ~
Country-level covariatesNoNoYesYesYes
σ ϵ 2 0.0160.0150.0140.0120.012
σ μ 2 0.0150.0110.0100.0070.007
a Robust standard errors in parentheses. *** p < 0.001, ** p < 0.01, * p < 0.05, ~ p < 0.1.
Table 3, Models 2 and 3 examine inequality in Science OTL using the same model specification. Interestingly, Model 2 fails to reveal a basic association between social inequality and between-school variation in science OTL. Yet, after considering all internal-development factors in Model 3, a positive association between urban/rural duality and the science DV emerges, providing some evidence that a country’s level of inequality in STEM Opportunity to Learn is in fact responsive to basic social inequality, net of the evolution of social inequality due to development.
Table 3. Multilevel Models: Country variance of school-mean Science Curriculum Experience (SCE) as a function of internal development, social inequality, functionalism, and educational policy. (Country-level covariates includes inequality in school resources, teacher quality, and geographic regions; n = 278).
Model 1 Model 2Model 3 Model 4Model 5
Year0.000
(0.001) a
−0.002
(0.011)
−0.008
(0.012)
−0.007
(0.013)
−0.000
(0.016)
 
Construct 1: Developmental Stages
1. Labor shift from agricultural sector (%) −0.002
(0.006)
−0.002
(0.006)
0.003
(0.009)
 
2. Size of non-agricultural sector (%) −0.016
(0.019)
−0.016
(0.018)
−0.017
(0.017)
 
3. Natural population increase rate (per 1000 people) 0.008
(0.004) *
0.018
(0.008) *
0.012
(0.004) **
 
4. Tertiary education enrollment rate (%) 0.012
(0.012)
0.001
(0.001)
0.002
(0.002)
 
5. GDP per capita (unit: 1000 US$) 0.000
(0.001)
0.006
(0.002) *
0.001
(0.001)
 
Construct 2: Social Inequality Measures
6. Index of inequality of rural population distribution (Standardized) 0.009
(0.006)
0.085
(0.028) **
0.088
(0.038) *
0.104
(0.063) ~
 
7. Income GINI coefficient 0.012
(0.015)
0.022
(0.020)
0.022
(0.021)
0.007
(0.011)
 
8. GINI Square −0.000
(0.000)
−0.000
(0.000)
−0.000
(0.000)
−0.000
(0.000)
 
Construct 3: Functionalism
9. School-to-school differences in prior science achievement (standard deviation) 0.053
(0.021) *
0.052
(0.025) *
 
Construct 4: Educational Policy
10. Academic-based promotion policies 0.038
(0.064)
 
11. Promotion × inequality of rural population distribution −0.015
(0.012)
 
12. Within-school sorting policies −0.007
(0.012)
 
13. Sorting × inequality of rural population distribution −0.094
(0.087)
 
14. High-stakes exam before 8th grade 0.043
(0.055)
 
15. High-stakes exam × inequality of rural population distribution −0.038
(0.031)
 
Country-level covariatesNoNoYesYesYes
 
σ ϵ 2 0.0210.0210.0210.0210.016
σ μ 2 0.0070.0050.0050.0020.001
a Robust standard errors in parentheses. *** p < 0.001, ** p < 0.01, * p < 0.05, ~ p < 0.1.

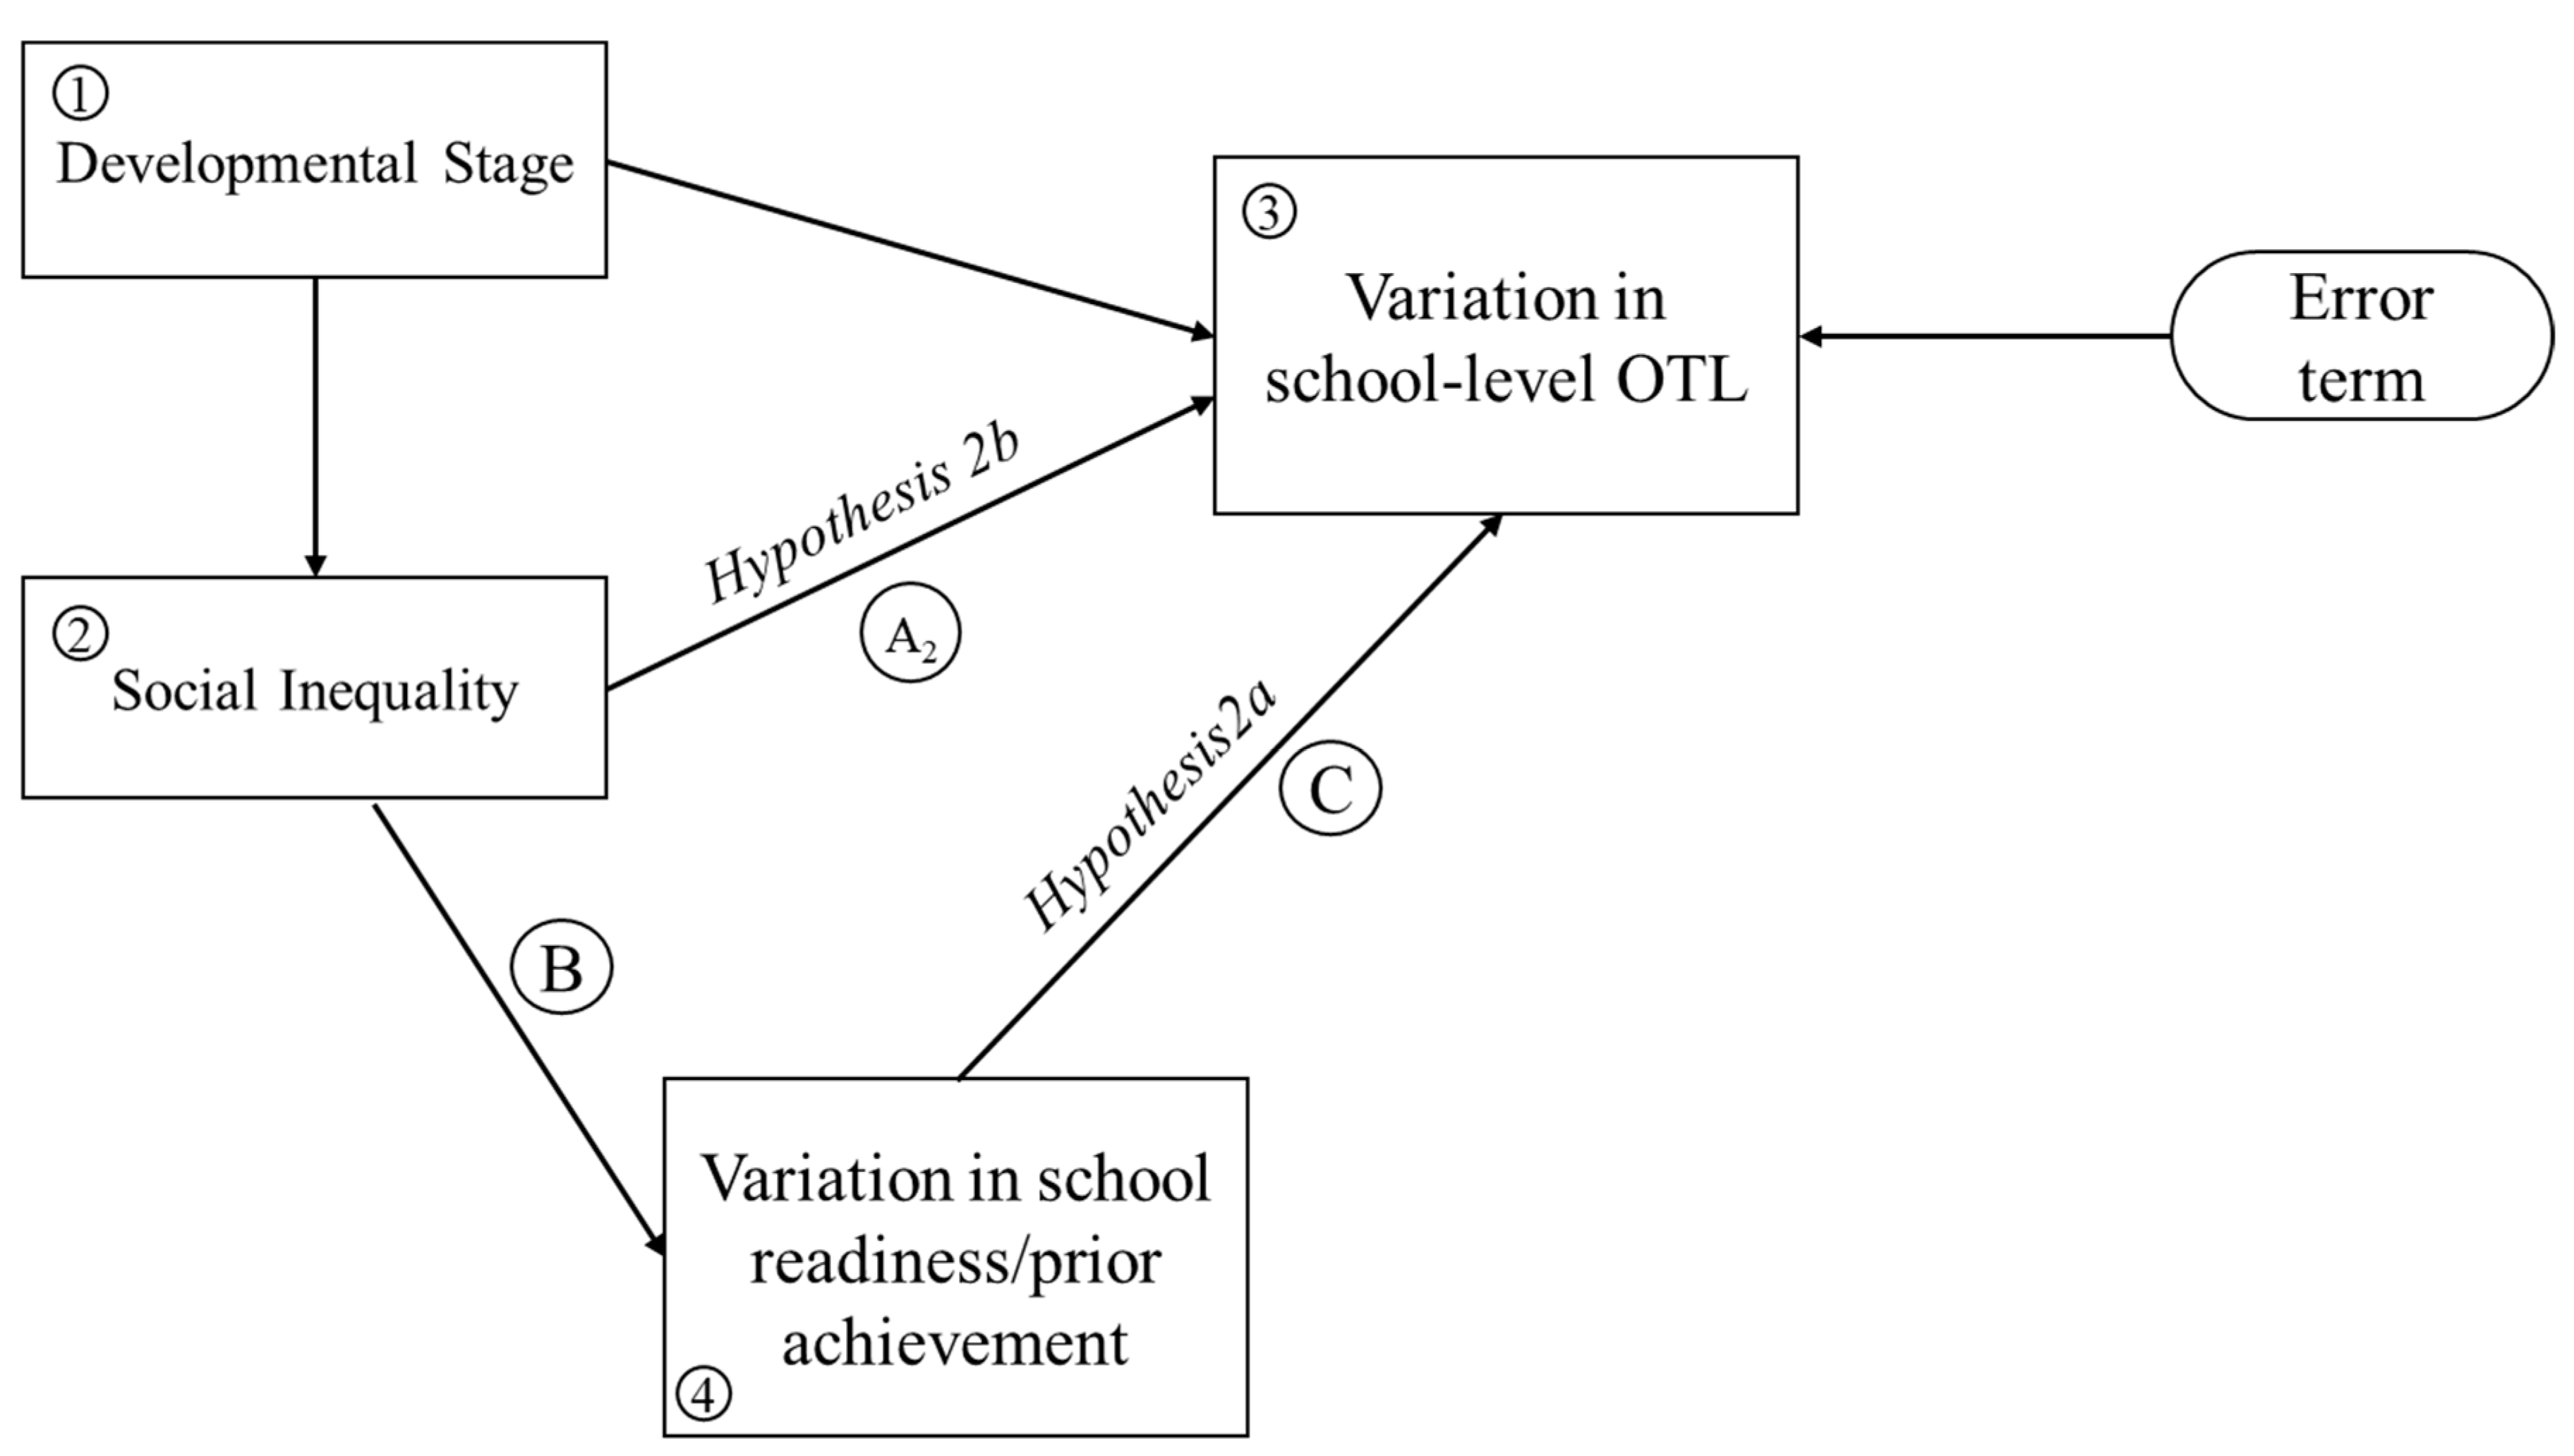
4.2.2. Hypothesis 2: Functional Sources of School-to-School Differences in OTL: Variation in School Readiness

Following the empirical work by Kelly and Price (2011), we argue that Path A1 in Figure 1 likely captures, in an ambiguous way, both technical-functional and conflict sources of variation in curriculum differentiation. Therefore, now considering variation in school readiness/prior achievement in Box 4, Hypothesis 2 states that Path C reveals the extent to which between-school variation in OTL reflects technical-functional considerations. If, however, after controlling for this functional pathway, we still observe significant relationships between social inequality and variation in school-level Opportunity to Learn, path A2 can now be more clearly characterized as reflecting conflict processes.
Model 4 from Table 2 and Table 3 explicitly addresses this empirical consideration by adding a key functional determinant of tracking, school-to-school differences in prior achievement, to Model 3. As shown in Table 2, Model 4, school-to-school differences in prior math achievement is positively associated with the variance of school-mean MCE, supporting a technical-functional explanation for school-to-school differences in learning opportunities. Concerning the effect size, a one standard deviation increase in school-to-school differences in prior math achievement is related to a 9.6% increase in the school-to-school difference in Math OTL (Table 2, Model 4, Row 9, e .0920 1 = 9.60 % ). Yet, beyond this basic functional mechanism, Model 4 still shows a positive association between the basic social inequality in a country and variation in Math OTL, indicating conflict forces likely motivate between-school curriculum tracking to some extent. While weaker in effect size, Table 3, Model 4 also shows a positive association between measured achievement and inequality in Science OTL. Again, a relationship remains between social inequality and inequality in OTL, after considering the key functional factor of achievement. Overall, both math and science results provide evidence that between-school tracking is motivated by both technical-functional and conflict sources.

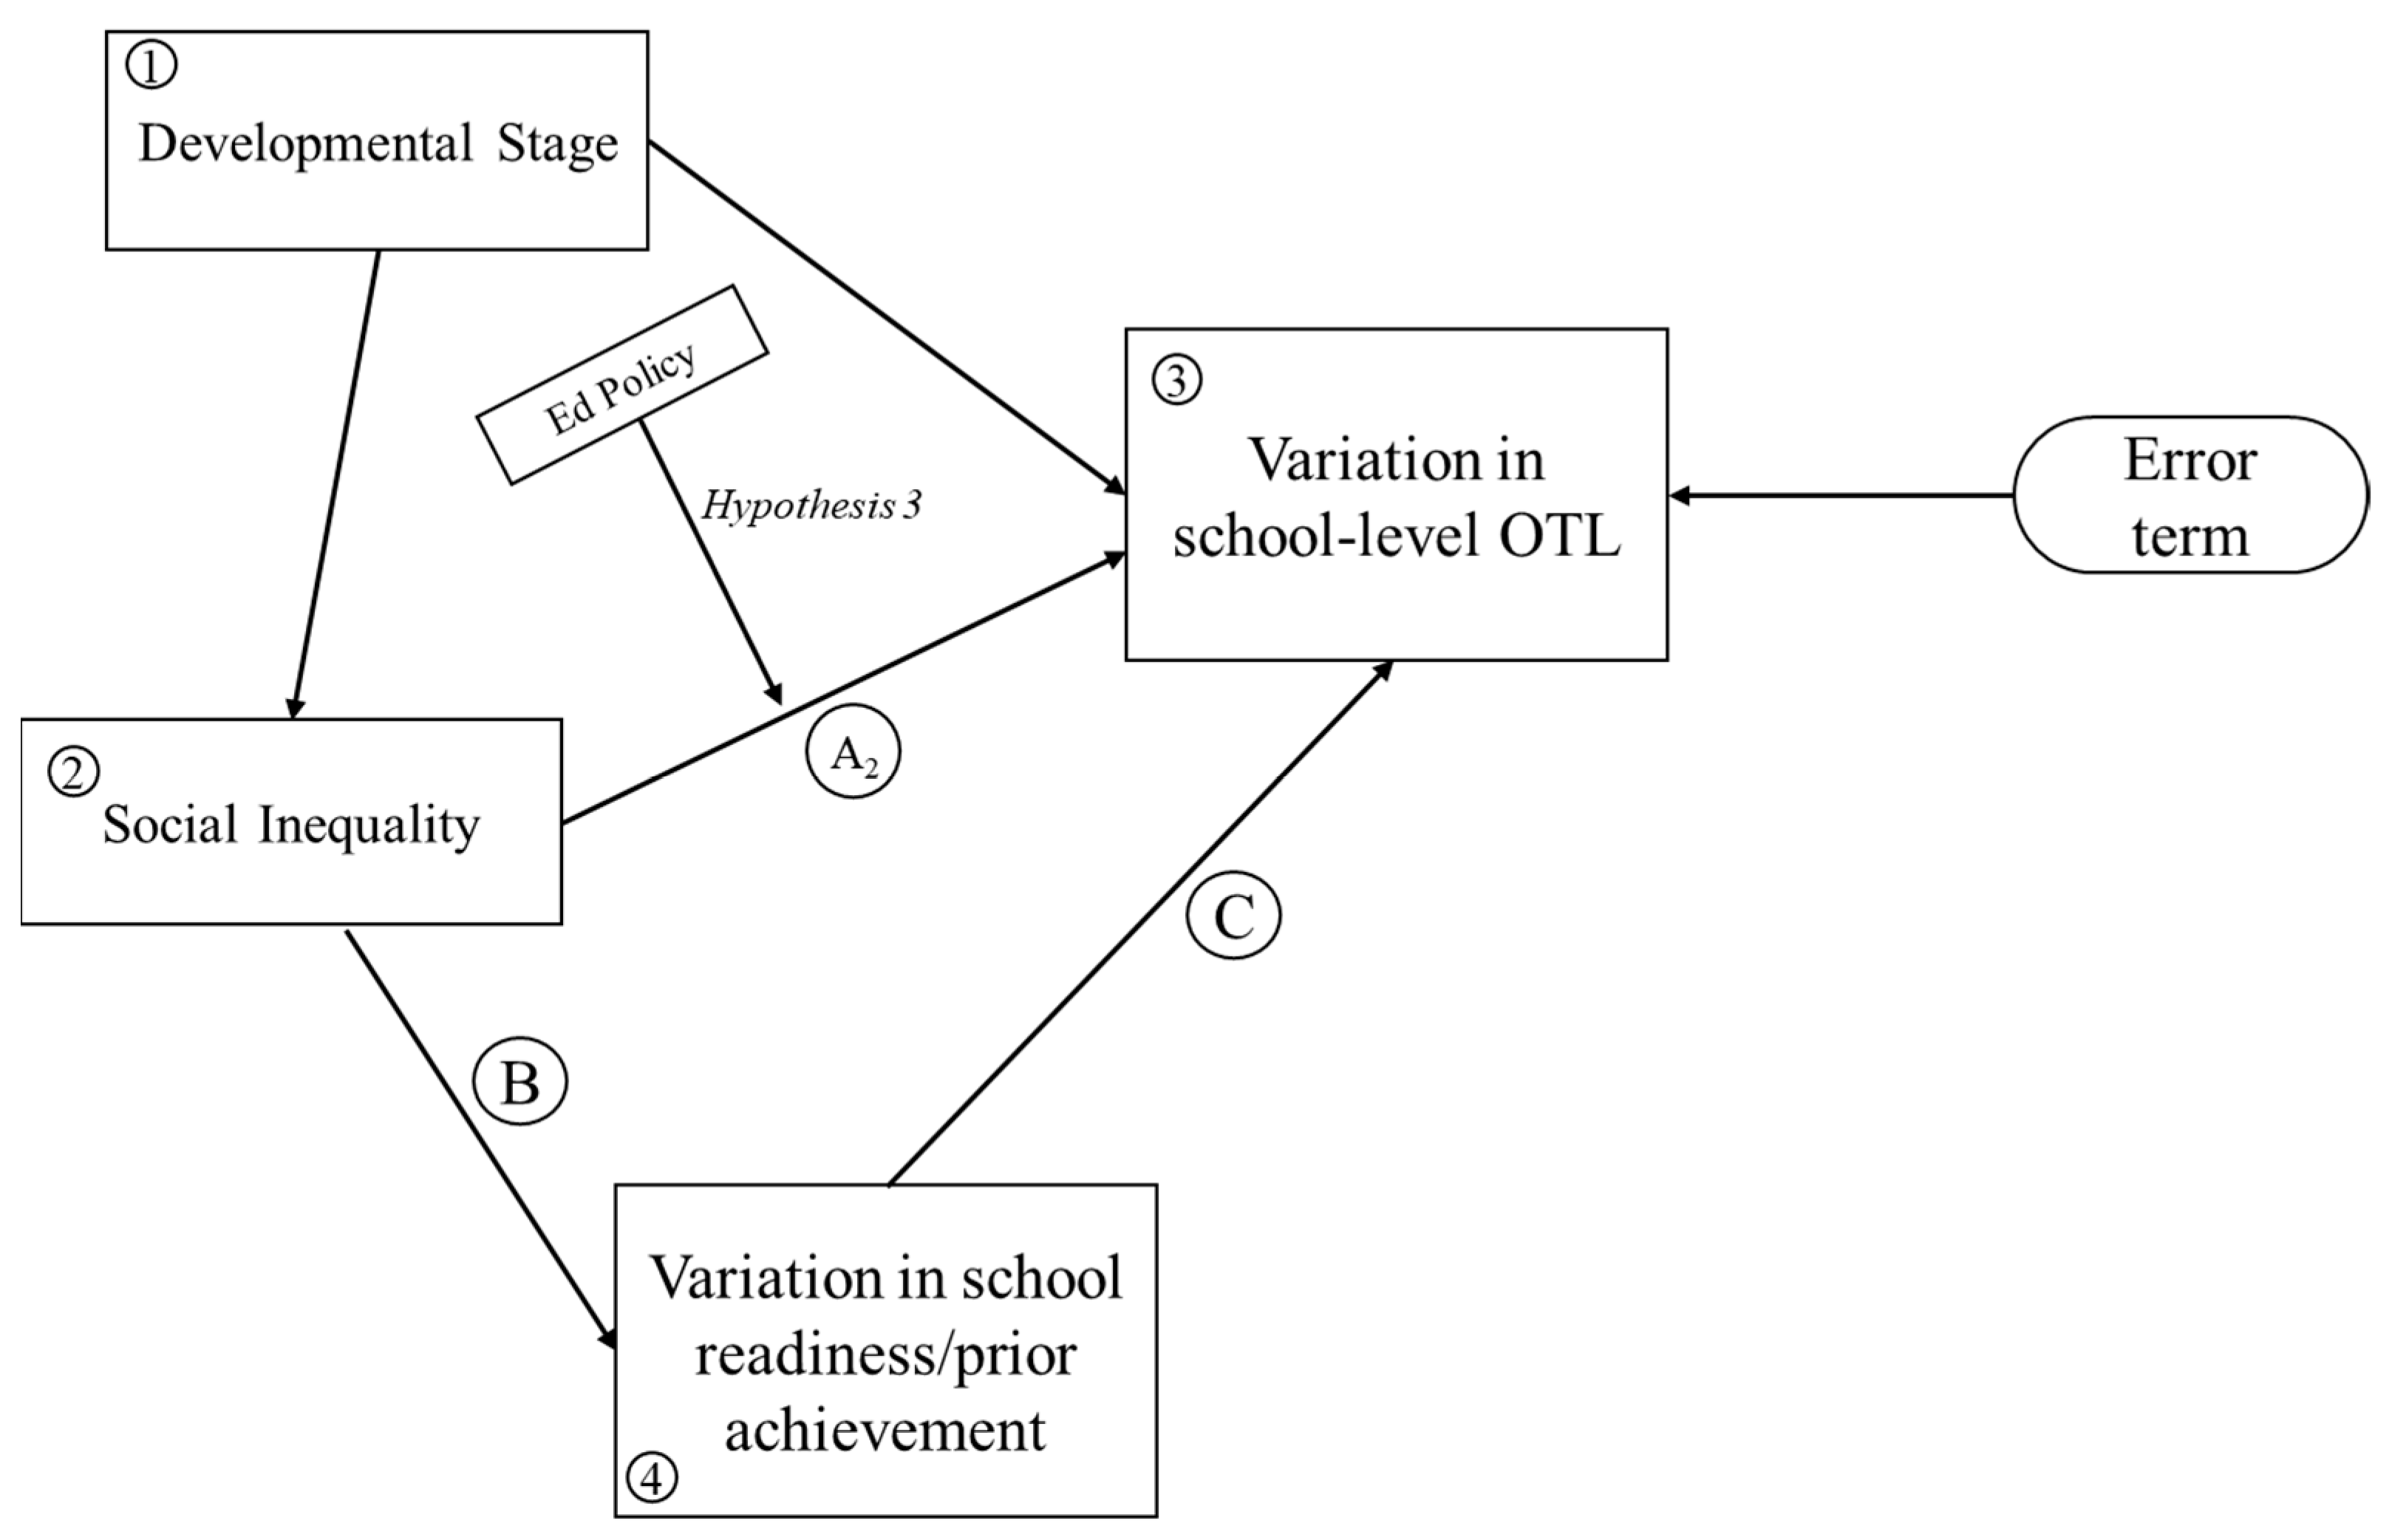
4.2.3. Hypothesis 3: Stratification and Standardization Policies as Moderator

Lastly, we explore potential moderation effects of major educational policies. Such moderation effects are often addressed in cross-national studies (e.g., Park 2008) that consider how various educational stratification and standardization policies impact the basic relationship between social inequality and educational inequality (Figure 3). In Figure 2, we disentangle the relationship between social inequality and inequality in OTL into a technical-functional pathway (Path C) and a conflict pathway (Path A2), testing moderation effects after conflict forces are more narrowly identified. Model 5 from Table 2 and Table 3 explore Hypothesis 3 by adding the interaction terms between social inequality and dummy indicators of educational policies. As shown in Table 2, Model 5, the interaction term between urban/rural duality and the dummy indicator of national policy using student achievement to sort students before the end of 8th grade is positively associated with the variance of school-mean MCE, indicating an exacerbation effect of stratification policies on the relationship between social inequality and educational inequality. In particular, the effect of urban/rural duality on the variation in school-mean MCD among countries with national-level within-school sorting policies are 16.9% (Table 2, Model 5, Row 13, e .156 1 = 16.9 % ) higher than the effects among countries without such policies. On the other hand, the interaction term between urban/rural duality and the dummy indicator for use of national examinations has a significant negative effect on the dependent variable, indicating an attenuation effect of country-level standardization policy on the relationship between urban/rural duality and the variation in STEM OTL. Referencing model-based calculations, a country with high-stakes examinations, on average, has a 5.6% decrease in the effect of urban/rural duality on the variation in Math OTL compared to a country without high-stakes exams. The interaction terms between these policies and social inequality, however, shows no moderation effect on the Science DV. It’s worthwhile to note that the measurement of educational policy in this analysis relies on country-level curriculum questionnaires, even as policy implementation may vary within countries in important ways. Therefore, the analysis in this subsection is influenced by that measurement error.

4.3. Robustness Analysis

In this analysis, we consider two sets of robustness analysis to support the main analysis. First, to support the estimations of important country-to-country differences in the variation in STEM OTL, we explicitly model the country-specific effect of country-level composition by running a series of population-average models with GEE estimators. Population-average models explore average country-level effects with the assumption that the country-level independent variables have constant effects on dependent variables across years. Table 4, Models 1 and 2 summarize the population-average model estimation of the variation in school-mean MCE and SCE, respectively, using the full model specification in Table 2 and Table 3. In general, population-average model estimation results are similar to the results from multilevel modeling. First, in supporting Hypothesis 1, we find positive associations between urban/rural duality and the variance of school-mean MCE and SCE, net of internal-development factors. Considering Hypothesis 2, in this robustness analysis, we find evidence that supports both functionalism and conflict pathways of between-school curriculum tracking in this cross-national setting. Finally, we find that education policies concerning early sorting and high-stakes examination appear to moderate the associations between school-to-school differences and social inequality, net of a country’s development stage and functional pathways of tracking.
Table 4. Robustness Check Using Population Average Models: Country variance of school-mean Mathematics Curriculum Experience (MCE) and Science Curriculum Experience (SCE) as a function of internal development, social inequality, functionalism, and educational policy. (Country-level covariates includes inequality in school resources, teacher quality, and geographic regions; n = 67).
Model 1: Math CEModel 2: Science CE
Year0.005
(0.013) a
0.001
(0.001)
Construct 1: Developmental Stage
1. Labor shift from agricultural sector (%)0.005
(0.007)
0.003
(0.010)
2. Size of non-agricultural sector (%)0.084
(0.038) *
−0.006
(0.008)
3. Natural population increase rate (per 1000 people)0.007
(0.003) *
0.013
(0.004) **
4. Tertiary education enrollment rate (%)−0.131
(0.035) **
0.002
(0.001)
5. GDP per capita (unit: 1000 US$)0.002
(0.001) ~
0.001
(0.001)
Construct 2: Social Inequality Measures
6. Index of inequality of rural population distribution (Standardized)0.077
(0.028) **
0.139
(0.024) **
7. Income GINI coefficient0.015
(0.008) *
0.009
(0.012)
8. GINI Square −0.000
(0.000)
−0.000
(0.000)
Construct 3: Functionalism
9. School-to-school differences in prior math/science achievement (standard deviation)0.104
(0.022) ***
0.049
(0.023) *
Construct 4: Educational Policy
10. Academic-based promotion policies 0.026
(0.060)
0.034
(0.061)
11. Promotion × inequality of rural population distribution0.007
(0.005)
−0.005
(0.052)
12. Within-school sorting policies −0.067
(0.013) **
−0.026
(0.011) *
13. Sorting × inequality of rural population distribution0.117
(0.054) *
0.072
(0.074)
14. High-stakes exam before 8th grade−0.015
(0.044)
0.044
(0.052)
15. High-stakes exam × inequality of rural population distribution−0.059
(0.029) *
0.042
(0.047)
Country-level covariatesYesYes
a Robust standard errors in parentheses. *** p < 0.001, ** p < 0.01, * p < 0.05, ~ p < 0.1.
Second, we model an alternative dependent measure concerning the percentage of high-level Algebra topics learned (as opposed to all math topics) as a function of internal-development stages, social inequality, functionalism, and education policies. Table 5, Model 2 shows that the country-level variance of school-mean percentage of high-level Algebra topics learned is positively associated with both measures of social inequality (income inequality and urban/rural duality), net of a country’s development stage. Model 3 further examines Hypothesis 2 and supports that the alternative math DV is also positively related to both functional and conflict sources of between-school tracking. Concerning Hypothesis 3, this alternative analysis only supports the exacerbation effect of early-sorting policies on the relationship between social inequality and educational inequality.
Table 5. Robustness Check Using multilevel models: Alternative measures, country variance of school-mean percentage of high-level Algebra topics learned as a function of internal development, social inequality, functionalism, and educational policy. (Country-level covariates includes inequality in school resources, teacher quality, and geographic regions; n = 278).
Model 1Model 2Model 3Model 4
Year0.016
(0.011) a
0.015
(0.013)
0.007
(0.012)
0.012
(0.012)
Construct 1: Development Stage
1. Labor shift from agricultural sector (%) 0.006
(0.007)
0.005
(0.007)
0.006
(0.009)
2. Size of non-agricultural sector (%) 0.017
(0.008) *
0.017
(0.008) *
0.061
(0.018) **
3. Natural population increase rate (per 1000 people) 0.016
(0.004) ***
0.016
(0.005) **
0.009
(0.005) ~
4. Tertiary education enrollment rate (%) −0.033
(0.015) *
−0.020
(0.008) *
−0.080
(0.016) ***
5. GDP per capita (unit: 1000 US$) 0.001
(0.001)
0.002
(0.001) ~
0.004
(0.001) **
Construct 2: Social Inequality Measures
6. Index of inequality of rural population distribution (Standardized)0.011
(0.013)
0.040
(0.013) *
0.081
(0.041) *
0.111
(0.049) *
7. Income GINI coefficient0.012
(0.008)
0.038
(0.013) *
0.032
(0.015) *
0.024
(0.026)
8. GINI Square −0.000
(0.000)
−0.000
(0.000)
−0.000
(0.000)
−0.000
(0.000)
Construct 3: Functionalism
9. School-to-school differences in prior math achievement (standard deviation) 0.079
(0.028) **
0.103
(0.034) **
Construct 4: Educational Policy
10. Academic-based promotion policies 0.083
(0.066)
11. Promotion × inequality of rural population distribution −0.024
(0.064)
12. Within-school sorting policies 0.138
(0.168)
13. Sorting × inequality of rural population distribution 0.209
(0.102) *
14. High-stakes exam before 8th grade 0.082
(0.059)
15. High-stakes exam × inequality of rural population distribution −0.030
(0.027)
Country-level CovariatesNoYesYesYes
a Robust standard errors in parentheses. *** p < 0.001, ** p < 0.01, * p < 0.05, ~ p < 0.1.

5. Discussion and Limitations

5.1. Discussion

Drawing on basic theoretical perspectives on social inequality and educational stratification, this paper proposes a conceptual framework that helps trace the fundamental sources of educational inequality. The framework pairs traditional developmental theories of the evolution of inequality within and between countries with social theories of curriculum tracking.
Hypothesis 1 concerns the association between basic social inequality and inequality in Opportunity to Learn between schools. The internal-development framework describes the way in which the pattern of basic social inequality (i.e., unequal distribution of income and population) evolves as a country develops, providing a foundation for more meaningful comparisons of school systems across countries. Our analysis reveals that the distribution of learning opportunities at the country level is highly responsive to basic social inequality, even after considering the generative effect of internal development on basic social inequality. Specifically, this analysis explores two different forms of basic social inequality: income inequality and urban/rural duality. The main model estimation results reported in Table 2 and Table 3 indicate that urban/rural duality is a particularly important form of social inequality, with a significant positive partial association with inequality in Opportunity to Learn. Later in ancillary models reported in Table 5, we find that both forms of social inequality are significantly associated with inequality in math (mainly concerning Algebra topic levels) Opportunity to Learn.
Beyond that basic relationship, a key goal of this study was to interrogate social theories of curriculum tracking including the fundamental technical-functional logic of tracking and conflict forces that are related to maintaining and producing more differentiated course-taking experiences. Theories of tracking help unpack the link between social inequality and inequality in learning opportunities, which is open to multiple interpretations. Secondary school curriculum systems may be purposefully designed, in a functional way, to respond to an unequal distribution of school readiness. Then again, school tracking systems may nevertheless be influenced by conflict forces, favoring high-SES and other advantaged social groups.
Consistent with Hypothesis 2a, we find a strong positive association between the mean level of prior academic readiness in a school and school-mean Math and Science Opportunity to Learn, which supports a technical-functional explanation for between-school tracking. Concerning the effect size of this relationship, recall that a one-standard-deviation increase in school-to-school differences in prior math achievement is related to nearly a 10% increase in school-to-school differences in Opportunity to Learn. However, this study also finds a positive association between social inequality and school-to-school differences in Opportunity to Learn, even after considering the unequal distribution of school readiness. This result implies a set of conflict forces also affect educational inequality cross-nationally.
Do differences in educational standardization and stratification policies at the country level moderate the conflict-related sources of school-to-school differences in OTL? While limited by data quality, we find some evidence that policies concerning stratification, in the form of promoting early sorting, exacerbate the association between social inequality and inequality in OTL. Early sorting policies use students’ measured achievement to determine school placements. Because students’ school readiness is so tied to their family background, promoting early sorting based on academic achievement will exacerbate the role of family background in determining school placements. On the other hand, we find that standardization, in the form of high-stakes examinations, attenuates the strong link between social inequality and inequality in OTL. High-stakes examinations are used in many Asian countries, where country/province/state-level prescribed curriculum standards are in place. Standardized testing policies may push schools to implement a similar curricular system, regardless of students’ average readiness (and in turn, by family background).
Our findings resonate with the 4th United Nations’ Sustainable Development Goal (SDG) concerning inclusive and equitable education for all. This Sustainable Development Goal primarily focuses on ensuring that all children complete a free, equitable, and quality primary and secondary education, with the extended target of eliminating educational inequality due to between-group disparities (e.g., rural/urban and bottom/top wealth disparities, see also UN-SDG, Target 4.1 and 4.4). As documented by the United Nations (n.d.), in 2019, only one third of and one sixth of countries or territories achieved urban/rural and bottom/top wealth parity in primary school completion, respectively. Regarding post-secondary enrollment, virtually no countries or territories achieved rural/urban and wealth parity. This analysis contributes to the examination of educational inequality globally by creating measures of and exploring inequality in Opportunity to Learn, an important component of education inequality. In particular, this analysis argues that the valuable STEM learning opportunities still disproportionately benefit students with advantaged backgrounds. This conclusion holds even after explicitly considering the developmental stage, and the most basic functional sources of variation in school curriculum.
Concerning the effect size of the coefficient, we should emphasize that all coefficients are interpreted as percentage changes in OTL inequality. To give readers a quick comparison, a 100% difference in inequality indicates that a country’s educational OTL inequality was either doubled or reduced by half within 2 decades, which would be a huge change at the country level. In fact, we assert that such a large (say decline) in OTL inequality would require structural and systematic changes in the curricular/education system of a country of the kind found in a country rapidly transitioning to developed status (e.g., massive changes in the basic rate of schooling, etc.). Thus, we argue that relatively small percentage differences in inequality presented in the current study (e.g., a 10% difference) indicate a substantial difference from a single predictor that helps trace the fundamental sources of the inequality. To offer a benchmark for comparison, consider the results from a longitudinal study in the United States throughout the 20th century done by Long et al. (2012). According to this study, for example, from the 1910–1919 cohort to the 1970–1979 cohort, the black-white differences in years of education attained were reduced by 61.7%; approximately 10% per decade.

5.2. Limitations and Future Work

To add caution in interpreting these findings, we should note that the results are derived from a cross-national sample and all interpretations are based on that country-level framework. For example, this analysis does not demonstrate the way in which individual schools create within-school between-classroom or even within-classroom curriculum differentiation. Further, even at the country level, with 278 country-year observations, the analysis is expansive but not fully comprehensive internationally. Considering the measures of Opportunity to Learn available in the TIMSS data, our dependent measures likely have greater measurement error compared to other commonly used measures of learning opportunities, such as transcript-based measures employed in within-country studies. In theory, the true effect size of the associations examined in this analysis may be larger, since measurement error in DVs will bias observed associations downward. Yet, we see some advantages of using our current measurement scheme. For example, if both School A and School B provide 8th grade Algebra but cover different Algebra content, the curricular topic list is able to capture this discrepancy. It’s also worth noting that, although we examine the moderation effects of policies, we would not advocate, on the basis of this analysis alone, that countries implement any single educational policy, such as high-stakes exams, solely in order to mitigate inequality in OTL.
Future research examining inequality in Opportunity to Learn should consider several avenues of improvement, including collecting more nuanced course-taking data, which would then form the basis for creating more reliable measurement schemes to describe students’ course-taking and instructional experiences. Future research that builds on the theoretical framework employed here might also examine educational attainment outcomes beyond course-taking, including post-secondary degree attainment. Future research that focuses on the Opportunity to Learn cross-nationally might also do so longitudinally, with attention to policy trends or changes over time. Doing so may require intensive data-collection efforts at the country-, state/province/district-, and school-level to measure curriculum design and implementation. In addition to curriculum data, to explicitly address educational inequity, such as the analysis of how advantaged students/families take advantage of the power structure and opportunities within educational systems, more data related to student family background and school-level contextual information might also be needed.
Overall, we hope that researchers will find the conceptual and empirical framework developed here useful in systematically understanding the relationships among country development, social inequality, and curriculum tracking in cross-national research settings. While inferentially limited by the available measures, this framework helps identify and conceptualize the technical-functional and conflict sources of between-school tracking, which are often less emphasized in cross-national studies.

Supplementary Materials

The following supporting information can be downloaded at: https://www.mdpi.com/article/10.3390/socsci13100499/s1, Table S1: 8th Grade Mathematics Topics Coding (TIMSS 2015, 2019), Table S2: 8th Grade science topics coding (TIMSS 2015, 2019), Table S3: 8th Grade Mathematics Topics Coding (TIMSS 2003, 2007, 2011), Table S4: 8th Grade science topics coding (TIMSS 2003, 2007, 2011), Table S5: 8th Grade Mathematics Topics Coding (TIMSS 1995, 1999), Table S6: 8th Grade science topics coding (TIMSS 1995, 1999).

Author Contributions

Conceptualization, S.K. and S.X.; methodology, S.X. and S.K.; software, S.X.; validation, S.X. and S.K.; formal analysis, S.X.; investigation, S.X.; resources, S.K.; writing—original draft preparation, S.X.; writing—review and editing, S.K. and S.X.; visualization, S.X.; supervision, S.K.; project administration, S.K. All authors have read and agreed to the published version of the manuscript.

Funding

This research received no external funding.

Institutional Review Board Statement

Not applicable.

Informed Consent Statement

Not applicable.

Data Availability Statement

This study utilizes publicly available data at https://timssandpirls.bc.edu (Accessed on 1 October 2022).

Acknowledgments

We thank Najeeb Shafiq and Rip Correnti from the University of Pittsburgh and Eric Grodsky from the University of Wisconsin-Madison for their helpful discussions and comments on the original dissertation projects that established this study. We also thank Chandralekha Singh from the University of Pittsburgh for her external expert review of our topic codes.

Conflicts of Interest

The authors declare no conflicts of interest.

Notes

1
In additional to cross-national analyses, this model has been applied to single-country analyses, such as studies using US data (e.g., Partridge 2005).
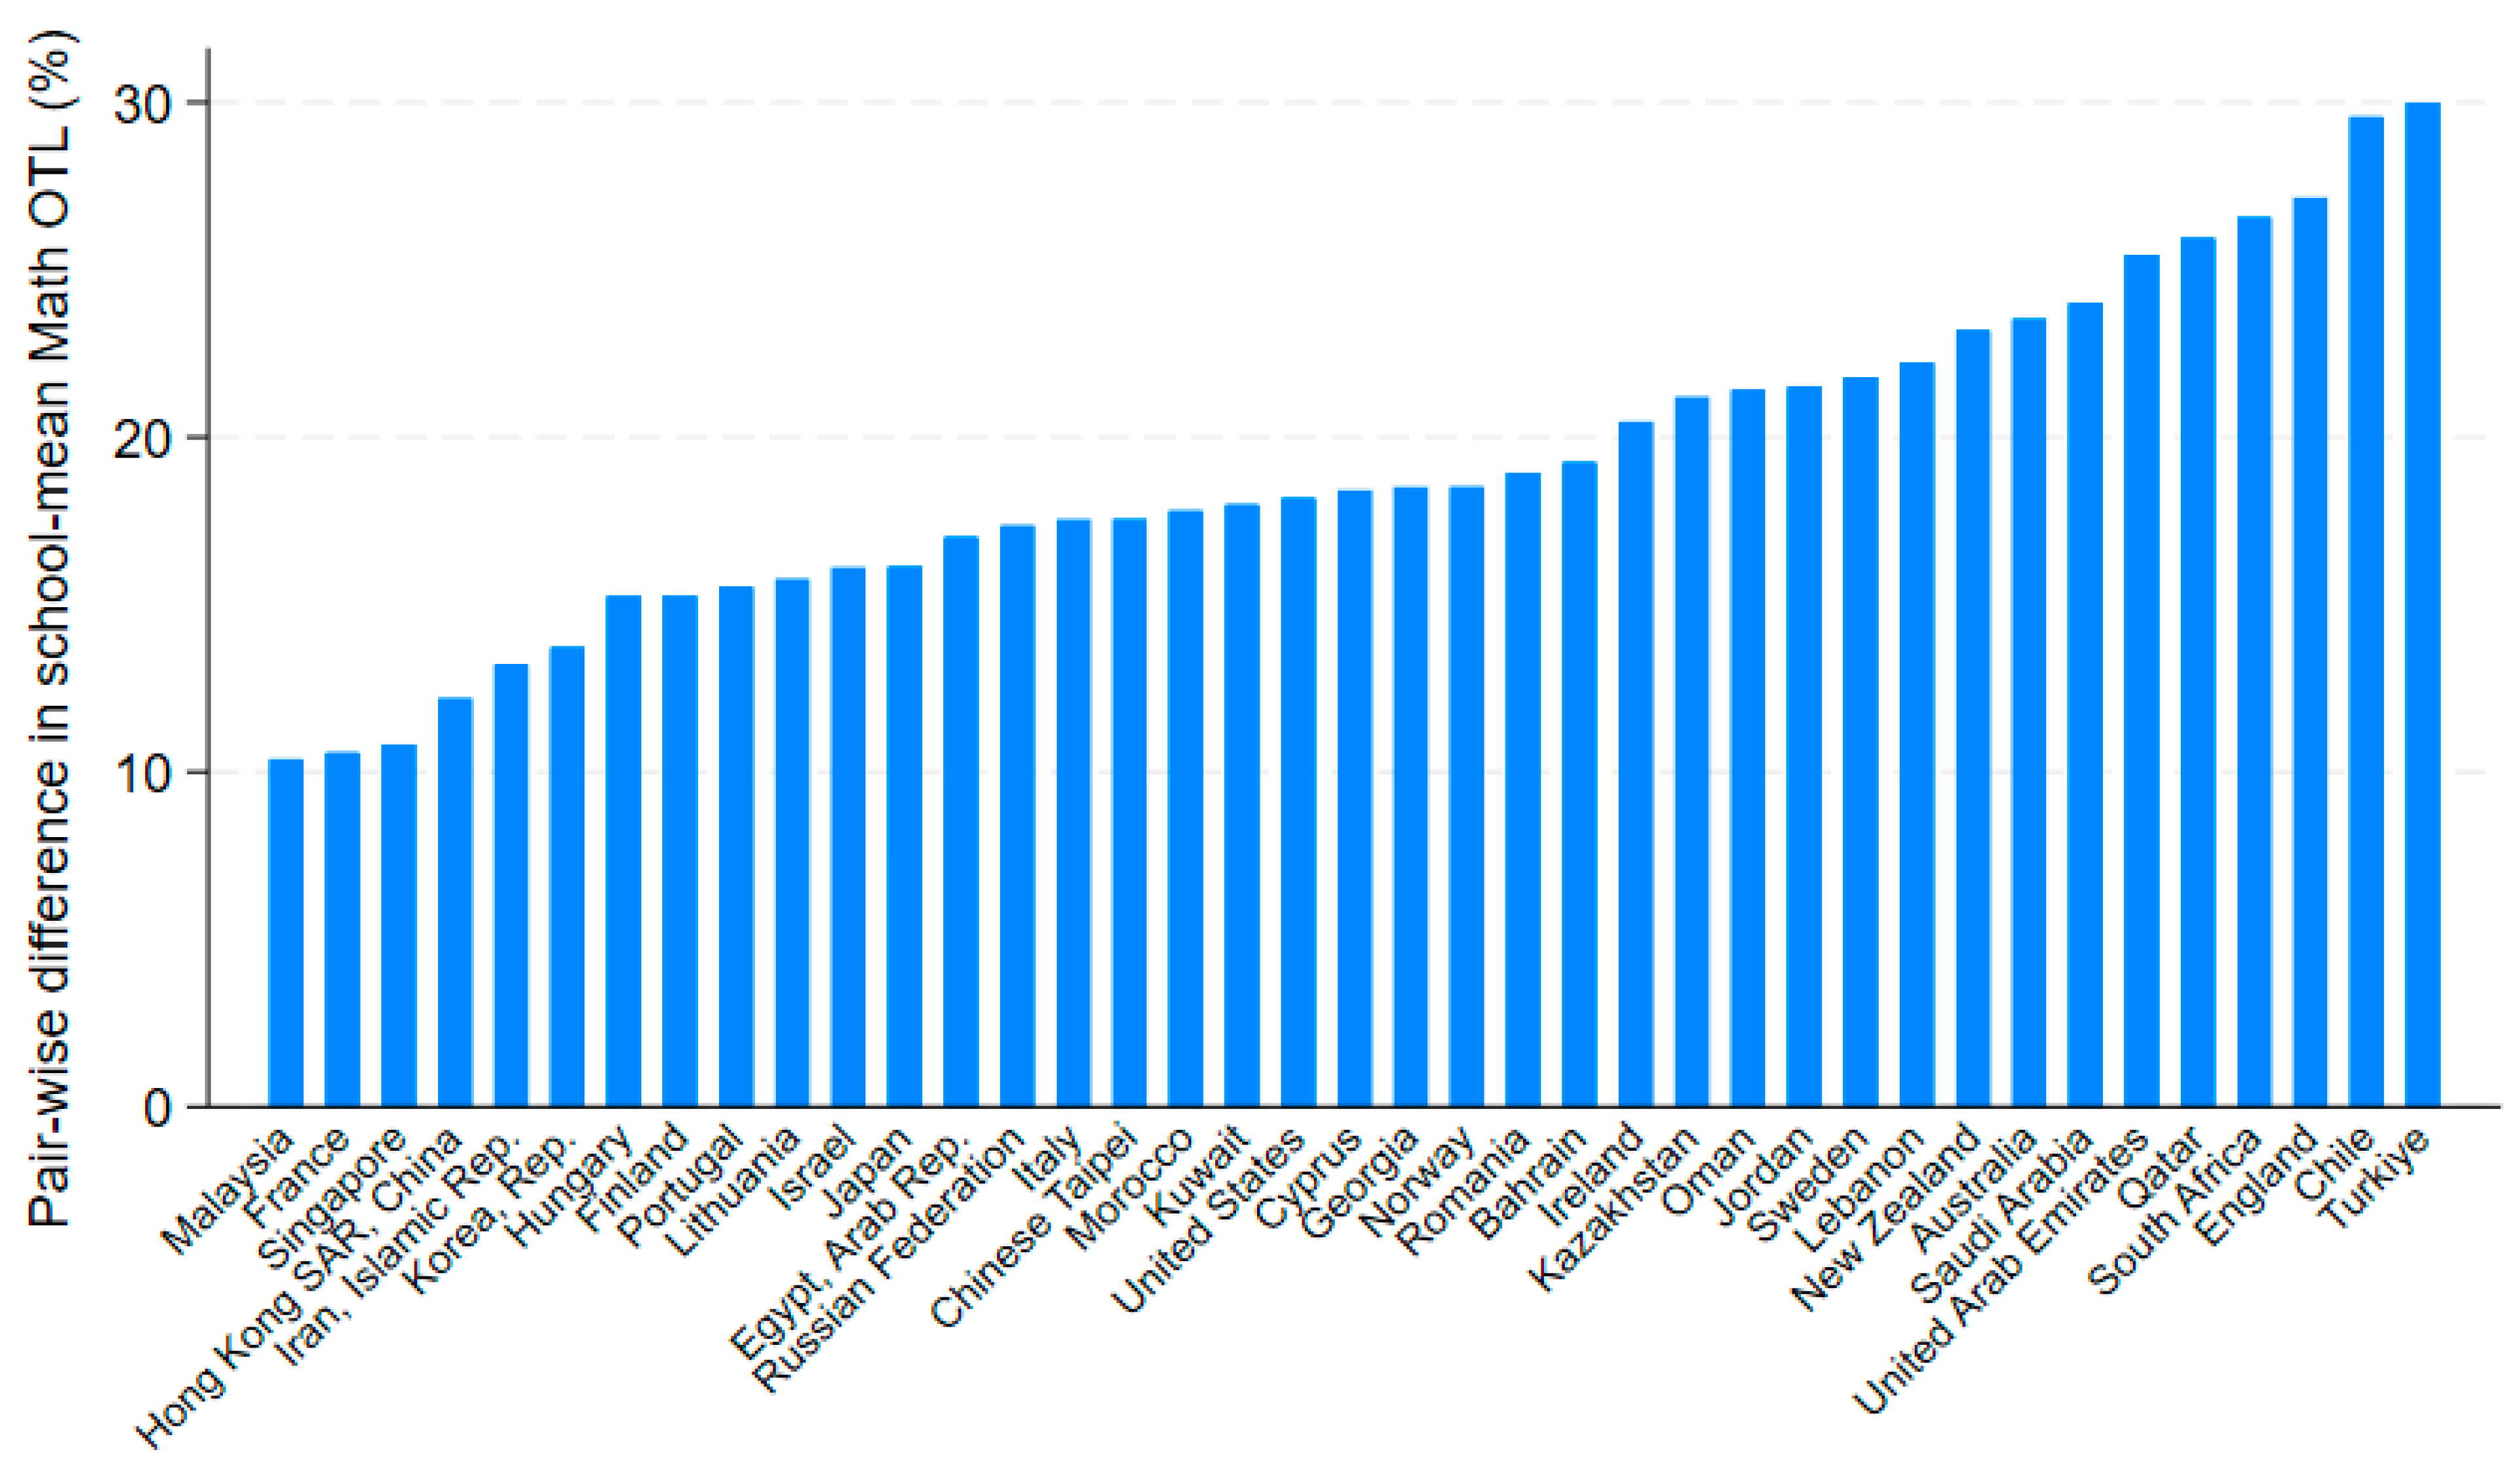
2
As a reference, the weighted grand-mean of school-mean percentage of high-level math topics learned across all sampled schools for the 2019 cohort is 60.2%. A 30-percentage-point difference in math CE between two random-selected schools is almost half of the grand-mean of school-mean MCE.

References

  1. Alderson, Arthur S., and François Nielsen. 1999. Income Inequality, Development, and Dependence: A Reconsideration. American Sociological Review 64: 606–31. [Google Scholar] [CrossRef]
  2. Allmendinger, Jutta. 1989. Educational Systems and Labor Market Outcomes. European Sociological Review 5: 231–50. [Google Scholar] [CrossRef]
  3. Ammermueller, Andreas. 2005. Educational Opportunities and the Role of Institutions. 05-044. Mannheim: Zentrum für Europäische Wirtschaftsforschung. [Google Scholar] [CrossRef]
  4. Ayalon, Hanna, and Adam Gamoran. 2000. Stratification in Academic Secondary Programs and Educational Inequality in Israel and the United States. Comparative Education Review 44: 54–80. [Google Scholar] [CrossRef]
  5. Baker, David P., and David L. Stevenson. 1986. Mothers’ Strategies for Children’s School Achievement: Managing the Transition to High School. Sociology of Education 59: 156. [Google Scholar] [CrossRef]
  6. Bol, Thijs, Jacqueline Witschge, Herman G. Van de Werfhorst, and Jaap Dronkers. 2014. Curricular Tracking and Central Examinations: Counterbalancing the Impact of Social Background on Student Achievement in 36 Countries. Social Forces 92: 1545–72. [Google Scholar] [CrossRef]
  7. Broaded, C. Montgomery. 1997. The Limits and Possibilities of Tracking: Some Evidence from Taiwan. Sociology of Education 70: 36–53. [Google Scholar] [CrossRef]
  8. Brunello, Giorgio, and Daniele Checchi. 2007. Does School Tracking Affect Equality of Opportunity? New International Evidence. Economic Policy 22: 781–861. [Google Scholar] [CrossRef]
  9. Buchmann, Claudia, and Ben Dalton. 2002. Interpersonal Influences and Educational Aspirations in 12 Countries: The Importance of Institutional Context. Sociology of Education 75: 99–122. [Google Scholar] [CrossRef]
  10. Buchmann, Claudia, and Hyunjoon Park. 2009. Stratification and the Formation of Expectations in Highly Differentiated Educational Systems. Research in Social Stratification and Mobility 27: 245–67. [Google Scholar] [CrossRef]
  11. Chmielewski, Anna K., Hanna Dumont, and Ulrich Trautwein. 2013. Tracking Effects Depend on Tracking Type: An International Comparison of Students’ Mathematics Self-Concept. American Educational Research Journal 50: 925–57. [Google Scholar] [CrossRef]
  12. Clark, Rob. 2020. Income Inequality in the Post-2000 Era: Development, Globalization, and the State. International Sociology 35: 260–83. [Google Scholar] [CrossRef]
  13. Cole, Wade M. 2018. Poor and Powerless: Economic and Political Inequality in Cross-National Perspective, 1981–2011. International Sociology 33: 357–85. [Google Scholar] [CrossRef]
  14. Coleman, James S. 1968. Equality of Educational Opportunity. Equity & Excellence in Education 6: 19–28. [Google Scholar] [CrossRef]
  15. Downey, Douglas. 2020. How Schools Really Matter: Why Our Assumption about Schools and Inequality Is Mostly Wrong. Chicago: University of Chicago Press. [Google Scholar]
  16. Hallinan, Maureen T. 1994. Tracking: From Theory to Practice. Sociology of Education 67: 79. [Google Scholar] [CrossRef]
  17. Hanushek, Eric A., and Ludger Wößmann. 2006. Does Educational Tracking Affect Performance and Inequality? Differences-in-Differences Evidence across Countries. The Economic Journal 116: C63–C76. [Google Scholar] [CrossRef]
  18. Horn, Daniel. 2009. Age of Selection Counts: A Cross-Country Analysis of Educational Institutions. Educational Research and Evaluation 15: 343–66. [Google Scholar] [CrossRef]
  19. Huang, Min Hsiung. 2009. Classroom Homogeneity and the Distribution of Student Math Performance: A Country-Level Fixed-Effects Analysis. Social Science Research 38: 781–91. [Google Scholar] [CrossRef]
  20. Kelly, Sean, and Heather Price. 2011. The Correlates of Tracking Policy: Opportunity Hoarding, Status Competition, or a Technical-Functional Explanation? American Educational Research Journal 48: 560–85. [Google Scholar] [CrossRef]
  21. Kerckhoff, Alan C. 2001. Education and Social Stratification Processes in Comparative Perspective. Sociology of Education 74: 3–18. [Google Scholar] [CrossRef]
  22. Kuznets, Simon. 1955. Economic Growth and Income Inequality. The American Economic Review 45: 1–28. [Google Scholar]
  23. Long, Daniel A., Sean Kelly, and Adam Gamoran. 2012. Whither the Virtuous Cycle? Past and Future Trends in Black-White Inequality in Educational Attainment. Social Science Research 41: 16–32. [Google Scholar] [CrossRef]
  24. Marks, Gary N. 2005. Cross-National Differences and Accounting for Social Class Inequalities in Education. International Sociology 20: 483–505. [Google Scholar] [CrossRef]
  25. Maurice, Marc, Francois Sellier, and Jean-Jacques Silvestre. 1985. The Social Foundations of Industrial Power: A Comparison of France and Germany. Cambridge: The MIT Press. [Google Scholar]
  26. Montt, Guillermo. 2011. Cross-National Differences in Educational Achievement Inequality. Sociology of Education 84: 49–68. [Google Scholar] [CrossRef]
  27. Müller, Walter, and Wolfgang Karle. 1993. Social Selection in Educational Systems in Europe. European Sociological Review 9: 1–23. [Google Scholar] [CrossRef]
  28. Nielsen, F. 1994. Income Inequality and Industrial Development: Dualism Revisited. American Sociological Review 59: 654–77. [Google Scholar] [CrossRef]
  29. Nielsen, F., and A. S. Alderson. 1995. Income Inequality, Development, and Dualism: Results from an Unbalanced Cross-National Panel. American Sociological Review 60: 674–701. [Google Scholar] [CrossRef]
  30. Nielsen, François, and Arthur S. Alderson. 1997. The Kuznets Curve and the Great U-Turn: Income Inequality in U.S. Counties, 1970 to 1990. American Sociological Review 62: 12–33. [Google Scholar] [CrossRef]
  31. Oakes, Jeannie. 1992. Can Tracking Research Inform Practice? Technical, Normative, and Political Considerations. Educational Researcher 21: 12–21. [Google Scholar] [CrossRef]
  32. Oakes, Jeannie, and Martin Lipton. 1992. Detracking Schools: Early Lessons from the Field. The Phi Delta Kappan 73: 448–54. [Google Scholar]
  33. Park, Hyunjoon. 2008. The Varied Educational Effects of Parent-Child Communication: A Comparative Study of Fourteen Countries. Comparative Education Review 52: 219–43. [Google Scholar] [CrossRef]
  34. Parker, Philip D., John Jerrim, Ingrid Schoon, and Herbert W. Marsh. 2016. A Multination Study of Socioeconomic Inequality in Expectations for Progression to Higher Education: The Role of Between-School Tracking and Ability Stratification. American Educational Research Journal 53: 6–32. [Google Scholar] [CrossRef]
  35. Partridge, Mark D. 2005. Does Income Distribution Affect U.S. State Economic Growth? Journal of Regional Science 45: 363–94. [Google Scholar] [CrossRef]
  36. Turner, R. H. 1960. Sponsored and Contest Mobility and the School System. American Sociological Review 25: 855–67. [Google Scholar] [CrossRef]
  37. United Nations. n.d. Goal 4: Ensure Inclusive and Equitable Quality Education and Promote Lifelong Learning Opportunities for All. Available online: https://Sdgs.Un.Org/Goals/Goal4 (accessed on 1 August 2023).
  38. Useem, Elizabeth L. 1991. Student Selection into Course Sequences in Mathematics: The Impact of Parental Involvement and School Policies. Journal of Research on Adolescence 1: 231–50. [Google Scholar] [CrossRef]
  39. Van De Werfhorst, Herman G., and Jonathan J. B. Mijs. 2010. Achievement Inequality and the Institutional Structure of Educational Systems: A Comparative Perspective. Annual Review of Sociology 36: 407–28. [Google Scholar] [CrossRef]
  40. Van Houtte, Mieke. 2004. Tracking Effects on School Achievement: A Quantitative Explanation in Terms of the Academic Culture of School Staff. American Journal of Education 110: 354–88. [Google Scholar] [CrossRef]
  41. Wells, Amy Stuart, and Jeannie Oakes. 1996. Potential Pitfalls of Systemic Reform: Early Lessons from Research on Detracking. Sociology of Education 69: 135–43. [Google Scholar] [CrossRef]
  42. Xu, Shangmou, and Sean Kelly. 2020. Re-Examining the Public–Catholic School Gap in STEM Opportunity to Learn: New Evidence from HSLS. Social Sciences 9: 137. [Google Scholar] [CrossRef]
Figure 1. Baseline model of school-level variation in Opportunity to Learn.
Socsci 13 00499 g001
Figure 2. Tracing functional and dysfunctional pathways using baseline model of school-level variation in Opportunity to Learn.
Socsci 13 00499 g002
Figure 3. Final model of school-level variation in Opportunity to Learn.
Socsci 13 00499 g003
Figure 4. Aggregating information across multiple levels to create a dependent measure of school-level variation in OTL at the country level.
Socsci 13 00499 g004
Figure 5. Pair-wise differences in school-mean percentage of Math topics learned (TIMSS 2019).
Socsci 13 00499 g005
Figure 6. Inequality in School-mean Math OTL and Country-mean School-level OTL (TIMSS 2019).
Socsci 13 00499 g006
Table 1. Description of independent measures.
IVsDescription
Developmental Stage
GDP per capita The GDP per capita in constant 2010 US dollars. Dataset is drawn from the World Bank.
Labor shift from agricultural sector (%)Labor shift is calculated as the difference between the percentage of the population in rural areas and the share of agriculture, forestry, and fishing as a percent of GDP, i.e., how impactful the rural economy is compared to its population share. Both population data and GDP data are drawn from the World Bank.
Size of non-agricultural sector (%)Size of the non-agricultural sector is measured as the share of the population that do not live in rural areas.
Tertiary education enrollment rate (%)Tertiary education enrollment rate is derived from the World Bank.
Natural population increase rate (per 1000 people)Natural rate of population increase is calculated as the difference between crude birth rate and crude death rate. Both datasets are drawn from the World Bank.
Social Inequality Measures
Income GINI coefficientGINI coefficient of income inequality for each country. Data is derived from the World Bank.
Index of inequality of rural population distributionMeasured as Index of inequality/variation of rural population distribution. This index measures the inequality of the distribution of rural population (in percentage p ), i.e., countries with a high or low percentage of the population in rural areas are less affected by the dichotomy between urban/suburban and rural life. Countries in the process of shifting from rural to urban residency have a higher degree of variation in residency. The index is calculated as p ( 1 p ) .
Variance in Prior Achievement
Variance in prior achievement Calculated school-level variance in math std. achievement test scores, administered at the start of 8th grade from TIMSS datasets.
Educational Policy
Academic-based promotion before 8th gradeNational policy on promotion/retention based on academic progress before the end of 8th grade. Dummy variable.
Sorting students before 8th gradeNational policy using student achievement to assign students to classes before the end of 8th grade. Dummy variable.
High-stakes exams before 8th gradeThis variable measures whether a national educational authority administers examinations that have high-stakes consequences for individual students (such as entry to a higher school system and/or exiting/graduating from school) before the end of 8th grade. Dummy variable.
Other School-Level Controls
Number of computers (deviation from country mean)The variance of number of computers (in the unit of 10 computers)
Index of inequality/variation of concentrated economic disadvantage in schoolsThis index measures the inequality/variation of concentrated economic disadvantage in the percentage of schools having more than 50% of poor students. The index is calculated as p 1 p such that countries with a high or low proportion of poor schools have greater homogeneity in school poverty environments.
Year Variable
Year The year in which TIMSS was conducted. 1—1995, 2—1999, 3—2003, 4—2007, 5—2011, 6—2015, 7—2019.
Disclaimer/Publisher’s Note: The statements, opinions and data contained in all publications are solely those of the individual author(s) and contributor(s) and not of MDPI and/or the editor(s). MDPI and/or the editor(s) disclaim responsibility for any injury to people or property resulting from any ideas, methods, instructions or products referred to in the content.

