Abstract
This study investigated the effects of U.S. student loans on attainment via the GPA of non-white undergraduates. The data for the study were drawn from the 2012/2017 Beginning Postsecondary Students Longitudinal Study (BPS: 12/17), encompassing a nationally representative sample of 1500 African American, Hispanic, Asian, multiracial, and other non-white students. The results, based on regression models and the bootstrapped confidence interval (BCI) method, indicated that student loans were associated with GPA, and both student loans and GPA were associated with attainment. Notably, the indirect effect of loan status on attainment was negative, whereas the indirect effect of high debt on attainment was positive. These findings highlight the indirect relationship between student loans and attainment and suggest that high debt has the potential to offset the negative effect of loan status on academic outcomes. The implications of these findings for higher education practice and policy debates are critical, particularly in the context of addressing non-white students’ financial needs and enhancing their academic outcomes.
1. Introduction
Initiated as grants in the 1950s, U.S. student loans turned more mortgage-like in the 1970s and 1980s (Hillman 2014; St. John et al. 2018). “Mortgage-like” refers to the organization of loans with fixed monthly repayments for several years, which imposes a repayment burden on low-income students (Barr et al. 2019; Bui 2020; Chapman and Dearden 2017). The mortgage-like feature has ignited strong discussion about the benefits of loans in addition to helping students finance college education. Several studies have examined the effects of student loans on GPA (e.g., Gervais and Ziebarth 2019; Marx and Turner 2019; Stater 2009), persistence/dropout (e.g., Dowd and Coury 2006; Herzog 2018; McKinney and Burridge 2015), and attainment (e.g., Dowd and Coury 2006; Jackson and Reynolds 2013; Kim 2007). However, the findings across studies are inconclusive on the performance of student loans concerning college outcomes (Destin and Svoboda 2018). In this regard, the indirect effects of student loans and the maximum loan amount per academic period for non-white students are important yet understudied.
Regarding the effects of student loans on college outcomes, there might be situations where the direct effect of the independent variable on the dependent variable is not statistically significant, but the effect via a third variable is (Hayes 2017; MacKinnon 2011). This is the case of indirect effects. Destin and Svoboda (2018) in their study touched upon the nexus between student loans and attainment via GPA. Nonetheless, these authors did not address how much GPA mediates the effects of student loans on attainment. GPA is a crucial dimension of academic success, and a detailed analysis of its mediating role in this relationship will provide a fuller picture of the effects on attainment.
The indirect effects of student loans may lie in each level of loans that students borrow. In their study, McKinney and Burridge (2015) pondered the maximum amount per academic period that optimally benefits student borrowers. Other researchers have demonstrated that when they increase to a certain level, student loans have effects on college outcomes, and these effects on college outcomes tend to be positive (Cofer and Somers 2001; Marx and Turner 2019; Stater 2009). This suggests the necessary categorization of student loans into debt levels, and findings regarding the effects of each debt level on college outcomes may help answer the question about maximum loan amounts per academic period.
Also, sufficient attention should be paid to non-white students as a study sample in loan research (Chen 2008). Non-white students make up 58% of students in higher education (National Student Clearinghouse Research Center 2024). Typically among these are African American students, who borrow most (Addo et al. 2016; Jackson and Reynolds 2013), and Hispanic/Latino students (Dwyer 2018). Non-white students are under-resourced and struggle to improve their college outcomes (Kim 2007; Museus 2011; Taylor and Cantwell 2019). Without effective loans, they may drop out and fail to complete their degree, which reinforces racial stereotypes about their intellectual capacity (McGee 2018; McGee and Martin 2011; McGee et al. 2017). Under structural racist constraints, reinforced racial stereotypes contribute to jeopardizing their employment outcomes (Addo et al. 2016; Leonardo 2004) and attenuate their loan repayment ability (Barr et al. 2019; Bui 2020; Chapman and Dearden 2017). The delinquency and defaults resulting from this series of negative outcomes may take a toll on the performance of U.S. financial aid in benefiting non-white students.
More than 1.75 trillion U.S. dollars was disbursed as student loans at the turn of 2024 (Federal Reserve 2024); 46% of it went to non-white students (Hanson 2024). Given that non-white students are more likely than White students to encounter a repayment burden, this proportion suggests the need to address the aforementioned gaps. The present study therefore aimed to explore whether or not student loans relate to attainment via GPA as Destin and Svoboda (2018) claimed, and if such an indirect relationship exists, to determine the loan amounts (i.e., debt levels) that work for non-white students. With a focus on non-white students at four-year higher education institutions (HEIs), the study was guided by two questions.
- In what way do student loans relate to the GPA of non-white four-year college students?
- In what way do student loans relate to the attainment of non-white four-year college students, and does the association between student loans and attainment function through GPA?
2. Theoretical Background
Student loans represent a type of need-based aid, as opposed to merit-based aid (St. John et al. 2018; Stater 2009). Most are federal loans (e.g., direct loans or Stafford loans). The first federal student loan program was the National Defense Student Loan (Federal Perkins Loan), created through the National Defense Education Act in 1958 (Sablan and Hiestand 2020). The federal government created several student loan programs as a consequence of the 1965 Higher Education Act. These are guaranteed student loans (later called Stafford loans), PLUS loans (loans for parents and graduate students), and consolidated loans (i.e., a combination of all federal loans) (Jackson and Reynolds 2013; St. John et al. 2018). They fall into two categories: direct loans, funded by the government, and indirect loans, funded by the private sector and guaranteed by the government. Since the indirect loans were eliminated in 2010 and Perkins loan disbursement ended in 2018, federal loans have now been direct loans under the U.S. Department of Education’s administration.
2.1. Non-White Students and Loans
Non-white students in the United States often come from low-income families (Mendoza 2012; The Institute for College Access and Success 2017; Winkle-Wagner and Locks 2019). To climb the social ladder, these students need to invest in college education, and a crucial source of indirect funding for their college education is loans. Proportionally, federal loans (e.g., Stafford loans) account for more than 92% of the amount that students owe for college education purposes (Hanson 2024). Among college students, African American students borrow most (Jackson and Reynolds 2013) and 33% more than white students (Addo et al. 2016). Upon completion of their bachelor’s degree, African American students owe USD 52,000 per capita (Hanson 2022). Many students seek to borrow more than USD 100,000 without knowing the consequences of borrowing (McKinney et al. 2015). The debt that students incur is four times as great as the amount that their family is expected to contribute (Mendoza 2012). Those with a family income below USD 75,000 borrow more than those with a family income above USD 75,000 (Mendoza 2012). Their amount of debt is associated with the intersection of socio-economic status (SES) and race (Addo et al. 2016; Hanson 2022).
Due to their limited financial resources, non-white students often need to borrow money and are less debt-averse than previously hypothesized (Mendoza 2012). While loans can enhance their financial solvency, they may also lead to significant stress (Deckard et al. 2022; Mukherjee et al. 2017). In a structural equation modeling (SEM) study with students from 28 selective HEIs, Destin and Svoboda (2018) found an association between loan-related stress and academic success.
Concerning academic success, studies differ as to the effects of student loans on GPA. In a multiple regression study on a sample of 18,748 students at three flagship HEIs, Stater (2009) found that a USD 1000 increase in student loans enhances the first-year GPA by 0.10 points. In the second through the fourth year, a USD 1000 increase in this need-based aid leads to a 0.043-unit increase in GPA. The average effects of student loans on yearly GPA and cumulative GPA are 0.02 and 0.04 points, respectively. Using instrument variable (IV) models, Marx and Turner (2019) found that taking out loans increases cumulative GPA by 0.60 points. For each USD 1000 increase in borrowings, the cumulative GPA increases by 0.16 points. However, other researchers have found negative effects of student loans on GPA. In their regression kink (RK) study on university undergraduates, Gervais and Ziebarth (2019) found that a USD 1000 debt increase leads to a 0.015-unit decrease in major GPA and a 0.016-unit decrease in cumulative GPA. Gervais and Ziebarth (2019) estimated the effect of student loans on GPA to be approximately −0.03 points. Destin and Svoboda (2018) found that when the financial burden (i.e., student loans) is perceived as a barrier to future success, negative cognitive functioning leads to a 0.006 standard deviation decline in GPA.
Published studies also differ regarding the effects of student loans on attainment. First, student loans help students prolong their stay in college until they graduate (Jackson and Reynolds 2013) as they have more time and energy to devote to their studies (Baum 2010; Marx and Turner 2019). Mendoza (2012) indicated that 60.8% of undergraduates take out student loans and graduate within 6 years. According to Carales (2020), loan status enhances the odds of completing a degree program by 291%. Nonetheless, Destin and Svoboda (2018) found that among first-year debtors, worsening GPA predicts a 0.1% decline in attainment. Some studies even present mixed results. For example, in a Hierarchical Linear Modelling (HLM) study, Kim (2007) found that if the debt amount increases by USD 1000, the odds of graduating increase by 1.1% for all students but decrease by 1.6% for low-income students. Although African American students had the lowest debt in Kim’s study, their likelihood of completion decreased by 5.6% for every marginal debt amount of USD 1000.
In addition to unraveling the effects of student loans on GPA and attainment, previous studies have demonstrated a strong relationship between GPA and attainment. According to Destin and Svoboda (2018), students with better grades are more likely to graduate. Dowd and Coury (2006) found a positive association between GPA and attainment in their logistic regression study on the effects of student loans. If a student’s first-year GPA increases by one unit, their likelihood of attaining a degree increases by a factor of 0.075. Carales’s (2020) and Bui’s (2022) logistic regression studies also confirmed the positive effect of GPA on attainment.
The relationship between the first-year GPA and attainment points to the ability of students to persist through their college years. Multiple loan studies have addressed this ability as persistence (Dowd and Coury 2006; Herzog 2018; McKinney and Burridge 2015). In their logistic regression study, McKinney and Burridge (2015) found that if students take out loans, they enjoy a 66% decrease in the likelihood of dropping out. However, a negative association between student loans and persistence was found by Herzog (2018), supporting Destin and Svoboda’s (2018) observation that findings regarding the performance of student loans are inconclusive.
The effects of student loans on the GPA and attainment of non-white borrowers are an area of concern and should be further studied. Since Stafford loans are not sensitive to the borrowers’ future income (Barr et al. 2019; Bui 2020; Chapman and Dearden 2017), these loans should effectively support non-white students in achieving their academic success. Otherwise, non-white students may delay graduation or never graduate. These college outcomes together with the prevalence of racial stereotypes and discrimination (McGee 2018; McGee and Martin 2011; McGee et al. 2017) worsen their employment trajectories (Addo et al. 2016; Leonardo 2004) and loan repayment ability (Barr et al. 2019; Bui 2020; Chapman and Dearden 2017), resulting in delinquency and defaults.
2.2. Conceptual Framework
The present study employed Chen’s (2008) multidimensional model as its conceptual framework. The perspective embedded in this model was that students were heterogeneous and that researchers must use different variable clusters to account for their heterogeneity. The clusters of variables also suggested that the relationships between student loans and academic outcomes related to different factors. In the form of clusters, these factors themselves were intertwined, further complicating the higher education ecosystem that non-white students navigate to complete their degree. Statistical analysis should therefore incorporate these factors to capture the nuances of their relationship with one another and with attainment.
There were eight clusters of variables to account for in examining the performance of student loans (Chen 2008). These clusters included student background, pre-college experiences, college experiences, educational aspiration, financial factors, institutional factors, interaction effects, and time in college. Out of these clusters, pre-college experiences and educational aspirations were subsumed into background factors (Carales 2020), while financial factors were subsumed into college experience factors (Carales 2020; Musoba and Krichevskiy 2013). Garnering insights from the variable operationalizations of researchers (e.g., Carales 2020; Musoba and Krichevskiy 2013), I adopted Chen’s (2008) five categories for the statistical models in the present study: background factors, college experiences, institutional factors, interaction effects, and time in college (i.e., attainment within six years).
With the time in college cluster, Chen’s (2008) heterogeneous lens suggested a necessary sequence of data for the main variables. Fairchild and McDaniel (2017) emphasized that in analyzing indirect associations between variables, data for the main predictors must occur first, followed by the occurrence of data for mediators and outcome variables. Such a sequence applied to the data for student loans (observed on the initial days of each semester), GPA (observed at the end of the first academic year), and attainment (observed in the sixth year). The use of the multidimensional model introduced sufficient complexity and consistent temporality for analyzing the relationships between student loans and college outcomes.
3. Methodology
3.1. Data
The data for the present study came from the Beginning Postsecondary Students Longitudinal Study, conducted in the United States from 2011–2012 to 2016–2017 (BPS:12/17). The data were collected when postsecondary students were in their first year (2011–2012), their third year (2014), and finally their sixth year (2017) (Bryan et al. 2019). This restricted-use dataset included information on student characteristics, college experiences, financial aid, employment, and expenses for 22,530 first-time beginning (FTB) students (Bryan et al. 2019). These FTB students represented four million undergraduates at Title IV eligible institutions. I employed the simple random sampling method to select non-white students from this student pool. First, I defined the target population, which was non-white students at four-year HEIs. I selected a sample size of 10,612 students at four-year HEIs and filtered out white students for a sample size of 4770 African American, Hispanic/Latino, Asian, multiracial, and other students (Native Hawaiian and Pacific Islanders, American Indian, Alaska Native). Finally, based on the resampling principle of the bootstrap confidence interval (BCI) method (to be delineated in the following section), I employed the lottery method to select 1500 non-white four-year college students.
3.2. Variables
Table 1 presents variable coding and operationalizations for the present study. The main outcome variable was attainment measured through June 2017. As an important dimension of academic success, attainment has been used in previous studies (e.g., Carales 2020; Dowd and Coury 2006; Kim 2007) as a dichotomous variable. In this study, 0 (no) was used to indicate continued enrollment without a bachelor’s degree, and 1 (yes) was used to indicate the completion of the bachelor’s degree. Those who completed their bachelor’s degree through June 2017 either still enrolled in or left their HEIs. Thus, attainment reflected the persistence dimension and accounted for any dropouts (nonenrollment without a bachelor’s degree) during the six years.

Table 1.
Variable coding and operationalizations.
Two main predictors in the cluster of college experiences were student loans and GPA. Both were constructed from the first-year data (2011–2012). Student loans were operationalized into loan status and debt levels (high debt [>USD 7000], medium debt [≥USD 3000 but ≤USD 7000], and low debt [<USD 3000]). Operationalizing student loans this way helps answer questions about whether taking out loans is an excellent approach to financing a college education and how much students should borrow to improve their academic outcomes (Bui 2022; Gervais and Ziebarth 2019; Kim 2007; Stater 2009). As a mediator in the association between student loans and attainment, GPA was coded as a continuous variable measured at the end of 2012.
The first cluster of variables employed as controls was student background, including demographics, SES, and pre-college experiences. Student demographics included sex, age, and race/ethnicity (Dowd and Coury 2006; Hillman 2014; Kim 2007; McKinney and Burridge 2015). Races and ethnicities should not be subsumed into one racial/ethnic category, as in the case of Native Hawaiian and Pacific Islanders, American Indian, and Alaska Native students in this study. However, given that these populations are small, putting them in one racial/ethnic category helps to maintain the power of effect analysis (Chen 2008). To determine SES, I followed Hillman (2014) by using the students’ first-generation status, having dependents, and family income. For family income, I followed Carales (2020) by categorizing it into low income (<USD 32,000), middle income (≥USD 32,000 but ≤USD 60,000), and high income (>USD 60,000). For pre-college experiences, I also followed Carales (2020) by using the home language spoken, citizenship status, and degree expectations.
The other clusters employed as controls were college experiences, institutional factors, and interaction terms. College experiences included first-year enrollment intensity, dependency status, academic and social integration, GPA, student loans, Pell grant status, and hours worked per week. For academic and social integration quality, I used the weighted mean score of students’ evaluation regarding their interaction with peers, faculty members, and studies. For institutional factors, researchers consider the institutional control and institutional level (Hillman 2014) or institutional control and selectivity (Chen and St. John 2011). The sample of this study was non-white students at four-year HEIs, so I only included institutional control (public, private non-profit, and private for-profit) and selectivity (highly selective, moderately selective, minimally selective, and open admission) as institutional factors. For interaction terms, I used loan status * academic/social integration quality, loan status * Pell grant status, and loan status * work.
3.3. Methods
I employed the conditioning-based approach to answer the research questions (McBee 2022). With this approach, I constructed a multiple linear regression model and a logistic regression model. The first model addressed the effects of student loans on GPA, formalized as follows:
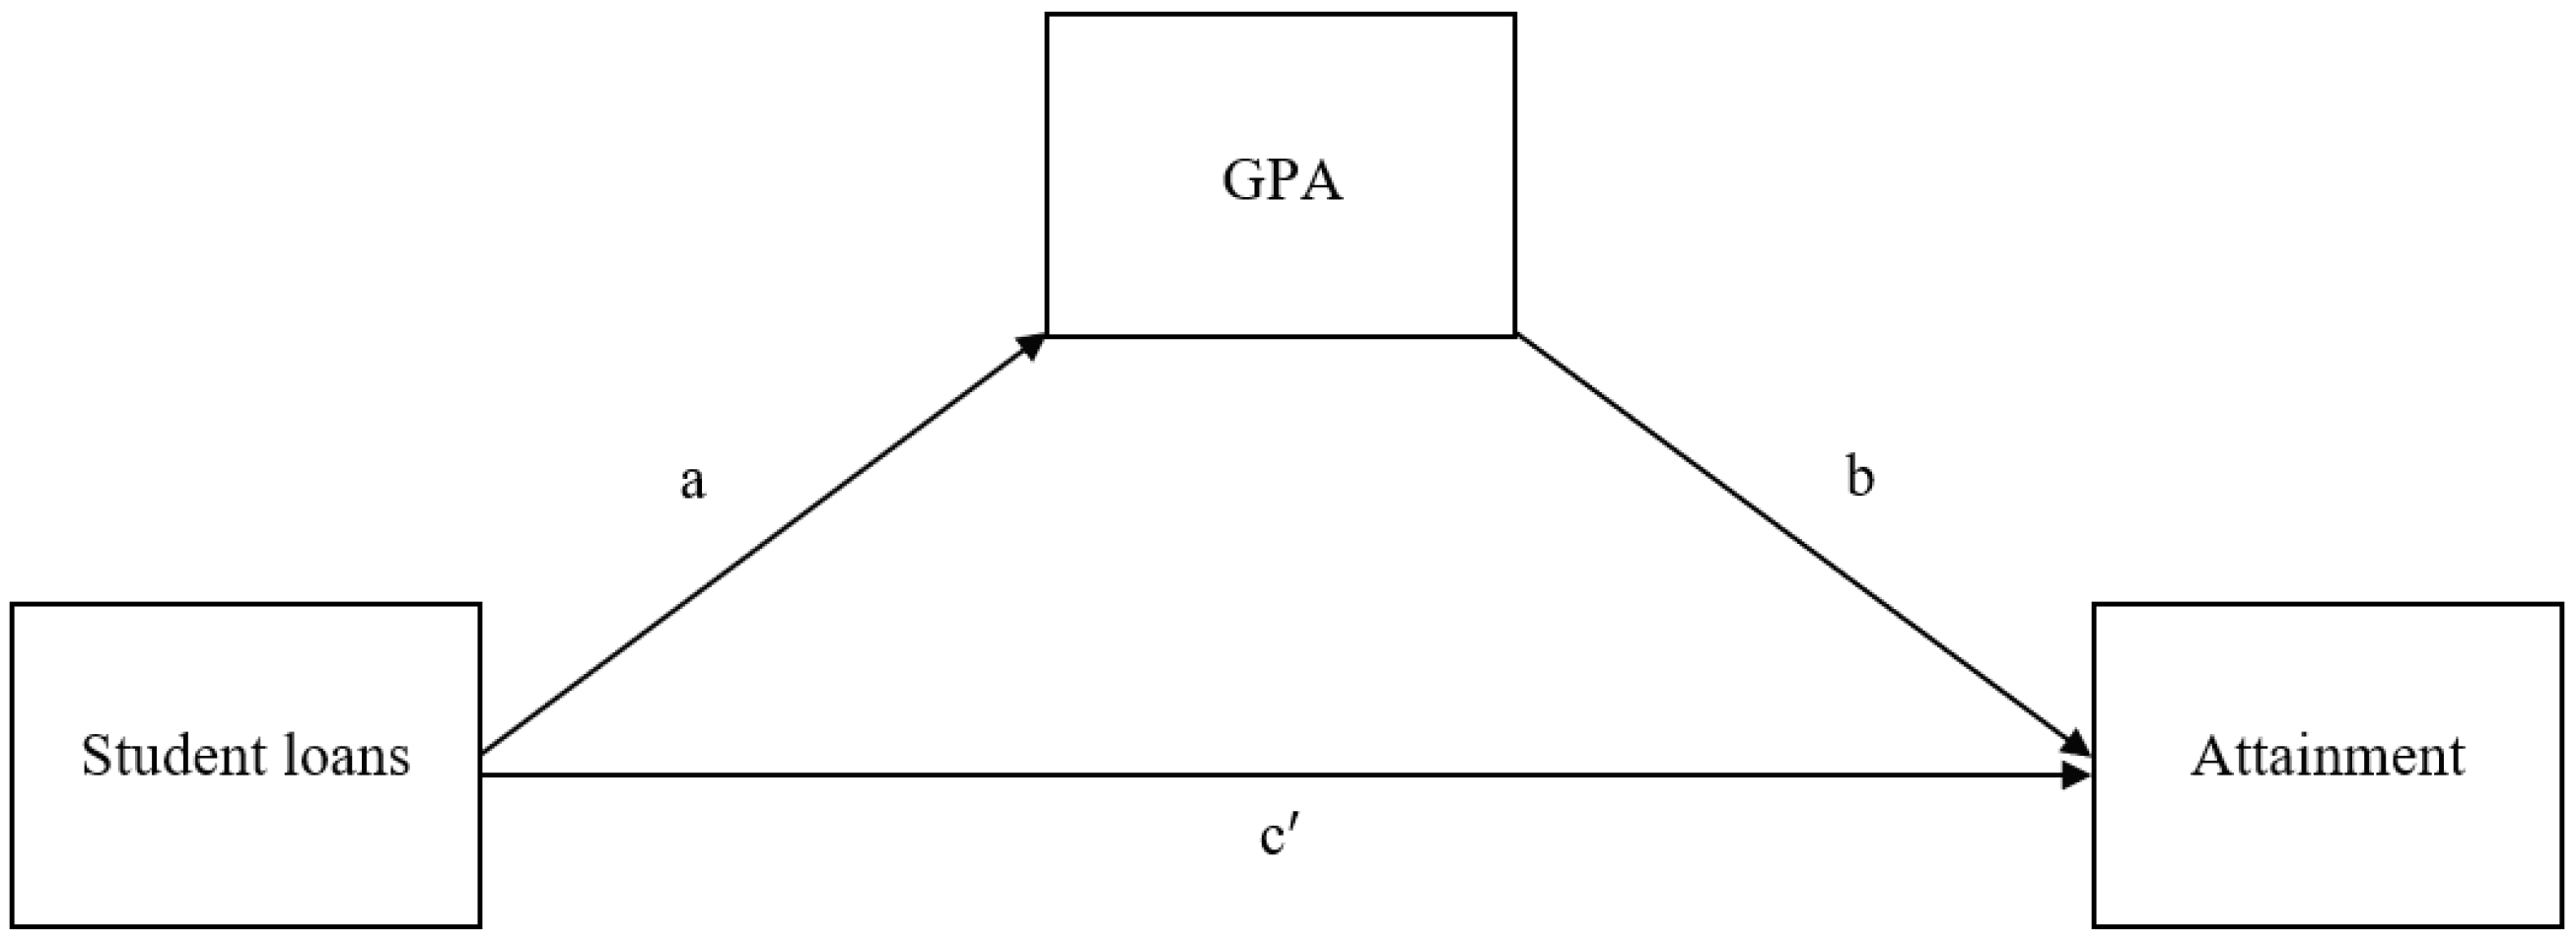
where is grade point average; is the intercept; and are regression coefficients; SL and are student loans and a vector of covariates, respectively; and is a random error. For question 2, becomes a mediator, and based on Equation (1) and the dichotomous nature of the attainment variable, the logistic regression model was fitted. The model consisted of the direct and indirect effects of student loans on attainment, formalized as follows:
where the direct effect of student loans on attainment () is , and the indirect effect or the effect of student loans on attainment via is . The way that student loans relate to attainment is described in Figure 1.
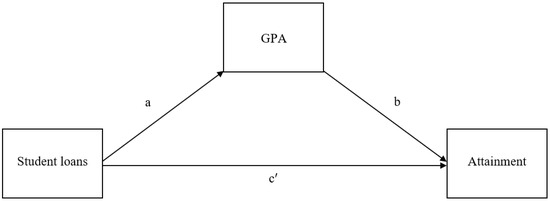
Figure 1.
Hypothesized effects of student loans on attainment via GPA.
The conditioning-based approach caused this indirect effect analysis to be distinctive from what Baron and Kenny (1986) suggested. The BCI method was used to assess indirect effects, and the analysis was conducted on Process (Version 3.5), an equation modeling tool developed by Hayes (2017). The BCI method employed resampling as the working principle. First, data were resampled 5000 times with replacement. Then, the mean of each indirect effect was estimated, and based on this estimation, the bootstrapped standard errors and the bootstrapped 95% CI (i.e., ) were calculated. The output of these calculations consisted of the direct and indirect effects of loan status and debt levels on attainment and regression results, with regression statistics for both GPA and attainment as outcome variables. Employing the BCI method on Process helped address the issue of the nonnormal distribution of data points and minimized estimation bias, given that resampling moved the estimates to population parameters.
To respond to concerns that the BCI method does not work as well as propensity score matching (PSM) to accurately estimate the effects of predictors (McBee 2022), I would argue that the BCI method is associated with parsimonious statistical modeling, while the PSM is merely a pre-processing method and thus needs a different outcome model to unpack the effect of interest (King and Nielsen 2019). I would also argue that the only unbiased gold standard in education research is the randomized controlled trial (RCT), which requires experimental data unavailable in the PBS:12/17 dataset. However, for the direct association between loans, GPA, and attainment, the term “effect” in this paper is used as a popular nomenclature in mediation analysis rather than a causal inference. Only the indirect effect is consistent with causal inference approaches given the working principle of the BCI method.
4. Limitations
Although it indicated the mediated relationship between loans and attainment that previous studies have not examined, the present study had several limitations. First, Stafford loans were used as the main predictor of the first-year GPA and attainment. This followed the practice of variable operationalization in Lee et al.’s (2020) study. Due to this assumption, the findings did not reflect the effectiveness of other loans, such as Perkins loans (although unavailable as of 2018) and private loans. Second, only the first-year data were used to construct federal loans and control variables. The use of the first-year data, albeit predicting later college outcomes (Johnson 2006; McKinney and Burridge 2015), could not capture the changes in attainment caused by changes in loans and other variables. Third, the BCI method did not indicate the volume of confounding from unobserved variables that might tip the estimated effects. This limitation is common among effect estimation methods. Therefore, the present study did not ensure the elimination of unobservable variable bias through the BCI method. Finally, the present study did not claim first-year GPA as the only mediator. Multiple mediators might be involved in the relationship between student loans and attainment, and the direction of the relationship via these mediators might differ (Demming et al. 2017).
5. Results
5.1. Descriptive Statistics
Table 2 describes the characteristics of the sampled non-white four-year college students. After six years of study, 640 students graduated, which translated into 48% of the sample. Tracing the first-year data indicated a GPA of 2.955 among the students (SE = 0.020). Also, 67% of them took out federal loans, and more than one-third had low debt (39%), followed by medium debt (36%) and high debt (25%). The low GPA and attainment rate compared with the loan borrowing rate (67%) posed a question about the connection between student loans and college outcomes.
Table 2.
Characteristics of the sample (n = 1500).
Table 2 also presents background information on the sampled students. Female students accounted for 59%, and over three-quarters were under 20 when they entered their first year of college (82%). In terms of race/ethnicity, 41% of the sample were Hispanic/Latino students, followed by African American (33%), Asian (14%), multiracial (10%), and other students (2%). Three-fourths of the students were not first-generation (76%), and most had no dependents during their first year of college (82%). In addition, more than half of them came from low-income families (51%), and two-thirds came from families that spoke English as the primary language (67%). They were almost all citizens (92%). Regarding educational expectations, more than half of them intended to obtain a graduate degree after completing their bachelor’s program (58%).
As for college experiences, the descriptive results in Table 2 indicate that 84% of the minority students entered their first year of college in a financially dependent status. An average non-white bachelor’s student delayed enrollment for 2.276 years (SE = 0.036). When enrolled, they evaluated their social and academic integration highly, with a mean of 4.301 out of 5.00 (SE = 0.021). They also attended college full time (79%) rather than part time or both full and part time (21%). They also received Pell grants (59%) and worked more than 12 h weekly during their first year of college (SE = 0.255).
Regarding institutional factors, the descriptive results in Table 2 indicate that more than one-third of the students sampled attended public HEIs (37%). Meanwhile, 30% attended private nonprofit HEIs (30%), and the rest attended proprietary HEIs (33%). In terms of institutional selectivity, more of them attended moderately selective HEIs (28%) and minimally selective HEIs (28%) rather than highly selective HEIs (23%) or open admission HEIs (21%).
In the following regression and mediation analysis, the p-value indicates the significance of coefficients associated with direct effects. However, the confidence interval (CI) indicates the significance of coefficients associated with indirect effects due to the use of the BCI method.
5.2. Associations with GPA
The results in Table 3 show that the linear multiple regression model explained 12% of the variance in the first-year GPA with R2 = 0.120 (F[30, 1464] = 6.689, p < 0.001). Specifically, student loans had mixed associations with the first-year GPA. Loan status had a negative association with GPA (B = −0.223, p > 0.01). Compared with those who did not take out loans, loan borrowers saw a −0.223-unit change in their GPA, controlling for other variables. When it comes to debt levels, having high debt positively and significantly predicted GPA (p < 0.05), but having medium debt did not (p = 0.145). Compared with having low debt, having high debt predicted a 0.148-unit change in GPA, controlling for other variables. The overall results in Table 3 indicate that while loan status was negatively related to GPA, high debt is positively related to GPA.
Table 3.
Regression results: predictors of GPA.
5.3. Associations with Attainment
As shown in Table 4, the linear logistic regression model significantly predicted attainment ( Compared with the −2 log-likelihood of 2054.262 in the null model, the −2 log-likelihood in the full model (with student loans, GPA, and covariates included) decreased to 1472.690. Together with the pseudo R2 (CoxSnell R2 and Nagelkerke R2), the decrease in −2 log-likelihood demonstrated an improvement on the full model. The results showed that GPA positively and significantly predicted attainment (OR = 2.509, p < 0.001). Controlling for other variables, a one-unit increase in GPA increased the odds of graduating with a bachelor’s degree by 151%. Since student loans were associated with GPA, and GPA was associated with attainment, student loans were associated with attainment via GPA.
Table 4.
Regression results: effects on attainment via GPA.
The results in Table 4 indicate the direct and indirect effects of student loans on attainment. First, loan status nonsignificantly decreased the odds of attaining a bachelor’s degree (OR = 0.626, p = 0.190), holding other variables constant. However, through GPA, loan status significantly decreased the odds of attaining a bachelor’s degree by 19% (OR = 0.814, CI: 0.698–0.919). Second, students who had high debt saw their odds of attaining a bachelor’s degree directly increase by more than 153% (OR = 2.532, p < 0.01), holding other variables constant. Through GPA, they saw their odds of attaining a bachelor’s degree increase by another 15% (OR = 1.146, CI: 1.033–1.296). Third, those who had medium debt directly saw their odds of graduating with a bachelor’s degree increase by 81% (OR = 1.809, p < 0.5), holding other variables constant. However, the association between medium debt and attainment via GPA did not hold (OR = 1.085, CI: 0.985–1.218).
Based on the results in Table 4, two findings are notable. One is that while loan status was negatively associated with attainment, high debt and medium debt were positively associated with attainment. The direction of these associations resembled the direction of the associations between student loans and GPA (Table 2). The other is that GPA only significantly mediated the effects of loan status and high debt on attainment.
6. Discussion
In the present study, 33% of non-white students were African American, 41% were Hispanic/Latino, 14% were Asian students, 10% were multiracial, and the rest were students from other non-white groups. In their first year of study, 67% of non-white students took out loans. While 25% had high debt, 36% had medium debt, and 39% had low debt. At the end of the first year, the GPA of non-white students was 2.955 out of 4.00. Although most sampled students borrowed money, only 48% attained the degree in the sixth year. Given the low attainment rate compared with the borrowing rate, the study highlighted the need to examine whether and how student loans effectively promote academic success.
The present study addressed the direction of the effects of student loans on college outcomes, which are still inconclusive (Destin and Svoboda 2018). The study revealed that loan status had a negative direct effect on GPA and a negative indirect effect on attainment (Figure 2). This finding seems to be counterintuitive, but it is explainable. When student loans were considered a status, students taking out even a tiny amount were categorized as borrowers (the “yes” category in loan status). Small amounts may not have been sufficient to move them beyond the threshold where their academic outcomes were negative due to various reasons unobserved in the present study. These may include, but are not limited to, family wealth (more inclusive than SES), information networks, structural constraints (Addo et al. 2016; Charron-Chénier and Seamster 2021), and more.

Figure 2.
Regression results: effects of student loans on attainment via GPA. (a) OR = 0.814 (significant), (b) OR = 1.146 (significant), and (c) OR = 1.085 (nonsignificant). Note. * p < 0.05; ** p < 0.01; *** p < 0.001. OR: odds ratio. Nonsignificant odds ratios for direct effects are not presented.
Conversely, when student loans were operationalized into debt levels, high debt had a positive association with GPA and attainment. This resonated with researchers’ observations that when student loans increased to a certain level, they had a positive effect (e.g., Kim 2007; Marx and Turner 2019; Stater 2009). One of the explanations for the positive effect was that high debt allowed students to forego working and devote more time and effort to academic duties (Marx and Turner 2019). These findings indicated the possibility of using high debt to offset the negative effect of loan status (Bui 2022).
Through regression analysis, the present study addressed the main question as to whether the association between student loans and an academic outcome (i.e., attainment) functioned through another variable (i.e., GPA). It mainly confirmed the proposition of Destin and Svoboda (2018) that student loans relate to attainment via changes in GPA. With the indirect associations found, the study emphasized the need to examine the relationship between student loans and college outcomes, directly and indirectly, to understand the performance of student loans better.
With the findings on indirect effects, the present study highlights the role of the first-year factors, such as the GPA of non-white students. GPA is as important as other dimensions of academic success given that it predicts attainment (Bui 2022; Carales 2020; Dowd and Coury 2006). Despite this, higher education policy discourse seems to focus more on persistence and graduation status and the direct effects of student loans rather than on GPA and their indirect effects (Bui 2022). While working as a mediator, GPA is shaped by loans and multiple other factors (e.g., income, enrollment intensity, delayed enrollment, academic/social integration quality, Pell grant status, etc.), as the present study indicated. The intertwining of these variables suggests that ignoring GPA as a mediator may translate into ignoring other factors.
The mediating role of GPA suggests avenues for further understanding the indirect effects of student loans on student success. For example, since student loans create opportunities for students to focus on their academic duties, loans might be associated with attainment via students’ employment and/or academic involvement (Bui 2022). While students are more engaged in academics, their time at work might be reduced. The indirect effects of student loans on college outcomes could also be addressed by looking at the number of hours worked per week. These directions promise significant contributions to understanding the overall effects of student loans as a kind of intervention to improve academic performance. Further research could also address the indirect effects of student loans on other dimensions of college outcomes, such as persistence, transfer, certificate completion, and more.
High debt has the potential to counteract the negative effect that loan status exerts on attainment. Charron-Chénier and Seamster (2021) supported borrowing increases among non-white students who are financially isolated due to the racist market structure. Some are concerned about debt increases among non-white students because research also indicates that student loans hurt their academic outcomes (Destin and Svoboda 2018). However, siding with Charron-Chénier and Seamster (2021), I would argue that high debt is not the reason for delinquency and defaults. What caused delinquency and defaults are non-completion, low income, high housing prices, and other factors unrelated to student loans (Dowd 2008; Looney and Yannelis 2019; Mueller and Yannelis 2019).
Certainly, I do not deny that using high debt to increase student success should be discreet. Non-white students in the United States borrow less money than white students, except for African American students (Addo et al. 2016; Jackson and Reynolds 2013). Non-white students have very limited information when it comes to borrowing (Charron-Chénier and Seamster 2021; Malcom and Dowd 2012). These students may not know how loans can be used to enhance their academic success. When entering the academic job market, they also find it hard to earn (elite) jobs at the rates of white graduates (Addo et al. 2016; Leonardo 2004) due to racism (McGee 2018; McGee and Martin 2011; McGee et al. 2017). Since student loans are mortgage-like (Barr et al. 2019; Bui 2020; Chapman and Dearden 2017), borrowing too much mortgage-like debt introduces the propensity of delinquency and defaults if student borrowers fall in cases mentioned above (Dowd 2008; Looney and Yannelis 2019; Mueller and Yannelis 2019). Then, loans are not protective of non-white students (Addo et al. 2016).
Increasing the debt volume for non-white students on a large scale could also motivate HEIs to increase their tuition and fees (Bok 2015; Bui and Nguyen 2023). To make high debt feasible, there needs to be a consistent set of policies. State funding for public HEIs should be augmented to control the direct cost of college education due to burdensome loans (Rubin et al. 2022; St. John et al. 2018). In cases where non-white students struggle academically or enter the job market without a decent degree, their low income should allow them to delay their repayments. Currently, lower-income borrowers can apply for the income-driven (IDR) plans. This seems to benefit non-white borrowers, but many IDR plans exclude default borrowers and Parent Plus loan borrowers. A substitute for them could be income-contingent loans (ICLs) (Barr et al. 2019; Chapman and Dearden 2017). Higher education benefits all, and the ICL model provides more leeway for students to fund their college education. Unfortunately, state funding has continued to decrease, and the ICL model has not come yet.
7. Conclusions
Student loans create opportunities for non-white students to attend college and enhance their academic success. However, little research has been conducted to address the indirect effects of loan status and debt levels on their college outcomes. The present study was conducted to address these gaps. The study merely focused on Stafford loans, employed only first-year predictors, might harbor unobservable variable bias, and did not thoroughly examine mediators. However, the study successfully specified how these loan variables are associated with attainment via GPA, suggesting that high debt can enhance non-white students’ college outcomes, even indirectly. It emphasized that stakeholders only partially understand the associations between student loans and college outcomes by ignoring mediators in these associations. One takeaway is that using student loans as a funding approach to increase college outcomes should account for mediators such as GPA and how these mediators are formed. The other takeaway is that high debt could be a means to assist non-white students in achieving academic success. This intervention does not have effects overnight, but it should be discussed as a starting point to propel the non-white student success agenda forward.
Funding
The author received no funding for the study.
Institutional Review Board Statement
The study was conducted in accordance with the Declaration of Helsinki and the University of Houston’s Institutional Review Board (protocol code STUDY00002747, approved on 23 December 2020).
Informed Consent Statement
Informed consent was waived since the study did not involve humans or animals.
Data Availability Statement
The restricted-use data are available upon request to the U.S. Department of Education’s Institute of Education Sciences (IES).
Acknowledgments
I am grateful to (1) Lyle McKinney and Catherine Horn at the University of Houston for their assistance in obtaining the IES’ data license, (2) Ebony McGee at Johns Hopkins University for her support in finalizing this manuscript, and (3) the anonymous reviewers for their evaluation of the manuscript.
Conflicts of Interest
The author declares no conflict of interest.
Appendix A
Table A1.
Predictors of attainment.
Table A1.
Predictors of attainment.
| Covariates | 95% CI for OR | |||||
|---|---|---|---|---|---|---|
| B | SE | p | OR | LL | UL | |
| Sex | −0.331 | 0.135 | * | 0.718 | 0.551 | 0.937 |
| Age | −0.372 | 0.258 | 0.149 | ___ | ___ | ___ |
| Race/ethnicity | ||||||
| African American | 1.022 | 0.417 | * | 20.779 | 10.228 | 6.290 |
| Hispanic/Latino | 1.034 | 0.418 | * | 20.812 | 10.240 | 6.379 |
| Asian | 0.819 | 0.464 | 0.077 | ___ | ___ | ___ |
| Multiracial | 0.818 | 0.445 | 0.066 | ___ | ___ | ___ |
| First-generation status | −0.453 | 0.161 | ** | 0.636 | 0.464 | 0.872 |
| Having dependents | −0.567 | 0.204 | ** | 0.567 | 0.380 | 0.846 |
| Family income | ||||||
| High income | −0.001 | 0.258 | 0.998 | ___ | ___ | ___ |
| Middle income | 0.216 | 0.172 | 0.207 | ___ | ___ | ___ |
| English as a primary language | −0.129 | 0.174 | 0.458 | ___ | ___ | ___ |
| Citizenship | −0.552 | 0.258 | * | 0.576 | 0.347 | 0.955 |
| Graduate degree expected | 0.335 | 0.137 | * | 1.398 | 1.069 | 1.829 |
| Dependency status | −0.096 | 0.236 | 0.684 | ___ | ___ | ___ |
| Delayed enrollment | −0.156 | 0.091 | 0.087 | ___ | ___ | ___ |
| Enrollment intensity | 0.287 | 0.155 | 0.065 | ___ | ___ | ___ |
| Academic/social integration quality | 0.270 | 0.193 | 0.162 | ___ | ___ | ___ |
| Pell grant status | 0.088 | 0.300 | 0.769 | ___ | ___ | ___ |
| Hours worked | −0.056 | 0.016 | *** | 0.946 | 0.918 | 0.975 |
| Institutional control | ||||||
| Public | 0.239 | 0.244 | 0.326 | ___ | ___ | ___ |
| Private nonprofit | 0.301 | 0.235 | 0.199 | ___ | ___ | ___ |
| Institutional selectivity | ||||||
| Highly selective | 1.811 | 0.260 | *** | 6.117 | 3.673 | 1.196 |
| Moderately selective | 1.372 | 0.226 | *** | 3.943 | 2.532 | 6.135 |
| Minimally selective | 0.474 | 0.196 | * | 1.606 | 1.095 | 2.356 |
| Interaction effects | ||||||
| Loan status * academic/social integration quality | −0.097 | 0.223 | 0.664 | ___ | ___ | ___ |
| Loan status * Pell grant status | −0.461 | 0.318 | 0.147 | ___ | ___ | ___ |
| Loan status * work | 0.029 | 0.018 | 0.102 | ___ | ___ | ___ |
Note. B: regression coefficient. SE: standard error. * p < 0.05; ** p < 0.01; *** p < 0.001. OR: odds ratio (only reported for significant coefficients). CI: confidence interval (only reported for significant coefficients); LL: lower limit; UL: upper limit.
References
- Addo, Fenaba R., Jason N. Houle, and Daniel Simon. 2016. Young, Black, and (Still) in the Red: Parental Wealth, Race, and Student Loan Debt. Race and Social Problems 8: 64–76. [Google Scholar] [CrossRef]
- Baron, Reuben M., and David A. Kenny. 1986. The Moderator-Mediator Variable Distinction in Social Psychological Research: Conceptual, Strategic, and Statistical Considerations. Journal of Personality and Social Psychology 51: 1173–82. [Google Scholar] [CrossRef]
- Barr, Nicholas, Bruce Chapman, Lorraine Dearden, and Susan Dynarski. 2019. The US College Loans System: Lessons from Australia and England. Economics of Education Review 71: 32–48. [Google Scholar] [CrossRef]
- Baum, Sandy. 2010. Student work and the financial aid system. In Understanding the Working College Student: New Research and Its Implications for Policy and Practice. Edited by Laura W. Perna. Herndon: Stylus Publishing, pp. 3–20. [Google Scholar]
- Bok, Derek. 2015. Higher Education in America. Princeton: Princeton University Press. [Google Scholar]
- Bryan, Michael, Darryl Cooney, and Barbara Elliott. 2019. 2012/17 Beginning Postsecondary Students Longitudinal Study (BPS:12/17); Washington, DC: National Center for Education Statistics.
- Bui, Chi Binh. 2020. Các Lựa chọn trong Đầu tư vốn Con người [Choices in Human Capital Investment]. Ho Chi Minh City: General Publishing House. [Google Scholar]
- Bui, Chi Binh. 2022. Effects of Employment in the Student Loans–Student Success Relationship. Paper presented at the American Educational Research Association Annual Meeting, San Diego, CA, USA, April 21–26. [Google Scholar]
- Bui, Chi Binh, and Phuong Hoang Nguyen. 2023. Examining the Rising Cost of Public Higher Education at State Level. Paper presented at the Association for Education Finance and Policy Conference, Denver, CO, USA, March 23–25. [Google Scholar]
- Carales, Vincent D. 2020. Examining Educational Attainment Outcomes: A Focus on Latina/o Community College Students. Community College Review 48: 195–219. [Google Scholar] [CrossRef]
- Chapman, Bruce, and Lorraine Dearden. 2017. Conceptual and Empirical Issues for Alternative Student Loan Designs: The Significance of Loan Repayment Burdens for the United States. The ANNALS of the American Academy of Political and Social Science 671: 249–68. [Google Scholar] [CrossRef]
- Charron-Chénier, Raphaël, and Louise Seamster. 2021. Racialized Debts: Racial Exclusion from Credit Tools and Information Networks. Critical Sociology 47: 977–92. [Google Scholar] [CrossRef]
- Chen, Rong. 2008. Financial aid and student dropout in higher education: A heterogeneous research approach. In Higher Education: Handbook of Theory and Research. Edited by John C. Smart. Dordrecht: Springer, pp. 209–39. [Google Scholar]
- Chen, Rong, and Edward P. St. John. 2011. State Financial Policies and College Student Persistence: A National Study. The Journal of Higher Education 82: 629–60. [Google Scholar] [CrossRef]
- Cofer, Jamnes, and Patricia Somers. 2001. What Influences Student Persistence at Two-year Colleges? Community College Review 29: 56–76. [Google Scholar] [CrossRef]
- Deckard, Faith M., Bridget J. Goosby, and Jacob E. Cheadle. 2022. Debt Stress, College stress: Implications for Black and Latinx Students’ Mental Health. Race and Social Problems 14: 238–53. [Google Scholar] [CrossRef]
- Demming, Carsten L., Steffen Jahn, and Yasemin Boztuğ. 2017. Conducting Mediation Analysis in Marketing Research. Marketing: ZFP—Journal of Research and Management 39: 76–93. Available online: https://www.jstor.org/stable/26426855?seq=1#metadata_info_tab_contents (accessed on 1 July 2022). [CrossRef]
- Destin, Mesmin, and Ryan C. Svoboda. 2018. Costs on the Mind: The Influence of the Financial Burden of College on Academic Performance and Cognitive Functioning. Research in Higher Education 59: 302–24. [Google Scholar] [CrossRef]
- Dowd, Alicia C. 2008. Dynamic Interactions and Intersubjectivity: Challenges to Causal Modeling in Studies of College Student Debt. Review of Educational Research 78: 232–59. [Google Scholar] [CrossRef]
- Dowd, Alicia C., and Tarek Coury. 2006. The Effect of Loans on the Persistence and Attainment of Community College Students. Research in Higher Education 47: 33–62. [Google Scholar] [CrossRef]
- Dwyer, Rachel E. 2018. Credit, Debt, and Inequality. Annual Review of Sociology 44: 237–61. [Google Scholar] [CrossRef]
- Fairchild, Amanda J., and Heather L. McDaniel. 2017. Best (but Oft-forgotten) Practices: Mediation Analysis. The American Journal of Clinical Nutrition 105: 1259–71. [Google Scholar] [CrossRef] [PubMed]
- Federal Reserve. 2024. Consumer Credit Outstanding. Available online: https://www.federalreserve.gov/releases/g19/HIST/cc_hist_memo_levels.html (accessed on 1 January 2024).
- Gervais, Martin, and Nicolas L. Ziebarth. 2019. Life After Debt: Postgraduation Consequences of Federal Student Loans. Economic Inquiry 57: 1342–66. [Google Scholar] [CrossRef]
- Hanson, Melanie. 2022. Student Loan Debt by Race. Available online: https://educationdata.org/student-loan-debt-by-race (accessed on 15 February 2023).
- Hanson, Melanie. 2024. Student Loan Debt Statistics. Available online: https://educationdata.org/student-loan-debt-statistics (accessed on 1 May 2024).
- Hayes, Andrew F. 2017. Introduction to Mediation, Moderation, and Conditional Process Analysis: A Regression-Based Approach, 2nd ed. New York: Guilford Press. [Google Scholar]
- Herzog, Serge. 2018. Financial Aid and College Persistence: Do Student Loans Help or Hurt? Research in Higher Education 59: 273–301. [Google Scholar] [CrossRef]
- Hillman, Nicholas W. 2014. College on Credit: A Multilevel Analysis of Student Loan Default. The Review of Higher Education 37: 169–95. [Google Scholar] [CrossRef]
- Jackson, Brandon A., and John R. Reynolds. 2013. The Price of Opportunity: Race, Student Loan Debt, and College Achievement. Sociological Inquiry 83: 335–68. [Google Scholar] [CrossRef]
- Johnson, Iryna Y. 2006. Analysis of Stopout Behavior at a Public Research University: The Multi-spell Discrete-time Approach. Research in Higher Education 47: 905–34. [Google Scholar] [CrossRef]
- Kim, Dongbin. 2007. The Effect of Loans on Students’ Degree Attainment: Differences by Student and Institutional Characteristics. Harvard Educational Review 77: 64–100. [Google Scholar] [CrossRef]
- King, Gary, and Richard Nielsen. 2019. Why Propensity Scores Should Not be Used for Matching. Political Analysis 27: 435–54. [Google Scholar] [CrossRef]
- Lee, Jason C., Erin B. Ciarimboli, Paul G. Rubin, and Manuel S. González Canché. 2020. Borrowing Smarter or Borrowing More? Investigating the Effects of a Change in Federal Loan Policy. The Journal of Higher Education 91: 483–513. [Google Scholar] [CrossRef]
- Leonardo, Zeus. 2004. The Color of Supremacy: Beyond the Discourse of ‘White Privilege’. Educational Philosophy and Theory 36: 137–52. [Google Scholar] [CrossRef]
- Looney, Adam, and Constantine Yannelis. 2019. How Useful are Default Rates? Borrowers With Large Balances and Student Loan Repayment. Economics of Education Review 71: 135–45. [Google Scholar] [CrossRef]
- MacKinnon, David P. 2011. Integrating Mediators and Moderators in Research Design. Research on Social Work Practice 21: 675–81. [Google Scholar] [CrossRef]
- Malcom, Lindsey E., and Alicia C. Dowd. 2012. The Impact of Undergraduate Debt on the Graduate School Enrollment of STEM Baccalaureates. The Review of Higher Education 35: 265–305. [Google Scholar] [CrossRef]
- Marx, Benjamin M., and Lesley J. Turner. 2019. Student Loan Nudges: Experimental Evidence on Borrowing and Educational Attainment. American Economic Journal: Economic Policy 11: 108–41. [Google Scholar] [CrossRef]
- McBee, Matthew. 2022. Statistical Approaches to Causal Analysis. London: Sage Publications. [Google Scholar]
- McGee, Ebony O., and Danny B. Martin. 2011. “You Would Not Believe What I Have to Go Through to Prove my Intellectual Value!” Stereotype Management Among Academically Successful Black Mathematics and Engineering Students. American Educational Research Journal 48: 1347–89. [Google Scholar] [CrossRef]
- McGee, Ebony O., Bhoomi K. Thakore, and Sandra S. LaBlance. 2017. The Burden of Being “Model”: Racialized Experiences of Asian STEM College Students. Journal of Diversity in Higher Education 10: 253–70. [Google Scholar] [CrossRef]
- McGee, Ebony. 2018. “Black Genius, Asian Fail”: The Detriment of Stereotype Lift and Stereotype Threat in High-achieving Asian and Black STEM Students. AERA Open 4: 2332858418816658. [Google Scholar] [CrossRef]
- McKinney, Lyle, and Andrea Backscheider Burridge. 2015. Helping or Hindering? The Effects of Loans on Community College Student Persistence. Research in Higher Education 56: 299–324. [Google Scholar] [CrossRef]
- McKinney, Lyle, Moumita Mukherjee, Jerrel Wade, Pamelyn Shefman, and Rachel Breed. 2015. Community College Students’ Assessments of the Costs and Benefits of Borrowing to Finance Higher Education. Community College Review 43: 329–54. [Google Scholar] [CrossRef]
- Mendoza, Pilar. 2012. Should I Work or Should I Borrow? Counterfactual Analysis on the Effect of Working While Enrolled and Debt on Baccalaureate Completion. Journal of Student Financial Aid 42: 2. [Google Scholar] [CrossRef]
- Mueller, Holger M., and Constantine Yannelis. 2019. The Rise in Student Loan Defaults. Journal of Financial Economics 131: 1–19. [Google Scholar] [CrossRef]
- Mukherjee, Moumita, Lyle McKinney, Linda Serra Hagedorn, Agustina Purnamasari, and Franco Santiago Martinez. 2017. Stretching Every Dollar: The Impact of Personal Financial Stress on the Enrollment Behaviors of Working and Nonworking Community College Students. Community College Journal of Research and Practice 41: 551–65. [Google Scholar] [CrossRef]
- Museus, Samuel D. 2011. Generating Ethnic Minority Student Success (GEMS): A Qualitative Analysis of High-Performing Institutions. Journal of Diversity in Higher Education 4: 147–62. [Google Scholar] [CrossRef]
- Musoba, Glenda Droogsma, and Dmitriy Krichevskiy. 2013. Early Coursework and College Experience Predictors of Persistence at a Hispanic-serving Institution. Journal of Hispanic Higher Education 13: 48–62. [Google Scholar] [CrossRef]
- National Student Clearinghouse Research Center. 2024. Current Term Enrollment Estimates: Fall 2023. Available online: https://nscresearchcenter.org/current-term-enrollment-estimates/ (accessed on 20 March 2024).
- Rubin, Paul G., Meredith S. Billings, Lindsey Hammond, and Denisa Gándara. 2022. State Higher Education Funding During COVID-19: Exploring State-level Characteristics Influencing Financing Decisions. American Behavioral Scientist 67: 1468–86. [Google Scholar] [CrossRef]
- Sablan, Jenna, and Robyn Hiestand. 2020. A Primer on Higher Education, Student Aid, and the Federal Budget Process. Journal of Student Financial Aid 49: 5. [Google Scholar] [CrossRef]
- St. John, Edward P., Nathan Daun-Barnett, and Karen M. Moronski-Chapman. 2018. Public Policy and Higher Education: Reframing Strategies for Preparation, Access, and College Success. New York: Routledge. [Google Scholar]
- Stater, Mark. 2009. The Impact of Financial Aid on College GPA at Three Flagship Public Institutions. American Educational Research Journal 46: 782–815. [Google Scholar] [CrossRef]
- Taylor, Barrett J., and Brendan Cantwell. 2019. Unequal Higher Education: Wealth, Status, and Student Opportunity. New Brunswick: Rutgers University Press. [Google Scholar]
- The Institute for College Access and Success. 2017. College Costs in Context: A State-by-State Look at College (Un)affordability. Available online: https://ticas.org/affordability-2/college-costs-context/ (accessed on 5 June 2020).
- Winkle-Wagner, Rachelle, and Angela M. Locks. 2019. Diversity and Inclusion on Campus: Supporting Students of Color in Higher Education. London: Routledge. [Google Scholar]

Disclaimer/Publisher’s Note: The statements, opinions and data contained in all publications are solely those of the individual author(s) and contributor(s) and not of MDPI and/or the editor(s). MDPI and/or the editor(s) disclaim responsibility for any injury to people or property resulting from any ideas, methods, instructions or products referred to in the content. |
© 2024 by the author. Licensee MDPI, Basel, Switzerland. This article is an open access article distributed under the terms and conditions of the Creative Commons Attribution (CC BY) license (https://creativecommons.org/licenses/by/4.0/).