Article

Hiding the Hate—Contextual Effects on Hate Crime Reports

by
Armin C. D. Küchler
Department of Sociology, Bielefeld University, 33615 Bielefeld, Germany
Soc. Sci. 2024, 13(9), 466; https://doi.org/10.3390/socsci13090466
Submission received: 14 July 2024 / Revised: 30 August 2024 / Accepted: 1 September 2024 / Published: 3 September 2024
(This article belongs to the Section Crime and Justice)

Abstract

:
This study examines the influence of local norm shifts driven by white supremacist ideology on hate crime reporting by US law enforcement agencies. Results show a substantial association, indicating a threefold increase in expected hate crimes reports in counties experiencing a spike in local hate group activity. Specifically, Republican vote share acts as a moderator, reducing reported hate crimes by 23% in counties with strong Republican support and right-wing hate group presence. Adjacent Republican counties also show a 13% reduction in expected reports, suggesting a spillover effect. Beyond local politics, a regional impact is evident; Northeastern counties with higher right-wing hate group presence show a 23% lower incidence rate. Using longitudinal data from the FBI UCR, SPLC, MIT Election Lab, and the US Census (2010–2020), through negative binomial regressions, this study highlights how right-wing hate groups can affect law enforcement’s enforcement of general civil rights depending on the local context.

1. Introduction

Since its inception, the USA has struggled with the persistent problem of bias-motivated hate. In general, hate crimes1 can be seen as crimes that convey messages within socially constructed communities and serve as a warning to maintain power structures (Malcom and Lantz 2021, p. 1148; Perry 2001). These crimes, often committed by ordinary individuals, are influenced by extremist agitation from hate groups, whether online or through physical presence (Levin and McDevitt 2013; Ryan and Leeson 2011, p. 259). Despite this social impact, hate crimes did not become a legal construct until the Civil Rights Act of 1968.
Nowadays, bias-motivated crimes are recorded by the FBI’s Uniform Crime Reporting (UCR) program (US Department of Justice 2023). Hate crimes, according to the FBI, involve violence or criminal threats driven by bias based on factors like race, color, national origin, religion, sex, sexual orientation, gender identity, marital status, or disability (US Department of Justice 2022, p. 6). Critics, such as Masucci (2017), contend that the UCR significantly underrepresents hate crime incidence. Notably, the NCVS estimated an annual average of 250,000 hate crime victims between 2004 and 2015, while the UCR reported only 6844 hate crimes per year on average during the same period (Masucci 2017, p. 1). Because of this discrepancy, the following analysis aims at the local context that produces hate crime reports rather than hate crimes themselves (Kitsuse and Cicourel 1963, p. 135). I, therefore, interpret the number of officially reported hate crimes as an indicator of the degree to which local law enforcement agencies enforce general civil rights rather than as a measure of the actual occurrence of bias-motivated deviant behavior (Black 1970; King 2007). I justify this interpretation of official hate crime reports by arguing that hate crime legislation was created to protect vulnerable groups and thus requires the enforcement of universal civil rights (King 2007, p. 190; van Kirk and Hodge 2016). The UCR’s hate crime statistics serve more as approximations of enforced societal norms and values—more specifically, the acceptance of universal civil rights—than as accurate measures of bias-motivated crimes, and from this perspective are in themselves a “social fact” (Black 1970, p. 734).
UCR hate crime reporting depends on local law enforcement and is subject to error, including officers’ inability to identify bias-motivated crimes. Factors such as the local context, sociodemographics, and political culture of a jurisdiction influence the overall reporting of hate crimes (Disha et al. 2011; McVeigh et al. 2003; Nolan and Lang 2015). However, the responsibility for reporting lies not only with law enforcement, but also with society at large, where victims may refrain from reporting crimes due to fear, distrust, or desensitization to prejudice (Chakraborti 2015, p. 19; Malcom and Lantz 2021, p. 1161; Perry 2001, p. 12). There is also evidence that social movements, such as the civil rights movement, can influence reporting behavior (Mason 2015; McVeigh et al. 2003).
In light of this introduction, this article addresses the research question of how the influence of white supremacist norms in a conservative local society correlates with a reduced prevalence of universal civil rights. This outcome is measured by the enforcement of hate crime reporting by local law enforcement agencies.
The following sections review the theoretical framework and existing research on the impact of local white supremacy norms and their potential impact on the prevalence of universal civil rights in the form of official hate crime reports. This is followed by an overview of the data sources, the methodology used, the presentation of results, and their interpretation. Finally, the implications, limitations, and a critical conclusion regarding hate crime reporting in the UCR are discussed.

2. Theoretical and Empirical Background

In sociology and related fields, contextual effects refer to the impact of social, cultural, and political factors within specific settings on individual behavior. For instance, McVeigh et al. (2014) showed that Southern counties exposed to Ku Klux Klan (KKK) activities in the 1960s tended to vote more Republican even decades later. These effects involve local culture, regional public opinion, or the political/social environment influencing individuals (Agnew 1996; Blevins and Todd 2022; Crowder and South 2008; Druckman et al. 2021; Lieske 2010). This reveals diverse social dynamics with spatial and/or temporal aspects that affect people in specific areas. In addition, social interactions within a geographic area involve various opportunities for interpersonal influence (Stipak and Hensler 1982). These interactions negotiate social norms and define informal standards within a community (Anoll 2018, p. 495). It is crucial to note that these norms and values relate to moral rather than legal standards (Anoll 2018; Cialdini and Trost 1998; Tankard and Paluck 2016). Norm negotiation and resulting actions depend not only on social relationships but also on the institutions or organizations present in a space (Agnew 1996, p. 131). Social control, starting from active local community actors, significantly influences these dynamics (Lim and MacGregor 2012, p. 749). To comprehend local attitudes and actions in specific spatial and temporal contexts, capturing relevant aspects of the social structure is essential (Agnew 1996, p. 131).

2.1. Traces of White Supremacy as the Root Cause

This study posits a spatially specific impact on the enforcement of hate crime reporting behavior (Disha et al. 2011; King 2007; King et al. 2009; McVeigh et al. 2003). Building on prior theory, I assert that latent or manifest expressions of social norms at the county level, driven by white supremacy attitudes, detrimentally affect the enforcement of hate crime reporting. White supremacy, defined as a worldview emphasizing differences among people based on various characteristics, perpetuates racially motivated distinctions where whites are perceived as generally superior (Ferber 1998, p. 54; Pulido 2015, p. 814). This socially constructed division mirrors hierarchical power relations in society (Ferber 1998, p. 53; Morris 2022) and carries social, political, and economic consequences, advantaging whites over People of Color (Blevins and Todd 2022, p. 62; Bonds and Inwood 2016, p. 720; McDermott and Samson 2005, p. 252; Parker and Towler 2019, p. 506). However, white supremacy does not simply mean the racist supremacy of whites. Rather, this worldview systematically excludes dissenting groups in general on the basis of skin color, race, religion, sexual orientation, or differing worldviews (Beck 2000, p. 169; Perry 2001, pp. 145–48; Simi et al. 2017, p. 1174). Based on this definition, a direct link can be made between people with white supremacist attitudes and the motivation to commit a wide range of hate crimes in order to enforce a white supremacist worldview, which targets not only People of Color. For example, people with disabilities (Reynolds 2022), or homosexuals, or those with lifestyles that do not conform to a traditional, strictly Christianized role model can also be targeted, meaning that white women can also become potential targets if they behave in a way that deviates from a white supremacist worldview (Liu 2017).

2.2. Advocates of White Supremacy—Right-Wing Hate Groups

Based on the above, it is assumed that locally active right-wing hate groups can serve as a useful proxy for white supremacist attitudes (Chermak et al. 2013; Perry 1998, p. 199, 2001, p. 137; Weiner and Zellman 2022, p. 708). In the USA, different categories of hate groups have been identified that can be associated with different extremist worldviews. In the following, we focus on the broadest subcategory of hate groups, namely right-wing extremist hate groups that can be associated with the worldview of white supremacy. Such groups include the Neo-Confederates, the KKK, skinheads, and the Proud Boys, all of which are found throughout the USA (Southern Poverty Law Center 2023b).
Since their prevalence is not randomly distributed across the U.S., it is reasonable to assume that it depends on some sort of contextual effects. Research in this regard suggests that hate groups are significantly more prevalent in metropolitan statistical areas (MSAs) (Goetz et al. 2012, p. 387; Mulholland 2010, p. 484) and former territories of the Confederate States of America (Durso and Jacobs 2013; Jefferson and Pryor 1999, p. 393; McVeigh et al. 2014; Weiner and Zellman 2022, p. 716). However, there are conflicting findings regarding the economic context, with varying assessments of the contribution of economic factors, including county-level poverty rates (Mulholland 2010), higher incomes, and income inequality (Goetz et al. 2012, p. 388). Economic tensions, coupled with norms of white privilege and increasing ethnic diversity among white populations, can lead to “economic alienation” and foster the emergence of hate groups (Durso and Jacobs 2013, p. 140; McCann 2009, p. 47; Weiner and Zellman 2022, p. 709). Similarly, the inconsistent impact of regional educational attainment on hate group formation has been highlighted by Medina et al. (2018, p. 10) and older studies (Durso and Jacobs 2013, p. 136; McVeigh et al. 2014, p. 1157).
Beyond the influences associated with the emergence of right-wing hate groups, evidence supports their impact on negotiation processes in society. McVeigh et al. (2014) identify a relationship between KKK group activities and sustained conservative voting in southern counties, suggesting hate groups’ potential to influence political processes (Fording and Schram 2020; Weiner and Zellman 2022, p. 716). Hate groups foster latent prejudice in local society, intending to provoke various forms of violence (Levin 2007). They may serve as an impetus for violent actions by ordinary community members sharing white supremacist attitudes (Levin and McDevitt 2013; Ryan and Leeson 2011, p. 259). The argument relating to hate groups’ positive influence on hate crime reporting is contentious, with studies showing both no impact (Ryan and Leeson 2011) and a general effect of white supremacy hate groups on hate crime reporting (Mulholland 2013). The latter suggests a 19% increased likelihood of hate crime reporting in counties with an active group (Mulholland 2013, p. 93), emphasizing that these groups emerge as ideologically motivated social movements (Mulholland 2013, p. 109). Adamczyk et al. (2014) found a relationship between active hate groups and right-wing extremist crimes at the county level without using the FBI’s Hate Crime Statistics database. Spatial analyses by Jendryke and McClure (2019, p. 8) found a relationship between hate groups and hate crimes tracked by the SPLC without controlling for additional covariates. Recent studies present an inconsistent picture, with DiLorenzo (2021) finding a correlation between trade layoffs and hate groups, but no corresponding increase in hate crime reporting by law enforcement.
This inconsistent study landscape is due not only to different approaches to statistical analysis, but also to fundamental differences in the definition of key research variables. Studies often use the SPLC hate group database (Southern Poverty Law Center 2023b) or FBI UCR hate crime data (US Department of Justice 2022), sometimes with or without ideological restrictions that exclude categories of hate groups or hate crime reports, leading to disparate results (DiLorenzo 2021). Nevertheless, given the “noisy measure” nature of the available data, right-wing hate groups serve as a proxy for spatially dependent norm negotiations in the context of white supremacy (Mulholland 2013, p. 110). Therefore, based on the SPLC’s qualitative assessment (Southern Poverty Law Center 2023a), it is assumed that right-wing hate groups are associations of individuals motivated by an ideology consistent with white supremacy, and that these groups have some local presence and activity, even though the SPLC cannot provide precise data on the size and financial strength of the groups or their exact activities. Excluding this limitation, the following first hypotheses is assumed:
H1. 
The presence of locally active white supremacist hate groups decreases the expected number of hate crime reports by local law enforcement.
In addition to this alleged direct local influence of right-wing hate groups, it is assumed that there is also an influence on directly neighboring counties and that the normative sphere of influence of right-wing hate groups thus extends to neighboring counties. The corresponding second hypothesis is as follows:
H2. 
Active white supremacist hate groups have a spillover effect in terms of reducing the expected number of hate crime reports by local law enforcement in spatially adjacent counties.

3. White Privilege as a Mild Surrogate of White Supremacy

Intertwined with white supremacy, and therefore far-right hate groups, is white privilege (Bonds and Inwood 2016; Pulido 2015). Their link illustrates how aspects of the supremacist worldview have diffused into US social dynamics. White privilege as a social mechanism simply describes the advantage that white people have in society because of their skin color (Pulido 2015, p. 810). This encompasses classist or patriarchal privileges aligned with social norms originating from the white supremacist worldview (Blevins and Todd 2022). Since the 1990s, critical examination of white privilege has revealed that racist dynamics may stem not necessarily from hostile white attitudes but from seeking societal benefits for oneself or relatives (Pulido 2015, pp. 810–12). Mild manifestations of white dominance may lead to a lack of awareness among whites about exclusionary social consequences (Hays et al. 2008), perpetuating an exclusionary system under white dominance (Embrick and Moore 2020, p. 1941; Lipsitz 2011, p. 209). Disregarding or questioning these social norms can result in sanctions imposed by ordinary residents or authorities2 (Embrick and Moore 2020, p. 1938). As with the discussion of white supremacy, a broad definition of the term “white privilege” is used here, as it would be wrong to limit the social impact to racial favoritism alone. Rather, white privilege must be seen as a milder form of white supremacy because it represents and reproduces a classically conservative view of society that is not reflected in things like gender diversity or progressive worldviews.
Based on the above, and the aim of this study to examine the contextual impact of local social influences, the Republican vote share in past presidential elections is used as a proxy for indicating political conservatism. It is crucial to note that I do not assert a direct alignment between Republican-voting counties and white supremacy. In fact, a robustness test reveals fewer hate groups in Republican counties (see Table S5 in the Supplementary Materials). However, I propose an interaction effect between conservative counties and right-wing hate groups, expecting a lower prevalence of universal civil rights in these counties. This assumption is grounded in analyses of party membership shifts, highlighting a significant white voter shift to the Republican Party, associated with racial conservatism, rejection of civil rights, and emphasis on cultural traditionalism (Reny et al. 2019, pp. 94–95; Zingher 2018). This leads to the following hypotheses:
H3. 
Local conservative public opinion amplifies the effect of active white supremacist hate groups on reducing the expected number of hate crime reports in counties.
Furthermore, based on the literature discussed, a regional difference is also assumed in this context, which is why an additional hypothesis is considered in this regard:
H4. 
The effect of active white supremacist hate groups on the expected decline in hate crime reports depends on the regional context of a county.

4. Data

To test the hypotheses, various data sources were utilized to capture contextual impacts at the county level. The focus included publicly accessible information from the FBI, SPLC, MIT Election Data Science Lab, and American Community Survey (ACS), spanning the years 2010 to 2020 and covering the continental USA and Hawaii. The analysis encompassed 3143 counties or comparable entities according to the US Census Bureau. Despite missing values, an initial panel dataset of 34,180 data points for 3114 counties was constructed over the specified period. Missing values were due to incomplete presidential election information or ACS data for individual counties with very small populations.

4.1. Dependent Variable

Officially reported hate crime information was derived from the UCR program of the FBI within the DOJ (US Department of Justice 2022). The FBI releases annual statistics based on reported cases from individual law enforcement agencies nationwide. The hate crime data are merged with county-level units by tracking reporting law enforcement agencies. The diversity of reported crimes includes offenses like murder, harassment, or theft, with the central criterion being prejudicial motivation (US Department of Justice 2023). Table S6 in the online Supplementary Materials provides a detailed overview of the frequencies of reported hate crimes by type. The FBI classifies hate crimes into categories such as race, sexual orientation, disability, gender, ethnicity/national origin, religion, color, and gender identity (US Department of Justice 2023). For this study, offenses classified as anti-white or anti-male were excluded, as these groups are not structurally targeted by white supremacist hostility. In addition, the reported crime must have been committed by a white or unidentifiable/unknown racial category. While the latter still allows for the possibility that, for example, anti-LGBTQ hate crimes may have been committed by non-white people, this potential measurement bias is accepted because further research suggests that hate crimes are disproportionately committed by white people and the chances of the unknown perpetrator being white are therefore quite high (Dunbar et al. 2005, p. 8; van Kirk and Hodge 2016, p. 4). An additional robustness test shows that there is no significant difference between the dynamics of reported hate crimes for white and unknown perpetrators, but there is a significant difference for non-white perpetrators. This suggests that the underlying social mechanisms are similar for white and unknown perpetrators but substantially different for non-white perpetrators in the research context analyzed here (see Table S7 in the online Supplementary Materials). Despite potential differences in the likelihood of reporting for different types of hate crimes, these have been combined for analysis, with a focus on overall law enforcement reporting behavior as an indicator of the intensity of civil rights enforcement. This aligns with the common approach in research on differential reporting probabilities (Dugan and Chenoweth 2020; King 2007; McVeigh et al. 2003). The spatial distribution of hate crime reports per 100,000 population for the pooled study period is shown in Figure 1. Additional detailed figures for all years are available in the online appendix (see Figure A1 in the online Appendix A).
For the multivariate analysis, a strategy was employed to mitigate bias in the hate crime reports database. Following Piatkowska et al.’s (2018) suggestion, two types of models with identical specifications but different assumptions regarding zero values were calculated. The primary reference was given to models based on a restricted database, considering only cases where law enforcement agencies reported hate crimes within the defined framework. A zero value was assumed if hate crimes were reported outside this definitional framework (anti-white and anti-male). This approach ensured the inclusion of counties where law enforcement agencies demonstrated at least partial compliance with official hate crime reporting requirements (Dugan and Chenoweth 2020; McDevitt et al. 2003; Perry 2010; Piatkowska et al. 2018, p. 8).

4.2. Independent Variables

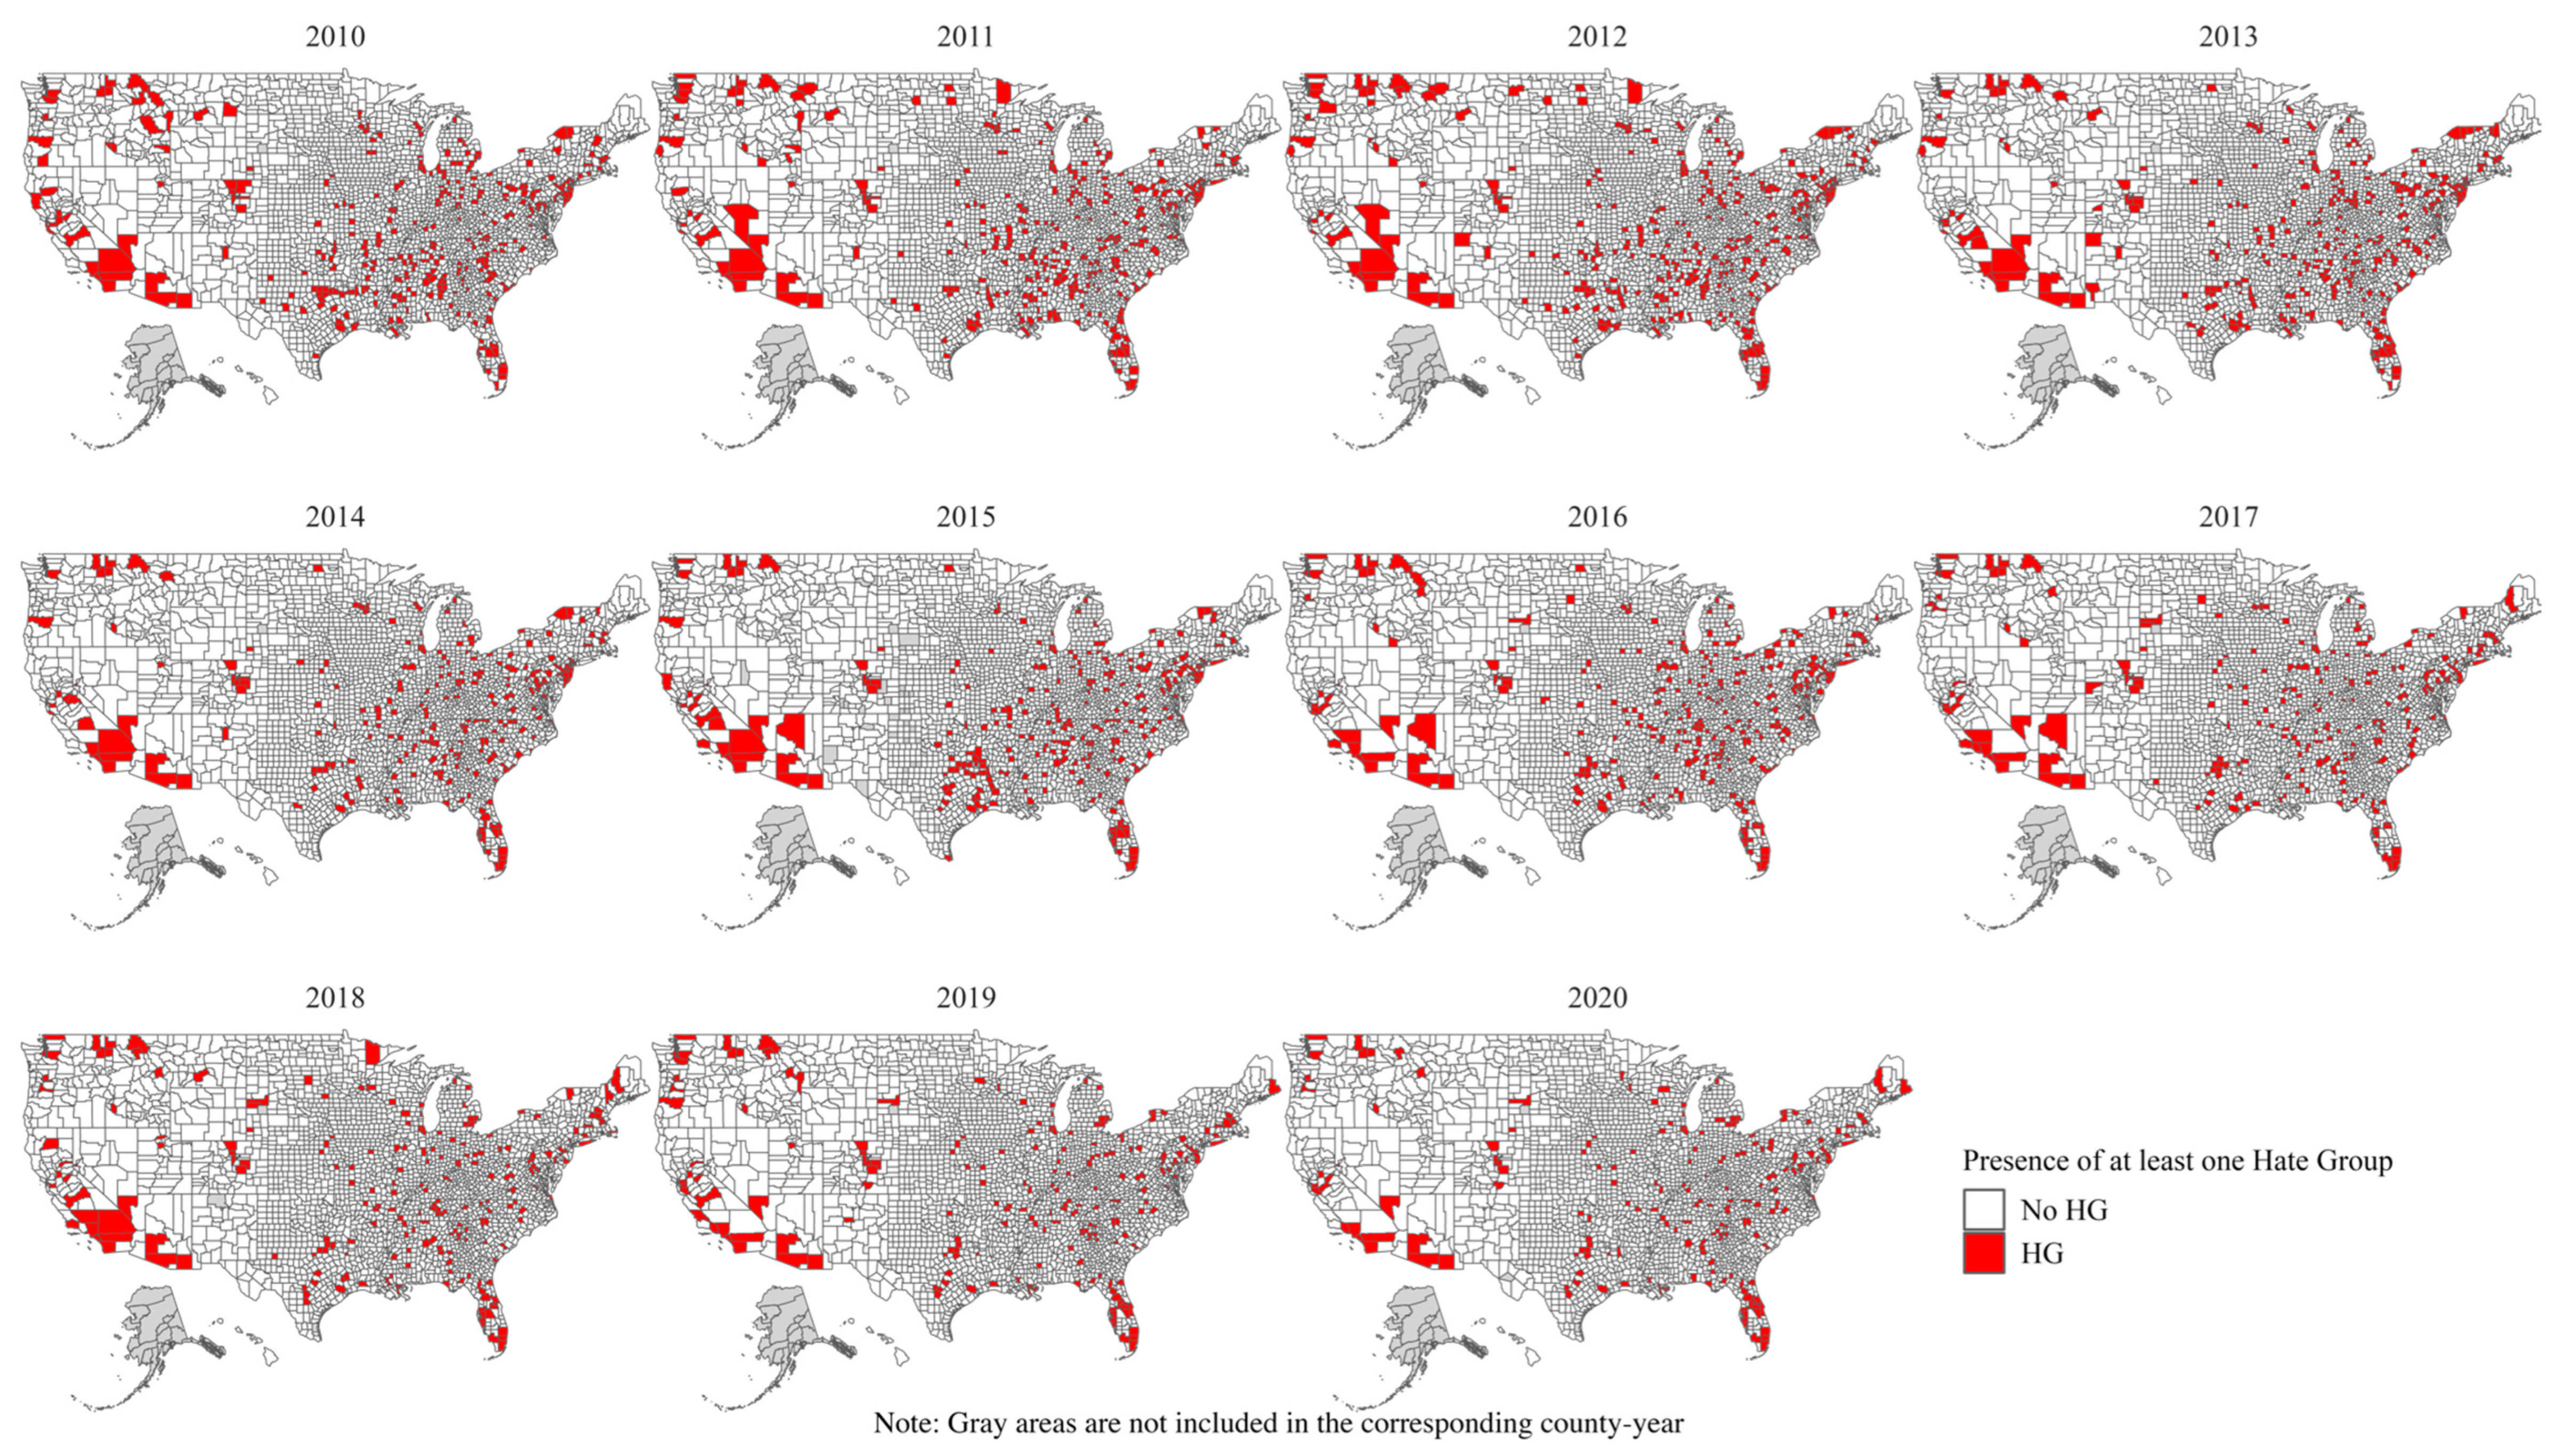
The central independent variable encompassed information on active hate groups sourced from the SPLC Hate Map from 2010 to 2020 (Southern Poverty Law Center 2023b), offering comprehensive monitoring of such groups in the USA. Hate groups are defined as associations targeting specific groups in actions (Southern Poverty Law Center 2023a), including ideologically right-wing extremist and other politically oriented groups. Focused on white supremacy, the analysis includes groups like Christian fundamentalist, anti-immigrant, KKK, and Proud Boys groups. While acknowledging potential SPLC limitations, the approach aligns with McVeigh et al.’s (2003, p. 854) argument, assuming SPLC’s monitoring captures all relevant hate groups regionally. Two indicators are defined: the share of hate groups per 100,000 population at the county level and a spatially lagged variable accounting for neighboring counties with active hate groups, indicating a potential spill-over effect3. Figure 2 provides a descriptive overview of the spatial distribution of hate groups in relation to the population pooled for the observation period from 2010 to 2020. A version separated for each year can be found in the appendix (see Figure A2 in the online Appendix A). Table 1 provides a descriptive overview.
Another key independent variable measuring a county’s political orientation is the Republican vote share in presidential elections, utilizing MIT Election Lab data (MIT Election Data and Science Lab 2022). This indicator reflects the Republican vote share in the presidential election for the corresponding year, with county-specific values fixed between election years. This means that for the years between elections, the values are fixed at the value of the last election, so for example, the values between 2012 and 2016 are fixed at the 2012 presidential election. The Republican vote share represents the percentage of votes received by each Republican candidate out of the total votes cast for Republican and Democratic candidates within a county. Conservative voting counties are assumed to be more susceptible to attitudes like white privilege, though not directly equated with a white supremacist worldview.
In addition to the primary independent research variables, several supplementary covariates were considered. The crime rate was calculated using data from the FBI for all studied counties, combining all reported crimes (violent and property offenses) in relation to the county’s population (refer to Table 1). Additional covariates were extracted from the 5-year estimate of the ACS (US Census Bureau 2023), including an indicator of migration patterns between counties within the same state and the proportion of persons born abroad. Age-sensitive indicators were also created to determine the proportion of young blacks and whites (under age 25) in each county. The literature review highlighted the importance of economic factors in explaining the hypotheses under consideration. As a result, the models included the share of unemployment and the share of people living below the poverty line in the past 12 months. In addition, an additive index was created from the variables per capita income and persons with at least a bachelor’s degree, as these two indicators are highly correlated. A correlation table of all metric variables used can be found in the online Supplementary Materials (Table S1 in the online Supplementary Materials).
Finally, a dummy variable was created to determine each county’s location in the official Northeast, South, Midwest, or West region. Notably, for this variable, I considered the District of Columbia (DC) as part of the Northeast. In consideration of the varying measurement and contextual aspects of the covariates, all continuous predictors were log-transformed. A summary of all the variables discussed can be found in Table 1.

5. Method

To address varying assumptions about zero values in hate crime reporting, distinct regressions were employed. Given a restricted dataset (n = 9802), negative binomial regressions described the distribution of official hate crime numbers. Overdispersion, where variance surpasses the mean, was present, justifying the choice of negative binomial models over Poisson models (Heilbron 1994; Loeys et al. 2012). Only counties with verifiable hate crime reports were included, resulting in a moderate number of zeros (nNull = 965 vs. n > Null = 8837), excluding the need for zero-inflated models. The natural logarithm of population divided by 10,000 in each county served as an offset, with random effects for county and investigation year addressing clustered data. All coefficients were estimated using a maximum likelihood approach4.
The analysis was reiterated using the full dataset (n = 34,180), interpreting absence of a report as an actual zero value (nNull = 25,343 compared to n > Null = 8837). These alternative models and a brief methodological discussion are detailed in the online Supplementary Materials (Table S2 in the online Supplementary Materials). No significant differences in primary research variables, except for some control variables, were observed. Therefore, subsequent results focus on the limited dataset.

6. Results

Table 2 presents incidence rate ratios (IRRs) of conditional fixed-effect models and standard errors for four calculations. The IRR offers insight into risk of exposure, indicating the relative occurrence of hate crime reporting by law enforcement. AIC, BIC, and log-likelihood assess overall model quality. The fixed effects in Models 1 through 4, when compared to a baseline model, showed an improvement, with the marginal pseudo R2 values ranging from 8.2% to 8.4%. This suggests that the fixed effects in these models provided a better fit to the data than the baseline model, when not considering the random effects. By taking into account the random effects (random slopes for counties and years), the conditional pseudo R2 values for these models were approximately 27%. This indicates that the inclusion of both fixed effects and random effects in these models provided a better fit to the data, in comparison to a model with fixed effects alone. However, it is important to remember that these pseudo R2 values cannot be interpreted as the proportion of variance in law enforcement hate crime reporting that is explained by the models, as would be the case in ordinary least squares regression. Instead, they provide a measure of the relative improvement in model fit when including the fixed effects (marginal R2) and both fixed and random effects (conditional R2).
Examining key independent variables in the first model, the share of active hate groups in a county showed an IRR greater than 1, though not statistically significant (p = 0.178). The spatial lag variable decreased expected hate crime reports by 6% at a significant level (p = 0.021). Current Republican vote share demonstrated a significant 31% decrease in expected hate crime reports for every 1% increase (p < 0.001). The regional indicator also had a significant decreasing effect, reducing expected reports by 18% (p = 0.003) for Midwest counties and 16% (p = 0.013) for South counties relative to the West.
Examining additional covariates, general crime reporting had a very significant effect (p = 0.005), with an IRR indicating a 14% increase in expected hate crime reports for every 1% increase in crime rate. Migration within a state showed a highly significant increasing effect in all models (p < 0.001). The share of people not born in the USA was associated with a significantly lower expected number of reports (IRR = 0.76, p < 0.001). Whites under 25 had no significant effect, while a 1% increase in blacks under 25 was associated with a 28% decrease in expected hate crimes (p < 0.001), consistent across all models. The proportion of people below the poverty line significantly increased expected hate crimes. However, unemployment and the income and education index decreased the expected hate crime reports. Together, these findings suggest a complex interplay of factors influencing hate crime reporting by local law enforcement.
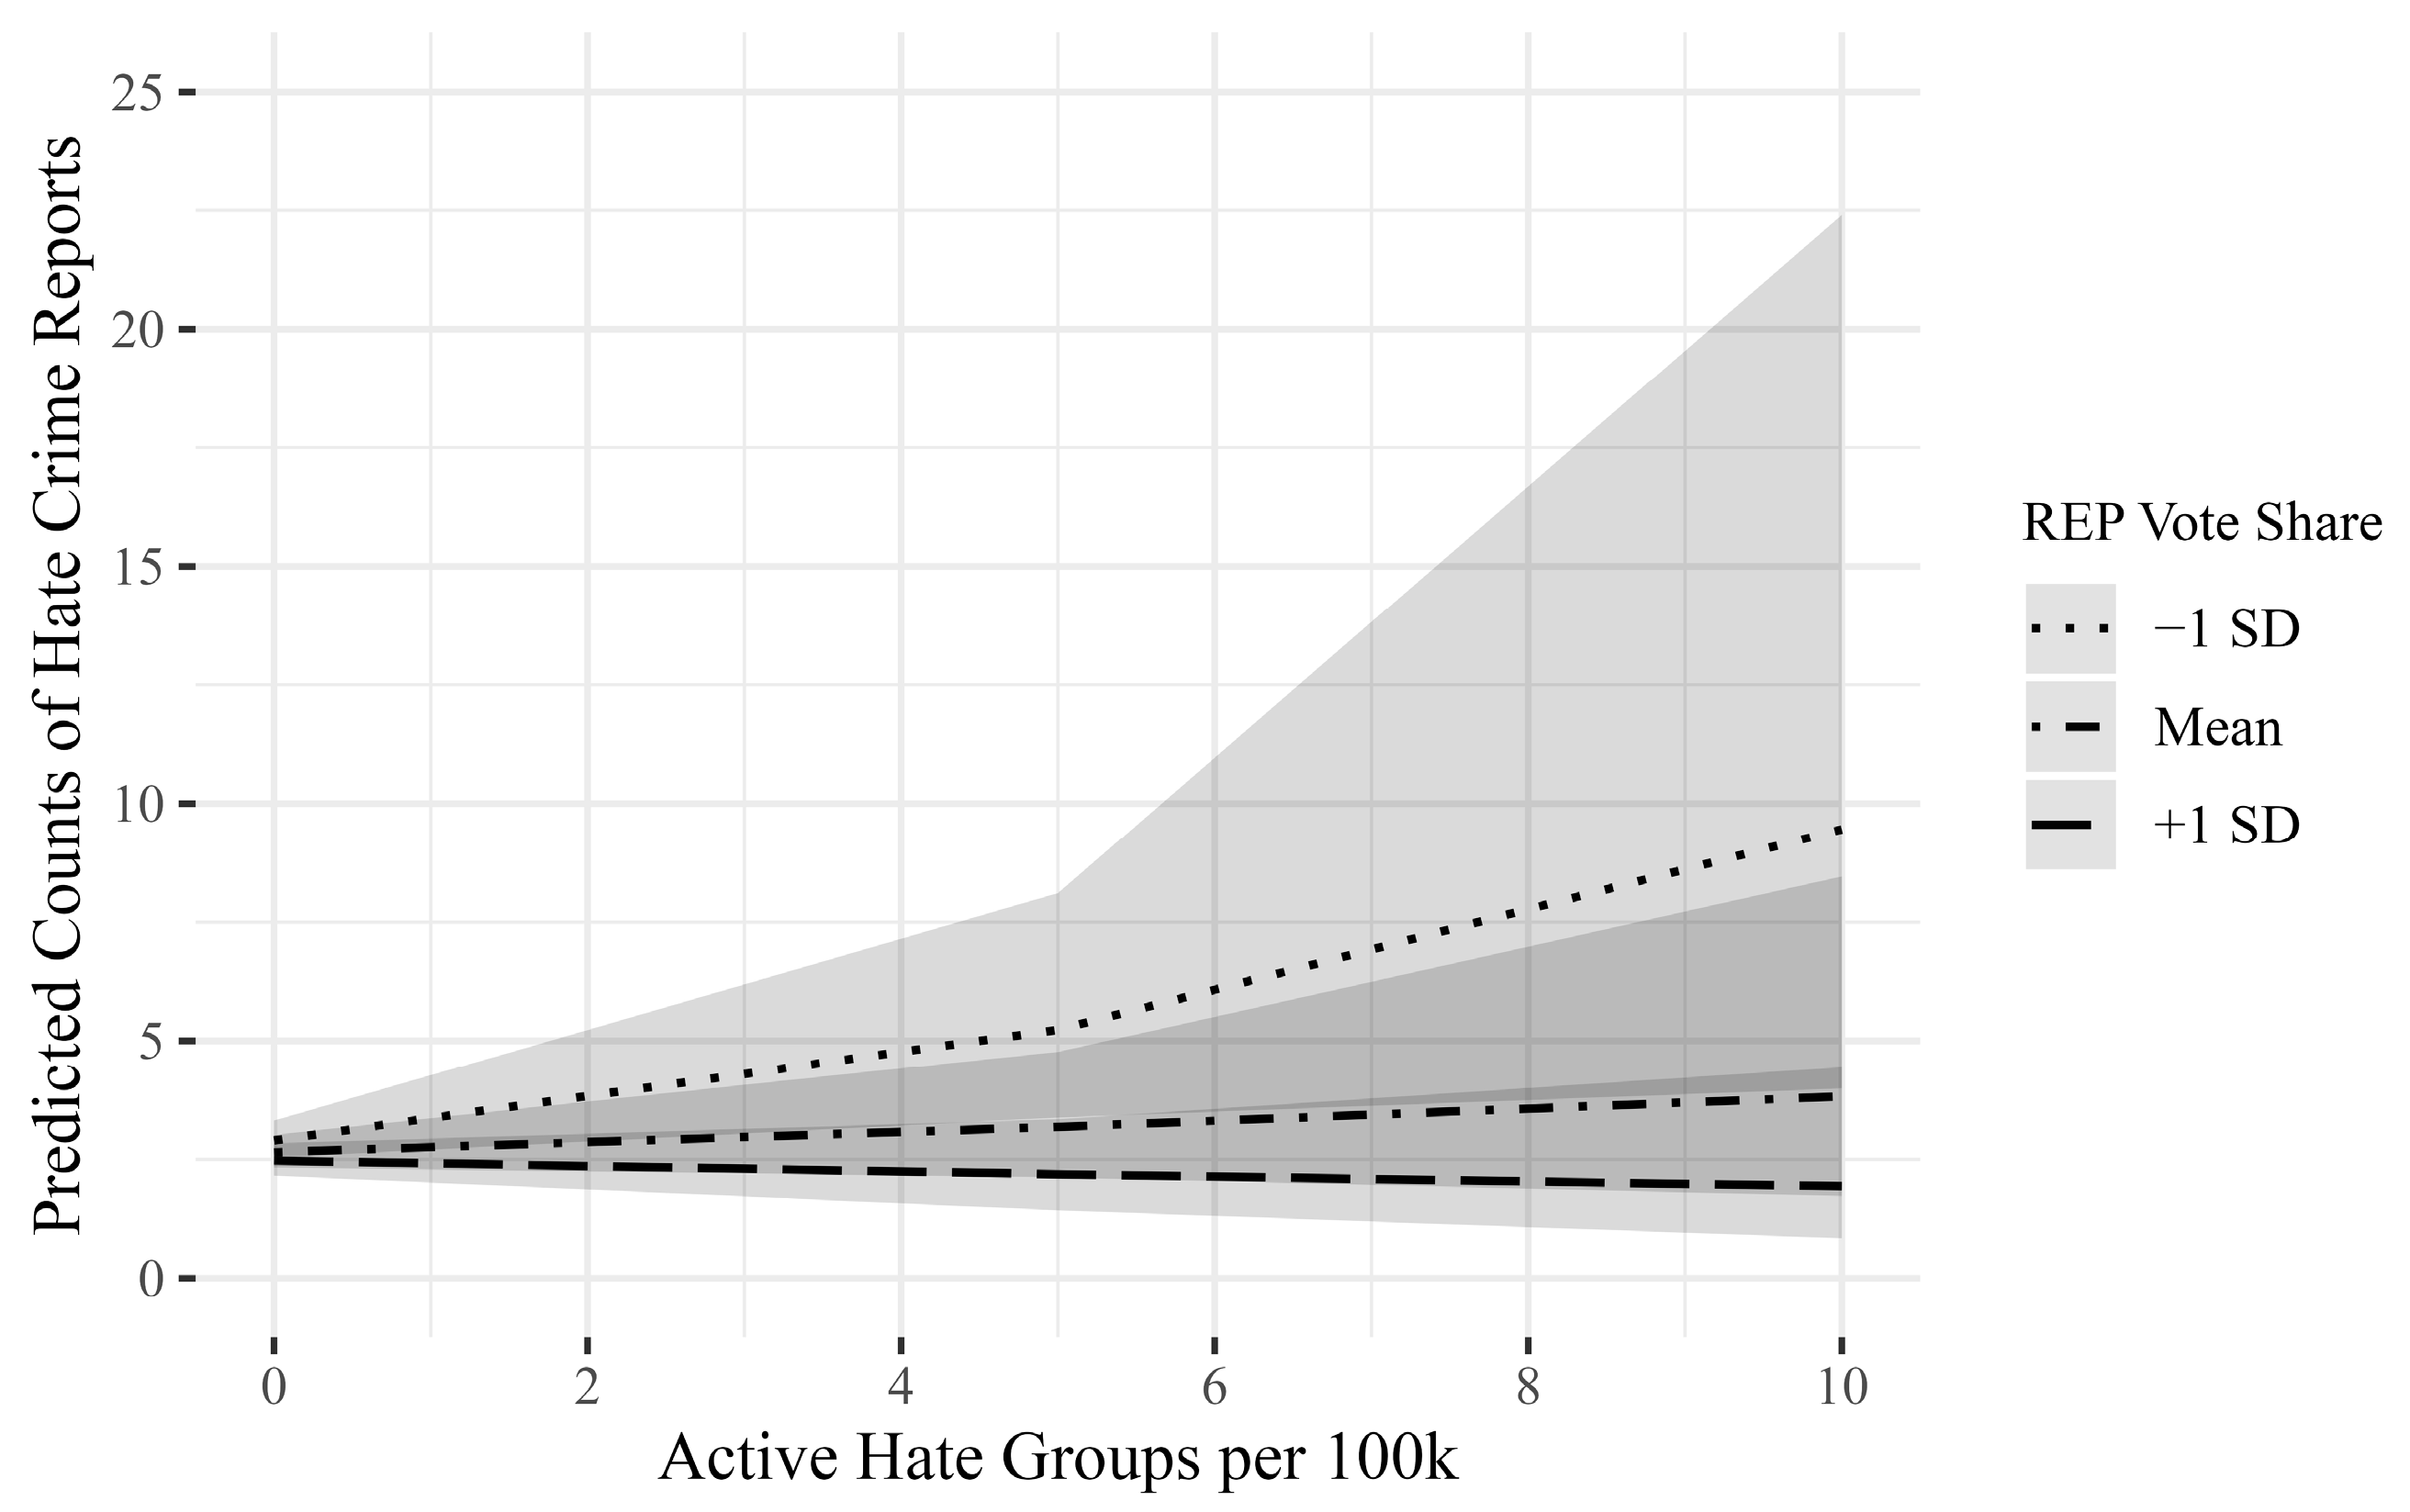
Model 2 explored interaction effects, revealing notable effects between active hate groups and neighboring counties in terms of Republican vote share. A unit increase in hate group share was associated with a 16% lower expected number of hate crime reports in more conservative counties (p < 0.001). The effect weakened slightly for neighboring counties, reducing expected reports by 14% (p = 0.004). In contrast, more liberal counties (see main effects of hate groups) and those bordering counties with active hate groups tended to have higher expected hate crime reports. Figure 3 and Figure 4 show graphical representations of the interaction effects in the full Model 4.
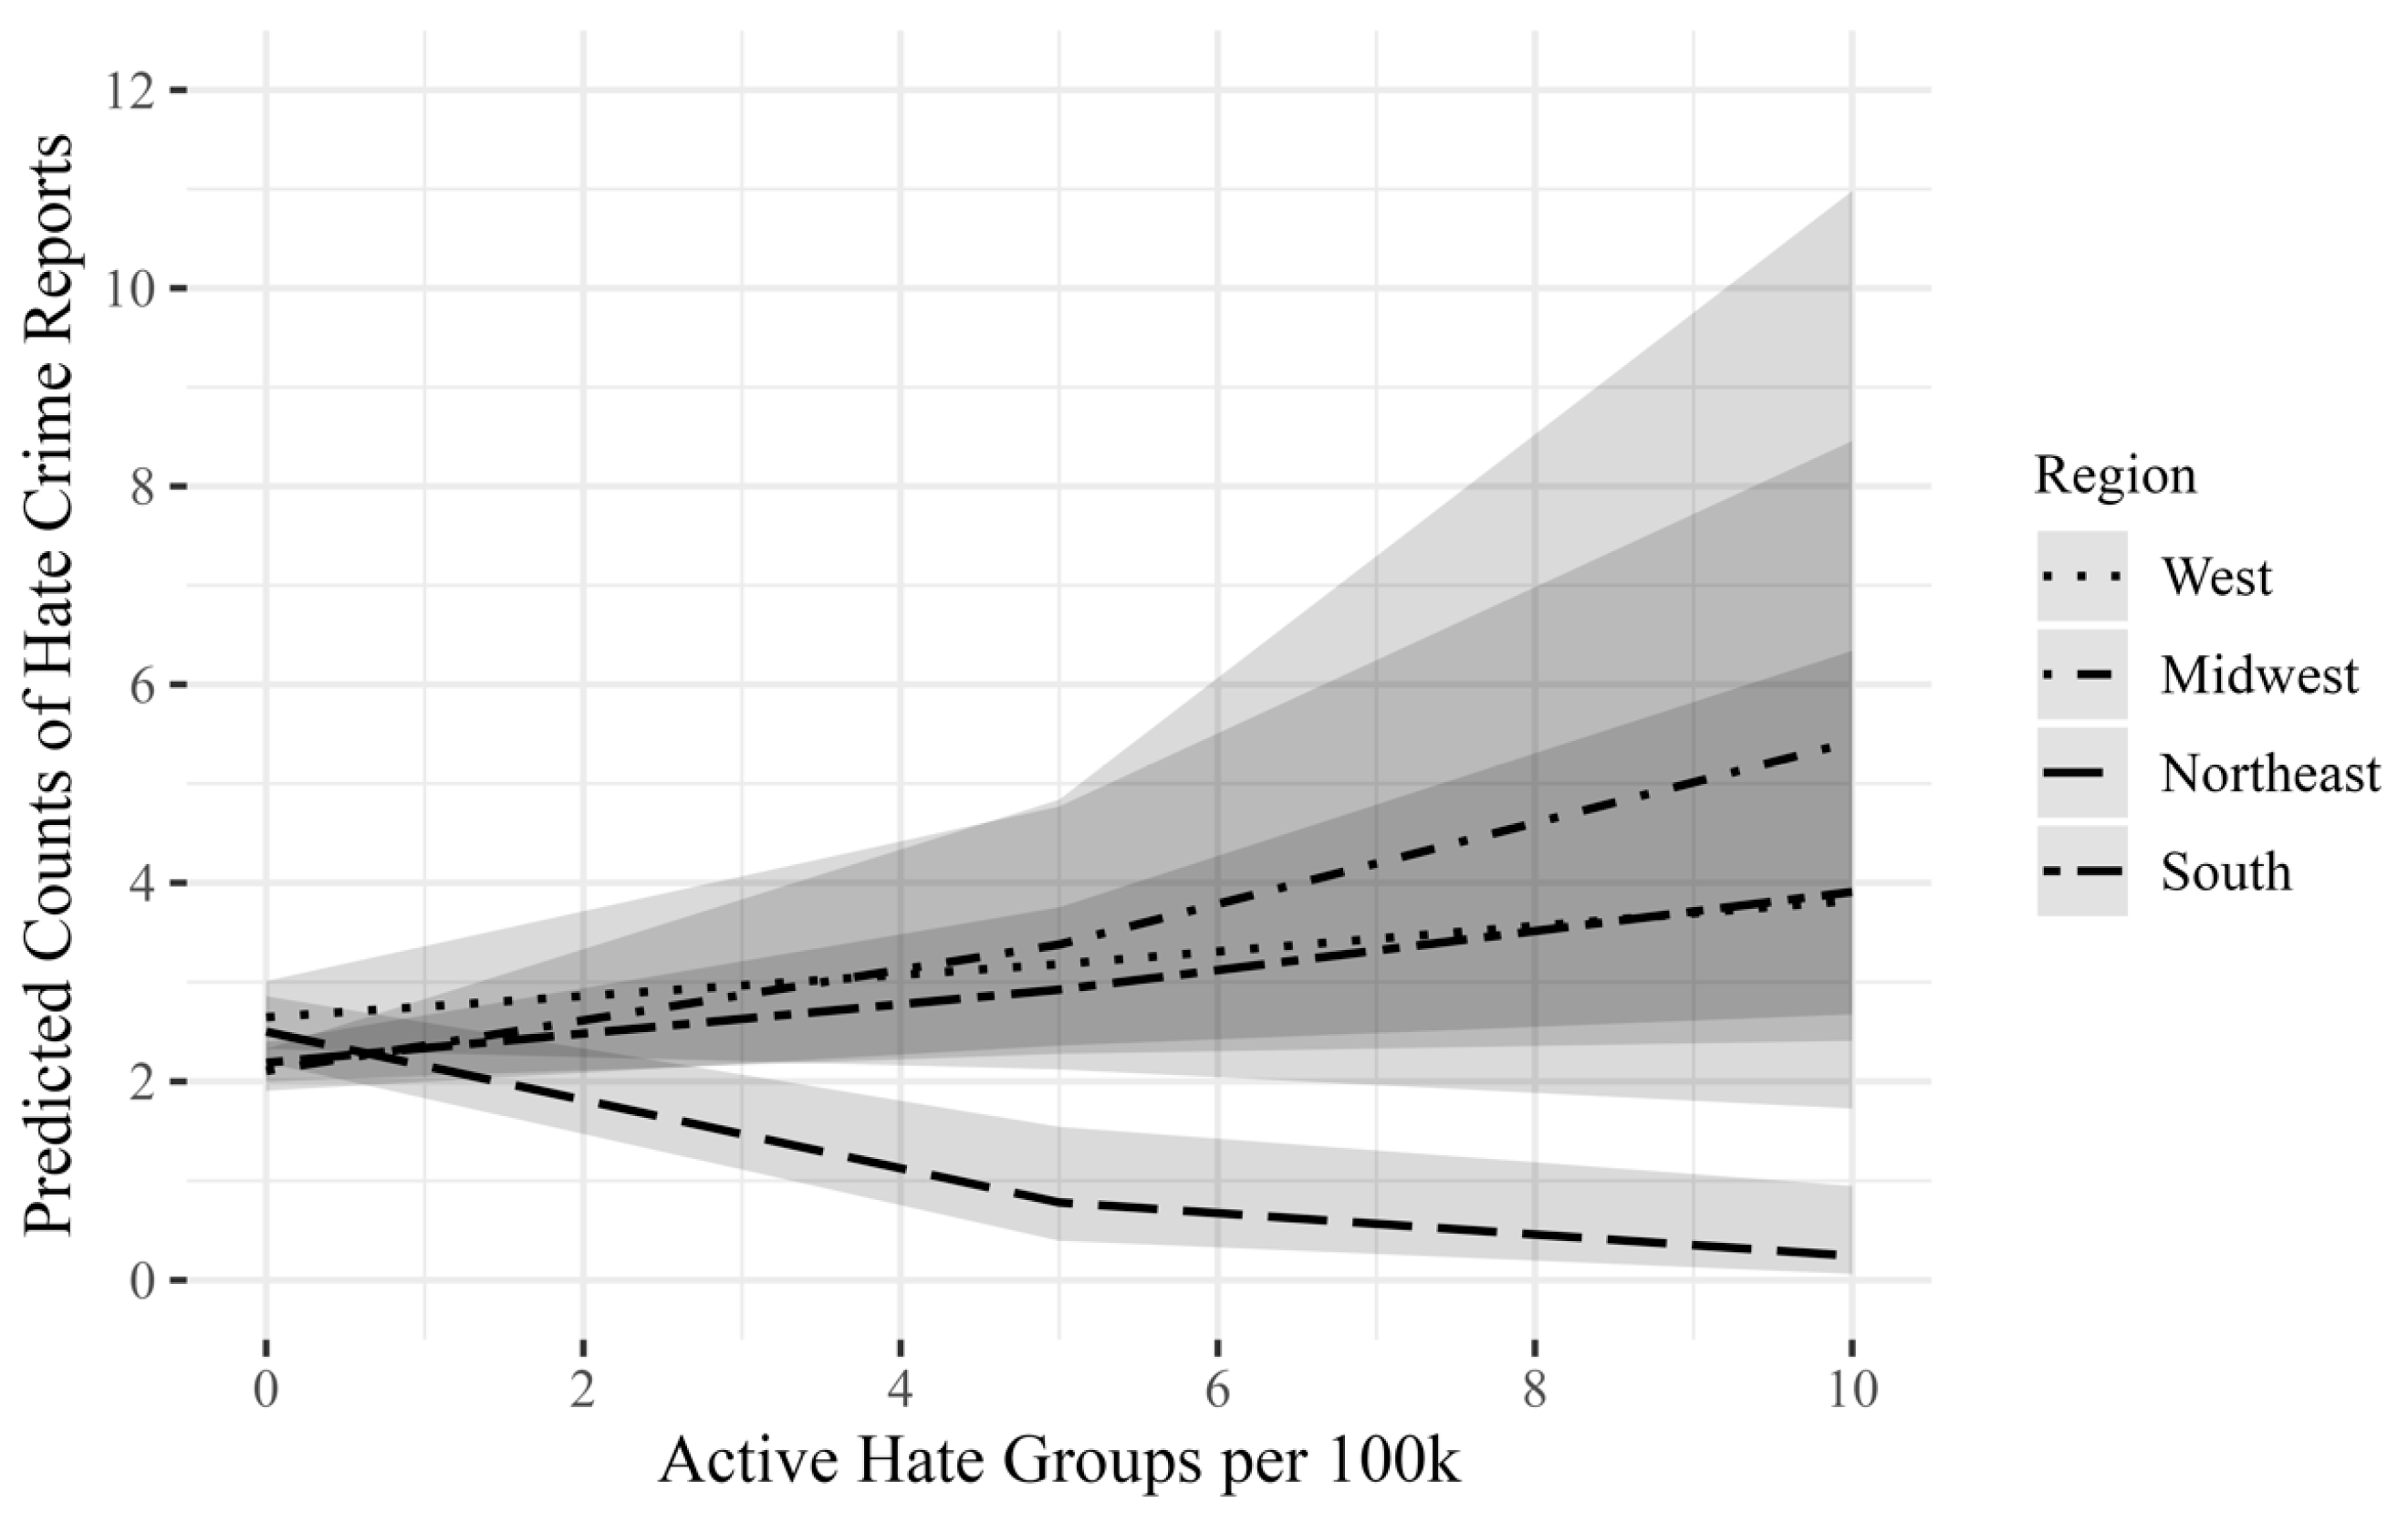
Model 3 examined interaction effects regarding regional boundaries. The South and the Midwest did not reveal significant interactions relative to the West. Notably, in the Northeast relative to the West, a one-unit increase in active white supremacist hate groups was associated with a significant decrease in expected hate crime reports in both Model 3 (16%; p < 0.05) and Model 4 (23%; p < 0.001) (see Figure 5).
When evaluating the research hypotheses, a nuanced assessment is crucial. The goal of this study was not to maximize the explanation of hate crime reporting, but to better understand the political orientation and influence of white supremacists in a county on reported hate crimes as a proxy for the general enforcement of civil rights by the local police. Overall, there was no general effect of locally active white supremacist hate groups on hate crime reports by law enforcement in counties (rejecting H1). This could be due to the fact that far-right hate groups alone are not necessarily able to achieve broad social relevance, or that other factors, such as a more liberal civil society, counteract too much influence of far-right hate groups in the country itself and prevent them from establishing white extremist norms in the country. This argument is supported, for example, by the fact that the SPLC, as a civil rights organization, is aware of the direct presence of the far-right hate group and therefore critically monitors its activities in the county and the actions of law enforcement agencies. Nevertheless, there is evidence of a weak ‘halo’ effect around counties with active far-right hate groups, where there was a small but still significant decrease in reporting. To some extent, this contradicts the interpretation of a lower social relevance of active hate groups, as this would tend to imply a shift to neighboring counties as opportunities for direct influence in the home county appear to be limited (H2). It is striking, however, that this halo effect turned into a spillover effect when looking at more conservative counties. In conservative counties, far-right hate groups not only had the theoretically expected effect on the counties in which they were based, but also on neighboring counties. Thus, there is some evidence that white supremacist attitudes have found fertile ground here, as far-right hate groups do not seem to be perceived as a particular problem. Conversely, in more liberal counties, the presence of right-wing groups generally seems to be met with a greater awareness of the enforcement of universal civil rights, as significantly higher numbers of reports are recorded, even in counties bordering counties with far-right hate groups. The existence of active hate groups and their differential influence on hate crime reporting according to political orientation thus supports H3. The influence of hate groups, particularly in the supposedly more liberal Northeastern states, demonstrates the importance of a nuanced view, as here too, far-right hate groups benefit from a conservative local context characterized by white privilege but also appear to have an independent influence on reduced enforcement of general civil rights in the form of hate crime reports, supporting H4.

7. Discussion

This study identifies influences on UCR hate crime reporting and contends that the interplay between forms of white supremacist expression and white privilege leads to reduced enforcement of hate crime reports by local law enforcement. Empirical support is derived from the presence of active right-wing hate groups and the current Republican vote share within a county as proxies for the aforementioned. The influence is particularly observed in Northeastern and more conservative counties, suggesting less general civil rights enforcement in these areas. On the one hand, it is important to note that lower hate crime reporting and enforcement are not necessarily directly intended by local law enforcement, but may be an unintended consequence and reproduction of local norm shifts under the influence of white supremacy: As discussed in the theoretical section of this paper, victims of hate crime may be afraid to report because of the fear of additional victimization. On the other hand, it may be naive to assume that in conservative, predominantly white communities, local law enforcement may not reflect local norm shifts. This alignment could result in selective enforcement, overlooking certain acts that might be classified as hate crimes in more diverse or progressive areas. The presence of white supremacist norms in such communities could lead to a reduced focus on protecting civil rights, particularly for minority groups, which may be reflected in lower levels of hate crime reporting by local law enforcement. This observation highlights the significant impact of the local context on law enforcement practices. However, further research is needed to explore this issue in depth and to disentangle the various social mechanisms at play.
To ensure robustness, the analysis was repeated for reported hate crimes categorized as anti-white and anti-male (see Table S4 in the online Supplementary Materials). White supremacist ideology does not seek to devalue these groups and is therefore not in itself a motivation for anti-white or anti-male hate crime. Therefore, the social process of influencing local law enforcement’s enforcement of hate crime reporting should be different, which should lead to different results. While the effect sizes were not significantly different, the significance varied considerably. Model 4 of the robustness check showed no significant correlations between right-wing hate groups and politically conservative counties for reported anti-white and anti-male hate crimes, suggesting a different underlying social mechanism than for the reported hate crimes considered in the main analysis. This highlights the potential for right-wing hate groups to act as a proxy for local shifts in favor of forms of white supremacist norms.
However, certain primary results necessitate detailed discussion for a comprehensive interpretation. The significant main effects of Republican vote share and the Midwest and South regions on the reporting behavior of law enforcement may be attributed to fewer potential hate crime targets in generally conservative counties. This stems from the greater share of white people in conservative counties and homogeneity in sociodemographic composition (Reny et al. 2019, p. 92). The same applies to the Midwest, where, based on census data in 2021, the rate of white people was still 25% higher than the national average. Thus, there may well be an enforcement of general civil rights here, but this does not translate into increased reporting due to supposedly lower victimization rates. When interpreting the results in this way, it is important to note that this substantially affects only the category of hate crime related to race/ethnicity. The other categories, such as sexual orientation, gender/gender identity, or disability, should be essentially unaffected by the presumed dynamic. Therefore, it is also possible that these areas may experience a lesser implementation of general civil rights. To address this potential bias, future discussions could focus on victimization rates in addition to incidence rates. The Southern region’s lower hate crime reporting might be linked to cultural and historical factors, echoing findings from the discussed literature5.
To validate right-wing hate groups as a proxy, a robustness check reveals their significant rarity in Republican counties, emphasizing the importance of a conservative environment to their influence. Furthermore, hate groups are more prevalent in counties with higher proportions of young blacks, indicating an increased potential number of victims for the race/ethnicity hate crime category (see again Table S5 in the online Supplementary Materials).
In terms of covariates, the positive effect of people living below the poverty line may be due to economic stress, which fosters social tensions, leading to increased victimization rates and therefore to increased reporting of hate crimes by law enforcement. The diminishing effect of the income and education index is in line with expectations and reflects the fact that better living conditions associated with higher income and education may contribute to lower victimization rates and therefore also to lower hate crime reporting by the police. However, this still requires further research. The negative association of young blacks with hate crime reports, controlling for the other variables, suggests a more tolerant environment in counties with a higher proportion of young blacks. The negative association with the unemployment rate suggests other social mechanisms that warrant further research.
This paper posits that active hate groups serve as a proxy for local behaviors aligned with the white supremacist worldview, challenging assumptions about a positive correlation between hate groups and the enforcement of hate crime reporting by law enforcement. The nuanced relationship underscores the importance of contextual influences such as regional location and political orientation. The arguments presented are not a critique of FBI hate crime statistics per se, but a call for a more differentiated view of broader social mechanisms in hate crime reporting by law enforcement. More work needs to be carried out in the USA to promote local acceptance and especially the enforcement of civil rights by law enforcement. Much more work is required to address and deconstruct aspects of white supremacy and white privilege. This is also necessary as the USA becomes more racially diverse. Adherence to exclusionary values and norms in the face of substantially changing ethnic composition holds enormous potential for social conflict, as suggested by racial threat theories, for example.

Limitations and Future Research

This study, like any scientific inquiry, is not without limitations, with a central concern being the definition of hate groups as a key independent variable. The extensive SPLC database, while comprehensive, categorizes various forms of political hate into ideological groups, potentially leading to misclassifications. For instance, the SPLC’s “General Hate” category encompasses diverse groups such as the Jewish Defense League, the Nation of Islam, or the Proud Boys, representing contrasting ideological worldviews (Southern Poverty Law Center 2024). This study acknowledges the challenge of potential misclassifications within categories like anti-Muslim, anti-LGBTQ, or Christian identity, where some groups touch on aspects of white supremacy while embracing other ideologies. Manual screening during the investigation period could not entirely eliminate false positives, but it has been assumed that their number is minimal, as the majority (77%) of hate groups inherently align with categories like white nationalist, distinctly linked to the white supremacy spectrum.
Future research, employing a blend of qualitative and quantitative approaches, should delve deeper into the nature of right-wing hate groups. The mutual influence of a hate group on the local social climate is likely to depend on additional group information, with factors like size and organizational structure playing pivotal roles. Exploring the networking of various local and regional groups and their collective activities at non-political social events, as well as potential connections to right-wing extremist militias or local law enforcement agencies (Cooper 2019), are crucial aspects in understanding local norms and value systems. Research contends that right-wing extremist groups do not emerge randomly but are rooted in specific social factors and processes, warranting further exploration. This exploration is vital for formulating effective recommendations to foster social coexistence. Consequently, this study underscores that right-wing hate groups, as a proxy for the prevalence of white supremacist beliefs, may have a systematic influence on hate crime reporting by local law enforcement when they are embedded in a more conservative local context.

Supplementary Materials

The following supporting information can be downloaded at: https://www.mdpi.com/article/10.3390/socsci13090466/s1, Table S1: Correlation table of all metric variables used in the negative binominal regressions; Table S2: Alternative models with full dataset (n = 34,180); Table S3: Alternative model with restricted dataset (n = 8601) for Civil Rights Group; Table S4: Alternative models with restricted dataset (n = 9802) as robustness test; Table S5: Zero-inflated Poisson model with respect to white supremacist hate groups; Table S6: Hate Crime Frequencies by Type of Offense Investigated - White or Unknown Offenders Only, by Year; Table S7: Generalized Linear Mixed-Effects Models for different offenders on the binary outcome reported hate crimes (yes/no).

Funding

This research received no external funding.

Institutional Review Board Statement

Ethical review and approval were waived for this study due to the fact that this is a secondary analysis of public data.

Informed Consent Statement

Not applicable.

Data Availability Statement

The data presented in this study were derived from the following resources available in the public domain: Data for 2010–2020 were obtained from FBI Uniform Crime Report (https://www.fbi.gov/how-we-can-help-you/more-fbi-services-and-information/ucr, accessed on 29 October 2021), Southern Poverty Law Center (https://www.splcenter.org/hate-map, accessed on 26 August 2022), MIT Election Data and Science Lab (https://doi.org/10.7910/DVN/VOQCHQ, accessed on 25 June 2022), and the American Community Survey (https://www.census.gov/programs-surveys/acs/, accessed on 17 November 2022).

Conflicts of Interest

The author declares no conflicts of interest.

Appendix A

Table A1. Full models of incidence rate ratios of the zero-inflated Poisson models with respect to hate crime reporting.
Model 1Model 2Model 3Model 4
Independent VariablesIRRCIpIRRCIpIRRCIpIRRCIp
Count Model
Active Hate Group0.960.93–0.980.0021.491.20–1.86<0.0011.071.01–1.140.0302.451.92–3.12<0.001
Active Hate Group—spatial lag0.940.88–1.010.0753.952.47–6.32<0.0011.301.12–1.510.0016.373.80–10.66<0.001
Current REP vote log0.510.46–0.57<0.0010.540.49–0.60<0.0010.530.48–0.59<0.0010.590.53–0.66<0.001
Crime log1.371.26–1.49<0.0011.371.27–1.49<0.0011.341.24–1.46<0.0011.341.24–1.46<0.001
Moved diff. county log1.481.34–1.63<0.0011.441.31–1.59<0.0011.491.35–1.64<0.0011.441.31–1.59<0.001
Foreign-born log0.920.85–1.000.0530.930.86–1.000.0620.930.86–1.000.0620.930.86–1.010.084
White and under 25 years log2.482.05–3.01<0.0012.572.11–3.12<0.0012.341.93–2.84<0.0012.411.98–2.92<0.001
Black and under 25 years log0.870.80–0.94<0.0010.870.80–0.94<0.0010.880.81–0.950.0010.890.82–0.960.002
Below poverty line log1.251.07–1.460.0061.211.04–1.420.0171.160.99–1.360.0651.090.93–1.280.293
Unemployment log0.970.87–1.080.5690.990.89–1.100.8280.960.86–1.070.4880.980.88–1.100.778
Per capita income log1.941.36–2.75<0.0012.111.49–3.00<0.0011.711.20–2.430.0031.811.27–2.580.001
Edu.—Bachelor or higher log2.001.64–2.43<0.0011.851.53–2.25<0.0012.021.66–2.46<0.0011.851.52–2.25<0.001
Region Midwest (Ref.: West)0.710.60–0.85<0.0010.700.59–0.84<0.0010.730.61–0.870.0010.700.59–0.84<0.001
Region Northeast (Ref.: West)0.790.63–0.980.0320.780.62–0.970.0260.870.69–1.080.2050.870.70–1.090.216
Region South (Ref.: West)0.800.67–0.960.0180.810.67–0.970.0210.820.68–0.980.0310.790.65–0.950.012
RUCC 2 (Ref.: RUCC 1)0.970.81–1.160.7420.970.81–1.160.7400.990.83–1.180.9031.000.84–1.200.980
RUCC 3 (Ref.: RUCC 1)1.000.83–1.210.9890.990.82–1.200.9381.030.85–1.250.7481.040.86–1.260.680
RUCC 4 (Ref.: RUCC 1)1.040.83–1.290.7531.020.82–1.270.8411.070.86–1.330.5441.070.86–1.330.542
RUCC 5 (Ref.: RUCC 1)1.110.82–1.490.5001.080.80–1.450.6021.160.86–1.570.3201.160.86–1.560.330
RUCC 6 (Ref.: RUCC 1)1.070.88–1.300.4951.040.86–1.260.6911.110.91–1.340.3111.090.90–1.320.393
RUCC 7 (Ref.: RUCC 1)1.351.09–1.670.0051.311.06–1.610.0131.411.14–1.740.0021.381.12–1.710.003
RUCC 8 (Ref.: RUCC 1)1.090.80–1.490.5821.060.78–1.450.6991.130.83–1.550.4431.110.82–1.520.496
RUCC 9 (Ref.: RUCC 1)1.391.05–1.850.0211.351.02–1.790.0391.451.09–1.930.0101.421.07–1.890.015
Active Hate Group × Current REP 0.880.83–0.94<0.001 0.790.74–0.85<0.001
Active Hate Group—spatial lag × Current REP 0.660.58–0.76<0.001 0.630.55–0.73<0.001
Active Hate Group × Region Midwest 1.000.92–1.080.9161.040.95–1.130.377
Active Hate Group × Region Northeast 0.790.73–0.85<0.0010.780.72–0.84<0.001
Active Hate Group × Region South 0.980.90–1.060.5821.050.96–1.140.303
Active Hate Group—spatial lag × Region Midwest 0.890.71–1.120.3131.000.79–1.260.998
Active Hate Group—spatial lag × Region Northeast 0.660.56–0.79<0.0010.630.53–0.76<0.001
Active Hate Group—spatial lag × Region South 0.760.61–0.950.0170.930.74–1.170.521
Intercept0.000.00–0.00<0.0010.000.00–0.00<0.0010.000.00–0.00<0.0010.000.00–0.00<0.001
Zero-Inflated Model
Intercept1.000.85–1.180.9721.000.85–1.180.9661.000.84–1.170.9531.000.85–1.180.979
Population/10,000 log0.480.44–0.51<0.0010.480.44–0.51<0.0010.480.44–0.51<0.0010.480.44–0.51<0.001
NCounties3114311431143114
NYears11111111
NObservations34180341803418034180
Marginal R2/Conditional R20.036/0.1960.036/0.1950.034/0.1950.034/0.194
AIC61,617.8661,548.7961,525.8461,403.23
BIC61,854.1661,801.9861,812.7861,707.05
log-likelihood−30,780.93−30,744.39−30,728.92−30,665.61
Note: p-values are calculated for two-tailed hypothesis tests, bold p-values indicate at least a significant level of p < 0.05.
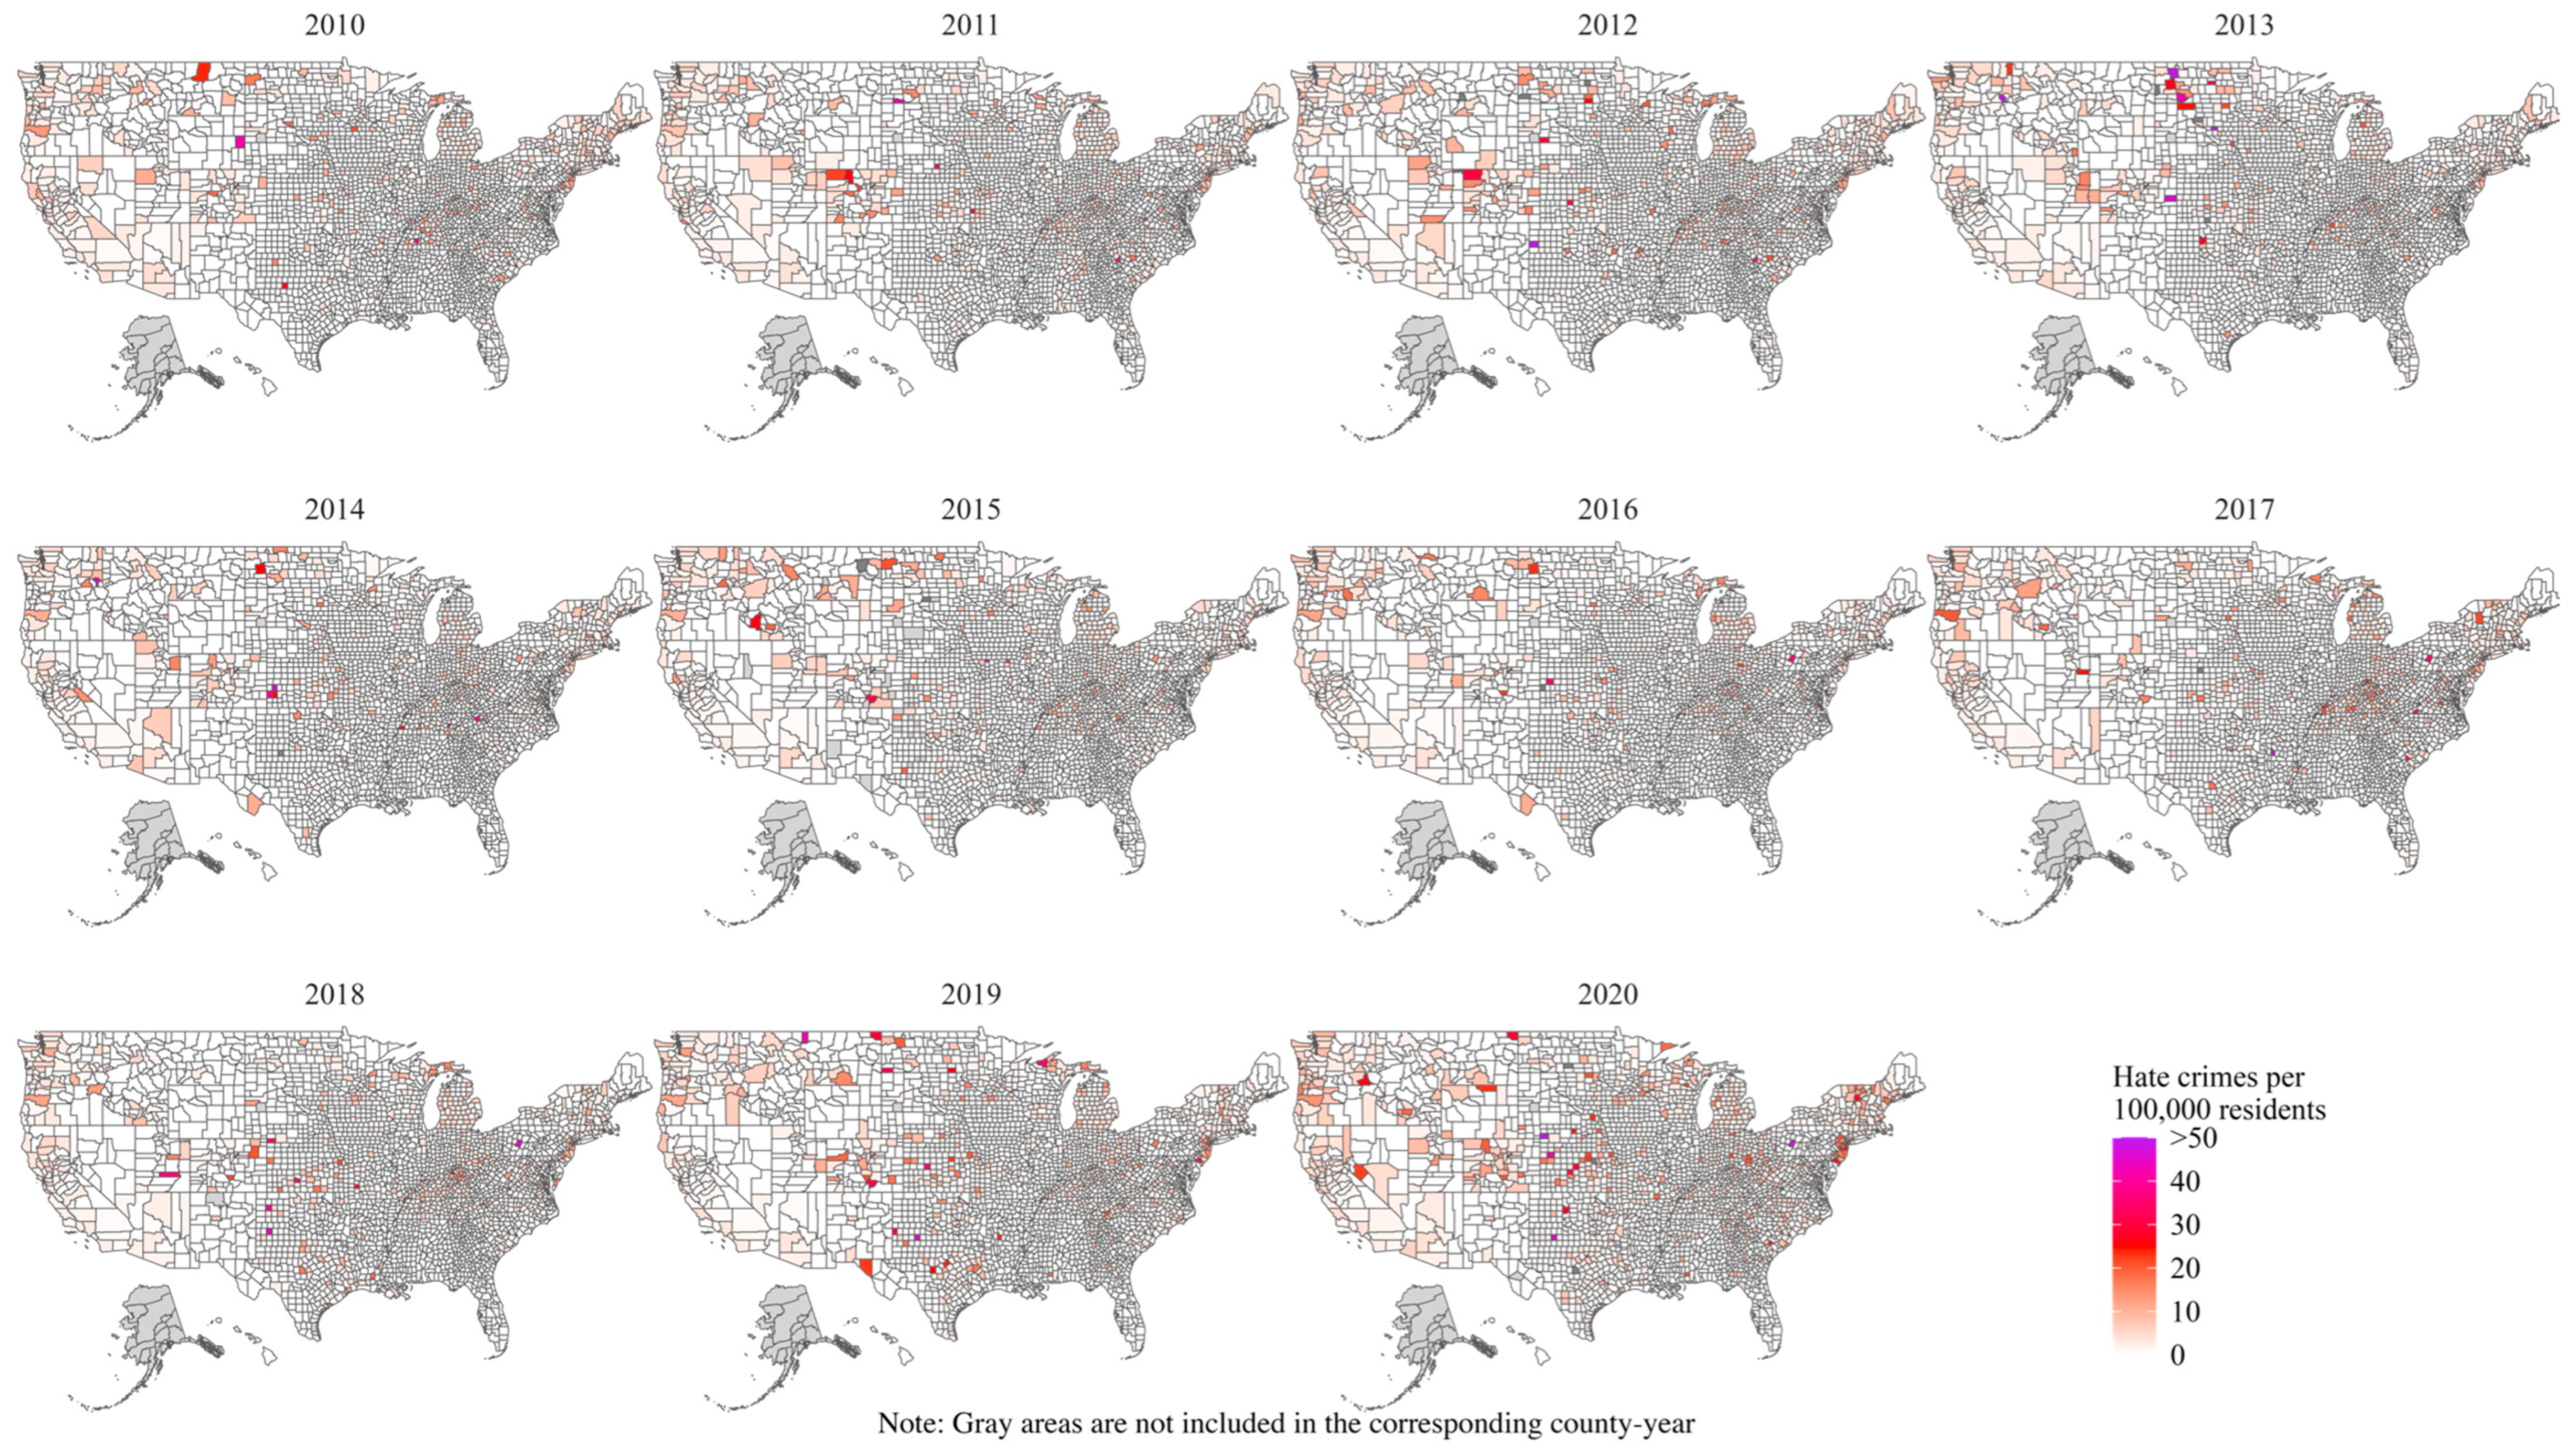
Figure A1. Hate crimes per 100,000 residents per county for the years 2010 to 2020.
Socsci 13 00466 g0a1
Figure A2. Presence of at least one active hate group per county for the years 2010 to 2020.
Socsci 13 00466 g0a2

Notes

1
The term “hate crime” is misleading according to McDevitt and Iwama (2016), as there are crimes that are motivated by hate but not by biases. It is therefore more precise to speak of bias-motivated crimes. For simplicity, the term “hate crime” is used throughout the following.
2
A multitude of theories, such as racial threat (Blalock 1967; Hopkins 2010, pp. 41–42), focus on the social consequences and mechanisms of this phenomenon, which is why there is an immense corpus of scientific research on this topic.
3
The calculations for the spatial weights were carried out in R using the spdep package (Spatial Dependence: Weighting Schemes, Statistics).
4
The described methodological procedure was implemented in R using, among others, the glmmTMB package (Brooks et al. 2017).
5
To test the potential influence of local civil rights groups cited in the literature discussed, I ran an additional model with a dataset limited due to data availability that included civil rights groups but found no significant results to support this argument (see Table S3 in the Supplementary Materials).

References

  1. Adamczyk, Amy, Jeff Gruenewald, Steven M. Chermak, and Joshua D. Freilich. 2014. The Relationship Between Hate Groups and Far-Right Ideological Violence. Journal of Contemporary Criminal Justice 30: 310–32. [Google Scholar] [CrossRef]
  2. Agnew, John. 1996. Mapping politics: How context counts in electoral geography. Political Geography 15: 129–46. [Google Scholar] [CrossRef]
  3. Anoll, Allison P. 2018. What Makes a Good Neighbor? Race, Place, and Norms of Political Participation. American Political Science Review 112: 494–508. [Google Scholar] [CrossRef]
  4. Beck, Elwood M. 2000. Guess Who’s Coming to Town: White Supremacy, Ethnic Competition, and Social Change. Sociological Focus 33: 153–74. [Google Scholar] [CrossRef]
  5. Black, Donald J. 1970. Production of Crime Rates. American Sociological Review 35: 733–48. [Google Scholar] [CrossRef]
  6. Blalock, Hubert M. 1967. Toward a Theory of Minority-Group Relations. New York: Wiley. [Google Scholar]
  7. Blevins, Emily J., and Nathan R. Todd. 2022. Remembering where we’re from: Community- and individual-level predictors of college students’ White privilege awareness. American Journal of Community Psychology 70: 60–74. [Google Scholar] [CrossRef] [PubMed]
  8. Bonds, Anne, and Joshua Inwood. 2016. Beyond white privilege: Geographies of white supremacy and settler colonialism. Progress in Human Geography 40: 715–33. [Google Scholar] [CrossRef]
  9. Brooks, Mollie E., Kasper Kristensen, Koen J. Van Benthem, Arni Magnusson, Casper W. Berg, Anders Nielsen, Hans J. Skaug, Martin Machler, and Benjamin M. Bolker. 2017. glmmTMB balances speed and flexibility among packages for zero-inflated generalized linear mixed modeling. The R Journal 9: 378–400. [Google Scholar] [CrossRef]
  10. Chakraborti, Neil. 2015. Framing the boundaries of hate crime. In The Routledge International Handbook on Hate Crime, 1st ed. London: Routledge, pp. 13–23. [Google Scholar] [CrossRef]
  11. Chermak, Steven, Joshua Freilich, and Michael Suttmoeller. 2013. The Organizational Dynamics of Far-Right Hate Groups in the United States: Comparing Violent to Nonviolent Organizations. Studies in Conflict & Terrorism 36: 193–218. [Google Scholar] [CrossRef]
  12. Cialdini, Robert B., and Melanie R. Trost. 1998. Social influence: Social norms, conformity and compliance. In The Handbook of Social Psychology, 4th ed. New York: McGraw-Hill, vols. 1–2, pp. 151–92. [Google Scholar]
  13. Cooper, Cloee. 2019. How a Right-Wing Network Mobilized Sheriffs’ Departments. Political Research Associates. October 6. Available online: https://politicalresearch.org/2019/06/10/how-a-right-wing-network-mobilized-sheriffs-departments (accessed on 27 January 2023).
  14. Crowder, Kyle, and Scott J. South. 2008. Spatial Dynamics of White Flight: The Effects of Local and Extralocal Racial Conditions on Neighborhood Out-Migration. American Sociological Review 73: 792–812. [Google Scholar] [CrossRef]
  15. DiLorenzo, Matthew. 2021. Trade Layoffs and Hate in the United States. Social Science Quarterly 102: 771–85. [Google Scholar] [CrossRef]
  16. Disha, Ilir, James C. Cavendish, and Ryan D. King. 2011. Historical Events and Spaces of Hate: Hate Crimes against Arabs and Muslims in Post-9/11 America. Social Problems 58: 21–46. [Google Scholar] [CrossRef]
  17. Druckman, James N., Samara Klar, Yanna Krupnikov, Matthew Levendusky, and John Barry Ryan. 2021. Affective polarization, local contexts and public opinion in America. Nature Human Behaviour 5: 28–38. [Google Scholar] [CrossRef] [PubMed]
  18. Dugan, Laura, and Erica Chenoweth. 2020. Threat, emboldenment, or both? The effects of political power on violent hate crimes*. Criminology 58: 714–46. [Google Scholar] [CrossRef]
  19. Dunbar, Edward, Jary Quinones, and Desiree A. Crevecoeur. 2005. Assessment of Hate Crime Offenders: The Role of Bias Intent in Examining Violence Risk. Journal of Forensic Psychology Practice 5: 1–19. [Google Scholar] [CrossRef]
  20. Durso, Rachel M., and David Jacobs. 2013. The Determinants of the Number of White Supremacist Groups: A Pooled Time-Series Analysis. Social Problems 60: 128–44. [Google Scholar] [CrossRef]
  21. Embrick, David G., and Wendy Leo Moore. 2020. White Space(s) and the Reproduction of White Supremacy. American Behavioral Scientist 64: 1935–45. [Google Scholar] [CrossRef]
  22. Ferber, Abby L. 1998. Constructing whiteness: The intersections of race and gender in US white supremacist discourse. Ethnic and Racial Studies 21: 48–63. [Google Scholar] [CrossRef]
  23. Fording, Richard C., and Sanford F. Schram. 2020. Hard White: The Mainstreaming of Racism in American Politics. Oxford: Oxford University Press. [Google Scholar]
  24. Goetz, Stephan J., Anil Rupasingha, and Scott Loveridge. 2012. Social Capital, Religion, Wal-Mart, and Hate Groups in America*. Social Science Quarterly 93: 379–93. [Google Scholar] [CrossRef]
  25. Hays, Danica G., Catherine Y. Chang, and Pamela Havice. 2008. White Racial Identity Statuses as Predictors of White Privilege Awareness. The Journal of Humanistic Counseling, Education and Development 47: 234–46. [Google Scholar] [CrossRef]
  26. Heilbron, David C. 1994. Zero-Altered and other Regression Models for Count Data with Added Zeros. Biometrical Journal 36: 531–47. [Google Scholar] [CrossRef]
  27. Hopkins, Daniel J. 2010. Politicized Places: Explaining Where and When Immigrants Provoke Local Opposition. American Political Science Review 104: 40–60. [Google Scholar] [CrossRef]
  28. Jefferson, Philip N., and Frederic L. Pryor. 1999. On the geography of hate. Economics Letters 65: 389–95. [Google Scholar] [CrossRef]
  29. Jendryke, Michael, and Stephen C. McClure. 2019. Mapping crime—Hate crimes and hate groups in the USA: A spatial analysis with gridded data. Applied Geography 111: 102072. [Google Scholar] [CrossRef]
  30. King, Ryan D. 2007. The Context of Minority Group Threat: Race, Institutions, and Complying with Hate Crime Law. Law & Society Review 41: 189–224. [Google Scholar] [CrossRef]
  31. King, Ryan D., Steven F. Messner, and Robert D. Baller. 2009. Contemporary Hate Crimes, Law Enforcement, and the Legacy of Racial Violence. American Sociological Review 74: 291–315. [Google Scholar] [CrossRef]
  32. Kitsuse, John I., and Aaron V. Cicourel. 1963. A note on the uses of official statistics. Social Problems 11: 131–39. [Google Scholar] [CrossRef]
  33. Levin, Jack, and Jack McDevitt. 2013. Hate Crimes: The Rising Tide of Bigotry and Bloodshed. Berlin/Heidelberg: Springer. [Google Scholar]
  34. Levin, Jack. 2007. The violence of hate: Confronting racism, anti-Semitism, and other forms of bigotry. In JAB. Boston: Allyn and Bacon. Available online: https://tandis.odihr.pl/handle/20.500.12389/19748 (accessed on 20 January 2023).
  35. Lieske, Joel. 2010. The Changing Regional Subcultures of the American States and the Utility of a New Cultural Measure. Political Research Quarterly 63: 538–52. [Google Scholar] [CrossRef]
  36. Lim, Chaeyoon, and Carol Ann MacGregor. 2012. Religion and Volunteering in Context: Disentangling the Contextual Effects of Religion on Voluntary Behavior. American Sociological Review 77: 747–79. [Google Scholar] [CrossRef]
  37. Lipsitz, George. 2011. How Racism Takes Place. Philadelphia: Temple University Press. [Google Scholar]
  38. Liu, William Ming. 2017. White male power and privilege: The relationship between White supremacy and social class. Journal of Counseling Psychology 64: 349–58. [Google Scholar] [CrossRef]
  39. Loeys, Tom, Beatrijs Moerkerke, Olivia De Smet, and Ann Buysse. 2012. The analysis of zero-inflated count data: Beyond zero-inflated Poisson regression. British Journal of Mathematical and Statistical Psychology 65: 163–80. [Google Scholar] [CrossRef]
  40. Malcom, Zachary T., and Brendan Lantz. 2021. Hate Crime Victimization and Weapon Use. Criminal Justice and Behavior 48: 1148–65. [Google Scholar] [CrossRef]
  41. Mason, Gail. 2015. Legislating against hate. In The Routledge International Handbook on Hate Crime, 1st ed. London: Routledge, p. 440. [Google Scholar] [CrossRef]
  42. Masucci, Madeline. 2017. Hate Crime Victimization, 2004–2015; Washington, DC: U.S. Department of Justice/Bureau of Justice Statistics.
  43. McCann, Stewart J. H. 2009. Authoritarianism, Conservatism, Racial Diversity Threat, and the State Distribution of Hate Groups. The Journal of Psychology 144: 37–60. [Google Scholar] [CrossRef] [PubMed]
  44. McDermott, Monica, and Frank L. Samson. 2005. White Racial and Ethnic Identity in the United States. Annual Review of Sociology 31: 245–61. [Google Scholar] [CrossRef]
  45. McDevitt, Jack, and Janice A. Iwama. 2016. Challenges in Measuring and Understanding Hate Crime. In The Handbook of Measurement Issues in Criminology and Criminal Justice. Hoboken: John Wiley & Sons, Ltd, pp. 131–55. [Google Scholar] [CrossRef]
  46. McDevitt, Jack, Jennifer M. Balboni, Susan Bennett, Joan C. Weiss, Stan Orchowsky, and Lisa Walbolt. 2003. Improving the quality and accuracy of bias crime statistics nationally. In Hate and Bias Crime: A Reader. London: Routledge, pp. 77–89. [Google Scholar]
  47. McVeigh, Rory, David Cunningham, and Justin Farrell. 2014. Political Polarization as a Social Movement Outcome: 1960s Klan Activism and Its Enduring Impact on Political Realignment in Southern Counties, 1960 to 2000. American Sociological Review 79: 1144–71. [Google Scholar] [CrossRef]
  48. McVeigh, Rory, Michael R. Welch, and Thoroddur Bjarnason. 2003. Hate Crime Reporting as a Successful Social Movement Outcome. American Sociological Review 68: 843. [Google Scholar] [CrossRef]
  49. Medina, Richard M., Emily Nicolosi, Simon Brewer, and Andrew M. Linke. 2018. Geographies of Organized Hate in America: A Regional Analysis. Annals of the American Association of Geographers 108: 1006–21. [Google Scholar] [CrossRef]
  50. MIT Election Data and Science Lab. 2022. County Presidential Election Returns 2000–2020. Available online: https://dataverse.harvard.edu/dataset.xhtml?persistentId=doi:10.7910/DVN/VOQCHQ (accessed on 25 June 2022).
  51. Morris, Aldon. 2022. Alternative View of Modernity: The Subaltern Speaks. American Sociological Review 87: 1–16. [Google Scholar] [CrossRef]
  52. Mulholland, Sean E. 2010. Hate Fuel: On the Relationship Between Local Government Policy and Hate Group Activity. Eastern Economic Journal 36: 480–99. [Google Scholar] [CrossRef]
  53. Mulholland, Sean E. 2013. White supremacist groups and hate crime. Public Choice 157: 91–113. [Google Scholar] [CrossRef]
  54. Nolan, Deborah, and Duncan Temple Lang. 2015. Data Science in R: A Case Studies Approach to Computational Reasoning and Problem Solving. Boca Raton: Chapman and Hall/CRC. [Google Scholar] [CrossRef]
  55. Parker, Christopher Sebastian, and Christopher C. Towler. 2019. Race and Authoritarianism in American Politics. Annual Review of Political Science 22: 503–19. [Google Scholar] [CrossRef]
  56. Perry, Barbara J. 1998. Defenders of the faith: Hate groups and ideologies of power in the United States. Patterns of Prejudice 32: 32–54. [Google Scholar] [CrossRef]
  57. Perry, Barbara J. 2001. In the Name of Hate: Understanding Hate Crimes. London: Routledge. [Google Scholar]
  58. Perry, Barbara J. 2010. Counting—And Countering—Hate Crime in Europe. European Journal of Crime, Criminal Law and Criminal Justice 18: 349–67. [Google Scholar] [CrossRef]
  59. Piatkowska, Sylwia J., Steven F. Messner, and Tse-Chuan Yang. 2018. Understanding the Relationship Between Relative Group Size and Hate Crime Rates: Linking Methods with Concepts. Justice Quarterly 36: 1072–95. [Google Scholar] [CrossRef]
  60. Pulido, Laura. 2015. Geographies of race and ethnicity 1: White supremacy vs white privilege in environmental racism research. Progress in Human Geography 39: 809–17. [Google Scholar] [CrossRef]
  61. Reny, Tyler T., Loren Collingwood, and Ali A. Valenzuela. 2019. Vote Switching in the 2016 Election: How Racial and Immigration Attitudes, Not Economics, Explain Shifts in White Voting. Public Opinion Quarterly 83: 91–113. [Google Scholar] [CrossRef]
  62. Reynolds, Joel Michael. 2022. Disability and White Supremacy. Critical Philosophy of Race 10: 48–70. [Google Scholar] [CrossRef]
  63. Ryan, Matt E., and Peter T. Leeson. 2011. Hate groups and hate crime. International Review of Law and Economics 31: 256–62. [Google Scholar] [CrossRef]
  64. Simi, Pete, Kathleen Blee, Matthew DeMichele, and Steven Windisch. 2017. Addicted to Hate: Identity Residual among Former White Supremacists. American Sociological Review 82: 1167–87. [Google Scholar] [CrossRef]
  65. Southern Poverty Law Center. 2023a. Frequently Asked Questions about Hate Groups. Available online: https://www.splcenter.org/20200318/frequently-asked-questions-about-hate-groups (accessed on 20 January 2023).
  66. Southern Poverty Law Center. 2023b. Hate Map. Available online: https://www.splcenter.org/hate-map (accessed on 20 January 2023).
  67. Southern Poverty Law Center. 2024. General Hate. Available online: https://www.splcenter.org/fighting-hate/extremist-files/ideology/general-hate (accessed on 29 August 2024).
  68. Stipak, Brian, and Carl Hensler. 1982. Statistical Inference in Contextual Analysis. American Journal of Political Science 26: 151. [Google Scholar] [CrossRef]
  69. Tankard, Margaret E., and Elizabeth Levy Paluck. 2016. Norm Perception as a Vehicle for Social Change: Vehicle for Social Change. Social Issues and Policy Review 10: 181–211. [Google Scholar] [CrossRef]
  70. US Census Bureau. 2023. American Community Survey (ACS). Census.Gov. January 20. Available online: https://www.census.gov/programs-surveys/acs (accessed on 20 January 2023).
  71. US Department of Justice. 2022. Facts and Statistics. Available online: https://www.justice.gov/hatecrimes/hate-crime-statistics (accessed on 19 January 2023).
  72. US Department of Justice. 2023. Learn About Hate Crimes|HATECRIMES|Department of Justice. Available online: https://www.justice.gov/hatecrimes/learn-about-hate-crimes (accessed on 20 January 2023).
  73. van Kirk, Amy, and Jessica P. Hodge. 2016. Hate Crimes and Hate Crime Law. In The Wiley Blackwell Encyclopedia of Gender and Sexuality Studies. Hoboken: John Wiley & Sons, Ltd., pp. 1–6. [Google Scholar] [CrossRef]
  74. Weiner, Amanda, and Ariel Zellman. 2022. Mobilizing the White: White Nationalism and Congressional Politics in the American South. American Politics Research 50: 707–22. [Google Scholar] [CrossRef]
  75. Zingher, Joshua N. 2018. Polarization, Demographic Change, and White Flight from the Democratic Party. The Journal of Politics 80: 860–72. [Google Scholar] [CrossRef]
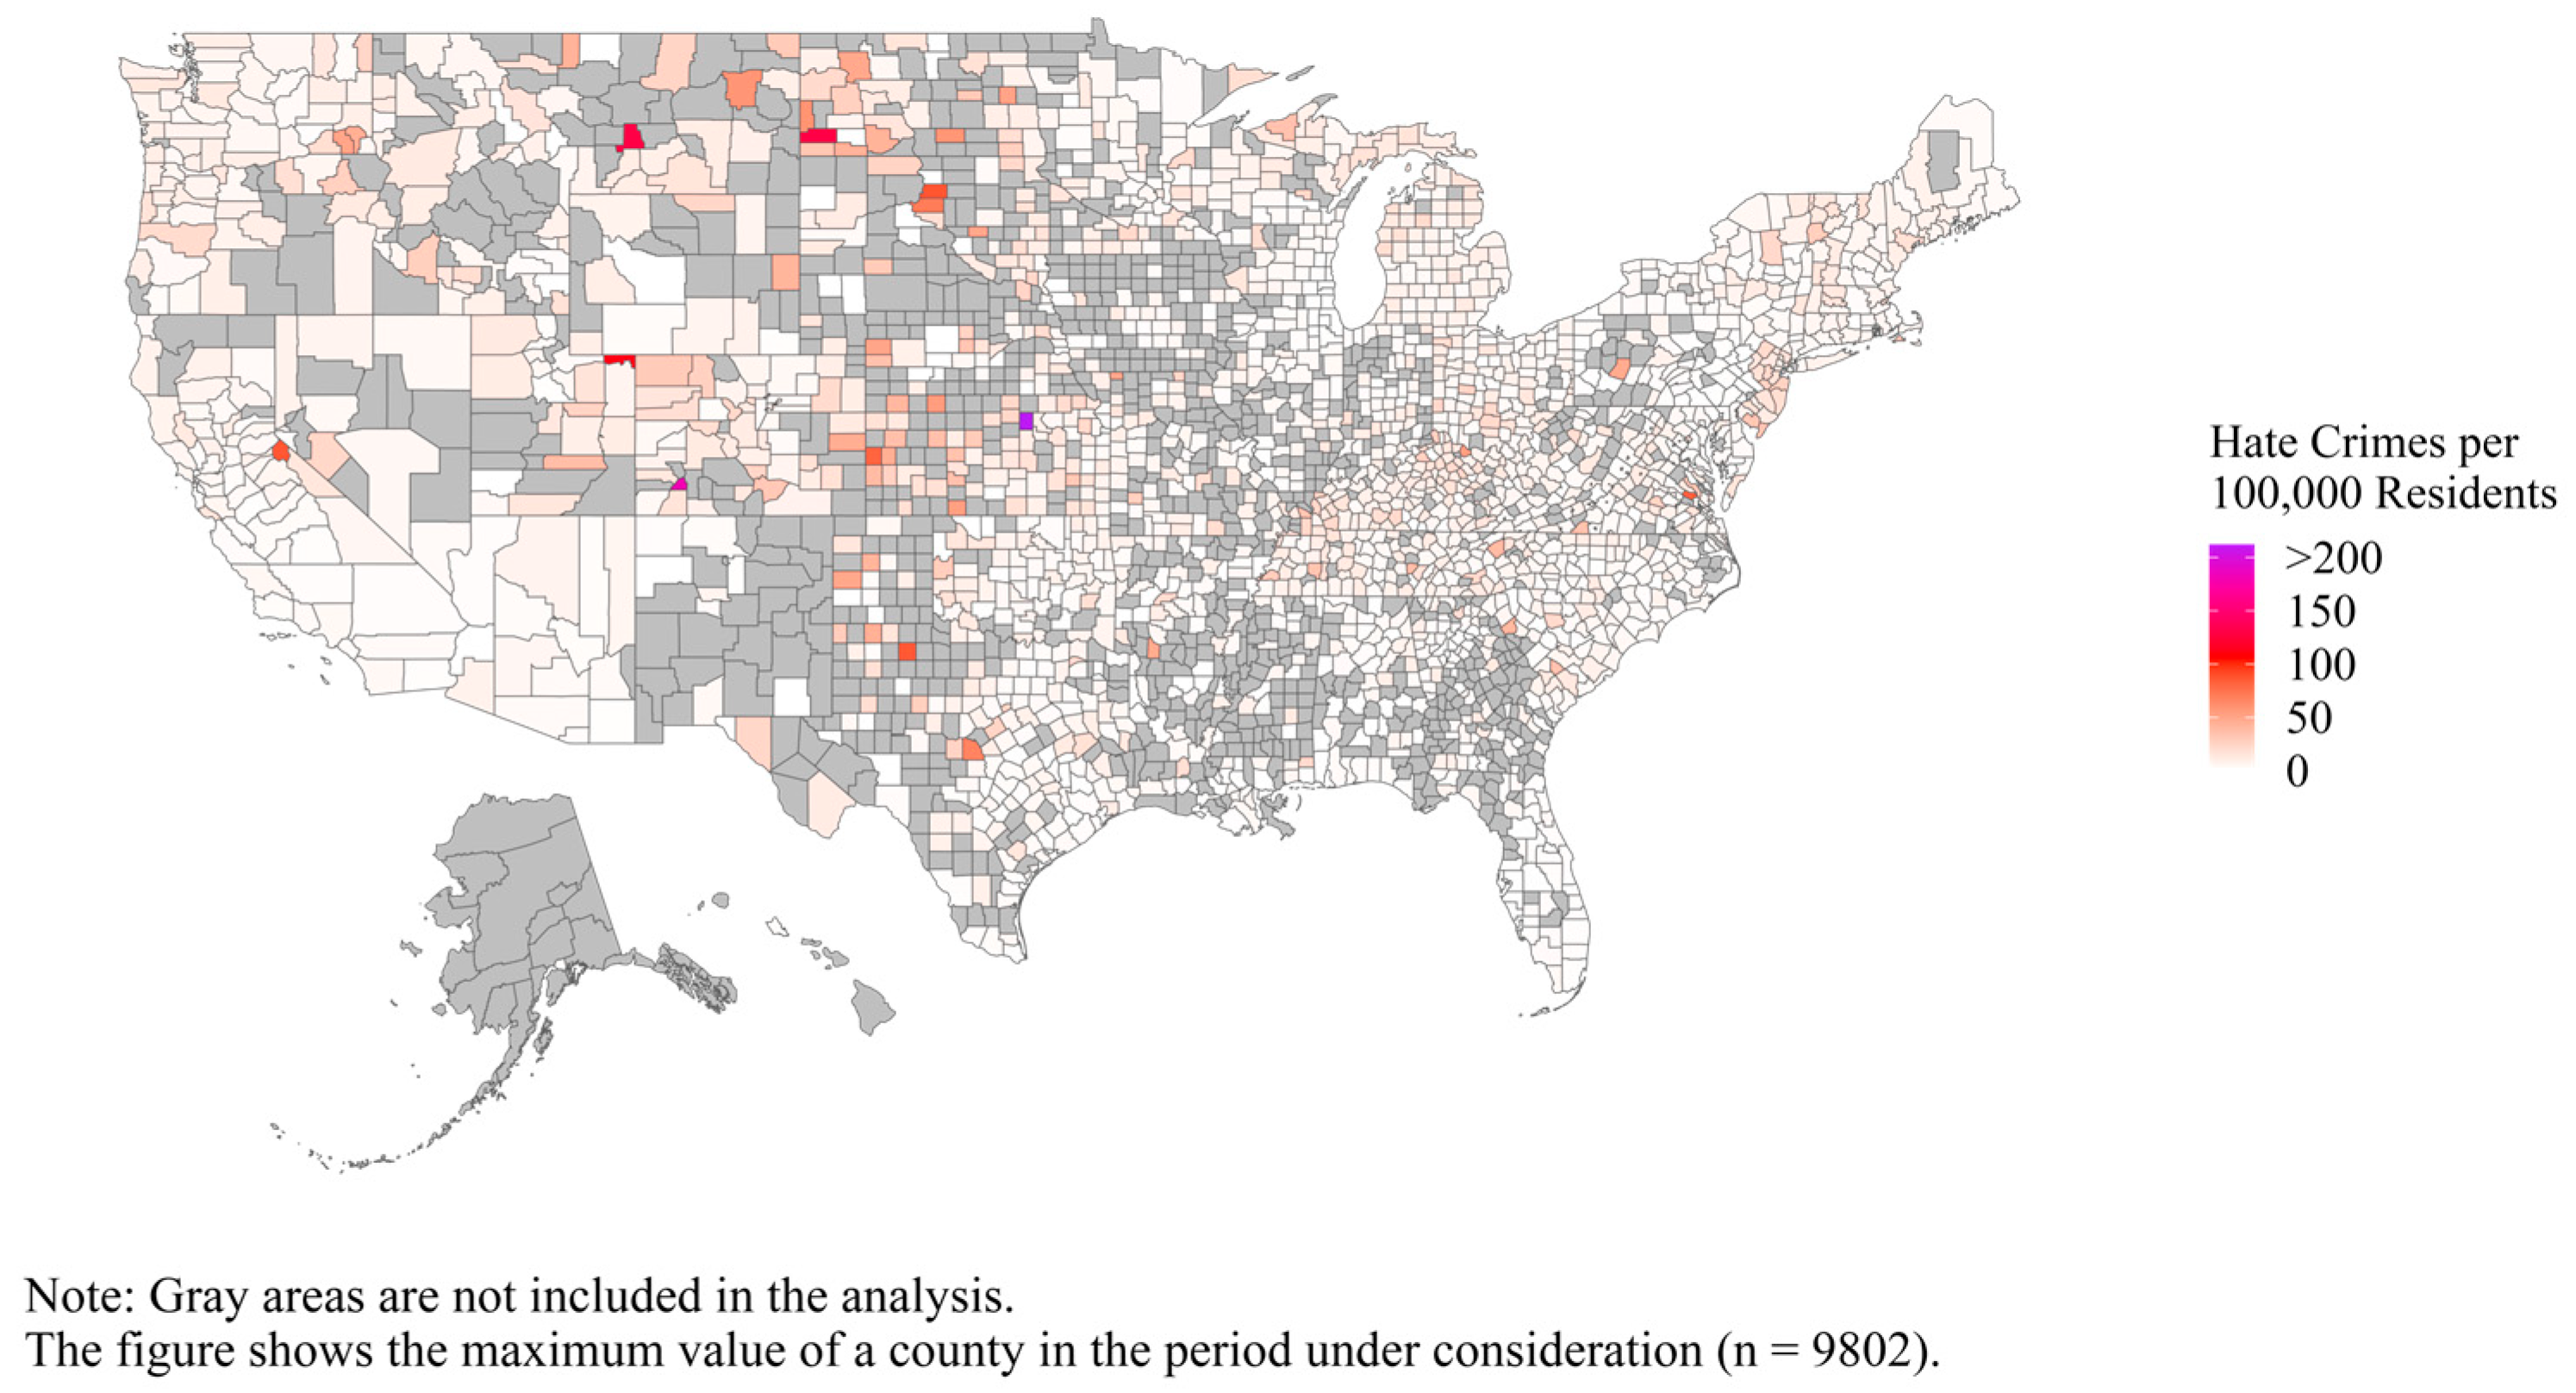
Figure 1. Reported hate crimes per 100,000 residents per county, pooled for the years 2010 to 2020.
Socsci 13 00466 g001
Figure 2. Presence of at least one active hate group per county, pooled for the years 2010 to 2020.
Socsci 13 00466 g002
Figure 3. Interaction between active hate groups and Republican vote share in the county, Model 4.
Socsci 13 00466 g003
Figure 4. Interaction between active hate groups and Republican vote share in neighboring counties, Model 4.
Socsci 13 00466 g004
Figure 5. Interaction between active hate groups and counties in the Northeast for Model 4.
Socsci 13 00466 g005
Table 1. Descriptive statistics.
VariablesMeanSDMinMax
Hate crimes 15.9118.400374
Active hate groups per 100k0.150.710.0026.86
Active hate groups—spatial lag 10.260.510.006.50
Crimes0.370.340.001.85
Current REP vote3.990.321.664.55
Moved within state1.530.380.003.15
Foreign-born1.750.760.004.00
White and u253.230.260.244.11
Black and u251.110.810.003.44
Below poverty line2.690.361.303.94
Unemployment2.050.350.003.27
Income and education index1.100.280.142.13
Region: West 10.160.3701
Region: Midwest 10.280.4501
Region: Northeast 1,20.130.3301
Region: South 10.410.4901
Population 1256,690552,105.855210,105,722
n9802
1 Due to the different measurement and origination contexts of the covariates, it was decided to log-transform all continuous predictors. However, variables marked were not log-transformed. 2 Northeast also includes the District of Columbia.
Table 2. Incidence rate ratios of negative binomial models with respect to hate crime reporting.
Model 1Model 2Model 3Model 4
Independent VariablesIRRSEIRRSEIRRSEIRRSE
Active hate groups per 100k1.020.022.13 ***0.461.040.043.00 ***0.68
Active hate groups—0.94 *0.021.62 *0.320.970.041.64 *0.35
spatial lag
Current REP vote log0.69 ***0.050.78 **0.060.69 ***0.050.78 **0.06
Crime log1.14 **0.051.14 **0.051.13 **0.051.14 **0.05
Moved diff. county log1.46 ***0.071.46 ***0.071.45 ***0.071.46 ***0.07
Foreign-born log0.76 ***0.030.77 ***0.030.76 ***0.030.77 ***0.03
White and under 25 years log0.900.080.890.080.910.080.900.08
Black and under 25 years log0.72 ***0.020.72 ***0.020.72 ***0.020.72 ***0.02
Below poverty line log1.21 **0.091.21 **0.091.20 *0.091.19 *0.09
Unemployment log0.66 ***0.040.67 ***0.040.66 ***0.040.67 ***0.04
Income and education index log0.74 **0.080.75 *0.090.73 **0.080.74 **0.08
Region: Midwest (Ref.: West)0.82 **0.060.81 **0.060.83 *0.060.83 **0.06
Region: Northeast (Ref.: West)0.910.070.910.070.930.080.960.08
Region: South (Ref.: West)0.84 *0.060.83 **0.060.84 *0.060.84 *0.06
Hate groups × Current REP 0.84 ***0.04 0.77 ***0.04
Hate groups—spatial lag × Current REP 0.86 **0.05 0.87 *0.05
Hate groups × Midwest 1.020.051.060.06
Hate groups × Northeast 0.84 *0.070.77 ***0.06
Hate groups × South 0.990.051.020.05
Hate groups—spatial lag 0.860.080.860.08
× Midwest
Hate groups—spatial lag 0.990.060.960.06
× Northeast
Hate groups—spatial lag 1.010.070.960.07
× South
Marginal pseudo R20.0820.0840.0830.084
Conditional pseudo R20.2700.2690.2710.270
AIC41,402.841,382.641,404.641,373.7
BIC41,532.241,526.441,577.141,560.7
log-likelihood−20,683.4−20,671.3−20,678.3−20,660.9
Note: n of observations = 9802; n of counties = 2089; n of years = 11; * p < 0.05 ** p < 0.01 *** p < 0.001 (two-sided).
Disclaimer/Publisher’s Note: The statements, opinions and data contained in all publications are solely those of the individual author(s) and contributor(s) and not of MDPI and/or the editor(s). MDPI and/or the editor(s) disclaim responsibility for any injury to people or property resulting from any ideas, methods, instructions or products referred to in the content.