Adopting Circular Economy at the European Union Level and Its Impact on Economic Growth


Faculty of Business Administration in Foreign Languages, The Bucharest University of Economics Studies, 010374 Bucharest, Romania
Soc. Sci. 2019, 8(5), 159; https://doi.org/10.3390/socsci8050159
Submission received: 12 April 2019
/
Revised: 16 May 2019
/
Accepted: 17 May 2019
/
Published: 24 May 2019
(This article belongs to the Special Issue Adopting Circular Economy Current Practices and Future Perspectives)
Abstract
:Based on the findings of the economic studies on the implications of industrialization in the case of growing economies, this study aims to present the economic factors that are at the basis of the development of circular economy at the European Union level. Starting with the model of economic growth based on the recycling rate of municipal waste, human capital, productivity of the resources, and green energy use, three statistical hypotheses were validated through a panel data model with the use of EViews 10 statistical software. The analysis was conducted for 27 European Union countries during the time frame 2008–2017. The paper highlights that the circular economy model is determined by resource productivity, labor employed in environmental protection, recycling rate of municipal waste, and renewable energy use.
1. Introduction
The use of limited resources generates multiple concerns for government, as well as for academics, as they seek to find the best solution to the challenge of growing demands for consumerist economies and climate change. Ratifying the Kyoto Protocol and enforcing it in as many countries as possible creates the premise for improving the industrial processes that generate pollution.
At present, the real problem is how to change the current structure of the consumption pattern, based on a production–consumption–waste model, into a circular economy (CE) which is regenerative by definition, based on a production–consumption–reuse model. According to Kirchherr et al. (2017), a CE is most frequently depicted as a combination of reduce, reuse, and recycle activities. Thus, an essential role in the circular economy is to invest in innovative equipment for environmental protection (Porter and Van der Linde 1995).
The economic literature of the past decades abounds with econometric and economic studies quantifying the impact of environment management programs and waste on the economic development of countries, with regard to a general equilibrium model.
In order to find the right answer to the Swedish Parliament’s request for a percentage reduction in the amount of waste related to the growth indicator, Sjöström and Östblom (2009) analyzed the interconnection of solid waste program management in the context of a general equilibrium model. McDonough and Braungart (2002) introduced the Cradle to Cradle (C2C) concept, which involves the recycling of waste and its transformation to new products. It is used in economic analyses which evaluate the production of renewable and clean energy, the diversity of ecosystems, and the use of the green energy sources (Browne et al. 2009). In contrast to this, other authors (Ayres 1995; De Wolf et al. 2017) have criticized the C2C formula used in industrial processes where products are transformed to waste, usually without being reused.
Beyond the evolution of the classical model of economic growth, the authors conceptualize the economic growth model to determine the main factors of impact, then capitalize empirical data in an attempt to determine the economic factors that stimulate or inhibit the transition to a circular pattern.
This paper is structured as follows: Firstly, we present an analysis of the key indicators of the CE at the EU level. Then, a description of the multiple linear regression model is discussed. Finally, the research hypotheses are presented and tested.
2. Materials and Methods
2.1. Research Methodology
The relationship between circular economy and economic growth has been analyzed by many researchers. It was demonstrated that there is a close link between the use of circular economy and economic growth (Browne et al. 2009). Other authors (Grossman and Krueger 1995; Brock and Taylor 2005; Lyasnikov et al. 2014) concluded that human capital and innovation for environmental benefits have a positive impact on economic growth.
Moreover, while some researchers (Su et al. 2013; Gopal et al. 2013; Cappa et al. 2016) argue that the use of renewable energy has a strong impact on economic growth, other economists (Cotae 2015; Ghisellini et al. 2016; Clodnitchi and Busu 2017) conclude that the innovative enterprises that bring innovative new products with environmental benefits to the market have a bigger impact on economic growth. Nevertheless, Geng et al. (2012) and George et al. (2015) argued that the productivity of resources and the recycling rate have a direct and significant impact on economic growth.
Starting from the empirical studies mentioned above, we focused our study on the research question: “What is the impact of the implementation of the circular economy on the EU’s economic growth?” In addition to what is known in this area, we tried to estimate which of five independent factors (i.e., labor productivity, labor force engaged in the production of environmental goods, recycling rate of municipal waste, the share of innovative enterprises that have brought innovative new products to the market with environmental benefits, and the use of renewable energy) have the most significant impact on the dependent variable of the regression model. According to the studies mentioned above, these exogenous variables are some of the main important factors to describe circular economy.
In order to quantify this impact analysis, three statistical assumptions were formulated, as shown in Table 1.
These statistical hypotheses were tested with a multilinear time series regression model, which is described in Section 3.
2.2. Description of the Circular Economy at the EU Level
In contrast to a linear economy, a CE is based on an economic model that offers resources better value and use. In this study, a few economic indicators describing a CE with direct impact on economic growth were used, and they were proxy variables in the regression model used in the next chapter.
Figure 1, Figure 2, Figure 3 and Figure 4 give us an overview of the degree of development and use of the CE at the EU level.
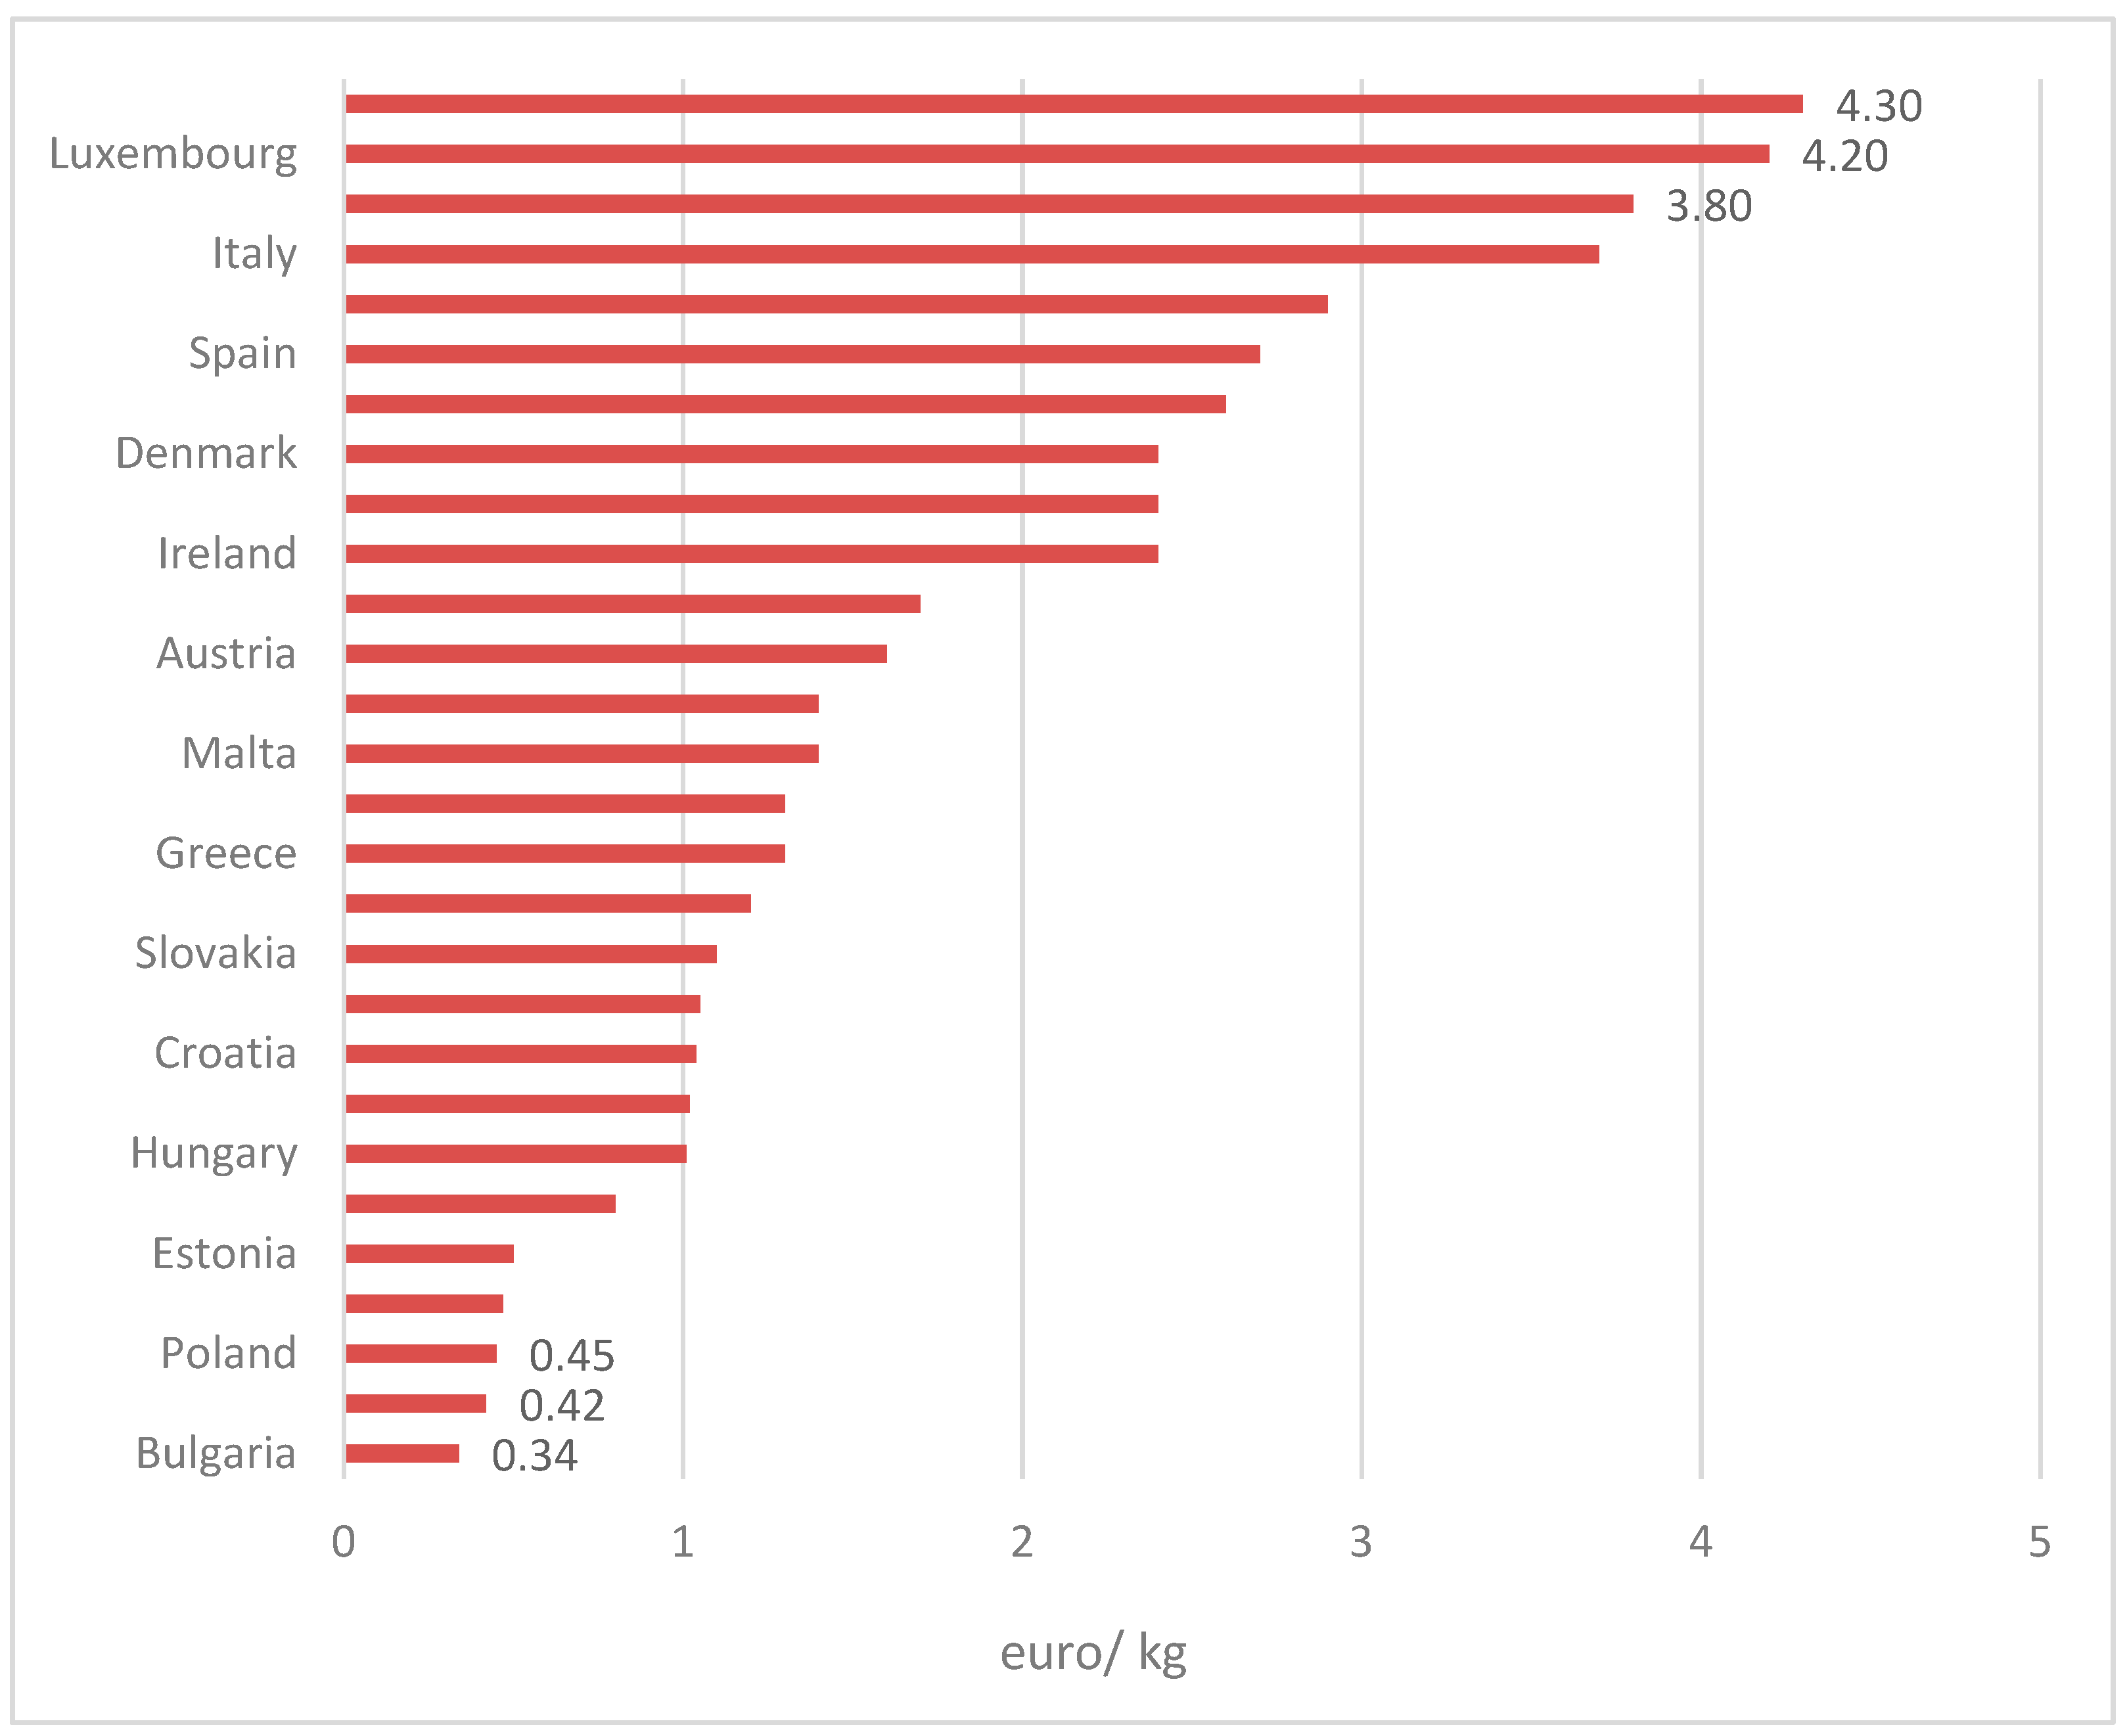
An important indicator of the CE is the “resource productivity” (Blomsma and Brennan 2017). This is defined as the ratio of a country’s GDP to the domestic consumption of materials, and shows us the economy’s efficiency in the 27 EU member states to use materials to produce well-being (Haas et al. 2015). Figure 1 shows the value of this indicator, calculated in euro/kg, at the level of EU member states.
This chart shows that the most efficient EU member states in terms of material use were the Netherlands (EUR 4.30/kg), Luxembourg (4.20 EUR/kg), and the UK (3.80 EUR/kg), while the least efficient were Poland (EUR 0.45/kg), Romania (EUR 0.42/kg), and Bulgaria (EUR 0.34/kg).
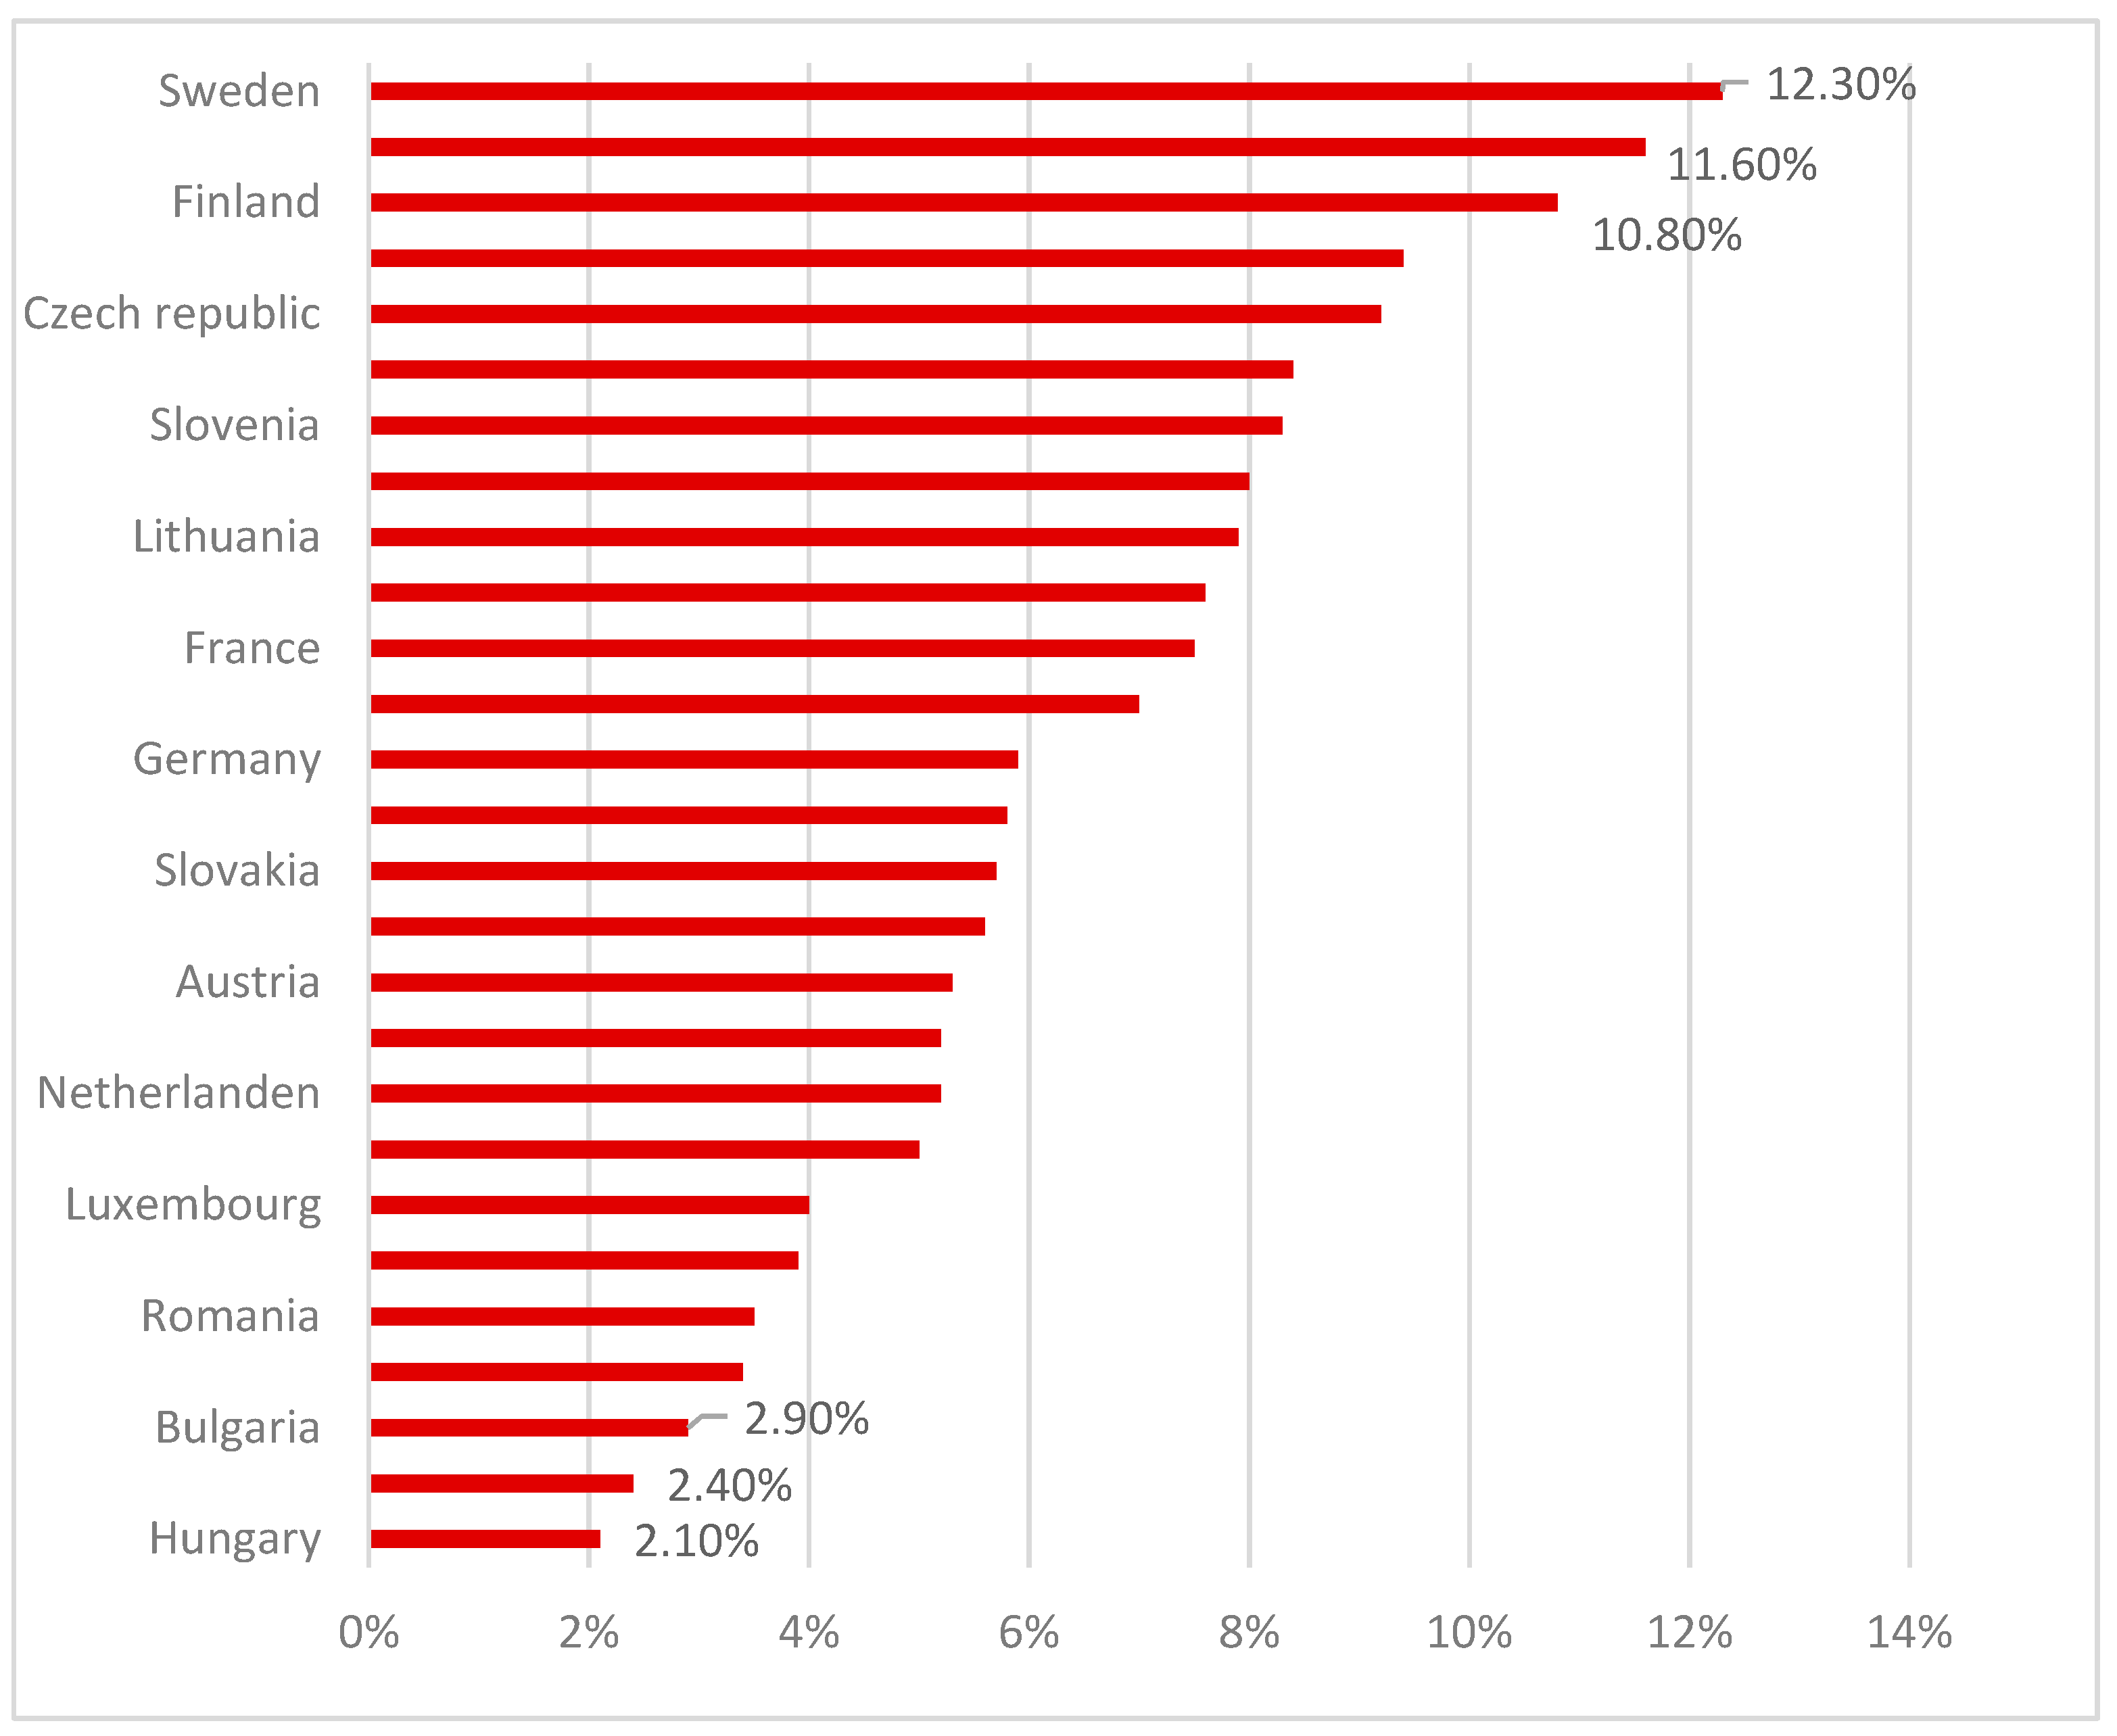
Another important indicator of the CE is given by the workforce engaged in the production of environmental goods (Lundvall 1996). This indicator can be seen at the level of the EU member states in 2017 in Figure 2.
Thus, the EU countries with the highest percentage of employees in the field of services and production of environmental goods (in terms of the total active population) were Sweden (12.3%), Denmark (11.6%), and Finland (10.8%), while the countries with the lowest percentage of employees in this area were Bulgaria (2.9%), Portugal (2.4%), and Hungary (2.1%).
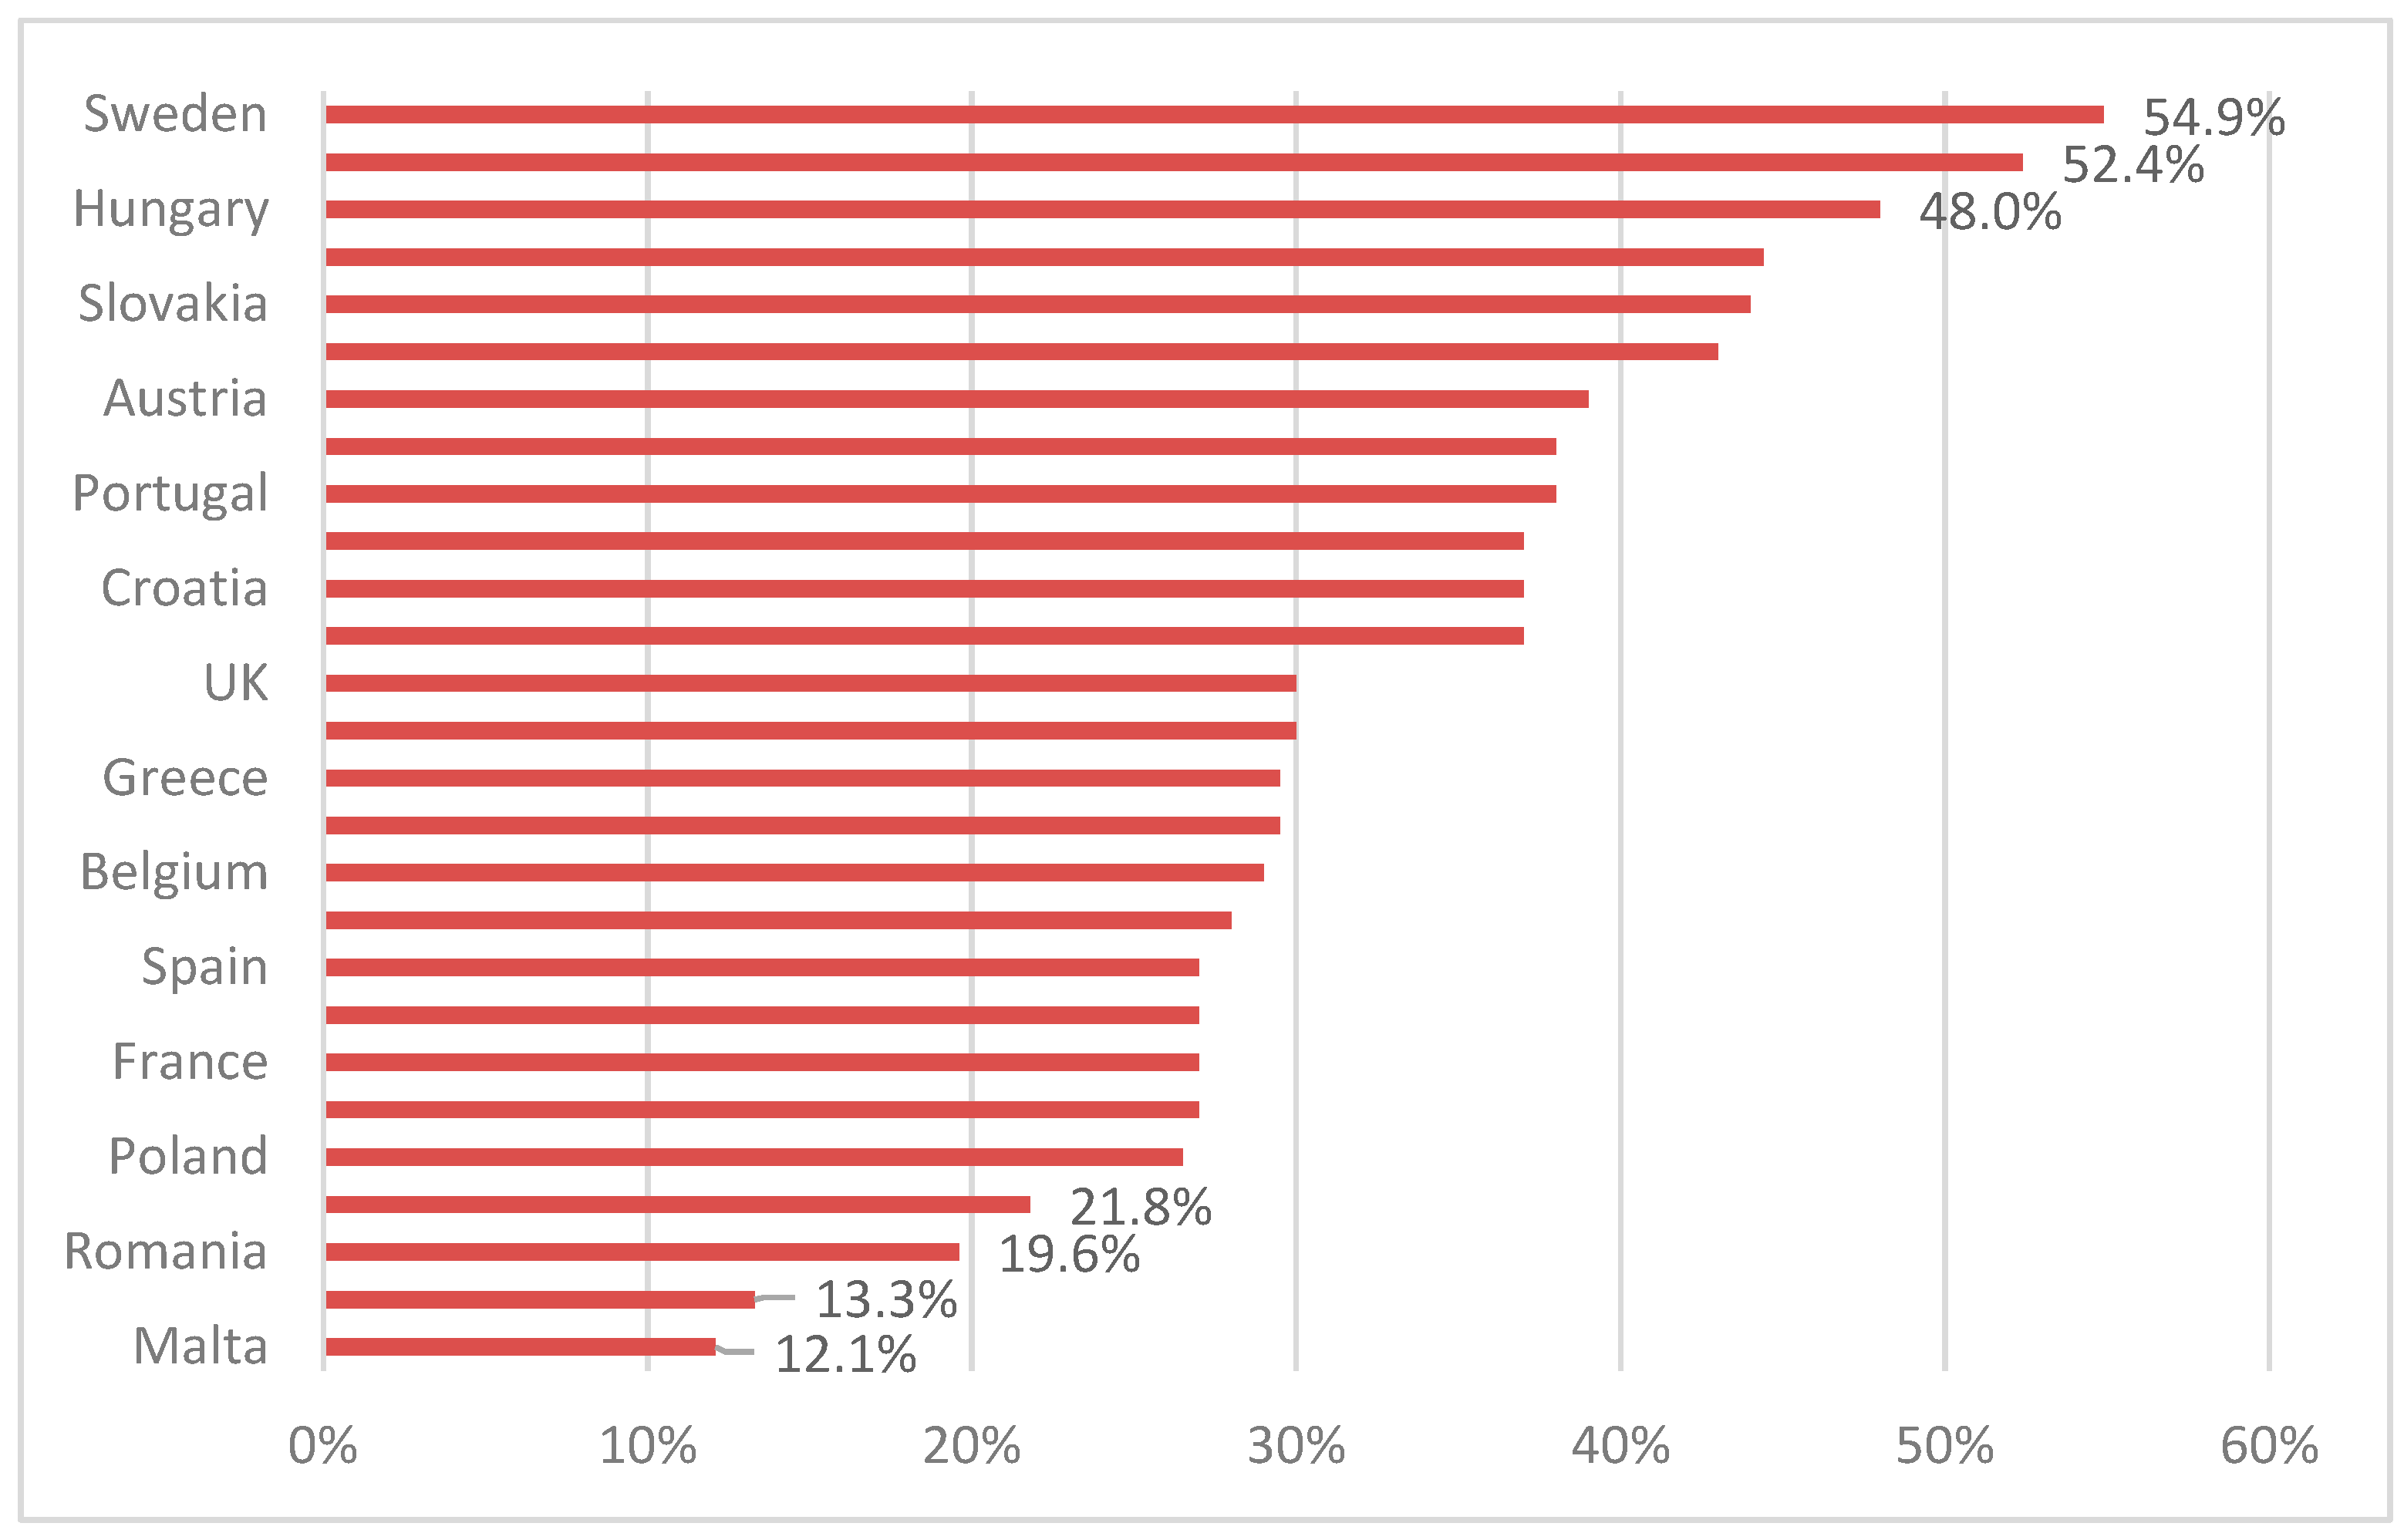
Furthermore, Figure 3 reveals the status of the recycling rate of municipal waste in the EU countries in 2017.
From the figure above, according to Eurostat, we could conclude that the EU countries with the highest recycling rate of municipal waste were Sweden with 54.9%, Denmark with 52.4%, and Hungary with 48%. The countries with the lowest recycling rates were Romania with 19.6%, Cyprus with 13.3%, and Malta with 12.1%.
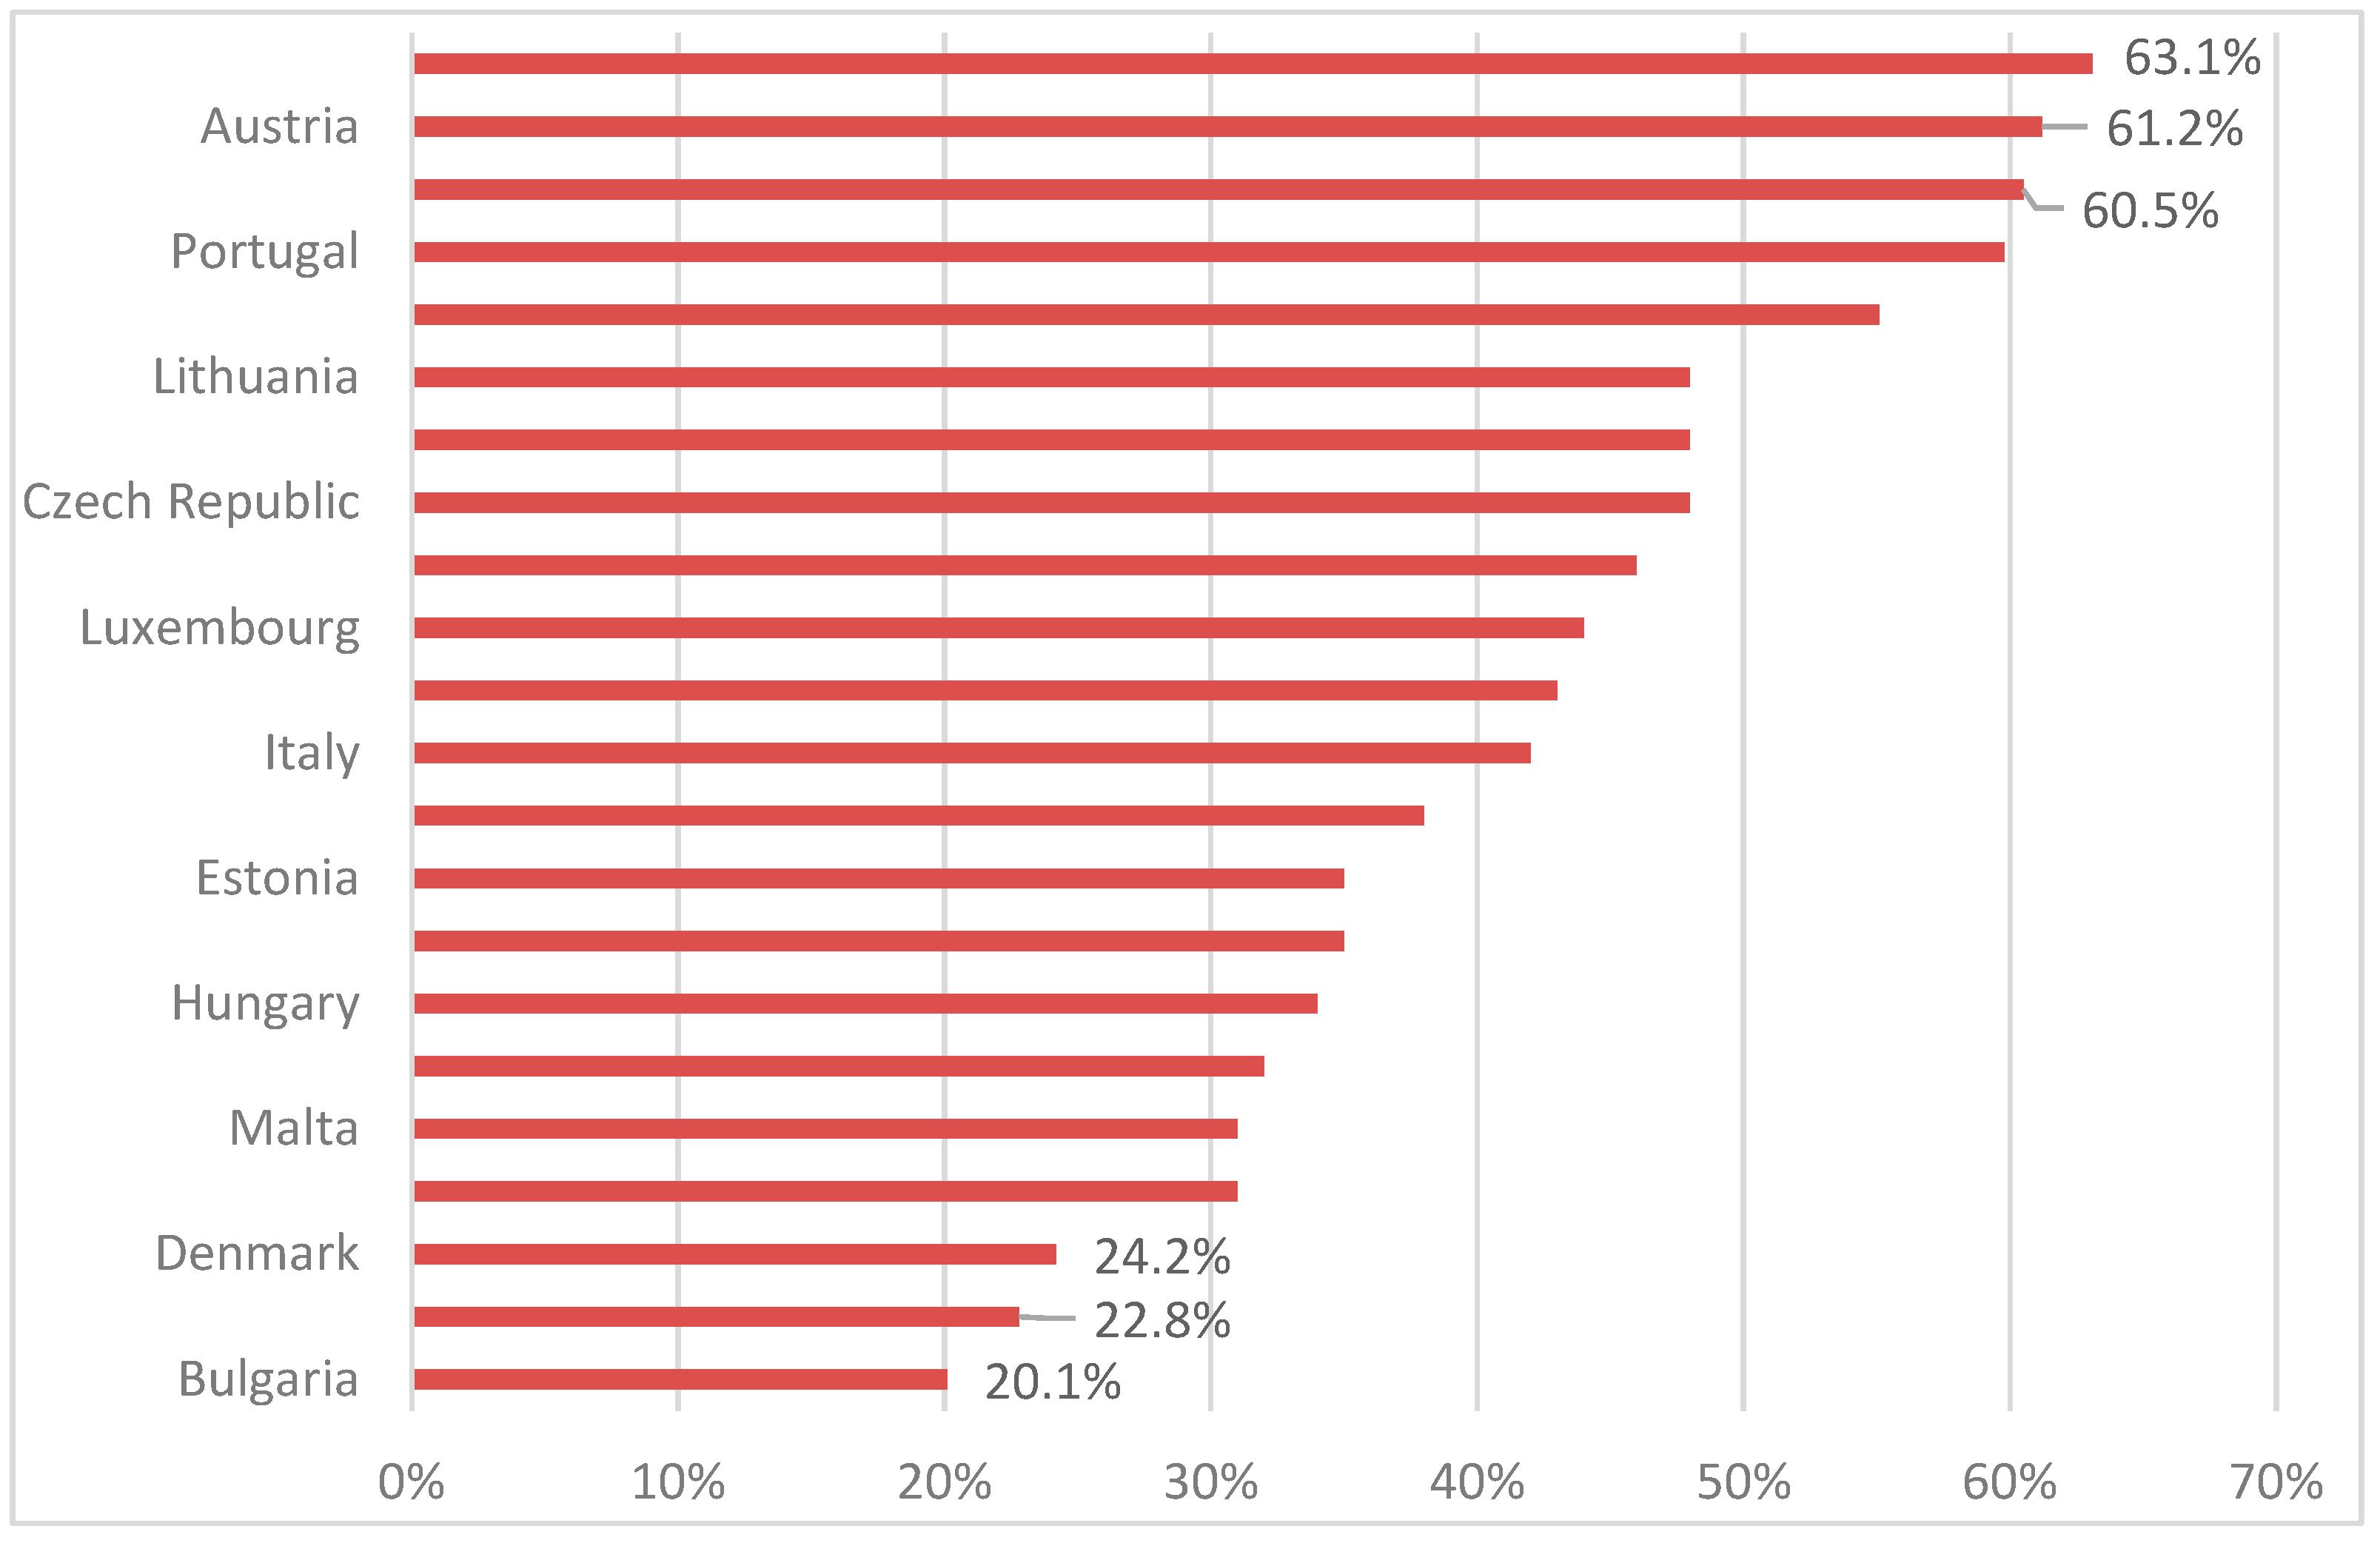
Figure 4 illustrates the shares of innovative enterprises that brought new value-added and environmental benefits to the EU member states in the year 2017.
In the figure above, it can be seen that, in 2017, Germany ranked first (63.1%), followed by Austria (61.2%) and Finland (60.5%). In the same time, Denmark was positioned at the third-last level in the EU, with a share of 24.2% of companies which brought innovative new products with environmental benefits to the market, followed by Romania (22.8%) and Bulgaria (20.1%)
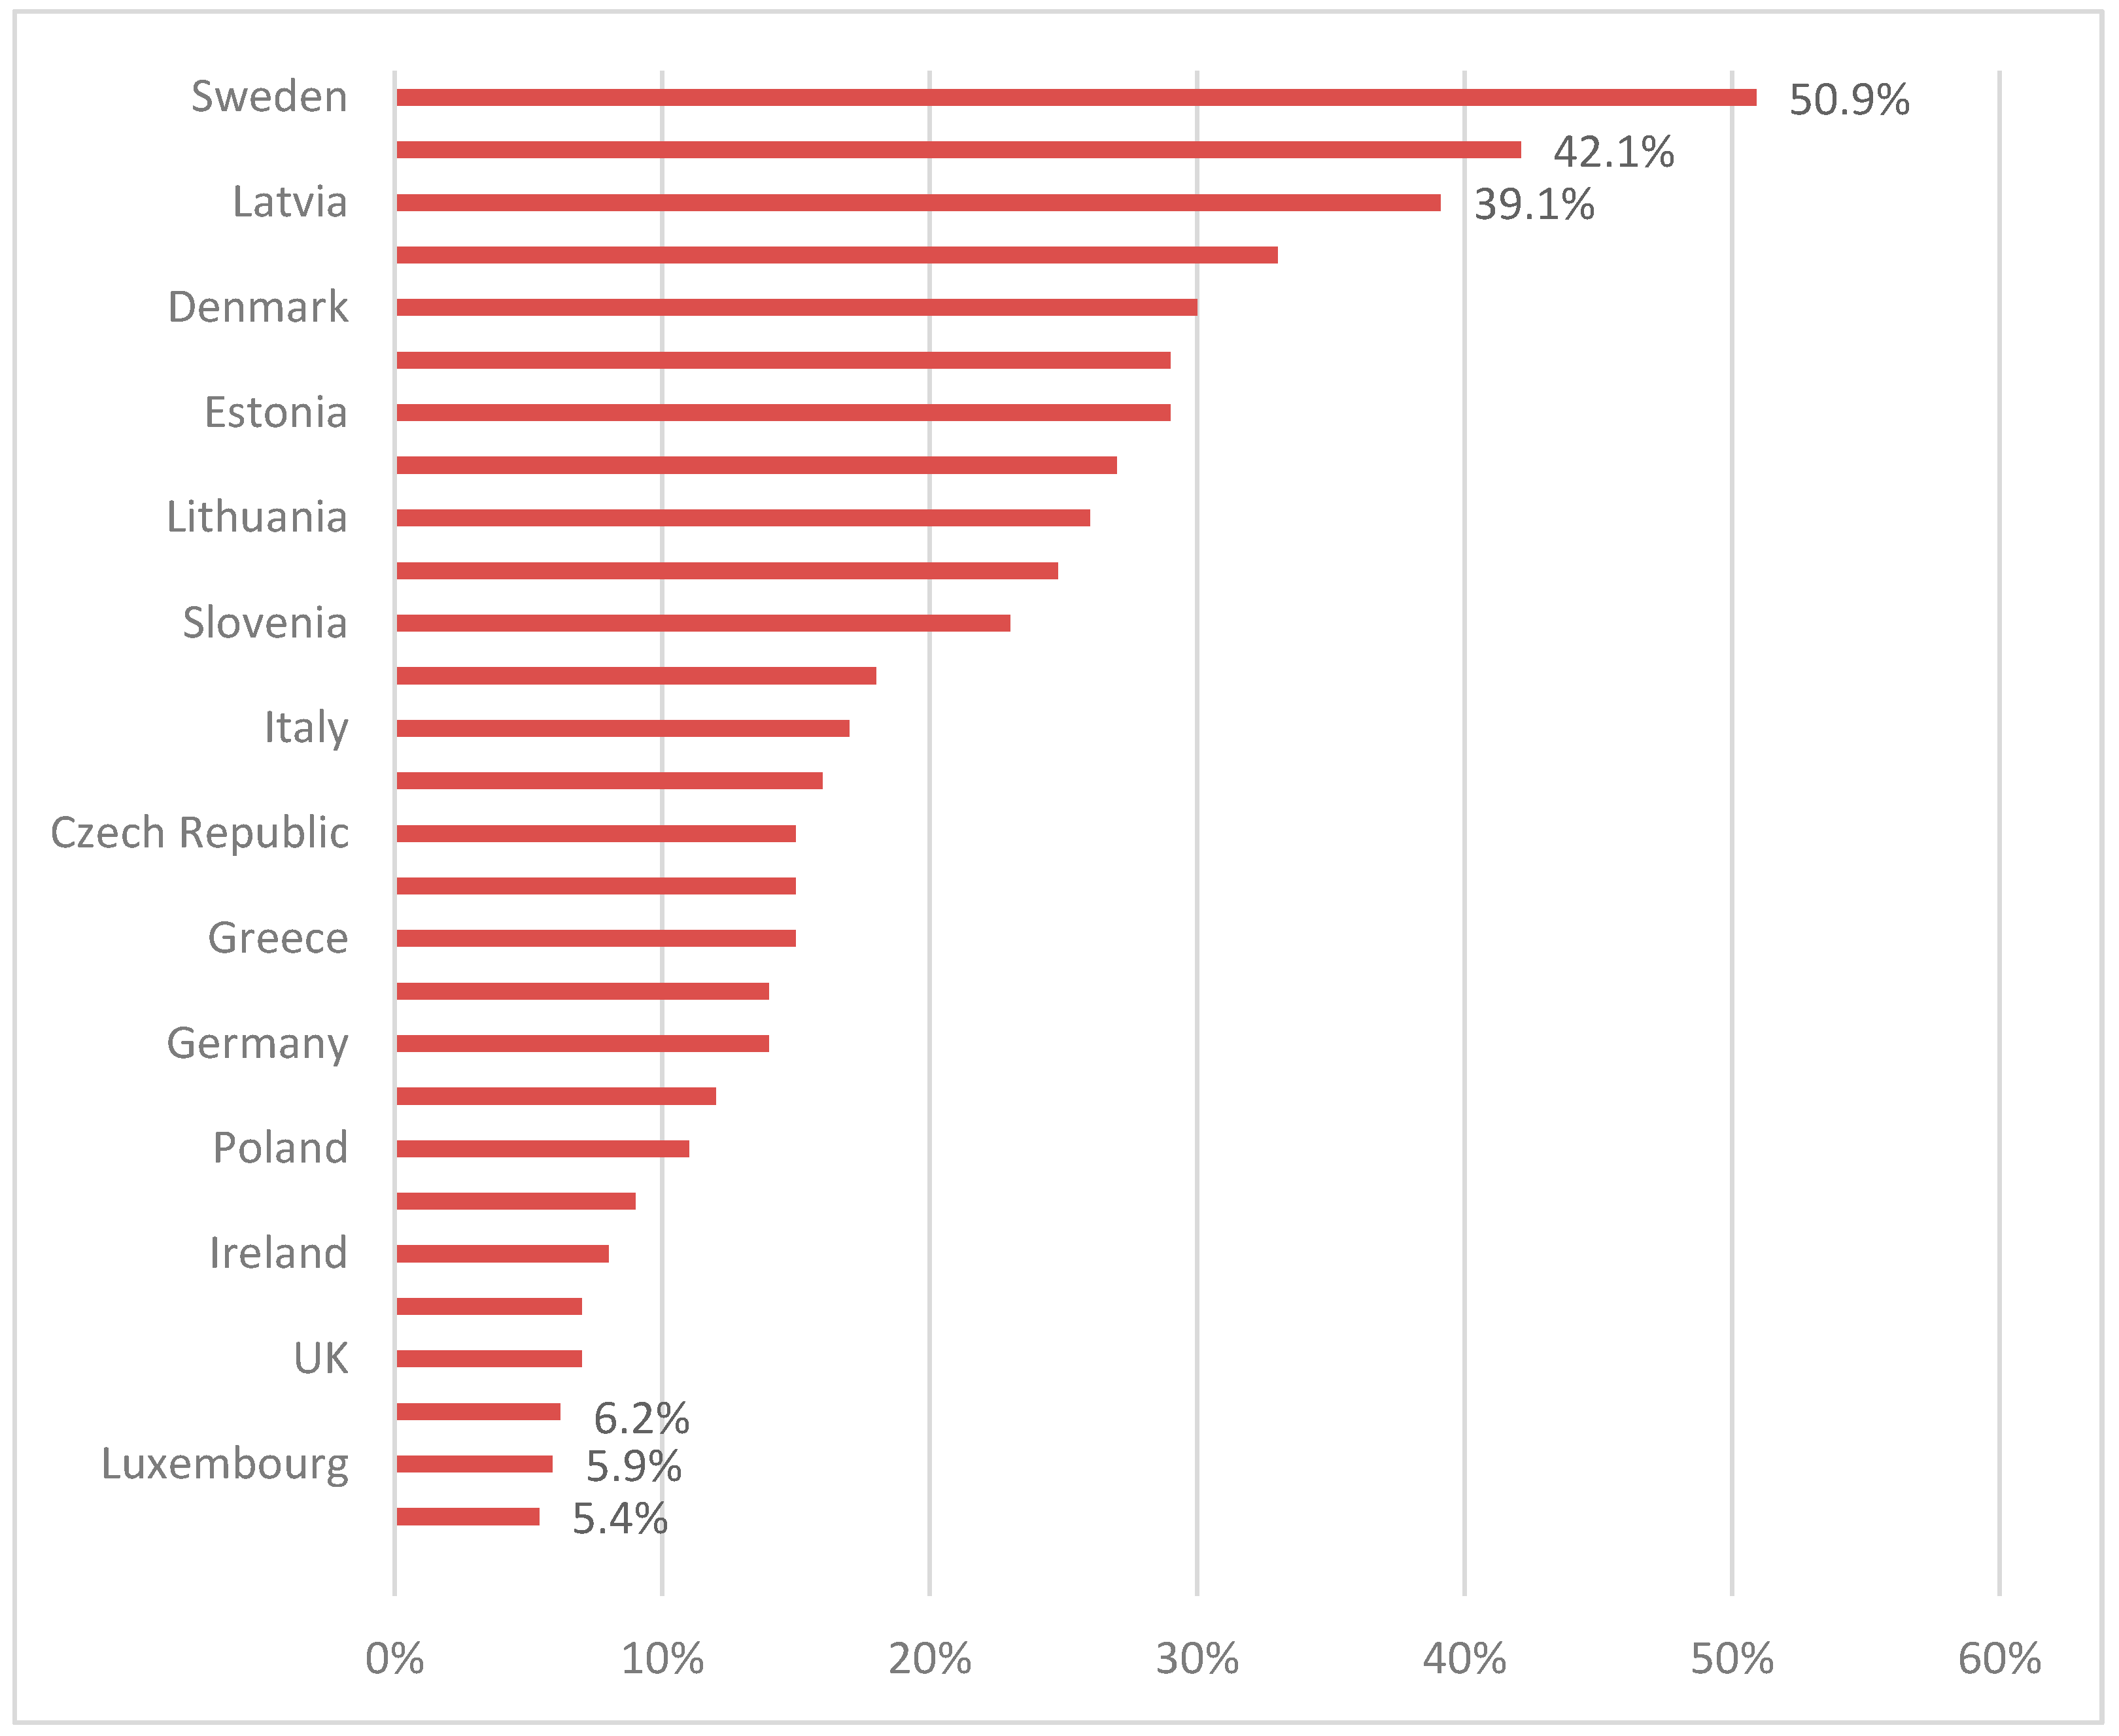
Figure 5 shows us the ranking among EU member states with respect to the use of green energy, calculated as a percentage of total energy consumption in 2017.
From this graph we could conclude that Nordic EU states were the countries with the highest green energy use, namely, Sweden (50.9%), Finland (42.1%), and Latvia (39.1%). On the opposite side were the following countries: the Netherlands (6.2%), Luxembourg (5.9%), and Malta (5.4%).
In conclusion, the descriptive analysis of the circular economy indicates that the Nordic countries were at the top of the rankings, with the highest degree of circular economy implementation, while the EU countries from Southeastern Europe were at the lowest places. One of the possible explanations comes from the environmental policies which were developed in the Nordic countries. For instance, the Nordic countries have implemented the “Circular Public Procurement in the Nordic Countries” (CIPRON), which is a process expected to provide conditions and criteria that would stimulate energy and material savings and closed material loops, in addition to spreading innovative solutions and creating markets for clean solutions. Another explanation could come from the fact that these countries have implemented alternative energy use in their countries. Moreover, according to the Eco-Innovation and Competitiveness Annual Report (2017), at the European level, Sweden, Finland, and Denmark ranked highest in the composite score (16 indicators arranged in 5 components) in particular due to their top performance in the components of eco-innovation inputs, activities, and outputs.
3. Results
Descriptive statistics related to the variables used in the analysis (i.e., mean, median, maximum, minimum, and standard error) are given in Table 2. The mean and median values of the descriptive statistics for the variables in the model in Table 2 are indicative of how close the data are to normal dispersion. In cases where the data have a standard normal distribution, the mean and median values approximate each other (Chang 2008). Table 2 also shows that the mean and median values of all variables were very close to each other. For this reason, it was assumed that all variables in the model were close to a standard normal distribution.
A correlation table was used to investigate the existence of multicollinearity among the exogenous variables used in the model. Since the correlation coefficients in Table 3 are smaller than ±0.70, it was assumed that there were multicollinearity problems among the variables (Weinberg and Carmeli 2008).
F-test and Lagrange multiplier Breusch–Pagan test were performed to determine whether the method used in our analysis of the research model in Equation (1) was fixed effects, random effects, or pooled data, after reporting descriptive statistics for the variables used in the model.
The aim of using the F-test is to test the validity of the pooled model from the intended static panel data models against the fixed effect model (Urban 2015; Schmidheiny 2016). Restricted and unrestricted models are required to perform this test.
Restricted model:
Unrestricted model:
If the null hypothesis (H0) is not rejected; it will be βi = β in such a case, a classical model is accepted, and a solution is made by using the pooled data technique. Otherwise, the fixed effect model will be valid.
Table 4 shows the F-test statistical results. Hypothesis H0 was accepted since the probability value was greater than the error according to these results. It was determined that the fixed effect model would not be suitable for our analysis.
The Lagrange multiplier Breusch–Pagan test is used to make a choice between the pooled method and the random models (Block 2009). The hypothesis that the variance of random effects is zero is as follows:
if the variance of the unit effects is zero, it indicates that the model will be analyzed with the pooled model. The results of the Breusch–Pagan test are shown in Table 5.
Upon examining the test results in Table 5, hypothesis H0 was accepted when the probability value was greater than 0.05. In this case, it was concluded that the random effect model would not be suitable for our analysis. Therefore, we could conclude that the pooling of the model in Equation (1) was appropriate.
The regression equation used to test the three statistical hypotheses was accomplished using the pooled least square method. This method was used to estimate performance-based economic growth and the use of circular economy at the EU level between 2008 and 2017.
For the regression analysis, the economic growth was considered as the dependent variable (Y) influenced by a set of four independent factors (regressors), which were the productivity of the resources (X1), employment in production of environmental goods (X2), recycling rate (X3), and the market shares of the innovative enterprises which have brought innovative new products with environmental benefits to the market (X4). Multiple linear regression analysis covered the following stages:
- Development of the regression model;
- Estimating model parameters; and
- Checking the accuracy of the results.
Analyzing the evolution of economic growth during 2008–2017 at the EU level, according to the independent variables, the following results were obtained for the multiple regression function using the multifactorial linear regression model (Table 6):
According to the above table, the regression equation is:
where:
Y = −1.9335 + 1.734X1 + 1.168X2 + 0.457X3 + 0.503X4 + 0.687X5,
- Y = GDP per capita growth;
- X1 = labor productivity;
- X2 = labor force engaged production of environmental goods;
- X3 = recycling rate of municipal waste;
- X4 = the share of innovative enterprises that have brought innovative new products with environmental benefits to the market;
- X5 = use of renewable energy.
Thus, according to Table 7, all three statistical assumptions were valid.
A description of the regression variables can be observed in Table 2.
4. Discussion
In this chapter we discuss the factor analysis resulting in standardized pooled least squares (PLS). The method was used by the author to estimate the impact of circular economy on growth in the EU countries.
The relationship between CE level and economic growth has received attention in recent economic literature. Multiple linear regression model parameters used in this study were estimated by PLS, and the analysis was performed by EViews 10.0 software.
Analyzing the evolution of economic growth in the 27 EU member states in 2008–2017 through independent variables (i.e., GDP per capita, productivity of the resources, employment in the production of environmental goods, recycling rate of municipal waste, market share of the enterprises that have brought innovative new products with environmental benefits to the market, and renewable energy use), the following results were obtained through the analysis of multifactorial regression (Table 2): Y = −1.9335 + 1.734X1 + 1.168X2 + 0.457X3 + 0.503X4 + 0.687X5, with standard error coefficients (1.245), (1.430), (1.012), (0.795), and (1.768).
Since R-squared was 0.7986 we concluded that 79.86% of the variability of the dependent variable was explained by the independent variables in the model. Additionally, the Durbin–Watson test indicated that there were no collinearity problems between the independent variables in the model since the value of statistical test was DW = 2.09, very close to 2, which leads to the conclusion that there was no autocorrelation of errors. The positive coefficient β1 confirms our expectations regarding the convergence between countries with low to high resource productivity. As expected, the recycling rate of municipal waste was significant and positive. Coefficients of predictor variables were also significant and positive, which means that the proxies used for the CE had a positive and significant impact on economic growth.
As can be seen from Table 6, the model estimation results were statistically significant at a significance level of 95% for all four independent variables in the model. The results of our analysis are consistent with the work of Puigcerver-Peñalver (2007), who developed a regression model for economic growth that is partly explained by environmental factors and CE.
The econometric model revealed that our analysis is valid and correctly specified and the environmental circular economy factors were significant indicators of economic growth in all 27 EU countries, given that the regression-estimated coefficients of the model were significantly different than zero and most of the variation of economic growth in EU countries was explained by the model. The results of our study are in line with recent papers of circular economy impact on economic growth (Preston 2012; Su et al. 2013; and Bocken et al. 2016).
The results of our analysis were consistent with the work of Sofian et al. (2017), which developed a regression model to explain the economic growth of EU member states, partly explained by environmental factors and innovation. The results also are connected to a study by Biber-Freudenberger et al. (2018), which highlighted that sustainability is not improved by a simple shift to renewable resources or materials. The authors argued that the productivity of the resources, environmental innovation, and recycling rates are important factors of economic growth and sustainable development.
5. Conclusions
The European Commission report on environmental policy indicates the increasing rates of resource reuse in EU countries. The level of implementation of the CE model requires constant and significant investments in the environmental infrastructure in order for EU countries to develop towards meeting the EU’s environmental objectives.
Shortcomings were observed in the labor employed in the field of environmental protection and productivity of resources. Beyond the inventory of the current panorama of the implementation of CE at the EU level, this paper presents the advantages of using a conceptual model based on the efficient and responsible consumption of resources for sustainable economic growth.
The studies on EU developed economies have shown various benefits based on programs for the education of civil society in environmental protection, as well as making investments in infrastructure for collection, sorting, and recycling. The positive effects of implementing circular economy models increase the level of labor employed, municipal revenues, and the profit earned by entrepreneurs providing environmental infrastructure.
Nevertheless, the most important benefit of using the circular economy is felt individually. Making an analogy between extending products’ life through reuse and our daily life, it could be observed how environmental and recycling factors are improving the quality of human life.
The multiple regression analysis carried out in this study reveals the impact of independent CE factors on dependent economic growth. At the same time, we conclude that the degree of innovation in the environment and the use of renewable energy play a greater role in terms of economic growth impact rate compared to the impact of GDP/capita and increasing human capital involved in renewable energy.
Our results confirm the statistical hypothesis, mainly related to the strong and significant effect of resource productivity on economic growth, confirming the European point of view that an increase of the resource productivity of 30% by 2030 may lead to a GDP growth of almost 1% (European Union 2002).
This study could be of great importance for local, regional, and national public authorities of all EU countries involved in framing the legislative ground, as well as for enterprises, which could elaborate their business plans according to the predicted effects the implementation of circular economy may have on every member state.
The main limitation of this research is related to the time database used for the factor analysis, given that the calculation of macroeconomic indicators used in the multiple regression analysis covered a period of ten years. Thus, future research should be conducted for longer periods of time, which may provide a better panorama of the regression model applied for the macroeconomic indicators of the CE.
In conclusion, following our analysis, we can state that the economic model on economic growth was valid and accurately specified, and that the factors of renewable energy, productivity of the resources, recycling rate, environmental employment, and innovation were significant factors of economic growth at the EU level. This was because they registered significant values for the estimated coefficients, which were significantly different from zero, and because the model explained most of the variation in the economic growth of EU member states. This paper adds to the recent studies of the impact of CE on economic growth at the EU level (Geissdoerfer et al. 2017; Zink and Geyer 2017; Ghisellini et al. 2016).
Funding
This research received no external funding.
Conflicts of Interest
The author declares no conflict of interest.
References
- Ayres, Robert. 1995. Life cycle analysis: A critique. Resources, Conservation and Recycling 14: 199–223. [Google Scholar]
- Biber-Freudenberger, Lisa, Amit Kumar Basukala, Martin Bruckner, and Jan Börner. 2018. Sustainability Performance of National Bio-Economies. Sustainability 10: 2705. [Google Scholar] [CrossRef]
- Block, Joern. 2009. Long-Term Orientation of Family Firms: An Investigation of R&D Investments, Downsizing Practices, and Executive Pay. Wiesbaden: Gabler, Available online: https://link.springer.com/book/10.1007/978-3-8349-8412-8 (accessed on 18 March 2019).
- Blomsma, Fenna, and Geraldine Brennan. 2017. The emergence of circular economy: A new framing around prolonging resource productivity. Journal of Industrial Ecology 21: 603–14. [Google Scholar] [CrossRef]
- Bocken, Nancy, Ingrid de Pauw, Conny Bakker, and Bram van der Grinten. 2016. Product design and business model strategies for a circular economy. Journal of Industrial and Production Engineering 33: 308–20. [Google Scholar] [CrossRef]
- Brock, William, and Scott Taylor. 2005. Economic Growth and the Environment: A Review of Theory and Empirics. In Handbook of Economic Growth. vol. 1, pp. 1749–821. Available online: http://www.sciencedirect.com/science/article/pii/S1574068405010282 (accessed on 14 February 2019).
- Browne, David, Bernadette O’Regan, and Richard Moles. 2009. Use of carbon footprinting to explore alternative household waste policy scenarios in an Irish city-region. Resources, Conservation and Recycling 54: 113–22. [Google Scholar] [CrossRef]
- Cappa, Francesco., Jeffrey Laut, Oded Nov, Luca Giustiniano, and Maurizio Porfiri. 2016. Activating social strategies: Face-to-face interaction in technology-mediated citizen science. Journal of Environment Management 182: 374–84. [Google Scholar] [CrossRef]
- Chang, Ni-Bin. 2008. Economic and policy instrument analyses in support of the scrap tire recycling program in Taiwan. Journal of Environmental Management 86: 435–50. [Google Scholar] [CrossRef] [PubMed]
- Clodnitchi, Roxana, and Busu Cristian. 2017. Energy poverty in Romania–drivers, effects and possible measures to reduce its effects and number of people affected. Paper presented at International Conference on Business Excellence, Bucharest, Romania, March 21–22; vol. 11, pp. 138–45. [Google Scholar]
- Cotae, Catrinel Elena. 2015. Regional performances in the context of a transition towards the circular economy: Structuring the assessment framework. Ecoforum Journal 4. Available online: http://ecoforumjournal.ro/index.php/eco/article/view/222 (accessed on 18 August 2017).
- De Wolf, Catherine, Francesco Pomponi, and Alice Moncaster. 2017. Measuring embodied carbon dioxide equivalent of buildings: A review and critique of current industry practice. Energy and Buildings 140: 68–80. [Google Scholar] [CrossRef]
- Eco-Innovation and Competitiveness Annual Report. 2017. Available online: http://eco.nomia.pt/contents/documentacao/kh0414991enn-002.pdf (accessed on 13 May 2019).
- EU. 2002. Regulation (EC) No 2150/2002 of the European Parliament and the Council on Waste Statistics. Available online: http://www.kluwerlawonline.com/abstract.php?id=EELR2003019 (accessed on 23 December 2018).
- Eurostat. 2017. Eurostat. Your Key to European Statistics. Available online: http://ec.europa.eu/eurostat (accessed on 24 September 2018).
- Eviews. 2017. User Guide. version 10.0. Irvine: QMS Quantitative Micro Software, pp. 140–41. [Google Scholar]
- Geissdoerfer, Martin, Paulo Savaget, Nancy Bocken, and Erik Jan Hultink. 2017. The Circular Economy—A new sustainability paradigm? Journal of Cleaner Production 143: 757–68. [Google Scholar] [CrossRef]
- Geng Yong, Jia Fu, Joseph Sarkis, and Bing Xue. 2012. Towards a national circular economy indicator system in China: An evaluation and critical analysis. Journal of Cleaner Production 23: 216–24. [Google Scholar] [CrossRef]
- George, Donald Ar, Brian Chi-ang Lin, and Yunmin Chen. 2015. A circular economy model of economic growth. Environmental Modelling & Software 73: 60–63. [Google Scholar]
- Ghisellini, Patrizia, Catia Cialani, and Sergio Ulgiati. 2016. A review on circular economy: The expected transition to a balanced interplay of environmental and economic systems. Journal of Cleaner Production 114: 11–32. [Google Scholar] [CrossRef]
- Gopal, Anandasivam, Manu Goyal, Serguei Netessine, and Matthew Reindorp. 2013. The impact of new product introduction on plant productivity in the North American automotive industry. Management Science 59: 2217–36. [Google Scholar] [CrossRef]
- Grossman, Gene, and Alan Krueger. 1995. Economic growth and the environment. The Quarterly Journal of Economics 110: 353–77. [Google Scholar] [CrossRef]
- Haas, Willi, Fridolin Krausmann, Dominik Wiedenhofer, and Markus Heinz. 2015. How circular is the global economy?: An assessment of material flows, waste production, and recycling in the European Union and the world in 2005. Journal of Industrial Ecology 19: 765–77. [Google Scholar] [CrossRef]
- Kirchherr, Julian, Denise Reike, and Marko Hekkert. 2017. Conceptualizing the circular economy: An analysis of 114 definitions. Resources. Conservation and Recycling 127: 221–32. [Google Scholar] [CrossRef]
- Lundvall, Bengt-Ake. 1996. The Social Dimension of the Learning Economy. Available online: https://pdfs.semanticscholar.org/202b/775ebcdbcaf8fd7c052f9a37a23776a3ea13.pdf (accessed on 7 May 2018).
- Lyasnikov, Nikolay Vasilievich, Mikhail Nikolaevich Dudin, Vladimir Dmitriyevich Sekerin, Mikhail Yakovlevici Veselovsky, and Vera Grigoryevna Aleksakhina. 2014. The national innovation system: The conditions of its making and factors in its development. Life Science Journal 11: 535–38. [Google Scholar]
- McDonough, William, and Michael Braungart. 2002. Cradle to Cradle: Remaking the Way We Make Things. New York: North Point Press. [Google Scholar]
- Porter, Michael, and Claas Van der Linde. 1995. Toward a new conception of the environment-competitiveness relationship. Journal of Economic Perspectives 9: 97–118. [Google Scholar] [CrossRef]
- Preston, Felix. 2012. A Global Redesign? Shaping the Circular Economy. London: Chatham House, Available online: https://www.bitcni.org.uk/wp-content/uploads/2014/11/bp0312_preston.pdf (accessed on 11 April 2019).
- Puigcerver-Peñalver, Mari Carmen. 2007. The impact of structural funds policy on European regions’ growth. A theoretical and empirical approach. The European Journal of Comparative Economics 4: 179. [Google Scholar]
- Schmidheiny, Kurt. 2016. Panel Data: Fixed and Random Effects. Basel Universität. Available online: http://www.schmidheiny.name/teaching/panel2up.pdf (accessed on 18 December 2017).
- Sjöström, Magnus, and Goran Östblom. 2009. FutureWaste Scenarios for Sweden Based on a CGEmodle. Working Paper 109, National Institute of Economic Research, Stockholm, Sweden. Available online: https://econpapers.repec.org/paper/hhsnierwp/0109.htm (accessed on 11 January 2019).
- Sofian, Saudah, Mike Tayles, and Richard Pike. 2017. The implications of intellectual capital on performance measurement and corporate performance. Jurnal Kemanusiaan 4: 13–24. [Google Scholar]
- Su, Biwei, Almas Heshmati, and Yong Geng. 2013. A review of the circular economy in China: Moving from rhetoric to implementation. Journal of Cleaner Production 42: 215–27. [Google Scholar] [CrossRef]
- Urban, Markus. 2015. The Influence of Blockholders on Agency Costs and Firm Value an Empirical Examination of Blockholder Characteristics and Interrelationships for German Listed Firms. Berlin and Heidelberg: Springer. [Google Scholar]
- Weinberg, Diana, and Abraham Carmeli. 2008. Exploring the antecedents of relationship commitment in an import–export dyad. In New Perspectives in International Business Research. Edited by Maryann Feldman and Grazia Santangelo. Bingley: Emerald, pp. 113–36. [Google Scholar]
- Zink, Trevor, and Roland Geyer. 2017. Circular economy rebound. Journal of Industrial Ecology 21: 593–602. [Google Scholar] [CrossRef]
Figure 1.
Productivity of the resources in EU countries in 2017. Source: based on processed data provided by Eurostat (2017).

Figure 2.
The labor force employed in the production of goods for environmental protection in EU countries in 2017. Source: based on processed data provided by Eurostat (2017).

Figure 3.
Recycling rate of the municipal waste in EU countries. Source: based on processed data provided by Eurostat (2017).

Figure 4.
The share of enterprises that have brought innovative new products with environmental benefits to market in EU countries in 2017. Source: based on processed data provided by Eurostat (2017).

Figure 5.
The green energy use in total energy consumption in EU countries, in 2017. Source: based on processed data provided by Eurostat (2017).


Table 1.
Hypotheses of the research study.
| Hypothesis 1 | European Union (EU) member states with a higher number of employees in the field of the production of goods for environmental protection have higher economic growth. |
| Hypothesis 2 | Renewable energy use at the EU level has a significant and strong impact on economic growth. |
| Hypothesis 3 | Innovative enterprises with big market shares in the EU member states which have brought innovative new products with environmental benefits to the market have a greater impact on economic growth. |
Table 2.
Statistical description of variables in the model.
| Variable | Mean | Median | Standard Deviation | N |
|---|---|---|---|---|
| Y | 0.2014 | 0.1942 | 0.1043 | 27 |
| X1 | 8.9432 | 8.9753 | 3.3022 | 27 |
| X2 | 0.1520 | 0.2013 | 0.0834 | 27 |
| X3 | 0.6012 | 0.7021 | 0.1027 | 27 |
| X4 | 0.9021 | 0.8042 | 0.0702 | 27 |
| X5 | 0.8124 | 0.9324 | 0.0987 | 27 |
Source: Data analysis was performed by the author in EViews 10.0 (EViews 2017).
Table 3.
Correlation matrix.
| Variable | Y | X1 | X2 | X3 | X4 | X5 |
|---|---|---|---|---|---|---|
| Y | 1 | 0.702 | 0.539 | 0.616 | 0.632 | 0.792 |
| X1 | 0.702 | 1 | 0.028 | 0.034 | 0.112 | 0.109 |
| X2 | 0.602 | 0.034 | 1 | 0.052 | 0.106 | 0.078 |
| X3 | 0.598 | 0.028 | 0.048 | 1 | 0.079 | 0.081 |
| X4 | 0.623 | 0.112 | 0.106 | 0.079 | 1 | 0.102 |
| X5 | 0.792 | 0.109 | 0.078 | 0.081 | 0.102 | 1 |
Source: Data analysis was performed by the author in EViews 10.0.
Table 4.
Fixed effect test.
| F Statistics | 3.56 |
| F Stat. prob. | 0.210 |
Table 5.
Random effect test.
| Cross Section | Time | Both | |
|---|---|---|---|
| Coefficient | 32.23 | 54.324 | 89.65 |
| Probability | 0.089 | 0.567 | 0.035 |
Table 6.
Impact of resource productivity, recycling rate, consumption, environment innovation, and recycling rate of correlations on GDP per capita growth at the EU level.
Table 6.
Impact of resource productivity, recycling rate, consumption, environment innovation, and recycling rate of correlations on GDP per capita growth at the EU level.
| Dependent Variable: GDP_CAPITA_GROWTH | ||||
| Method: Pooled least squares | ||||
| Sample: 2008–2017 | ||||
| Total panel observations: 270 GDP_CAPITA_GROWTH = C(1) + C(2) × ROD_OF_RES + C(3) × ENVIRON_EMPL + C(4) × REC_RATE + C(5) × ENVIRON_INNOV + C(6) × RENEWABLE | ||||
| Coefficient | Std. Error | t-Statistic | Prob. | |
| C | −1.9335 | 1.245 | 3.252243 | 0.0084 |
| Prod_of_res | 1.734502 | 1.430 | 3.58543 | 0.0045 |
| Environ_Empl | 1.168740 | 1.320 | 4.188850 | 0.0053 |
| Rec_Rate | 0.457692 | 1.012 | 4.821022 | 0.0047 |
| Environ_Innov | 0.503238 | 0.795 | 3.328985 | 0.0310 |
| Renewable | 0.687912 | 1.768 | 4.567883 | 0.0210 |
| R-squared | 0.798652 | Mean dependent var | 8.7892 | |
| Adjusted R-squared | 0.824678 | S.D. dependent var | 0.6043 | |
| S.E. of regression | 0.098723 | Akaike info criterion | 1.8023 | |
| Sum squared resid | 1.408763 | Schwarz criterion | 1.7098 | |
| Log likelihood | 119.3076 | Hannan–Quinn criter. | 1.6987 | |
| Durbin–Watson stat | 2.088790 | |||
Table 7.
Validation of the statistical hypotheses.
| Hypothesis | Validated (Yes/No) |
|---|---|
| Hypothesis 1 | Yes |
| Hypothesis 2 | Yes |
| Hypothesis 3 | Yes |
© 2019 by the author. Licensee MDPI, Basel, Switzerland. This article is an open access article distributed under the terms and conditions of the Creative Commons Attribution (CC BY) license (http://creativecommons.org/licenses/by/4.0/).
Share and Cite
MDPI and ACS Style
Busu, M. Adopting Circular Economy at the European Union Level and Its Impact on Economic Growth. Soc. Sci. 2019, 8, 159. https://doi.org/10.3390/socsci8050159
AMA Style
Busu M. Adopting Circular Economy at the European Union Level and Its Impact on Economic Growth. Social Sciences. 2019; 8(5):159. https://doi.org/10.3390/socsci8050159
Chicago/Turabian StyleBusu, Mihail. 2019. "Adopting Circular Economy at the European Union Level and Its Impact on Economic Growth" Social Sciences 8, no. 5: 159. https://doi.org/10.3390/socsci8050159
Note that from the first issue of 2016, this journal uses article numbers instead of page numbers. See further details here.