Automatic Fuzzy Logic-Based Maize Common Rust Disease Severity Predictions with Thresholding and Deep Learning


Abstract
:1. Introduction
2. Literature Review
3. Materials and Methods
3.1. Development of a Deep Learning Model by Fine-Tuning a VGG-16 Network
3.1.1. Theoretical Background of the VGG-16 Network
3.1.2. Fine-tuning and Training a VGG-16 Network for Maize Leaf Disease Severity Prediction
4. Results
5. Discussion and Conclusions
Supplementary Materials
Author Contributions
Funding
Institutional Review Board Statement
Informed Consent Statement
Data Availability Statement
Acknowledgments
Conflicts of Interest
References
- Wang, G.; Sun, Y.; Wang, J. Automatic Image-Based Plant Disease Severity Estimation Using Deep Learning. Comput. Intell. Neurosci. 2017, 2017, 1–8. [Google Scholar] [CrossRef] [PubMed] [Green Version]
- Zhang, Y.-D.; Pan, C.; Chen, X.; Wang, F. Abnormal breast identification by nine-layer convolutional neural network with parametric rectified linear unit and rank-based stochastic pooling. J. Comput. Sci. 2018, 27, 57–68. [Google Scholar] [CrossRef]
- Ozguven, M.M.; Adem, M. Automatic detection and classification of leaf spot disease in sugar beet using deep learning algorithms. Phys. A Stat. Mech. Appl. 2019, 535, 122537. [Google Scholar] [CrossRef]
- Cruz, A.C.; Luvisi, A.; De Bellis, L.; Ampatzidis, Y. Vision-based plant disease detection system using transfer and deep learning. In Proceedings of the ASABE Annual International Meeting, Spokane, WA, USA, 16–19 July 2017. [Google Scholar] [CrossRef]
- Chen, J.; Chen, J.; Zhang, D.; Sun, Y.; Nanehkaran, N.A. Using deep transfer learning for image-based plant disease identification. Comput. Electron. Agric. 2019, 173, 105393. [Google Scholar] [CrossRef]
- Oppenheim, D.; Shani, G.; Erlich, O.; Tsror, L. Using Deep Learning for Image-Based Potato Tuber Disease Detection. Phytopathology 2019, 109, 1083–1087. [Google Scholar] [CrossRef] [PubMed]
- Arsenovic, M.; Karanovic, M.; Sladojevic, S.; Anderla, A.; Stefanovic, D. Solving current limitations of deep learning-based approaches for plant disease detection. Symmetry 2019, 11, 939. [Google Scholar] [CrossRef] [Green Version]
- Barbedo, J. Impact of dataset size and variety on the effectiveness of deep learning and transfer learning for plant disease classification. Comput. Electron. Agric. 2018, 153, 46–53. [Google Scholar] [CrossRef]
- Huang, S.; Liu, W.; Qi, F.; Yang, K. Development and Validation of a Deep Learning Algorithm for the Recognition of Plant Disease. In Proceedings of the 2019 IEEE 21st International Conference on High Performance Computing and Communications, Zhangjiajie, China, 10–12 August 2019; pp. 1951–1957. [Google Scholar]
- Nagasubramanian, K.; Jones, S.; Singh, A.K.; Sarkar, S.; Singh, A.; Ganapathysubramanian, B. Plant disease identification using explainable 3D deep learning on hyperspectral images. Plant Methods 2019, 15, 98. [Google Scholar] [CrossRef]
- Brahimi, M.; Boukhalfa, K.; Moussaoui, A. Deep Learning for Tomato Diseases: Classification and Symptoms Visualization. Appl. Artif. Intell. 2017, 31, 299–315. [Google Scholar] [CrossRef]
- Ale, L.; Sheta, A.; Li, L.; Wang, Y.; Zhang, N. Deep Learning Based Plant Disease Detection for Smart Agriculture. In Proceedings of the 2019 IEEE Globecom Workshops (GC Wkshps), Waikoloa, HI, USA, 9–13 December 2019; pp. 1–6. [Google Scholar]
- Geetharamani, G.; Pandian, A.J. Identification of plant leaf diseases using a nine-layer deep convolutional neural network. Comput. Electr. Eng. 2019, 76, 323–338. [Google Scholar]
- Goncharov, P.; Ososkov, G.; Nechaevskiy, A.; Uzhinskiy, A.; Nestsiarenia, I. Disease Detection on the Plant Leaves by Deep Learning. In Proceedings of the XX International Conference on Neuroinformatics, Moscow, Russia, 8–12 October 2018; Springer International Publishing: Berlin, Germany, 2019; Volume 1. [Google Scholar] [CrossRef]
- Militante, S.V.; Gerardo, B.D.; Dionisio, N.V. Plant Leaf Detection and Disease Recognition using Deep Learning. In Proceedings of the 2019 IEEE Eurasia Conference on IOT, Communication and Engineering (ECICE), Yunlin, Taiwan, 3–6 October 2019; pp. 579–582. [Google Scholar] [CrossRef]
- Mohanty, S.P.; Hughes, D.P.; Salathé, M. Using Deep Learning for Image-Based Plant Disease Detection. Front. Plant Sci. 2016, 7, 1419. [Google Scholar] [CrossRef] [PubMed] [Green Version]
- Turkoglu, M.; Hanbay, D. Plant disease and pest detection using deep learning-based features. Turk. J. Electr. Eng. Comput. Sci. 2019, 27, 1636–1651. [Google Scholar] [CrossRef]
- Ferentinos, K.P. Deep learning models for plant disease detection and diagnosis. Comput. Electron. Agric. 2018, 145, 311–318. [Google Scholar] [CrossRef]
- Baranwal, S.; Khandelwal, S.; Arora, A. Deep Learning Convolutional Neural Network for Apple Leaves Disease Detection. SSRN Electron. J. 2019, 260–267. [Google Scholar] [CrossRef]
- Rangarajan, A.K.; Purushothaman, R.; Ramesh, A. Tomato crop disease classification using pre-trained deep learning algorithm. Procedia Comput. Sci. 2018, 133, 133–1040. [Google Scholar] [CrossRef]
- Too, E.C.; Yujian, L.; Njuki, S.; Yingchun, L. A comparative study of fine-tuning deep learning models for plant disease identification. Comput. Electron. Agric. 2017. [Google Scholar] [CrossRef]
- Barbedo, J. Plant disease identification from individual lesions and spots using deep learning. Biosyst. Eng. 2019, 180, 96–107. [Google Scholar] [CrossRef]
- Otsu, N. A threshold selection method from gray-level histograms. IEEE Trans. Syst. Man Cybern. 1979, 9, 62–66. [Google Scholar] [CrossRef] [Green Version]
- Patil, S.K.; Bodhe, S.K. Leaf disease severity measurement using image processing. Int. J. Eng. Technol. 2011, 3, 297–301. [Google Scholar]
- Barbedo, J.G.A. An Automatic Method to Detect and Measure Leaf Disease Symptoms Using Digital Image Processing. Plant Dis. 2014, 98, 1709–1716. [Google Scholar] [CrossRef] [Green Version]
- Mwebaze, E.; Owomugisha, G. Machine Learning for Plant Disease Incidence and Severity Measurements from Leaf Images. In Proceedings of the 2016 15th IEEE International Conference on Machine Learning and Applications (ICMLA), Anaheim, CA, USA, 18–20 December 2016; pp. 158–163. [Google Scholar]
- Parikh, A.; Raval, M.S.; Parmar, C.; Chaudhary, S.; Parikh, A.; Raval, M.S.; Parmar, C.; Chaudhary, S. Disease detection and severity estimation in cotton plant from unconstrained images. In Proceedings of the 3rd IEEE International Conference on Data Science and Advanced Analytics, Montreal, QC, Canada, 17–19 October 2016. [Google Scholar]
- Shrivastava, S.; Singh, S.K.; Hooda, D.S. Color sensing and image processing-based automatic soybean plant foliar disease severity detection and estimation. Multimed. Tools Appl. 2015, 74, 11467–11484. [Google Scholar] [CrossRef]
- Behera, S.K.; Jena, L.; Rath, A.K.; Sethy, P.K. Disease Classification and Grading of Orange Using Machine Learning and Fuzzy Logic. In Proceedings of the 2018 International Conference on Communication and Signal Processing (ICCSP), Chennai, India, 3–5 April 2018; pp. 0678–0682. [Google Scholar]
- Sannakki, S.S.; Rajpurohit, V.S.; Nargund, V.B.; Yallur, P.S. Leaf Disease Grading by Machine Vision and Fuzzy Logic. Int. J. Comput. Technol. Appl. 2011, 2, 1709–1716. [Google Scholar]
- Rastogi, A.; Arora, R.; Sharma, S. Leaf disease detection and grading using computer vision technology & fuzzy logic. In Proceedings of the 2015 2nd International Conference on Signal Processing and Integrated Networks (SPIN), Noida, India, 19–20 February 2015; pp. 500–505. [Google Scholar]
- Shen, W.; Wu, Y.; Chen, Z.; Wei, Z. Grading method of leaf spot disease based on image processing. In Proceedings of the International Conference on Computer Science and Software Engineering, CSSE 2008, Hubei, China, 12–14 December 2008. [Google Scholar]
- Chaudhary, P.; Godara, S.; Cheeran, A.N.; Chaudhari, A.K. Fast and Accurate Method for Leaf Area Measurement. Int. J. Comput. Appl. 2012, 49, 22–25. [Google Scholar] [CrossRef]
- Zhou, G.; Zhang, W.; Chen, A.; He, M.; Ma, X. Rapid Detection of Rice Disease Based on FCM-KM and Faster R-CNN Fusion. IEEE Access 2019, 7, 143190–143206. [Google Scholar] [CrossRef]
- Jim Isleib, M.S.U.E. Signs and Symptoms of Plant Disease: Is it Fungal, Viral or Bacterial? MSU Extension. 2 October 2018. Available online: https://www.canr.msu.edu/news/signs_and_symptoms_of_plant_disease_is_it_fungal_viral_or_bacterial#:~:text=A symptom of plant disease, dahliae (accessed on 19 November 2020).
- Khattab, D.; Ebied, H.M.; Hussein, A.S.; Tolba, M.F. Color Image Segmentation Based on Different Color Space Models Using Automatic GrabCut. Sci. World J. 2014, 2014, 1–10. [Google Scholar] [CrossRef]
- Simonyan, K.; Zisserman, A. Very deep convolutional networks for large-scale image recognition. arXiv 2015, arXiv:1409.1556. Available online: https://arxiv.org/abs/1409.1556 (accessed on 8 December 2020).
- Elgendy, M. Deep Learning for Vision Systems; Manning Publications: Shelter Island, NY, USA, 2020. [Google Scholar]


| Deep Learning Architecture/Image Database | Study Summary |
|---|---|
| Google Net | In this study, 12 plant species were used from a known image database, with each plant species having a different number of samples and diseases under a variety of conditions [8]. |
| U-Net | After using the U-Net to obtain images of the segmented leaves, the next task was to identify the plant disease types. This is a typical image classification task [9]. |
| 3D Deep Convolutional Neural Network (DCNN) | Based on hyperspectral imaging of inoculated and mock-inoculated stem images, the 3D DCNN achieved a classification accuracy of 95.73% and an infected class F1 score of 0.87 [10]. |
| ImageNet | Brahimi, Boukhalfa, and Moussaoui used the 1000 class ImageNet database with a pretrained model to classify 9 types of tomato diseases [11]. |
| Dense Net | A lightweight deep neural network (DNN) approach that can run on internet of things (IoT) devices with constrained resources was proposed [12]. |
| 9-Layer Deep CNN | The deep CNN model was trained using an open dataset with 39 different classes of plant leaves and background images. Six types of data augmentation methods were used: image flipping, gamma correction, noise injection, principal component analysis (PCA) colour augmentation, rotation, and scaling. The proposed model achieved 96.46% classification accuracy [13]. |
| Deep Siamese convolutional network | The deep Siamese convolutional network was developed to solve the problem of the small image databases. Accuracy over 90% was reached in the detection of the Esca, Black rot and Chlorosis diseases on grape leaves [14]. |
| CNN API written in Python | The model was designed to detect and recognize several plant varieties, specifically apple, corn, grapes, potato, sugarcane, and tomato. The trained model achieved an accuracy rate of 96.5%, and the system was able to register up to 100% accuracy in detecting and recognizing the plant variety and the type of diseases with which the plant was infected [15]. |
| Alex Net and Google Net | Using a public dataset of 54,306 images of diseased and healthy plant leaves collected under controlled conditions, a deep convolutional neural network was trained to identify 14 crop species and 26 diseases (or absence thereof). The trained model achieved an accuracy of 99.35% on a held-out test set, demonstrating the feasibility of this approach [16]. |
| Alex Net, VGG16, and VGG19 | The experiments were carried out using data consisting of the real disease and pest images from Turkey. The accuracy, sensitivity, specificity, and F1-score were all calculated for performance evaluation [17] |
| Alex Net, Alex Net OWTBn, Google Net, Over feta and VGG | Convolutional neural network models were developed to perform classifications of plant disease using simple leaf images of healthy and diseased plants, through deep learning methodologies. Training of the models was performed with the use of an open database of 87,848 images, containing 25 different plants in a set of 58 distinct classes of [plant, disease] combinations, including healthy plants. Several model architectures were trained, with the best performance reaching a 99.53% success rate in identifying the corresponding [plant, disease] combination (or healthy plant) [18]. |
| CNN model similar to standard Le Net architecture | Images of apple leaves, covering various diseases as well as healthy samples, from the PlantVillage dataset were used to validate results. Image filtering, image compression, and image generation techniques were used to gain a large training set of images and tune the system perfectly. The trained model achieved high accuracy scores in all the classes, with a net accuracy of 98.54% on the entire dataset, sampled and generated from 2561 labelled images [19]. |
| Alex Net and VGG-16 | In this study tomato-leaf images (6 diseases and a healthy class) obtained from the PlantVillage dataset were provided as inputs to two deep learning-based architectures, namely, Alex Net and VGG16 net. The accuracy of classification obtained using Alex Net and VGG16 net were 97.49% and 97.23%, respectively, for 13262 images [20]. |
| VGG 16, Inception V4, Res Net with 50, 101 and 152 layers and Dense Nets with 121 layers | An empirical comparison of the Deep Learning architecture was done. The architectures evaluated included VGG 16, Inception V4, Res Net with 50, 101 and 152 layers and Dense Nets with 121 layers. The data used for the experiment were 38 different classes, including diseased and healthy leaf-images of 14 plants from PlantVillage. Fast and accurate models for plant disease identification were desired, so that accurate measures could be applied early. In the experiment, Dense Nets had a tendency to consistently improve in accuracy with the growing number of epochs, with no signs of overfitting and performance deterioration. Moreover, Dense Nets required a considerably less number of parameters and reasonable computing time to achieve state-of- the-art performances. It achieved a testing accuracy score of 99.75% to beat the rest of the architectures [21]. |
| Google Net | The work explored the use of individual lesions and spots for the task, rather than considering the entire leaf. Each region had its own characteristics, therefore the variability of the data was increased without the need for additional images. This also allowed the identification of multiple diseases affecting the same leaf. On the other hand, suitable symptom segmentation still needed to be performed manually, preventing full automation. The accuracies obtained using this approach were, on average, 12% higher than those achieved using the original images. Additionally, no crop had accuracies below 75%, even when as many as 10 diseases were considered. Although the database did not cover the entire range of practical possibilities, these results indicated that, as long as enough data were available, the deep learning technique is effective for plant disease detection and recognition [22]. |
| Methods Used for Plant Disease Severity Prediction | Study Summary |
|---|---|
| Using deep learning to automatically to automatically predict plant disease severity. | Wang, Sun and Wang developed different deep learning models that also included the VGG-16 to detect plant severities in four stages. The VGG-16 surpassed the other models with a validation accuracy of 90.4% [1]. |
| Use of image processing to measure leaf disease symptoms. | In this study, the segmentation of the leaf area was performed by a simple threshold method, and that of the lesion region area with the triangle threshold method. The quotient of lesion area and leaf area were used to categorize the diseases with testing accuracy of 98.60% [24]. |
| Use of digital image processing to measure leaf disease symptoms. | Barbedo also used image processing and measurements to detect severities of plant leaf diseases. Using his method, he received an accuracy of 96% to detect the severities of the plant leaf diseases he dealt with [25]. However, his method also has a disadvantage of limiting users who are not scientists or familiar with image processing. |
| Plant disease incidence and severity measurements by use of machine learning. | Owomugisha and Mwebaze used machine learning algorithms such as support vector machines and k nearest neighbours to detect the plant disease incidents and severity measurements. In their work, they used traditional machine learning algorithms that required handcrafted feature extraction. The handcrafted feature extraction algorithms they used for colour extraction in the images were SURF, SIFT, OBR and HOG [26]. |
| Segmentation of the affected area | The proposed work used two cascaded classifiers. Using local statistical features, the first classifier segmented the leaf from the background. Then, using hue and luminance from the Hue-Saturation-Value colour space, another classifier was trained to detect disease and its stage of severity [27]. |
| Image segmentation and colour sensing | Various new parameters, namely disease severity index (DSI), infection-per region (IPR), and disease-level parameter (DLP) for measuring the disease severity level and level-classification were formulated and derived [28]. |
| Hardware | Software | Dataset |
|---|---|---|
|
|
|
| Scenario | Size of the Target Data | Similarity of the New and Original Data Sets | The Approach Used |
|---|---|---|---|
| 1 | Small | Similar | The pre-trained network is used as feature extractor. |
| 2 | Large | Similar | Fine-tuning is conducted through the full network. |
| 3 | Small | Very different | Fine-tuning is conducted from activations earlier in the network. |
| 4 | Large | Very different | Fine-tuning is conducted through the entire network. |
| Layer Name | Type | Number of Filters | Number of Parameters |
|---|---|---|---|
| Input | Input layer | - | 0 |
| Block 1_Conv2D_1 | Convolutional | 64 | 1792 |
| Block 1_Conv2D_2 | Convolutional | 64 | 36,928 |
| Block 1_MaxPooling2D | Max Pooling | - | 0 |
| Block 2_Conv2D_1 | Convolutional | 128 | 73,856 |
| Block 2_Conv2D_2 | Convolutional | 128 | 147,584 |
| Block 2_MaxPooling2D | Max Pooling | - | 0 |
| Block 3_Conv2D_1 | Convolutional | 256 | 295,168 |
| Block 3_Conv2D_2 | Convolutional | 256 | 590,080 |
| Block 3_Conv2D_3 | Convolutional | 256 | 590,080 |
| Block 3_MaxPooling2D | Max Pooling | - | 0 |
| Block 4_Conv2D_1 | Convolutional | 512 | 1,180,160 |
| Block 4_Conv2D_2 | Convolutional | 512 | 2,359,808 |
| Block 4_Conv2D_3 | Convolutional | 512 | 2,359,808 |
| Block 4_MaxPooling2D | Max Pooling | - | 0 |
| Block 5_Conv2D_1 | Convolutional | 512 | 2,359,808 |
| Block 5_Conv2D_2 | Convolutional | 512 | 2,359,808 |
| Block 5_Conv2D_3 | Convolutional | 512 | 2,359,808 |
| Block 5_MaxPooling2D | Max Pooling | - | 0 |
| Flatten | Layer | - | 0 |
| Dense (32 nodes) | Layer | - | 802,848 |
| Dropout (0.2) | Layer | - | 0 |
| Dense_1 (4 nodes) | Layer | - | 132 |
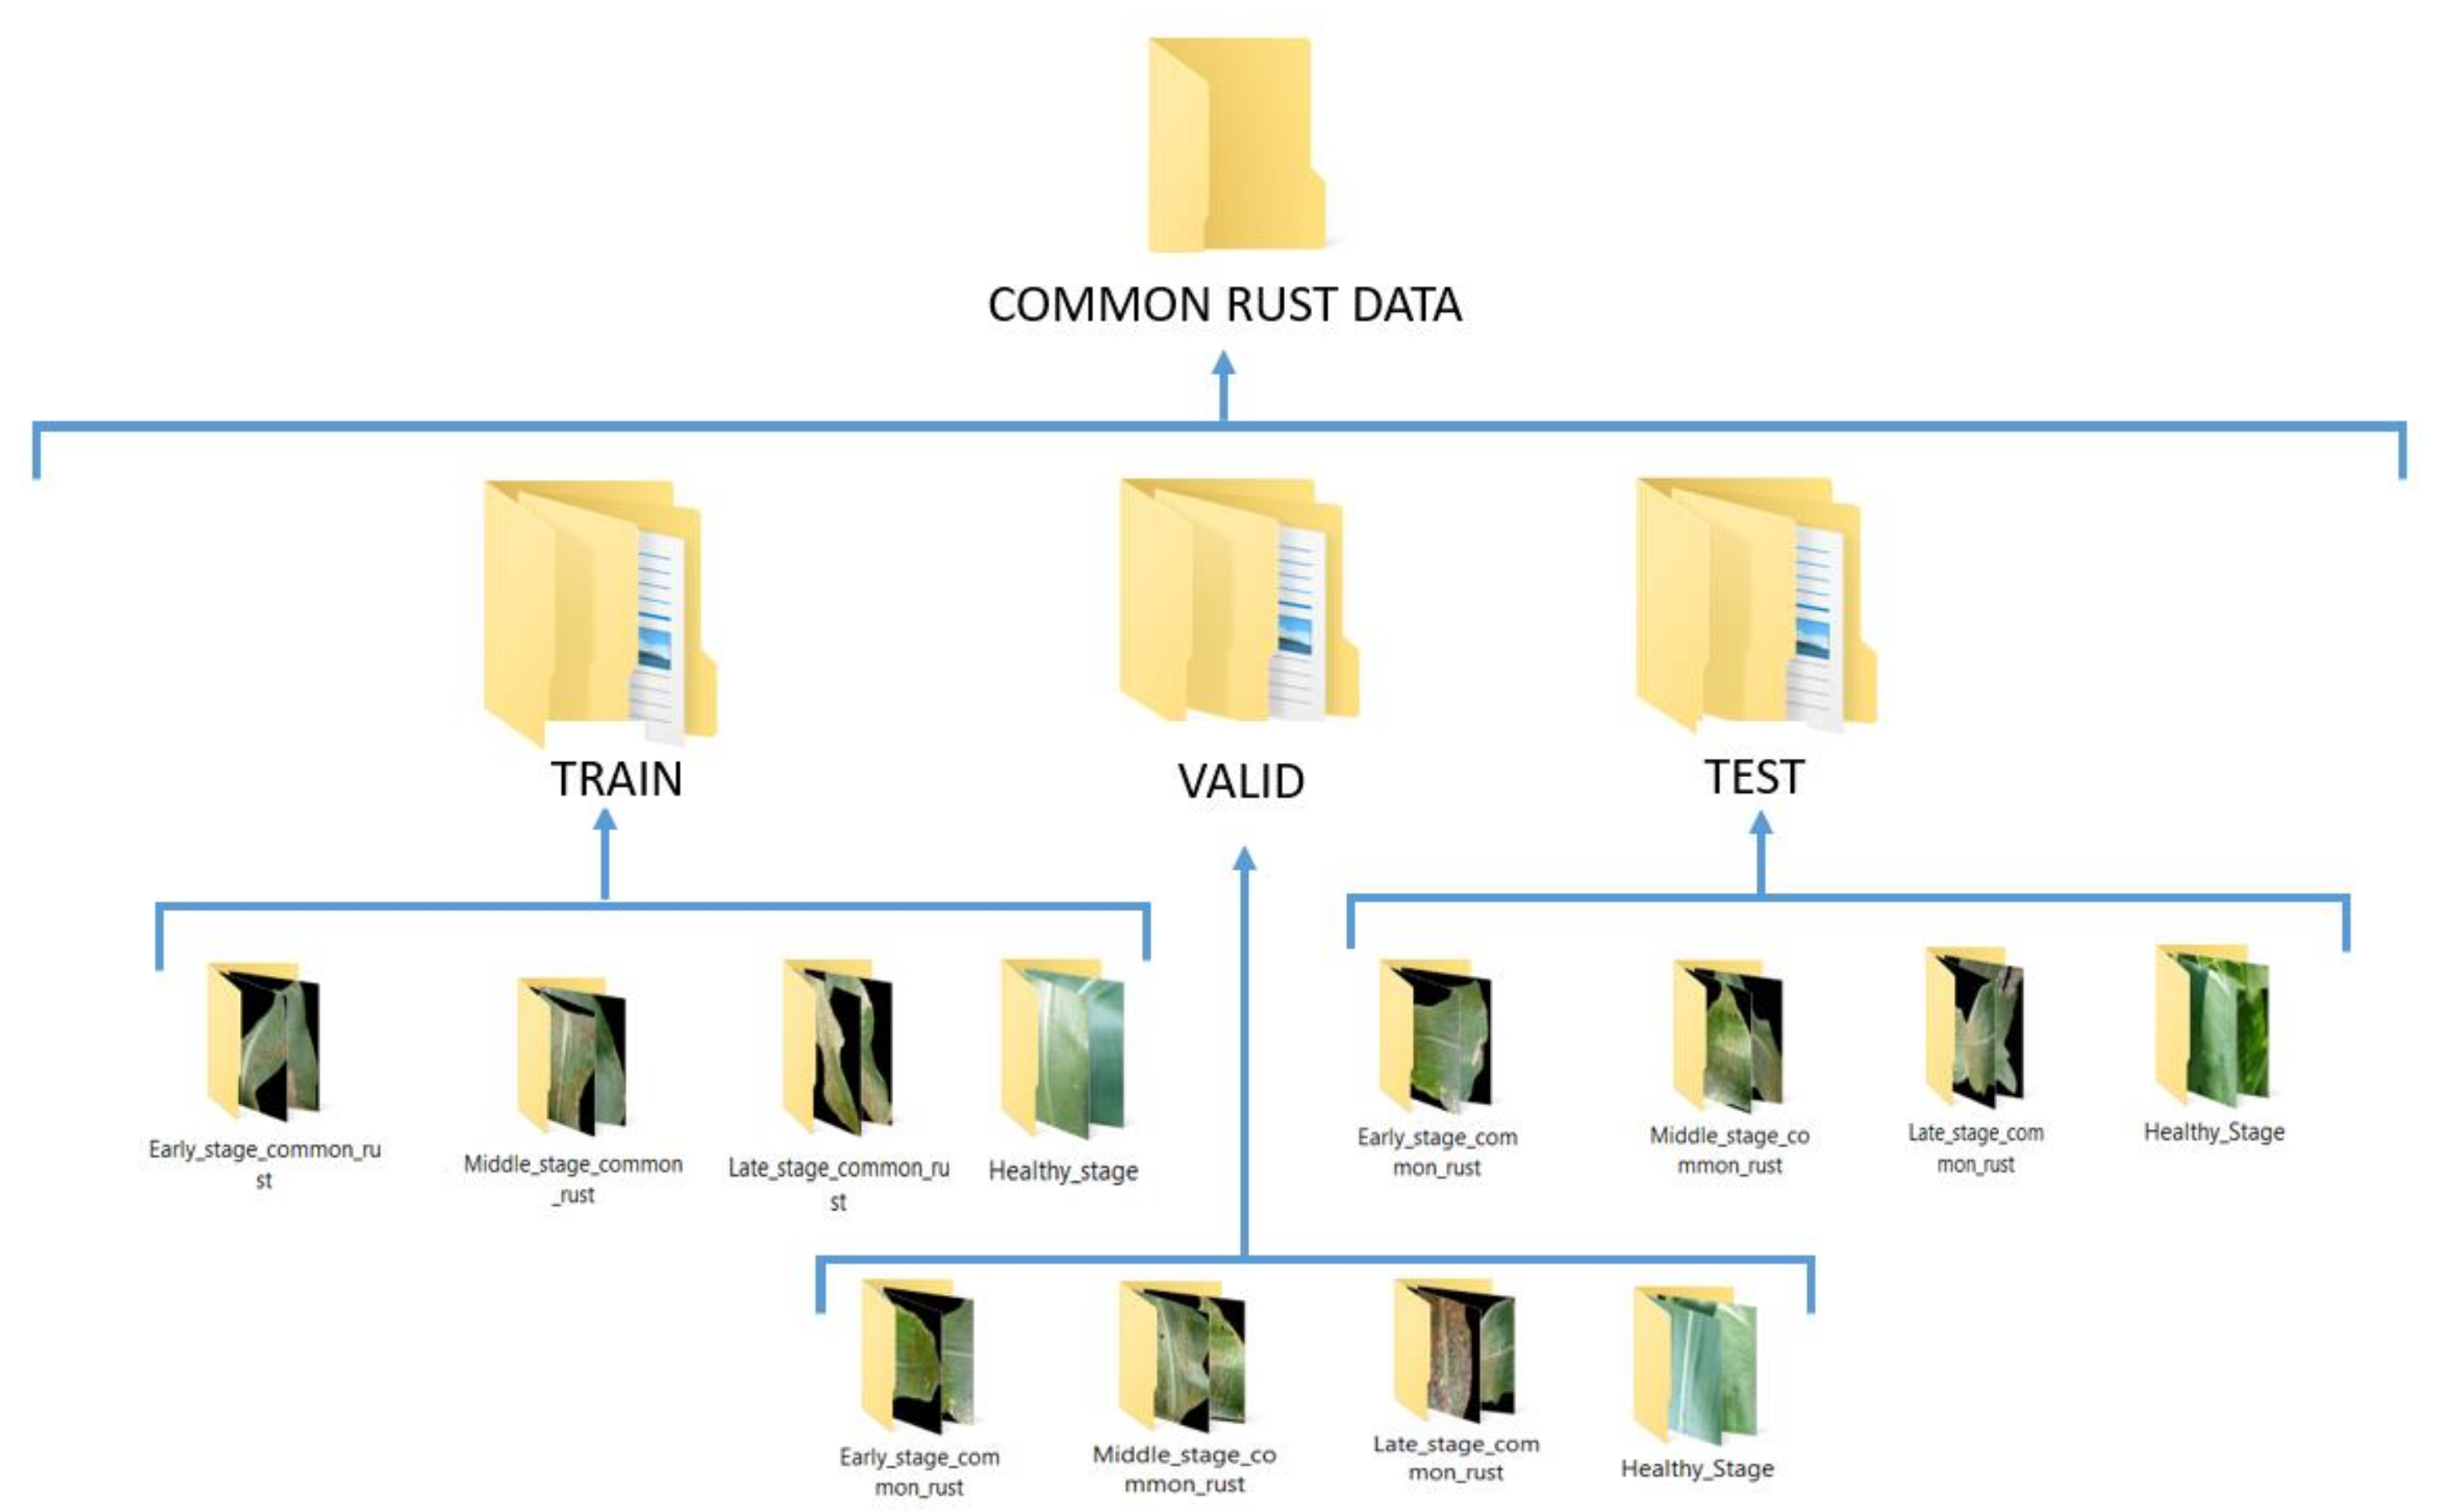
| Total Training Images. | 1600 |
|---|---|
| Total Validation Images. | 200 |
| Total images from the collected dataset. | 100 |
| Batch size. | 32 |
| Optimizer Type and Learning rate. | Adam (lr = 0.0001) |
| Dropout. | 20% of nodes in the first Dense layer of FC. |
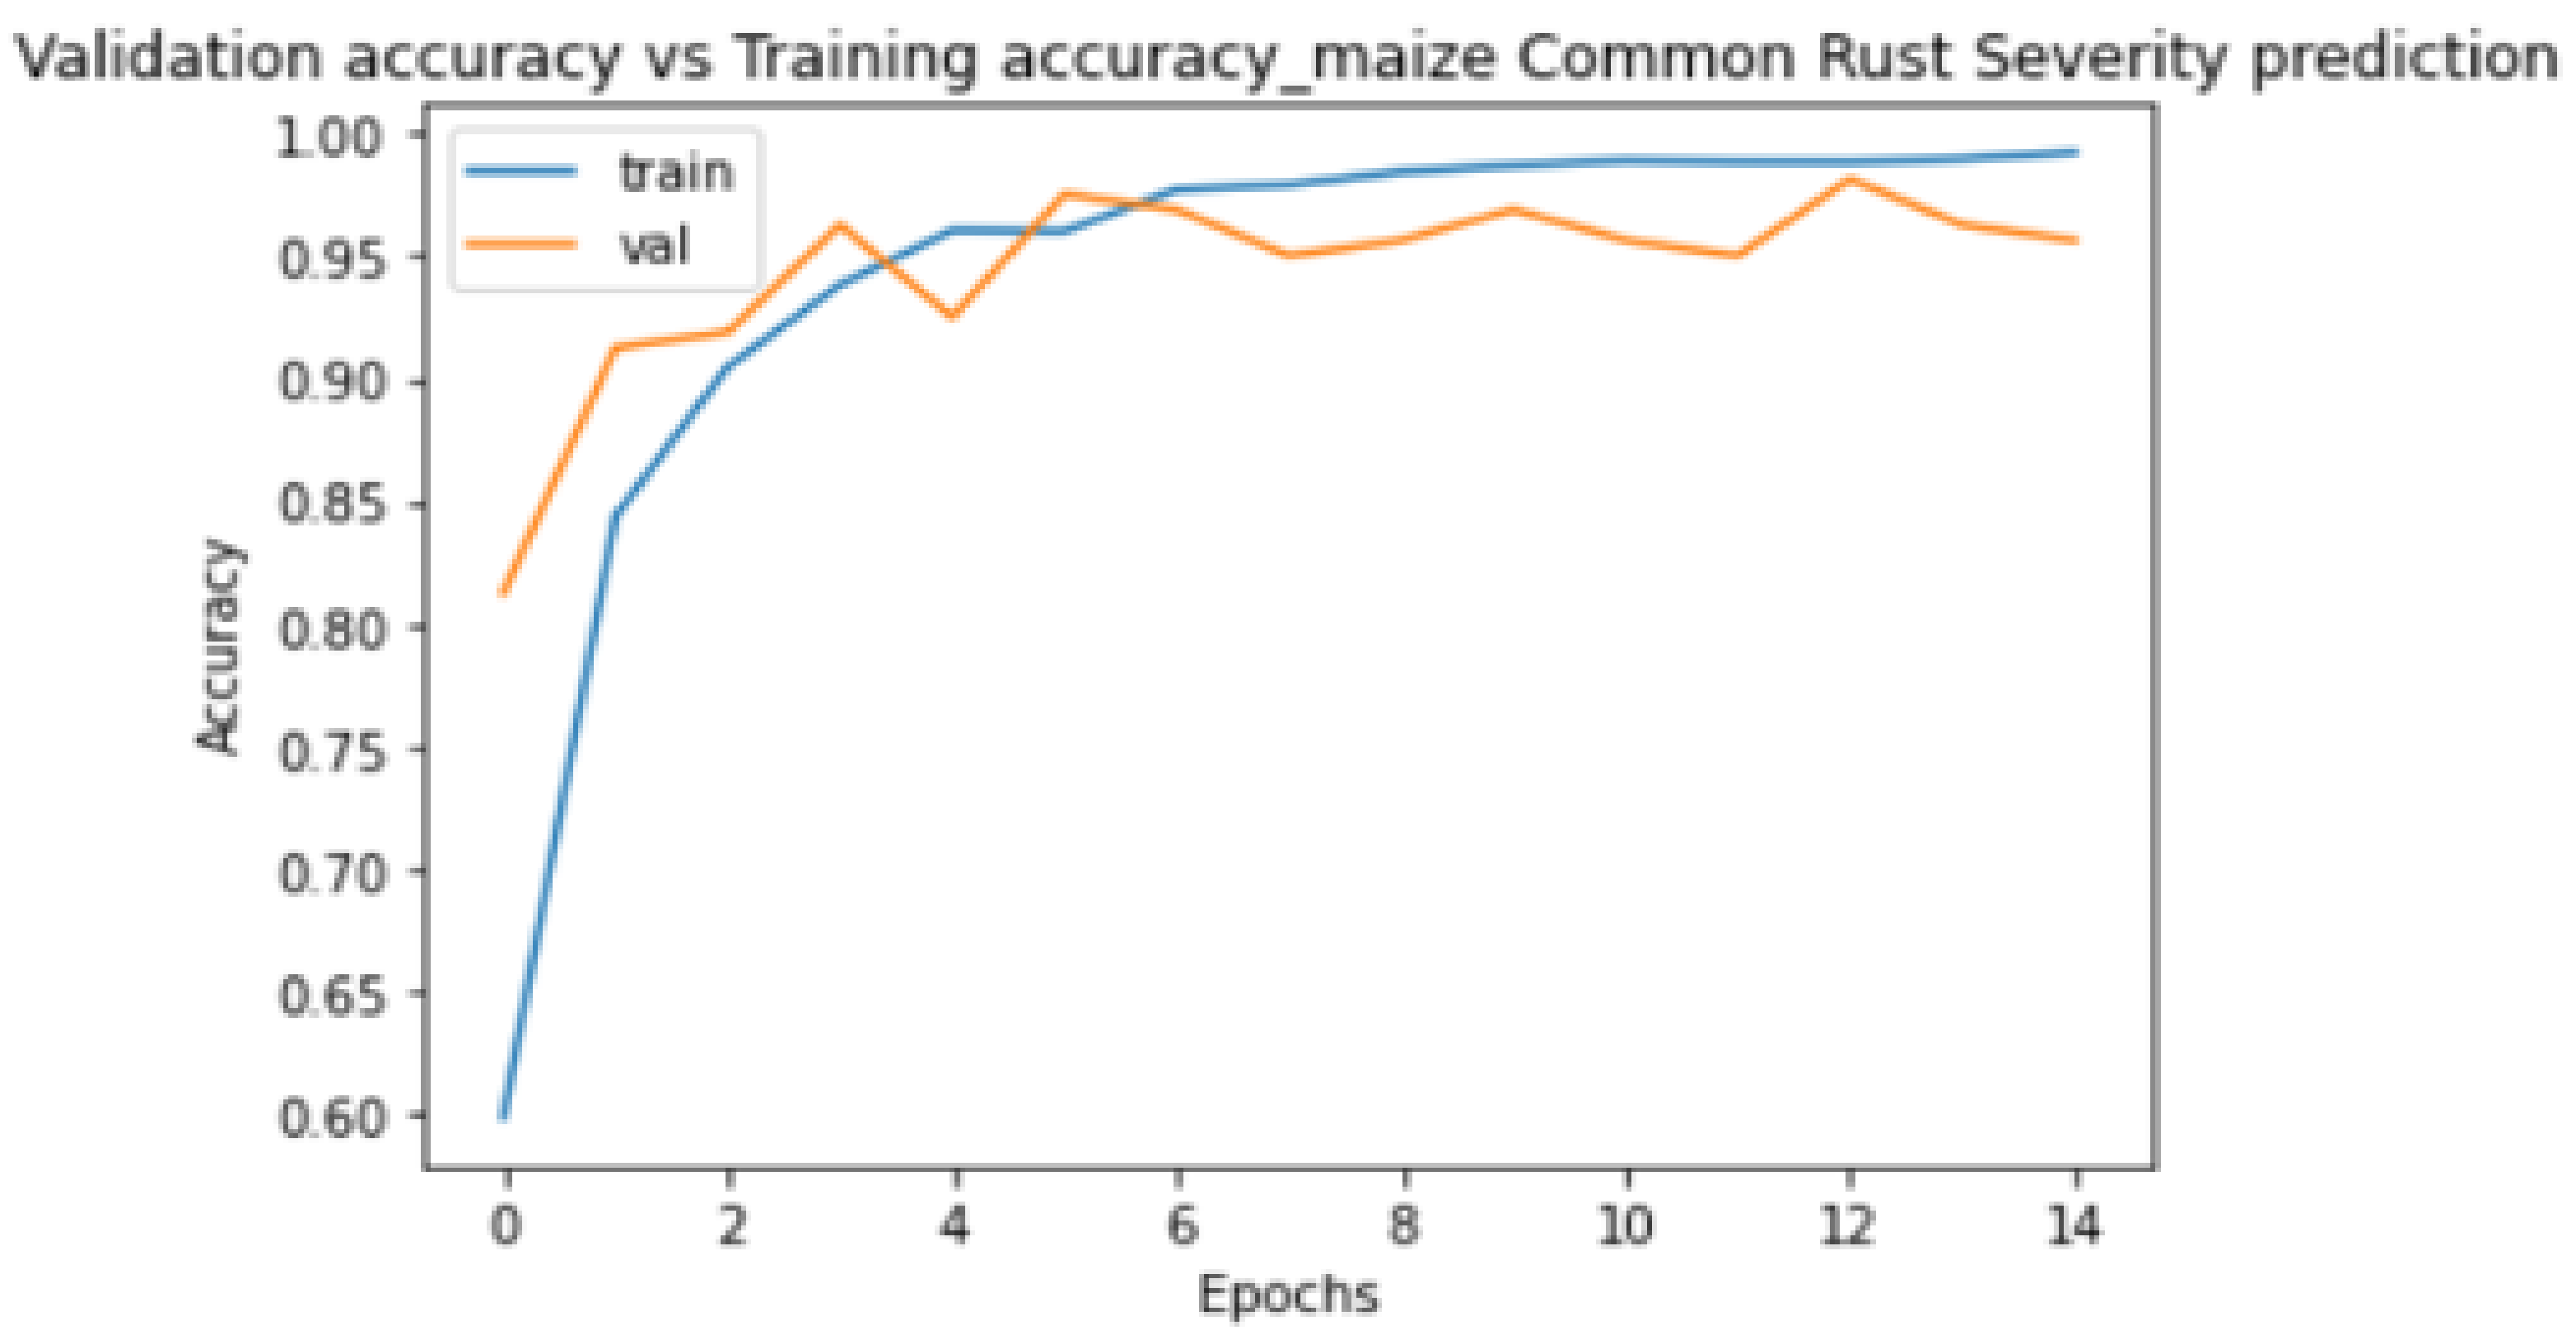
| Training Accuracy on the PlantVillage dataset. | 99.21% |
| Validation Accuracy on the PlantVillage dataset. | 95.63% |
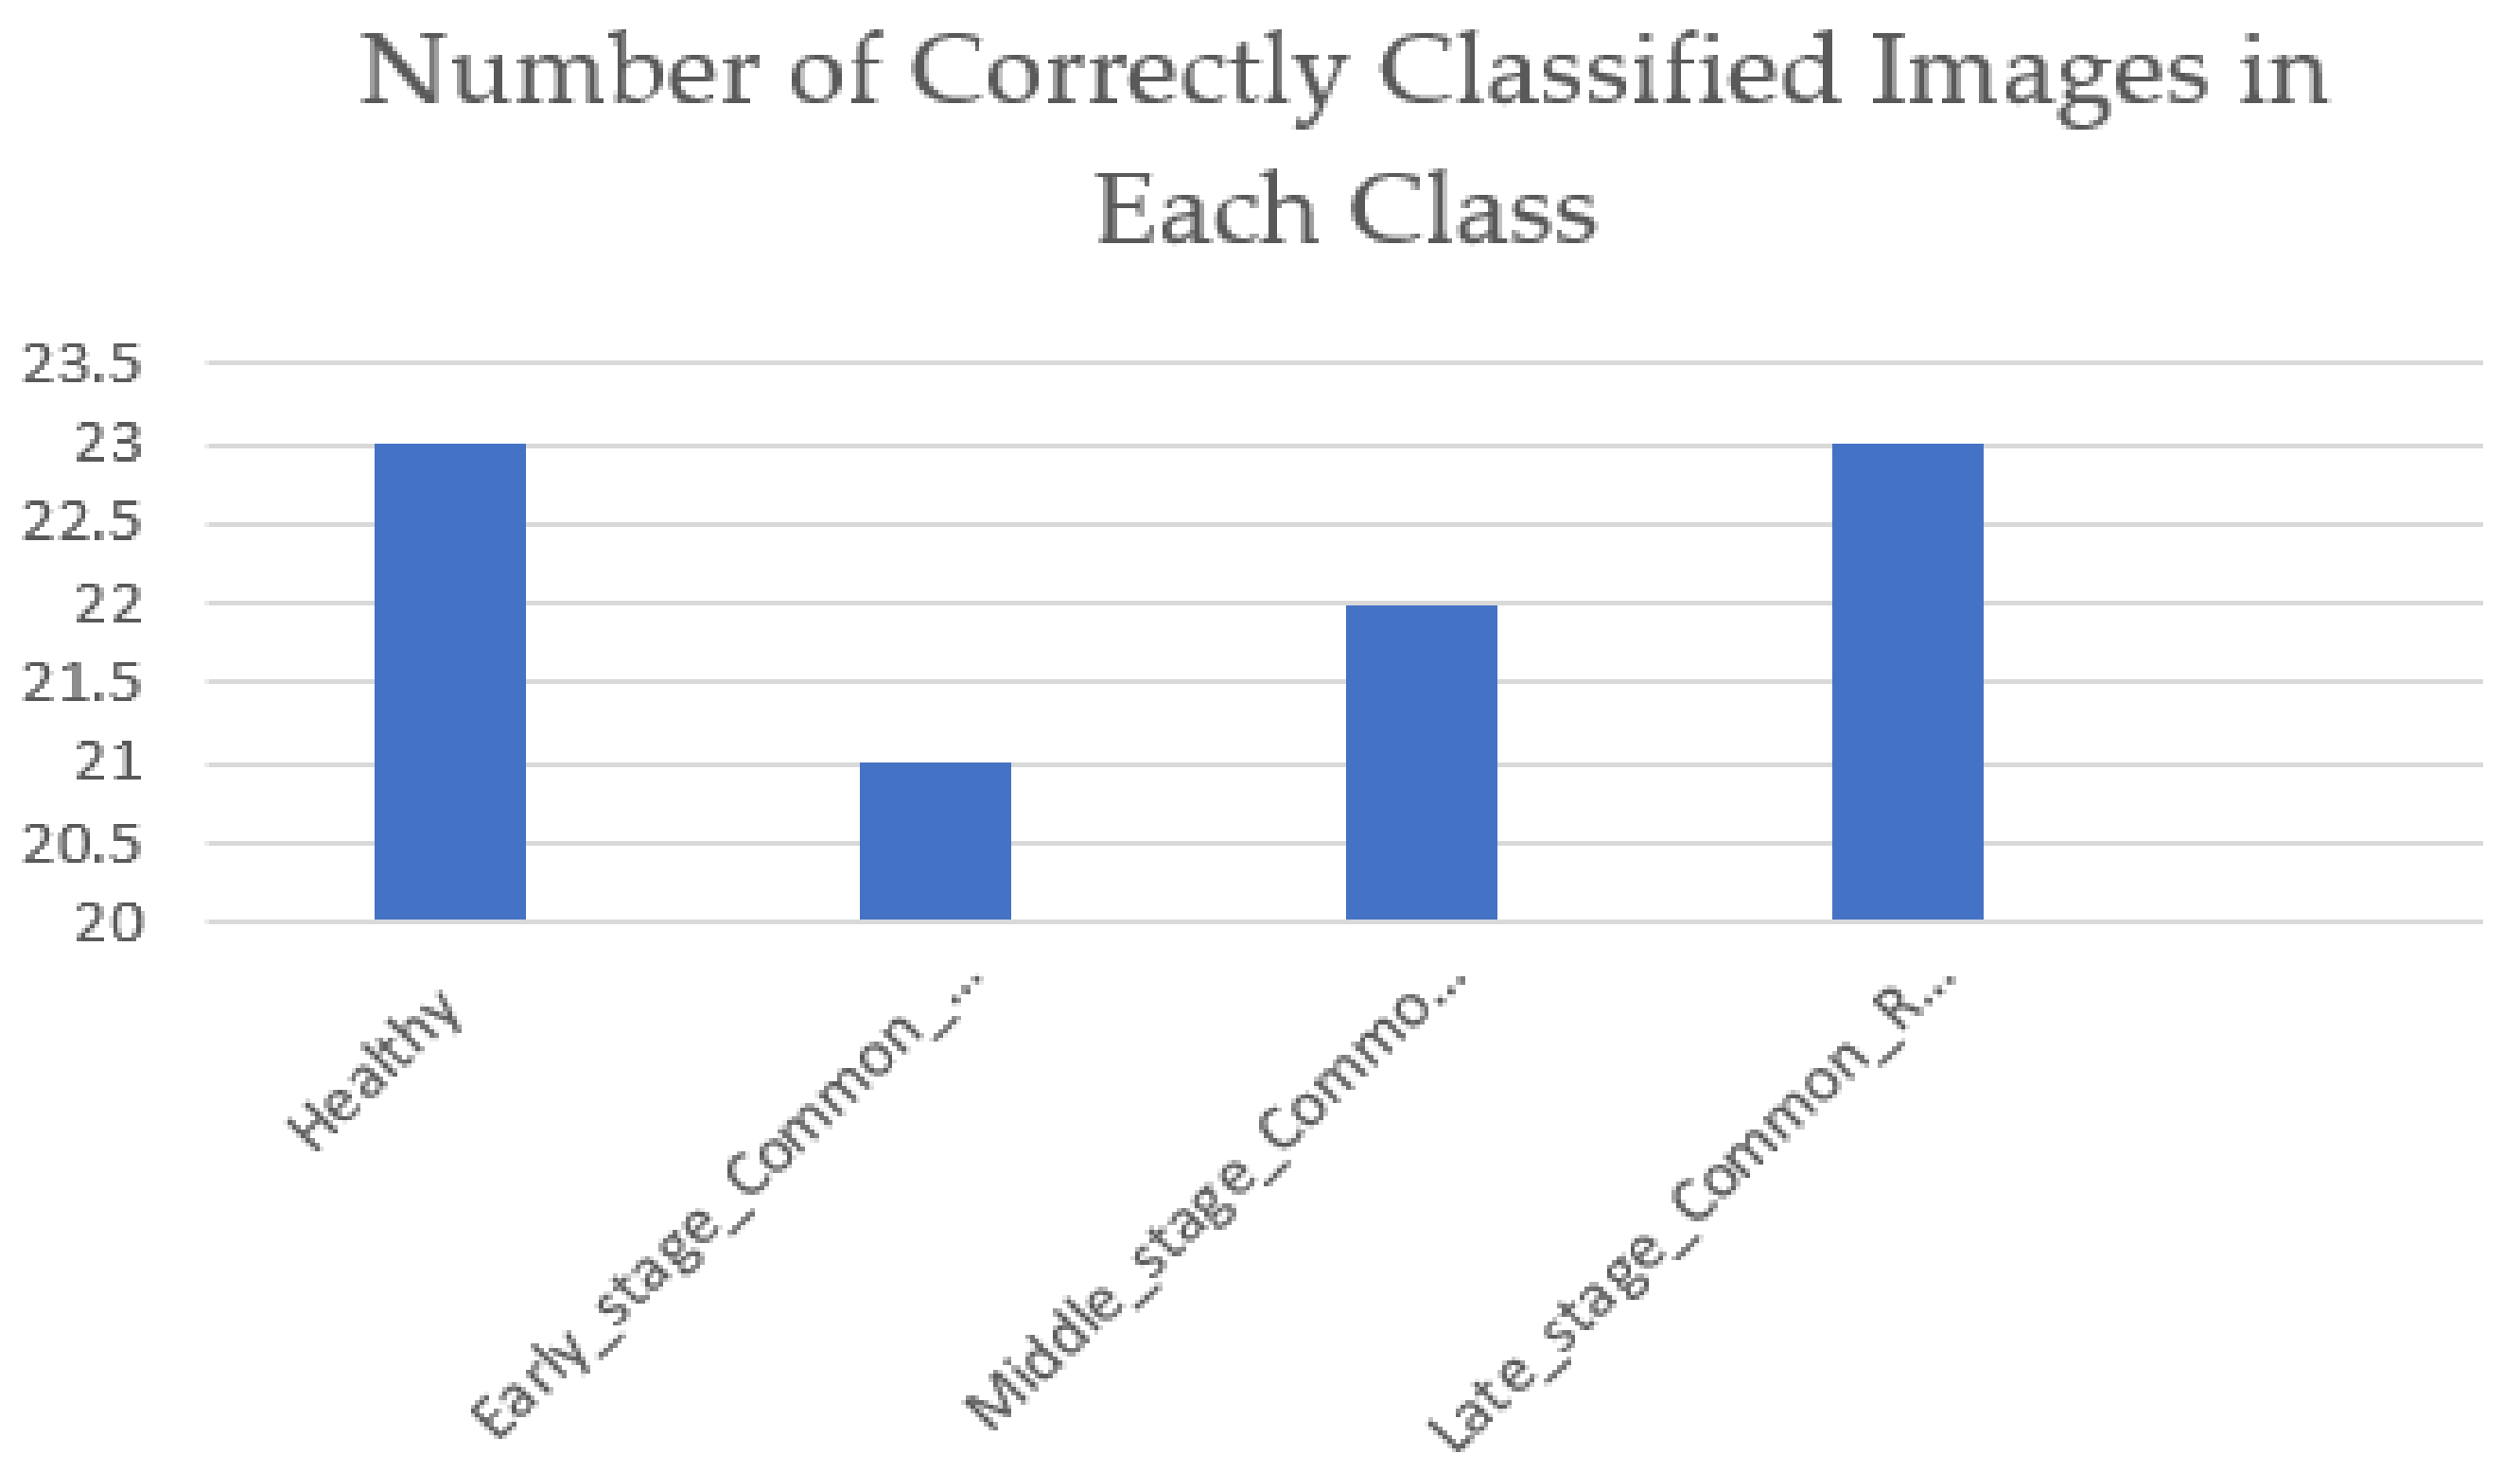
| Test Accuracy on the collected data set. | 89% |
| Training Epochs. | 15 |
| Training Loss. | 0.02 |
| Validation Loss. | 0.2 |
Publisher’s Note: MDPI stays neutral with regard to jurisdictional claims in published maps and institutional affiliations. |
© 2021 by the authors. Licensee MDPI, Basel, Switzerland. This article is an open access article distributed under the terms and conditions of the Creative Commons Attribution (CC BY) license (http://creativecommons.org/licenses/by/4.0/).
Share and Cite
Sibiya, M.; Sumbwanyambe, M. Automatic Fuzzy Logic-Based Maize Common Rust Disease Severity Predictions with Thresholding and Deep Learning. Pathogens 2021, 10, 131. https://doi.org/10.3390/pathogens10020131
Sibiya M, Sumbwanyambe M. Automatic Fuzzy Logic-Based Maize Common Rust Disease Severity Predictions with Thresholding and Deep Learning. Pathogens. 2021; 10(2):131. https://doi.org/10.3390/pathogens10020131
Chicago/Turabian StyleSibiya, Malusi, and Mbuyu Sumbwanyambe. 2021. "Automatic Fuzzy Logic-Based Maize Common Rust Disease Severity Predictions with Thresholding and Deep Learning" Pathogens 10, no. 2: 131. https://doi.org/10.3390/pathogens10020131