1. Introduction
Aedes aegypti and
Aedes albopictus are considered the primary vectors for Zika (ZIKV), dengue (DENV) and chikungunya (CHIKV) viruses. Local transmissions of DENV, CHIKV, ZIKV and West Nile virus (WNV) has been documented along the Texas–Mexico border [
1,
2,
3]. These arboviruses are a threat to public health and the economy in areas where these outbreaks occur [
4,
5]. For example, from 2002–2011, a total of 2274 WNV cases were reported in Texas, with a 6% fatality rate and an estimated economic cost to the state of
$112 million [
6]. Historically, small outbreaks of DENV have occurred along the Texas–Mexico border and from 2010–2017, 24 locally acquired and 267 travel-associated cases were reported statewide [
7]. The risk for DENV transmission is highest in the southernmost Texas counties, with seroprevalence rates for DENV antibodies estimated to be 39% in Brownsville, Texas, based on an epidemiologic survey conducted in 2005 [
8]. The prevalence and spread of arboviruses are attributed to an increase in global migration, urbanization, poverty and climate change, factors that specifically impact South Texas [
1,
5,
9,
10].
From 2012 to 2015, Hidalgo County, Texas, documented locally acquired cases of WNV, DENV and CHIKV, and in 2016, ZIKV infections were identified for the first time [
11]. Prior to 2016, Hidalgo County lacked extensive capacity for mosquito surveillance. Sporadic mosquito surveillance efforts were conducted in response to community complaints of high mosquito activity in neighborhoods, which yielded limited data. County surveillance efforts gradually increased as a mitigation strategy to survey the area for mosquitoes; albeit, seasonal and inconsistent. In 2017, Hidalgo County secured supplementary funding to address the ZIKV threat, which generated staff positions and training to support increased mosquito surveillance activities. During the same year, Hidalgo County had the majority (4 of 7) presumed local mosquito-borne cases of Zika virus disease cases within the United States. In 2018, Hidalgo County mosquito surveillance approach strategies were modified to focus on education, data collection and research. Due to the recent ZIKV activity, Hidalgo County increased and expanded mosquito surveillance efforts to protect and inform residents about ZIKV. The primary objectives of this study are to report on mosquito surveillance efforts in the area, characterize local mosquito populations and assess potential associations between climate and mosquito species abundance in Hidalgo County.
2. Results
During the study period, a total of 1207 traps were set, with five total collection methods employed: BG-Sentinel (n = 502), Backpack Aspirator (n = 398), Light (n = 239), Gravid (n = 59) and Fay-Prince (n = 9). A total of 1058 mosquito pools were tested for arboviruses. A total of 8290 female mosquitoes were collected, consisting of 28 different species. Testing was conducted on important vector species by the University of Texas–Rio Grande Valley and the Texas Department of State Health Services. All mosquito pools tested during this time-period were negative for any of the tested viruses (ZIKV, CHIKV, DENV, WNV, St. Louis encephalitis virus and western equine encephalitis virus).
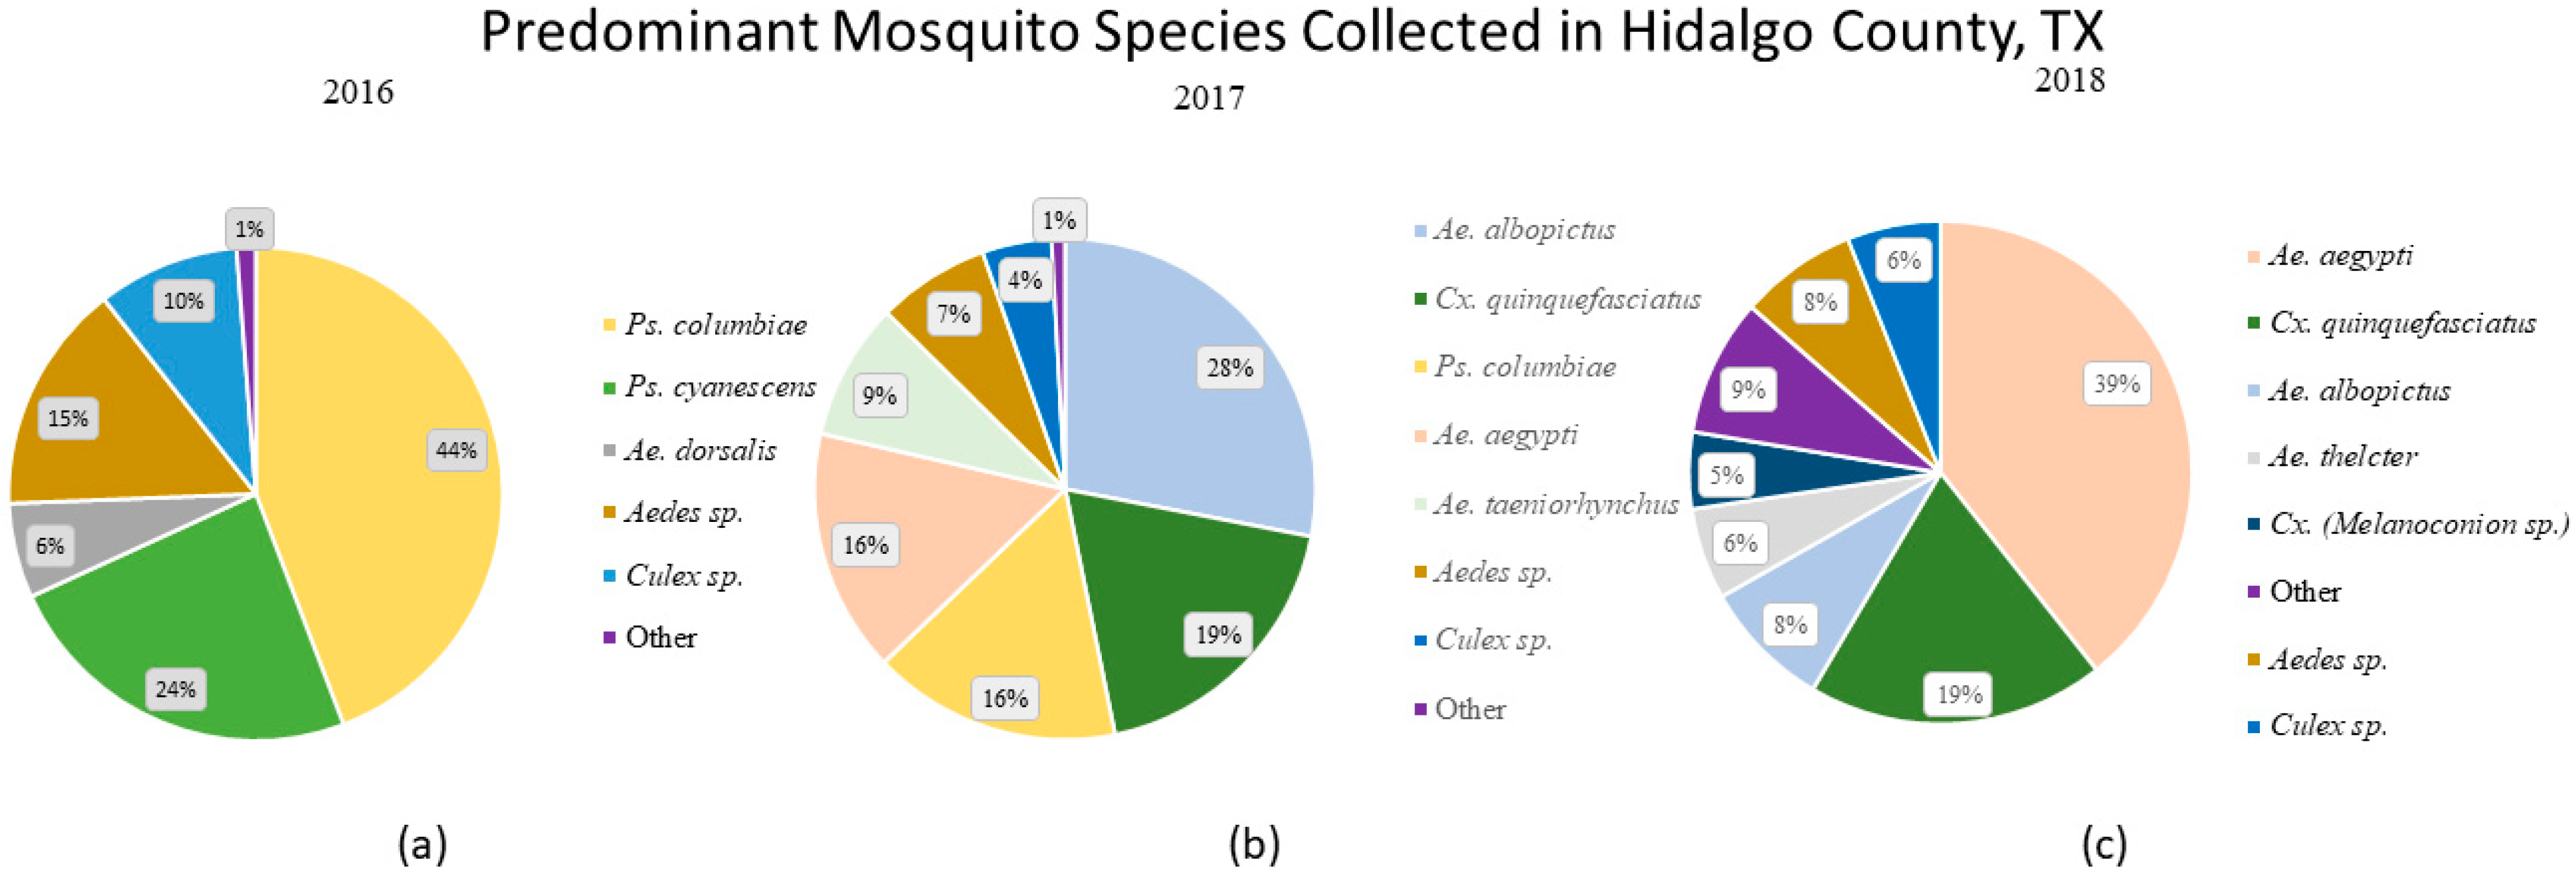
In 2016, successful collections were conducted from May through to December (
Figure 1a). There were 19 species identified, with 68% of mosquitoes consisting of
Psorophora. columbiae and
Ps. cyanescens. The remaining 32% of species collected consisted of
Ae.
dorsalis (6%), other
Aedes spp. (15%), other
Culex. spp. (10%) and other species (1%). In 2017, collections were performedfrom June to December (
Figure 1b). A total of 19 species were identified, with the most abundant mosquito species collected being
Ae. albopictus (28%),
Cx. quinquefasciatus (19%),
Ps. columbiae (16%),
Ae. aegypti (16%),
Ae. taeniorhynchus (9%), other
Aedes. spp. (7%), other
Culex. spp. (4%) and all other species (1%). In 2018, successful trapping collections took place between January and December, with 24 species identified, where 45% of mosquitoes consisted of
Ae. aegypti,
Cx. quinquefasciatus (22%),
Ae. albopictus (10%),
Ae. thelcter (7%), other species (10%) and
Cx. melanoconion (6%) (
Figure 1c). Collections in 2018, which revealed the highest numbers for
Ae. aegypti and
Cx. quinquefasciatus compared to previous years.
Furthermore, the following species were the most prevalent and consistently present throughout the collection period:
Ae. aegypti,
Ae. albopictus,
Ae. thelcter,
Cx. (Melanoconion) sp.,
Cx. quinquefasciatus,
Ps. columbiae and
Ps. cyanscens. These seven species represented 84% of total mosquitoes collected. As shown in
Table 1, the total number of
Ae. aegypti collected increased (186.8 times) from 13 mosquitoes caught in 2016 to 2429 mosquitoes in 2018 compared to the other common mosquito species over the three-year period. Additionally, in 2018,
Ae. aegypti was present 11 of 12 months, and
Ae. albopictus 9 out of 12 months. While we are unable to statistically compare the trapping methods to each other due to varying deployment of traps (both in terms of site and number of times utilized), it is possible to conduct a preliminary comparison of the trapping data. The following trapping methods provided the greatest to least diversity of species caught; CDC light traps (22 species), backpack aspirator (21 species), BG Sentinel 2 traps (19 species), CDC gravid traps (17 species) and Fay-Prince trap (5 species). Through targeted deployment of urban BG sentinel trapping, targeted mosquito surveillance for
Aedes species mosquitoes resulted in a greater proportional yield of
Ae. aegypti and
Ae. albopictus, from less than 1% in year 2016 to 67% in year 2018 (
Table 1).
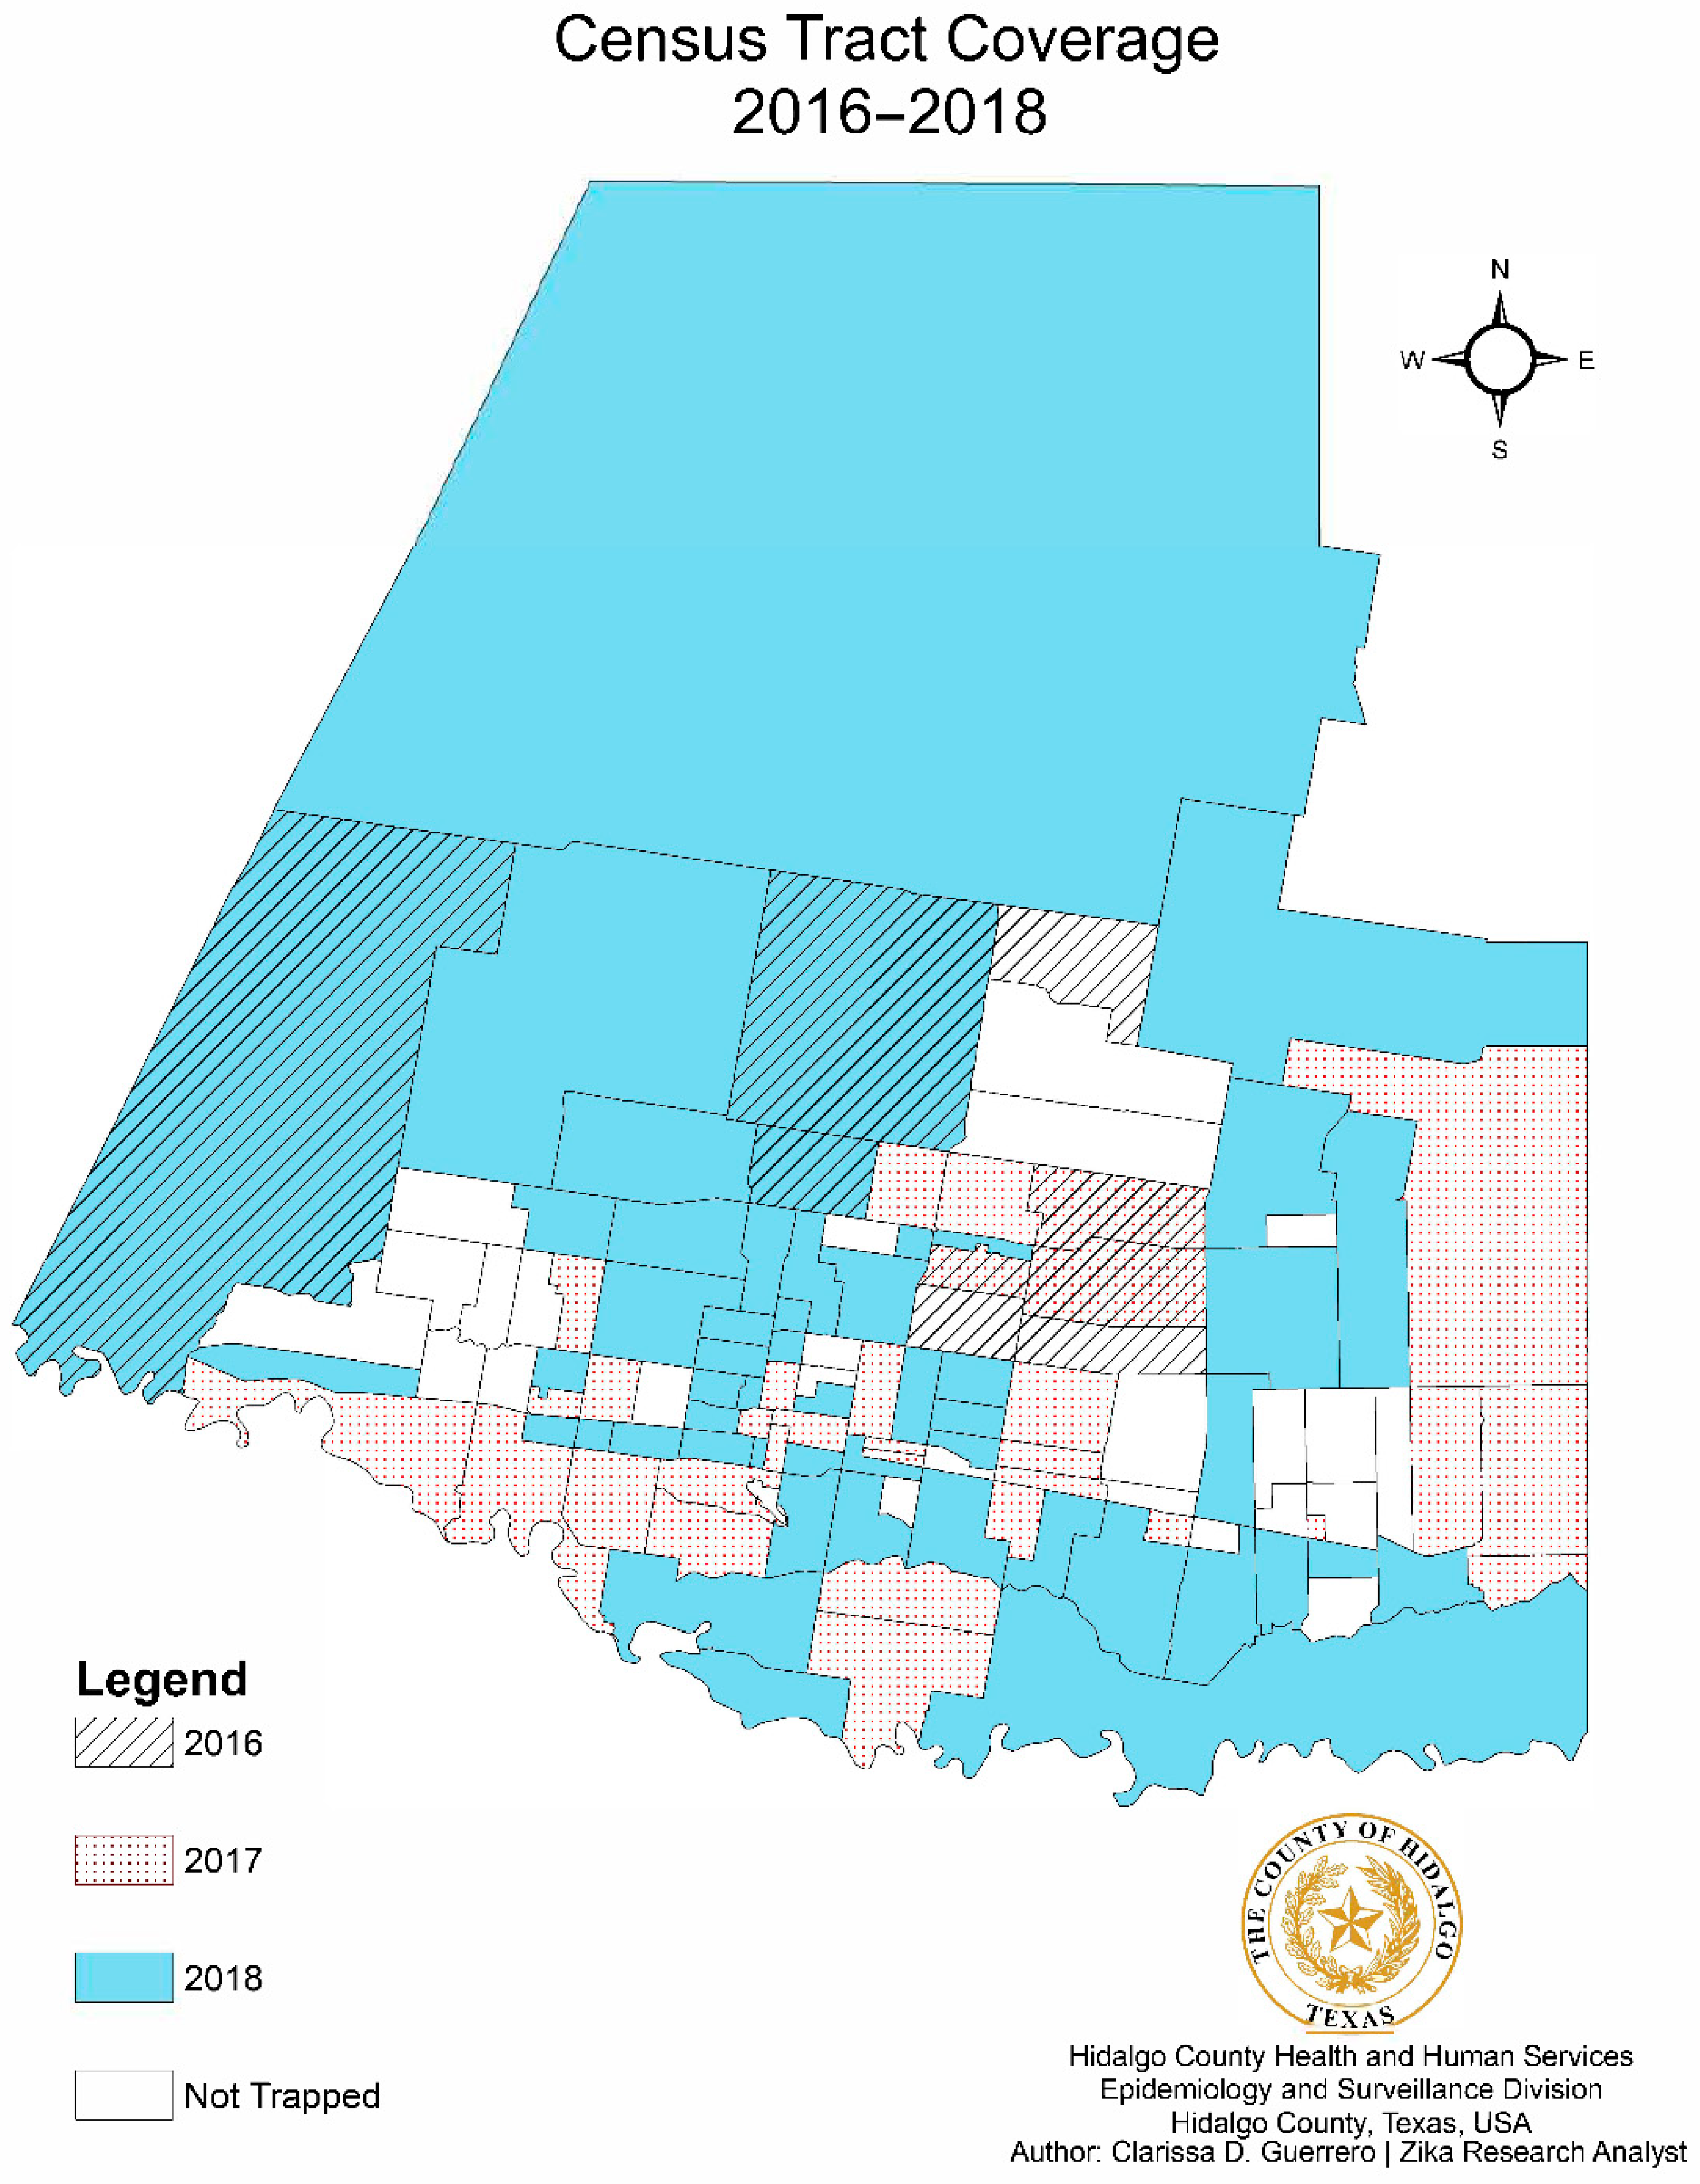
Trapping sites from 2016 to 2018, and the relation to city limits, are depicted in the form of a dot density map, as shown in
Figure 2. The number of census tracts visited increased from 9 tracts in 2016, to 32 in 2017, to 80 in 2018, resulting in an overall 63.4% increased coverage (
Figure 3). Census tracts with multiple layers shown indicated successful collections of one or more years denoted. A choropleth map color coded with the dominant mosquito species for each city within the county was also developed with mosquito data (
Figure 4). The relative population size of each city is indicated in this map by the size of the circle representing the city.
Aedes aegypti was identified as the dominant species in 5 of the 22 cities, as illustrated in gold.
Culex. quinquefasciatus was the dominant species in 4 cities, all illustrated in dark blue. The city of Mission was the only municipality to have
Ae. albopictus as the dominant species. Baseline trapping locations increased each year from 2016 (n = 1) to 2017 (n = 5) to 2018 (n = 10). A scatter plot was also developed to assess the relationship between mosquitoes and climate variables per Morbidity and Mortality Weekly Report (MMWR) week from 2016–2018 (
Figure 5). As shown in
Figure 5, elevated temperatures and humidity facilitated the increase of overall mosquito activity. Additionally, it appears that mosquito activity continued to occur during cooler temperatures, however this was not observed below 40 °F.
Linear regression was performed on mosquito counts per trap-night and compared to climate variables, including temperature, humidity, wind and barometric pressure. Results indicated that humidity, wind and barometric pressure did not significantly influence mosquito abundance over the three-year period; however, temperature did significantly influence mosquitoes per trap-night (p < 0.01).
3. Discussion
Prior to 2016, cases and outbreaks of Zika were documented in Mexico, Central America and South America [
12]. With the risk of vector-borne disease and documented evidence of DENV and ZIKV transmission in Hidalgo County, mosquito surveillance was a vital public health function to monitor disease risk. This study represents a retrospective data analysis of mosquito surveillance activities in Hidalgo County, Texas, 2016–2018. A total of 1207 traps were set, and 8290 female mosquitoes caught. These consisted of 28 different species and resulted in 1058 mosquito pools being tested for arboviruses. All testing results were negative. The surveillance efforts were led by the county health department (Hidalgo County Health and Human Services), so trapping methods and locations were public health-focused and included sentinel sites, case investigation sites and public health intervention sites. Ideally, for a study design, all trapping locations would be the same for the entire collection period, however, due to the county public health response needs, variable trapping methods and locations were employed each year.
Final surveillance outcomes show an increase of 1.640% for number of traps set in 2018 compared to 2016, resulting in a 1.275% increase in mosquitoes. This increased trapping also allowed mosquito absence data collection, when traps were set, and no mosquitoes were collected. Regarding trap comparison, all collection methods except for Fay-Prince (n = 5) caught a variety of species although, the Fay-Prince trapping only occurred in 2018 with a total of nine traps nights. CDC light trap (n = 22) and backpack aspirator (n = 21) methods resulted in the highest number of species collected, compared to all other collection methods, whereas the BG-Sentinel trap (n = 19) resulted in the largest total number of mosquitoes collected. A species composition shift was observed year to year when examining all species collected. More specifically, Ae. species surveillance efforts revealed an 18.684% increase in Ae. aegypti and an increase from 0 to 513 Ae. albopictus mosquitos caught from 2016 to 2018, with the primary increase in Ae. aegypti in 2018 and the primary increase in Ae. albopictus occurring in 2017. Although the same number of species were collected in 2016 and 2017, the data from 2016 were dominated by the two Psorophora (Ps.) sp. which together comprised over two-thirds of the 2016 collections that year. Collection methods and trap locations can be biased for certain mosquito species. The increase in vector mosquitoes during the study period could be attributed to these biases or to other underlying factors, as interpretation of data were based on count per trap, rather than cumulative totals.
An analysis on climatic factors in relation to general mosquito abundance was performed using linear regression modeling. The low adjusted r squared value (
Table 2) may indicate other variables not included in the model that may influence mosquito abundance. Alternatively, there may simply be a high level of variability in mosquito abundance that is only marginally influences by temperature.
Some limitations encountered throughout the study were limited baseline trapping data, and limited staff and equipment. From a public health approach, it was difficult to establish consistent trapping locations because initial trapping efforts were conducted in response to community complaints. In addition, limited resources (personnel and the traps themselves) did not allow for a full factorial design to compare traps to each other. As a result, trap locations and trapping effort differed between years, making it difficult to compare the spatial and temporal dynamics of mosquito species populations from year to year. In 2016, there were very few locations where trapping took place more than five times. In addition, mosquito trapping only took place primarily from May to October. After limited collections in 2016, trapping increased during 2017 and 2018 when more personnel were hired for mosquito surveillance and Zika response efforts.
Another complication was collecting weather data for sites. Climate data were primarily recorded at time of collection, however, some data reflected data from historical data sets due to missing data at the time of collection. Furthermore, it was determined that precipitation data collected were not a good variable due to the data collection method, which reflected total rainfall accumulation on the day of collection, resulting in many days with zero rainfall. Therefore, data reflecting one week of prior precipitation, rather than daily rainfall, may provide better analysis and insight. The challenge of collecting weather data also resulted in utilizing historical datasets online. In future surveillance projects, the utilization of stationary weather sensors at each site would address each of these problems and assist in providing more accurate data for climate analysis.
Vector surveillance programs are critical for informing vector control activities for local public health departments. Integrated vector management (IVM) is the decision-making process for the efficient use of vector control resources to reduce or stop vector-borne pathogen transmission. Screening of mosquito pools for arboviruses is a commonly used practice to gauge the potential threat of mosquito-borne diseases in a community to inform IVM decision processes. With the rising trend in human cases of vector-borne diseases in the United States [
13] and recent introductions of newly emerging arboviruses in Texas, maintaining ongoing mosquito surveillance activities is vital.
Collaborations between multiple municipalities and universities on mosquito surveillance activities provided for creative opportunities to overcome obstacles and expand surveillance efforts during the study period. Involving students from local higher education institutions to assist in county vector surveillance efforts can provide support to health department staff, while providing public health experience to students. By creating these collaborative efforts, the community is served while training future public health frontline workforce. This type of collaborative surveillance is essential in areas such as Hidalgo County, where local Zika outbreaks have occurred. With limited mosquito surveillance funding for local health departments, this strategy can be implemented to continue and enhance surveillance operations.
4. Materials and Methods
This mosquito surveillance project took place in Hidalgo County, along the Texas–Mexico border. Hidalgo County is the 7th most populated county in Texas with 860,661 residents and 547.9 persons per square mile [
14]. The summer season is hot lasting approximately 4 months, with average temperature highs at 97 °F, whereas winters are typically short and mild with average temperature lows at 52 °F, and average RH of 97% in the summer and 9% in the winter [
15].
Vector and climate data were collected from 1 January 2016 to 31 December 2018 with the assistance of Alamo, Hidalgo, La Villa, McAllen, Weslaco, Mission and Pharr municipalities. Mosquito surveillance from 1 January 2016 to 31 May 2017 primarily focused on sporadic trapping based on residential mosquito complaints. Trapping efforts from 1 June 2017 to 31 December 2018 included expanded activities to examine sentinel sites, conduct public health response operations and general surveillance to monitor vector abundance in Hidalgo County.
Mosquito collections were conducted using BioGents (BG) Sentinel 2 Traps (BIOGENTS™, Regensburg, Germany) baited with BG lures, Improved Prokopack Aspirators (John W. Hock Company©, Gainesville, FL, USA), CDC Miniature Light Traps (John W. Hock Company©), CDC Gravid Traps (John W. Hock Company©, Gainesville, FL, USA) and CDC Fay-Prince Traps (John W. Hock Company©, Gainesville, FL, USA). Dry ice was used as an attractant for all trap types when available. Supply constraints for dry ice results in the supplier not always having it in stock. Trap type and locations were determined by factors, such as habitat type, accessibility (public/private property), target mosquito populations, detected arboviral disease cases and climate. Traps utilized for collection varied based on personnel available and, traps available at the time of collection.
A total of 475 sites were utilized over the entire trapping period. In most cases, sites were utilized multiple times, but some sites were collected at very infrequently (in some cases, just once). Field locations were a mix of urban and rural sites, most of which were residential. Selection of sites was based on nuisance calls, previous history of mosquito activity and convenience of access. Trapping was also planned for locations where mosquito-borne diseases in humans were detected, but no such locations were identified during this collection period. Traps were left at locations for approximately 24 h before samples were collected. Backpack aspirators were used in early- or mid-morning collections at trap sites to collect samples of resting mosquito populations. Backpack aspirating consisted of a five-to-ten-minute sweeping pattern in grassy or damp areas where trapping occurred. Upon collection, mosquitoes were either sent to the University of Texas Rio Grande Valley (UTRGV) or the Texas Department of State Health Services Arbovirus Laboratory (DSHSAL) for species identification and arbovirus testing. Mosquitoes were identified to species using standard taxonomic keys [
16] and sorted by date of collection, trap location, trap type and sex. Some mosquitoes were unable to be identified due to damage during collection. Female vector species were pooled into groups of 1–50 mosquitoes per tube and stored at −80 °C until tested. Both organizations tested blood fed and non-blood fed female mosquitoes for arboviruses and tabulated male counts. Testing at UTRGV included a real-time RT-PCR assay [
17] for the detection of ZIKV and DENV (1–4 serotypes) from
Ae. aegypti and
Ae. albopictus pools. Testing at the Texas DSHSAL included multiplex real-time RT-PCR assays for the detection of WNV, St. Louis encephalitis virus (SLEV) and Western equine encephalitis virus (WEEV) [
18] from
Culex vector species mosquito pools and ZIKV, CHIKV and DENV (1–4 serotypes) [
17] from
Ae. aegypti and
Ae. albopictus mosquito pools. All primer and probe sequences are available upon request.
Weather data were also recorded on the day of trap collection from Weather Underground (
www.wunderground.com, 7 February 2020). Less than 1% of the weather data was recorded using a handheld anemometer. Weather data from the nearest larger city was used for smaller cities when data were not available.
Descriptive statistics were used to evaluate mosquito species composition in Hidalgo County. Due to different reporting methods for male mosquitoes used by UTRGV and the DSHSAL, male species counts were excluded from species composition data analyses. Female mosquitoes were tabulated per species and trap type for each year. Linear regression was conducted to evaluate the relationship between mosquito abundance and climate variables. Additionally, spatial analysis was also conducted on these data using ArcGIS, including a dot density map layered with city and county boundaries to depict trapping locations (
Figure 2) and choropleth map to depict census tracts (
Figure 3) and dominant mosquito species per city (
Figure 4). In addition to ArcGIS, the following software was used for statistical data analysis: StataIC (v15.1, 64-bit, College Station, TX, USA), Epi-Info (v7.2.2.6, Centers for Disease Control and Prevention, CDC, Atlanta, GA, USA) and Microsoft Excel.
5. Conclusions
Overall, during the study period, Hidalgo County mosquito surveillance improved with the assistance of funding for program expansion and through multiple collaborations. The community, municipalities and partners benefited from the increased surveillance activities and the collaborations. In addition, an improved understanding of vector species presence and abundance in the county was developed. This project successfully identified predominant mosquito species in the area and examined the potential risk of local disease transmission within vector populations. This information can assist public health response efforts during times of local arbovirus transmission, disease outbreaks and severe weather events. Although there were no virus-positive mosquito pools detected during the study period or during subsequent years (2019–2020), maintaining surveillance in Hidalgo County is critical with continued reports of locally acquired human arbovirus infections. In 2019, two cases of DENV were reported and in 2020, five cases of DENV, one SLEV case and one WNV case (all locally acquired) were reported in Hidalgo County [
11].
In the future, Hidalgo County plans to establish more baseline sites to continue monitoring mosquito species composition and collect consistent data. Future goals include increasing trapping frequency during off-season months to better depict Aedes sp. activity, especially since historical outbreaks of DENV and ZIKV have occurred in the late fall. The need for increased surveillance resources and personnel are essential in Hidalgo County for the continuation of monitoring target vector species. Stable funding for local health departments is critical to ensure that mosquito surveillance activities can continue to monitor disease threats within their respective communities. With health departments playing key roles as frontline responders in public health crises, data collection is key for vector mosquitoes and potential outbreak detection. Continued collaboration between public health, municipalities and higher education institutions can improve the detection, response and intervention of future arboviral risks to the community.
Author Contributions
Conceptualization: S.H., C.J.V., D.V., J.T., B.G.B., W.A.Q., R.T., E.O.; methodology: S.H., C.J.V., J.T., B.G.B., W.A.Q., R.T., E.O.; software: C.D.G., S.H., D.V., N.T., M.G., S.A.; validation: C.D.G., S.H., D.V., N.T., S.A.; formal analysis: C.D.G., S.H., D.V., N.T., M.G., S.A.; investigation: C.D.G., S.H., D.V., N.T., M.G., S.A., N.C., C.J.V., J.T., V.H., J.G.J., B.G.B., W.A.Q., R.T., E.O.; data curation: S.H., M.G., C.J.V., B.G.B.; writing—original draft preparation: S.H.; writing—review and editing: C.D.G., S.H., D.V., N.T., M.G., S.A., N.C., C.J.V., J.T., V.H., J.G.J., B.G.B., W.A.Q., R.T., E.O. visualization: C.D.G., S.H., D.V., N.T., M.G., S.A., N.C.; supervision: S.H., D.V., C.J.V., J.T., E.O.; project administration: S.H., C.J.V., J.T., E.O.; funding acquisition: S.H., C.J.V., J.T., B.G.B., W.A.Q., E.O. All authors have read and agreed to the published version of the manuscript.
Funding
This research was funded in part by the Centers for Disease Control and Prevention, Texas DSHS Zika Epidemiology and Laboratory Capacity (ELC) grant and award 1U01CK000512-01 to establish the Western Gulf Center of Excellence for Vector-Borne Diseases.
Institutional Review Board Statement
Not applicable.
Informed Consent Statement
Not applicable.
Data Availability Statement
Data supporting reported research results are maintained and available through the Hidalgo County Health and Human Services Department and the University of Texas Rio Grande Valley.
Acknowledgments
The authors thank all participants of this mosquito surveillance project. This includes but is not limited to the staff at Hidalgo County Health and Human Services, the cities and municipalities within Hidalgo County, and the members of the South Texas Vector Control Taskforce. In addition, the authors thank the University of Texas–Rio Grande Valley and Texas Department of State Health Services for their collaboration in mosquito speciation and arboviral testing. Finally, the authors would like to thank the reviewers of this journal article.
Conflicts of Interest
The authors declare there are no conflict of interest.
References
- Gubler, D.J. Epidemic dengue/dengue hemorrhagic fever as a public health, social and economic problem in the 21st century. Trends Microbiol. 2002, 10, 100–103. [Google Scholar] [CrossRef]
- Kauffman, E.B.; Kramer, L.D. Zika Virus Mosquito Vectors: Competence, Biology, and Vector Control. J. Infect. Dis. 2017, 216 (Suppl. S10), S976–S990. [Google Scholar] [CrossRef] [PubMed] [Green Version]
- Gould, E.; Pettersson, J.; Higgs, S.; Charrel, R.; de Lamballerie, X. Emerging arboviruses: Why today? One Health 2017, 30, 1–13. [Google Scholar] [CrossRef] [PubMed]
- Benelli, G.; Romano, D. Mosquito vectors of Zika virus. Entomol. Gen. 2017, 36, 309–318. [Google Scholar] [CrossRef]
- Abílio, A.P.; Abudasse, G.; Kampango, A.; Candrinho, B.; Sitoi, S.; Luciano, J.; Tembisse, D.; Sibindy, S.; de Almeida, A.P.G.; Garcia, G.A.; et al. Distribution and breeding sites of Aedes aegypti and Aedes albopictus in 32 urban/peri-urban districts of Mozambique: Implication for assessing the risk of arbovirus outbreaks. PLoS Negl. Trop. Dis. 2018, 12, e0006692. [Google Scholar] [CrossRef] [PubMed] [Green Version]
- Nolan, M.S.; Schuermann, J.; Murray, K.O. West Nile virus infection among humans, Texas, USA, 2002–2011. Emerg. Infect. Dis. 2013, 19, 137–139. [Google Scholar] [CrossRef] [PubMed]
- Rivera, A.; Adams, L.E.; Sharp, T.M.; Lehman, J.A.; Waterman, S.H.; Paz-Bailey, G. Travel-Associated and Locally Acquired Dengue Cases—United States, 2010–2017. MMWR Morb. Mortal. Wkly. Rep. 2020, 69, 149–154. [Google Scholar] [CrossRef] [PubMed] [Green Version]
- Ramos, M.M.; Mohammed, H.; Zielinski-Gutierrez, E.; Hayden, M.H.; Lopez, J.L.; Fournier, M.; Trujillo, A.R.; Burton, R.; Brunkard, J.M.; Anaya-Lopez, L.; et al. Epidemic dengue and dengue hemorrhagic fever at the Texas-Mexico border: Results of a household-based seroepidemiologic survey, December 2005. Am. J. Trop. Med. Hyg. 2008, 78, 364–369. [Google Scholar] [CrossRef] [PubMed]
- Morrison, A.C.; Zielinski-Gutierrez, E.; Scott, T.W.; Rosenberg, R. Defining Challenges and Proposing Solutions for Control of the Virus Vector Aedes aegypti. PLoS Med. 2008, 5, e68. [Google Scholar] [CrossRef] [PubMed] [Green Version]
- Mandal, N.K. Climate Change: Impact on Vector borne diseases. J. Compr. Health 2018, 6, 1–54. [Google Scholar]
- DSHS Arboviral Weekly Activity Reports. Available online: https://www.dshs.texas.gov/idcu/disease/arboviral/westNile/reports/weekly.aspx (accessed on 7 February 2020).
- Hernández-Ávila, J.E.; Palacio-Mejía, L.S.; López-Gatell, H.; Alpuche-Aranda, C.M.; Molina-Vélez, D.; González-González, L.; Hernández-Ávila, M. Zika virus infection estimates, Mexico. Bull. World Health Organ. 2018, 96, 306–313. [Google Scholar] [CrossRef] [PubMed]
- Rosenberg, R.; Lindsey, N.P.; Fischer, M.; Gregory, C.J.; Hinckley, A.F.; Mead, P.S.; Paz-Bailey, G.; Waterman, S.H.; Drexler, N.A.; Kersh, G.J.; et al. Vital Signs: Trends in reported vectorborne disease cases—United States and Territories, 2004–2016. Morb. Mortal. Wkly. Rep. 2018, 67, 496–501. [Google Scholar] [CrossRef] [PubMed] [Green Version]
- United States Census Bureau. Hidalgo County: Quick Facts Hidalgo County, Texas. 2017. Available online: https://censusreporter.org/profiles/05000US48215-hidalgo-county-tx (accessed on 20 November 2019).
- Weather Spark. McAllen: Average Weather in McAllen, Texas. 2019. Available online: https://weatherspark.com/y/7061/Average-Weather-in-McAllen-Texas-United-States-Year-Round#Sections-Temperature (accessed on 20 November 2019).
- Darsie, R.F., Jr.; Ward, R.A. Identification and Geographical Distribution of the Mosquitoes of North America, North of Mexico; University Press of Florida: Gainesville, FL, USA, 2005. [Google Scholar]
- Pabbaraju, K.; Wong, S.; Gill, K.; Fonseca, K.; Tipples, G.A.; Tellier, R. Simultaneous detection of Zika, Chikungunya and Dengue viruses by a multiplex real-time RT-PCR assay. J. Clin. Virol. 2016, 83, 66–71. [Google Scholar] [CrossRef] [PubMed]
- Brault, A.C.; Fang, Y.; Reisen, W.K. Multiplex qRT-PCR for the Detection of Western Equine Encephalomyelitis, St. Louis Encephalitis, and West Nile Viral RNA in Mosquito Pools (Diptera: Culicidae). J. Med. Entomol. 2015, 52, 491–499. [Google Scholar] [CrossRef] [PubMed]
| Publisher’s Note: MDPI stays neutral with regard to jurisdictional claims in published maps and institutional affiliations. |
© 2021 by the authors. Licensee MDPI, Basel, Switzerland. This article is an open access article distributed under the terms and conditions of the Creative Commons Attribution (CC BY) license (https://creativecommons.org/licenses/by/4.0/).


 ,
, 


