1. Introduction
Human campylobacteriosis is among the most common zoonotic diseases, caused mainly by the bacteria
Campylobacter jejuni and
Campylobacter coli. Campylobacteriosis continues to be a major problem worldwide, including Denmark, which has seen the number of cases rising from 4547 in 2018 to 5389 in 2019. The increase in cases in Denmark was attributed to a large outbreak in chicken meat [
1,
2]. The main sources of human infection have been attributed to contaminated meat, poultry, water, milk and contact with farm animals [
3]. Considering that many human campylobacteriosis cases have been attributed to various animal sources, there is a need to determine the relative contribution of the different exposures from animals to the total number of human cases [
4].
Source attribution, which apportions human infection cases to different animal species and food reservoirs, has been instrumental in control- and evidence-based intervention efforts. Several methods for source attribution are available, including the microbial subtyping approach and comparative exposure assessment approach. Microbial subtyping involves characterizing isolates of specific pathogens by phenotypic and genotypic subtyping methods. The principle for this approach involves comparing isolates from different food and animal sources with those from humans. The comparative exposure assessment approach, on the other hand, determines the relative importance of the known transmission routes by estimating the human exposure to the pathogen through each route [
5].
The microbial subtyping attribution approach has been proven to be a valuable source attribution method as it assumes that the distribution of subtypes in the collection of microbial isolates for each source used in the attribution exercise is similar to the true distribution of subtypes in each source. There are two main types of microbial subtyping attribution models: the frequency-matched attribution model, which compares human strain types in the sources and population genetic models based on modeling the organism’s evolutionary history [
6,
7]. Previous studies have reported several applications of the microbial subtyping approach including source attribution of human salmonellosis which was developed in Denmark [
4,
5,
8]. The use of multilocus sequence typing (MLST) is another common example of the microbial subtyping approach, which has been used to identify lineages in bacterial populations by indexing the variation present in seven housekeeping genes located in various parts of the chromosome [
9]. MLST data have been previously utilized to attribute the sources of human
C. jejuni infections in New Zealand, as well as
Salmonella in Denmark, using the Danish Salmonella source account model and the ClonalFrame algorithm [
4,
9].
Whole-genome sequencing (WGS) has been proven to be the most informative approach for the characterization of bacterial isolates and has been used to analyze multiple bacterial outbreaks, such as tuberculosis, listeriosis and salmonellosis, among others [
10,
11,
12]. WGS data sets have become increasingly available. However, one of the limitations of WGS data is the complexity in data analysis due to variable gene content and difficulties interpreting obtained results [
13]. Despite this, many studies have suggested approaches to overcome the limited discriminatory power of MLST by exploiting WGS data. These approaches can be grouped into methods based on the core genome or whole genome multilocus, termed gene-by-gene approaches and single-nucleotide polymorphism (SNP) detection, which segregate by host [
14]. The gene-by-gene approaches assess the diversity of isolates based on alleles found for all wgMLST or cgMLST genes of the species of interest [
15] while SNP-based methods distinguish isolates based on SNPs present in the entire genome, including the intergenic regions, potentially offering a higher resolution [
16,
17].
Different approaches have been used for source attribution using WGS data sets, including machine learning which has previously been applied in source attribution for
Salmonella enterica,
Escherichia coli and
C. jejuni [
13,
18,
19,
20] and to predict the severity or outcome of microbial infections [
21,
22,
23,
24,
25]. The machine learning approach involves training different algorithms and obtaining the best-performing model while obtaining the attribution probabilities of human isolates to different sources. Network analysis, on the other hand, has recently been demonstrated as an accurate approach for the source attribution of human salmonellosis [
4]. Network analysis is based on weighted networks theory, where pairwise distance matrices from source attribution can be visualized as fully connected networks. Nodes in this theory correspond to
Campylobacter isolates and links correspond to genetic distances. Weaker links imply greater genetic distance between isolates. Network analysis is useful in extracting network communities corresponding to different animal sources, where network communities correspond to groups of vertices with a higher probability of being connected to each other than other members of that group [
26].
The probability of a human isolate to be associated with an animal source is computed as the function of the number of links that the human isolate has with other animal isolates. A specific animal source to which human genomes of
Campylobacter are attributed can also be extracted from the network analysis. Using the network approach, we can identify which structural features of a data set play a fundamental role in determining the internal coherence of clusters [
4], such as animal sources, species type and year of origin, etc. We demonstrated the potential of weighted networks for source attribution of human campylobacteriosis using whole-genome sequencing data. We compared the effect of different types of WGS data inputs namely cgMLST, wgMLST and SNP on the accuracy of the weighted network-based source attribution models.
3. Results and Discussion
We compared results obtained using cgMLST, wgMLST and SNP distance matrices from the network analysis.
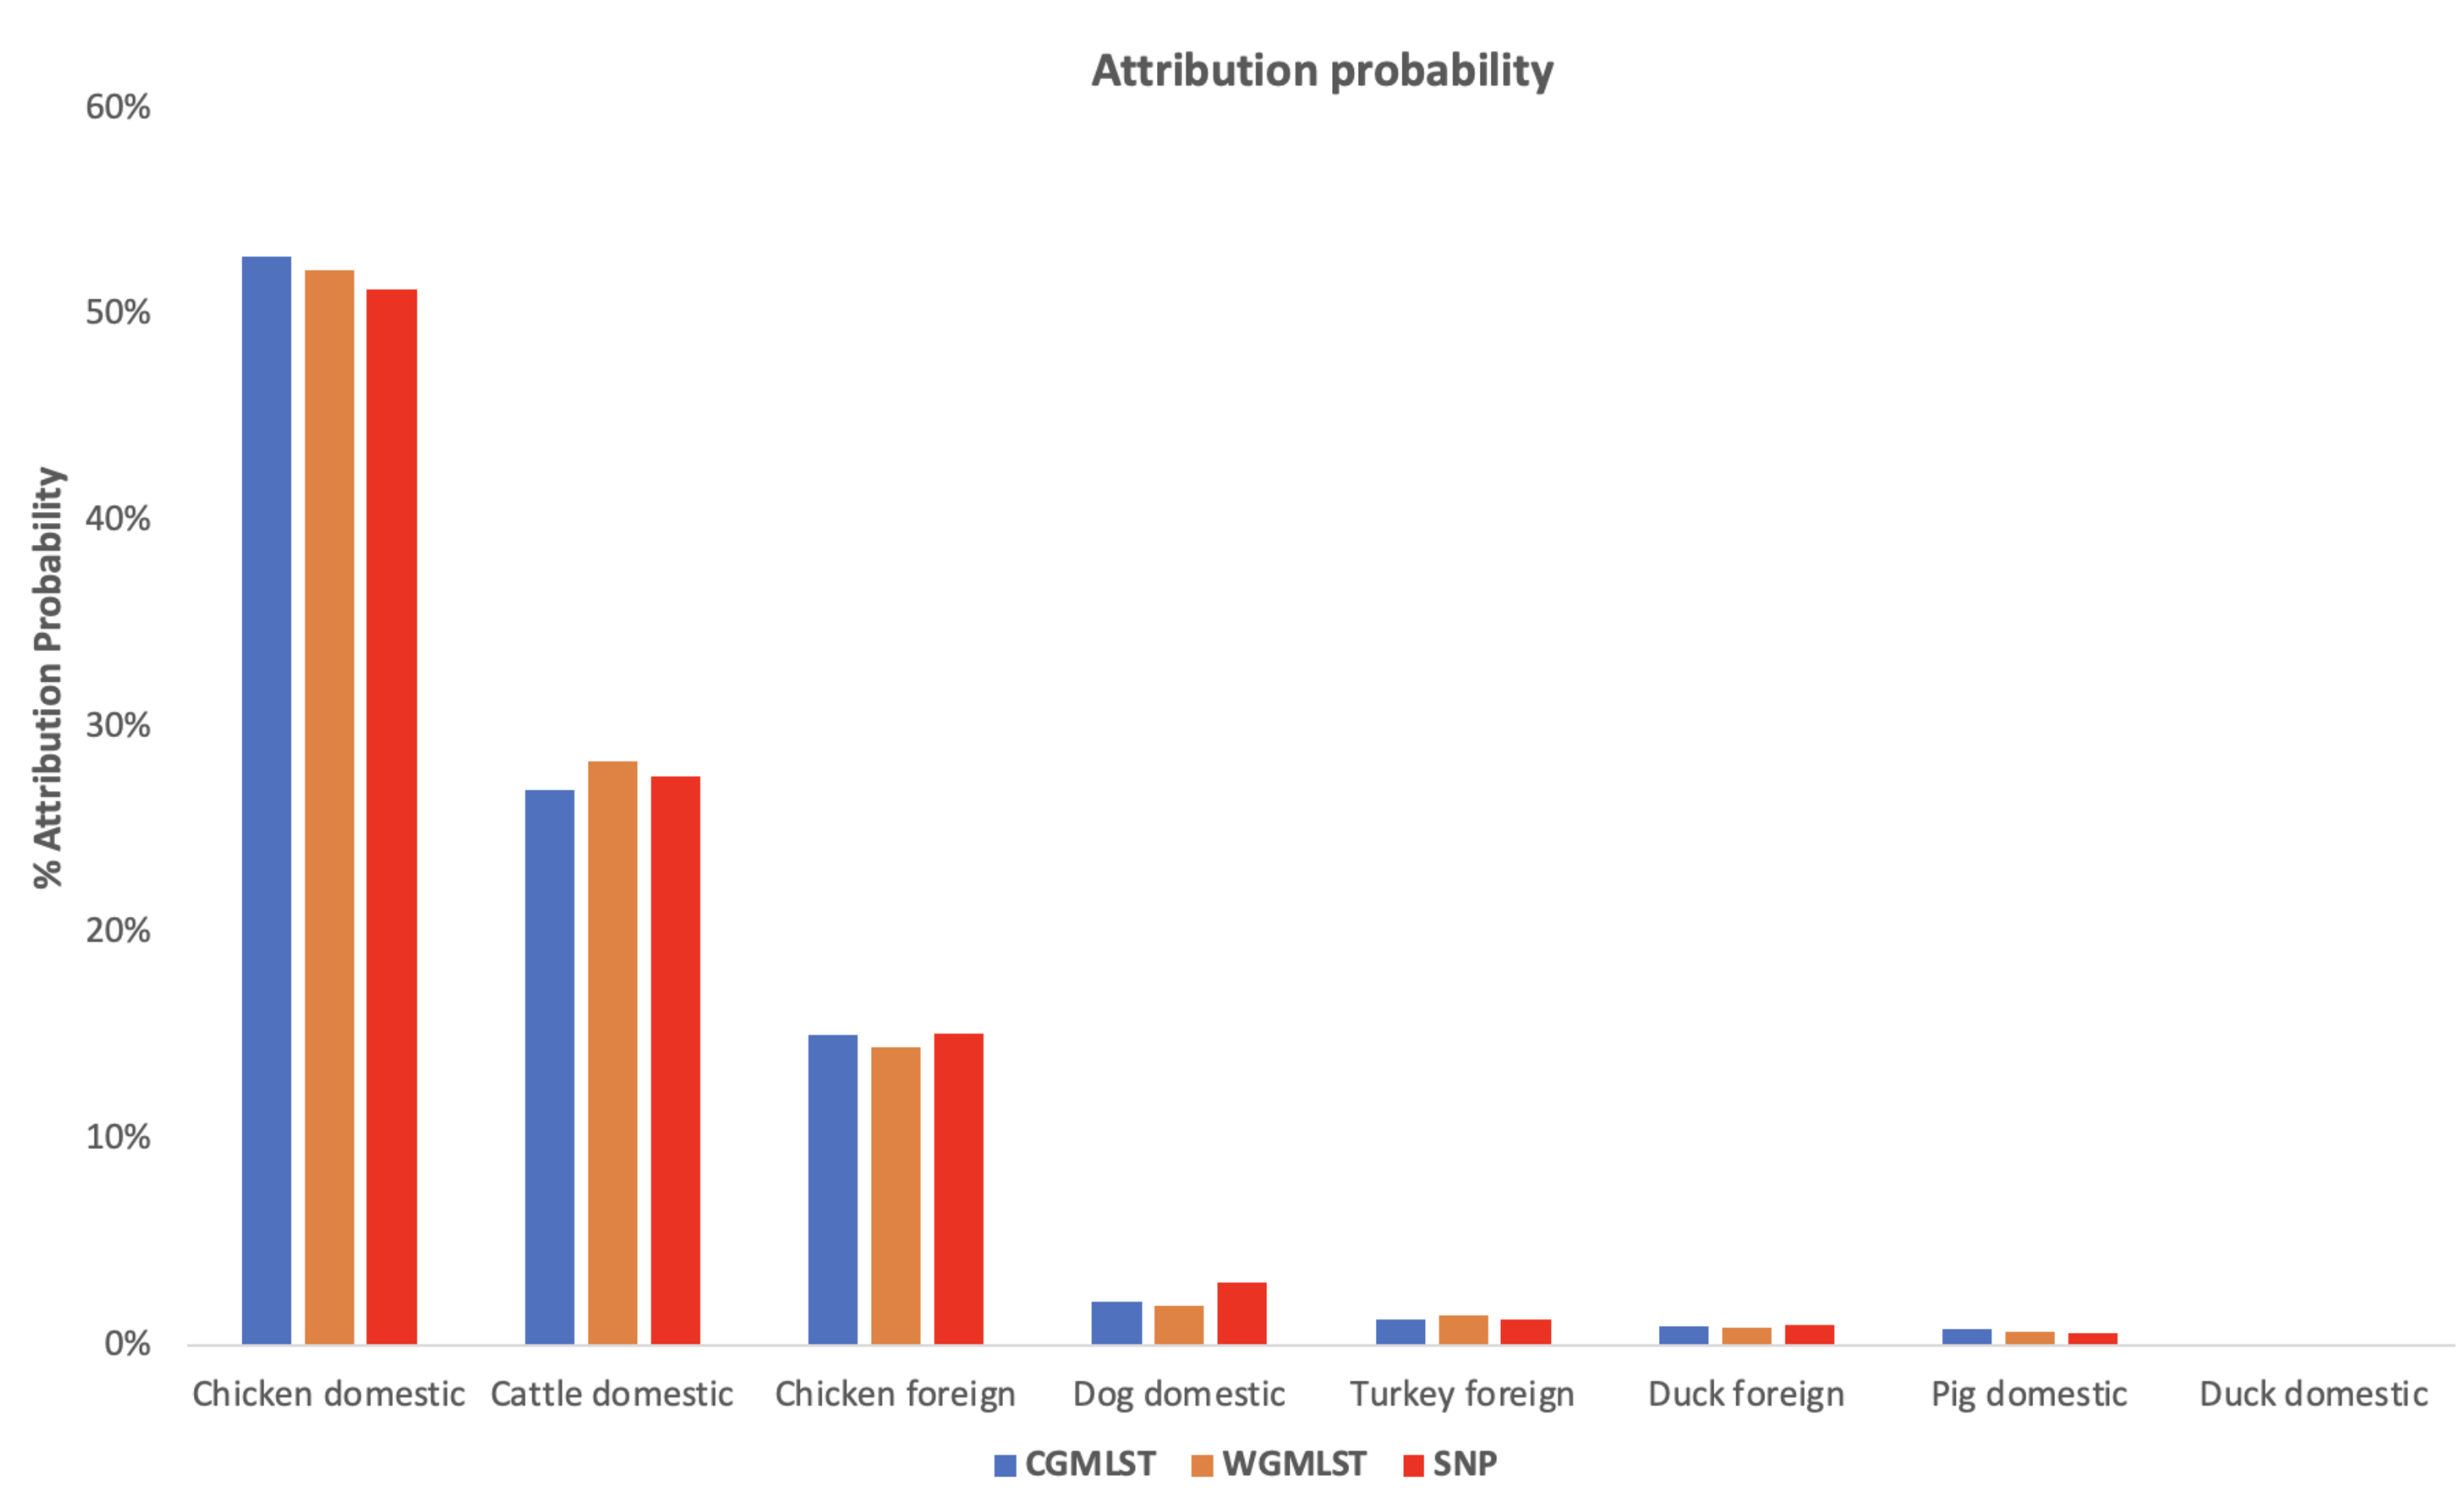
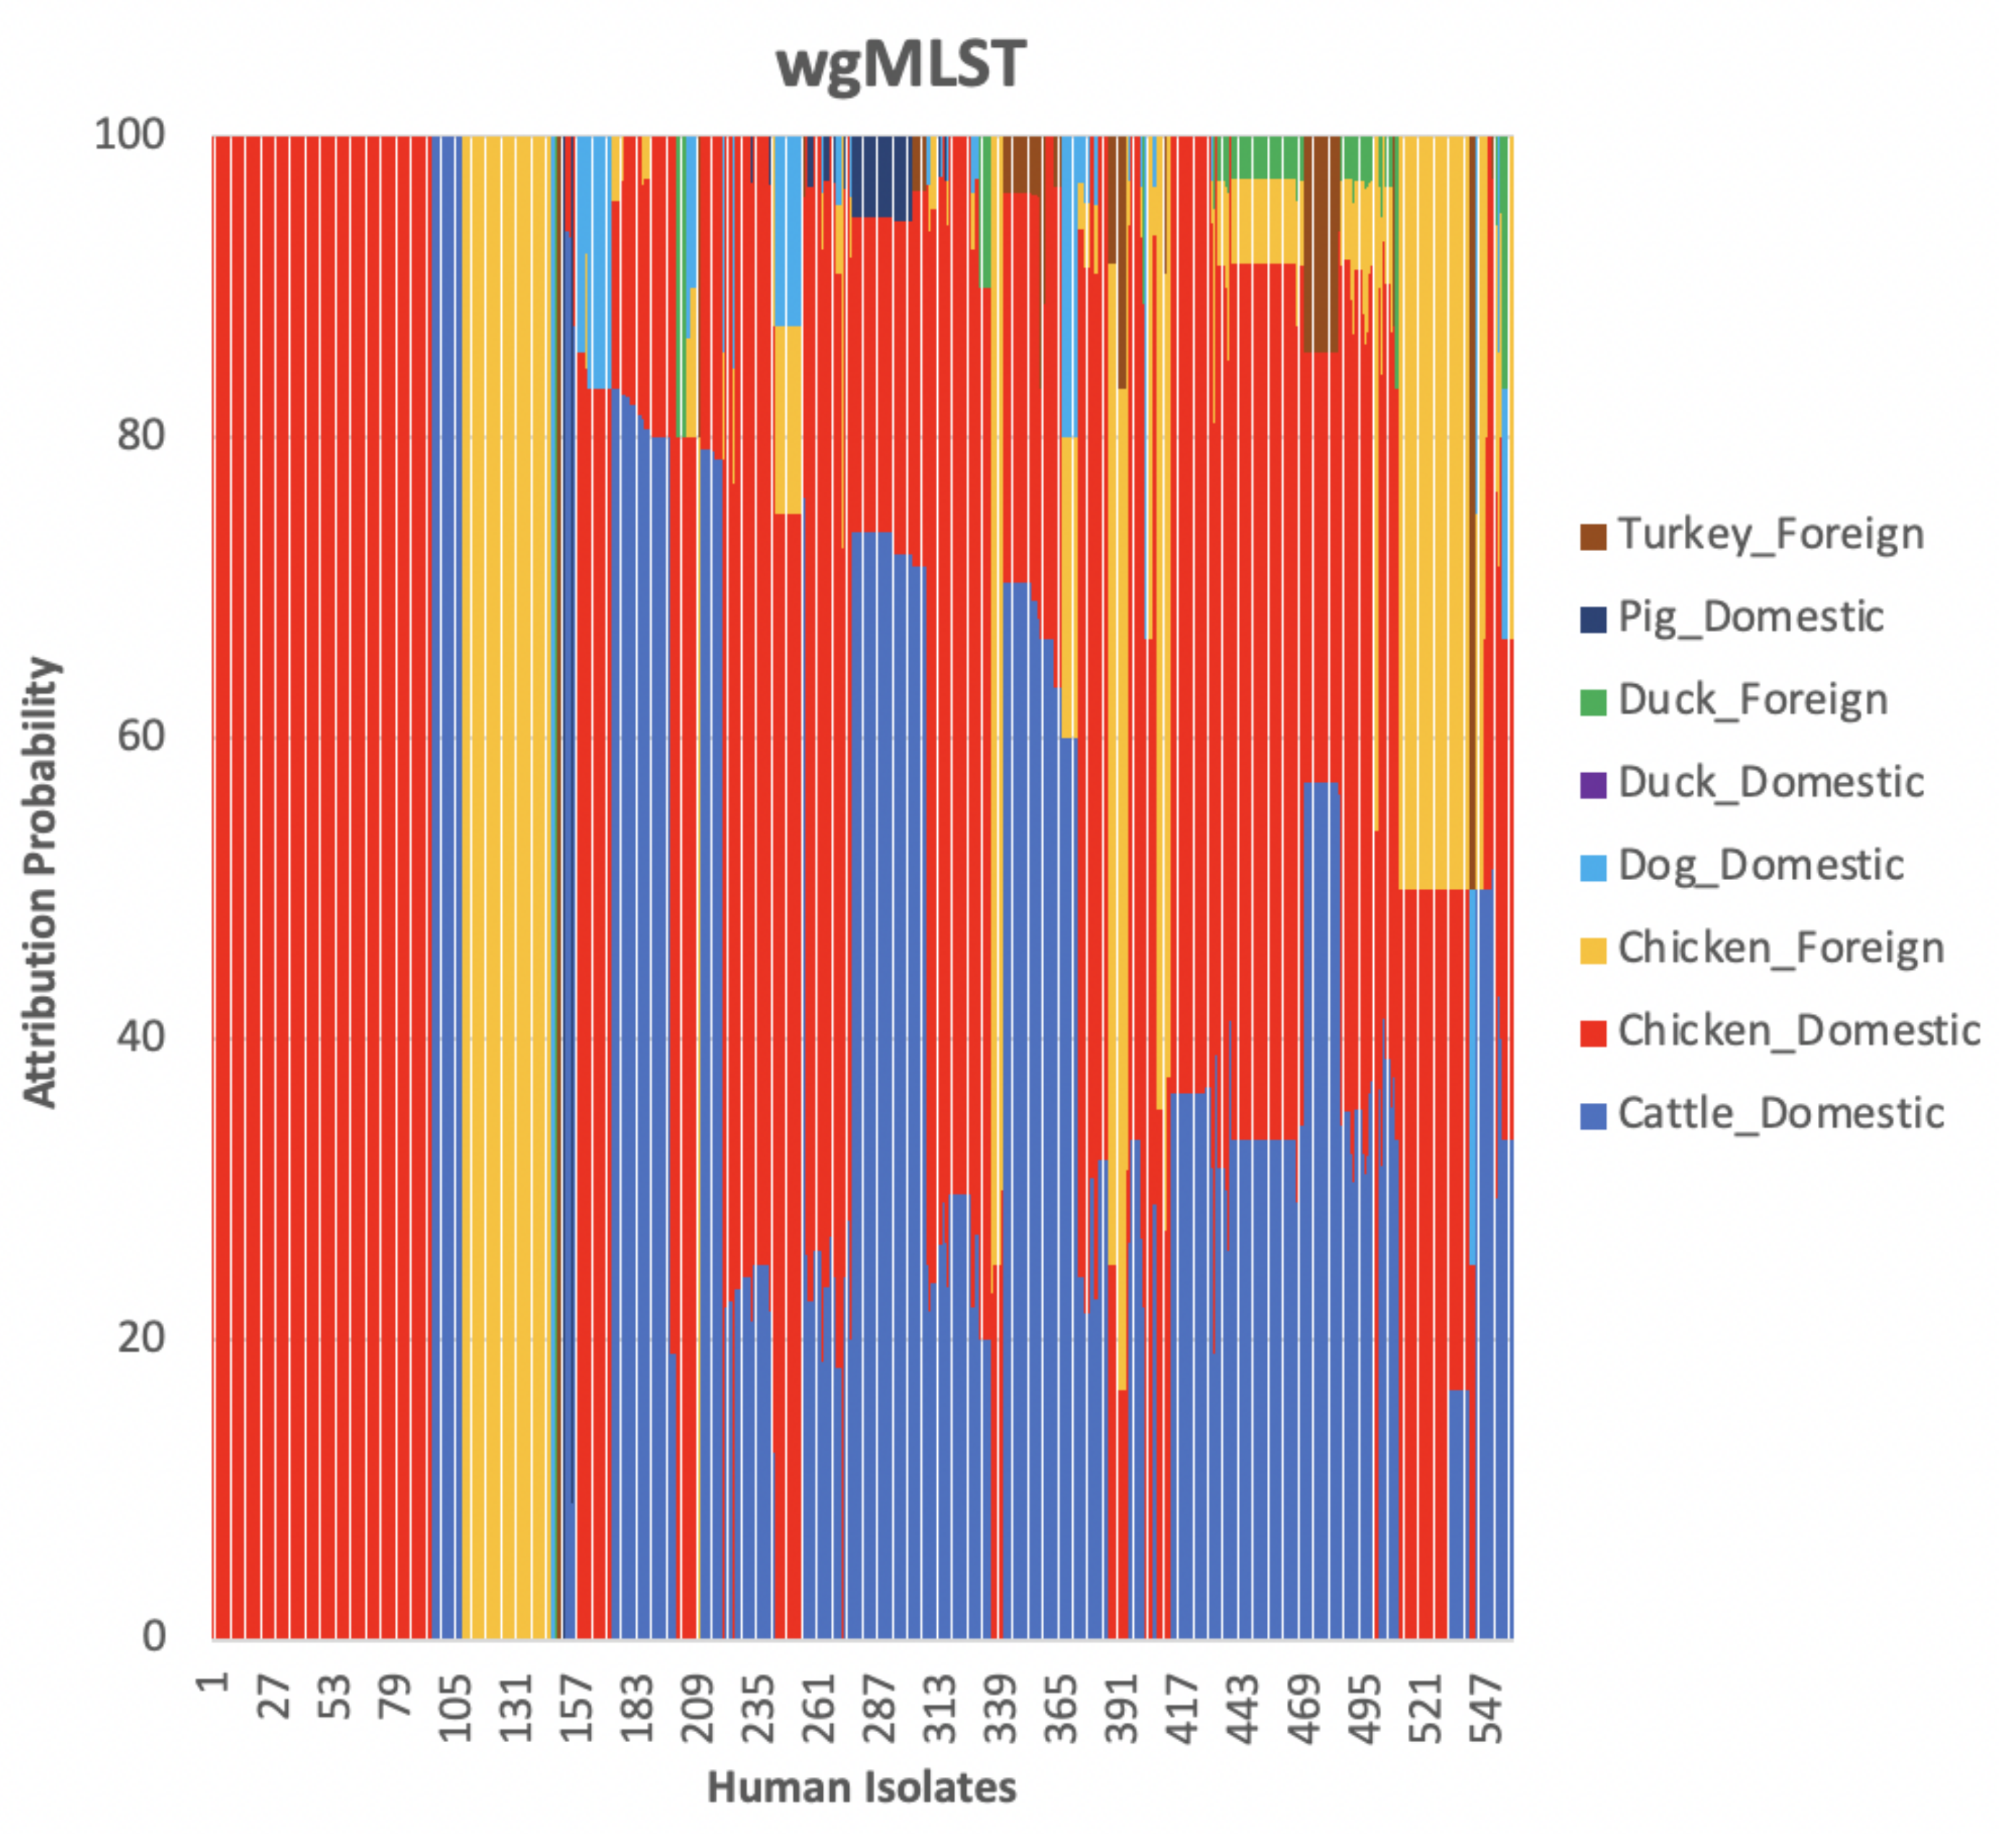
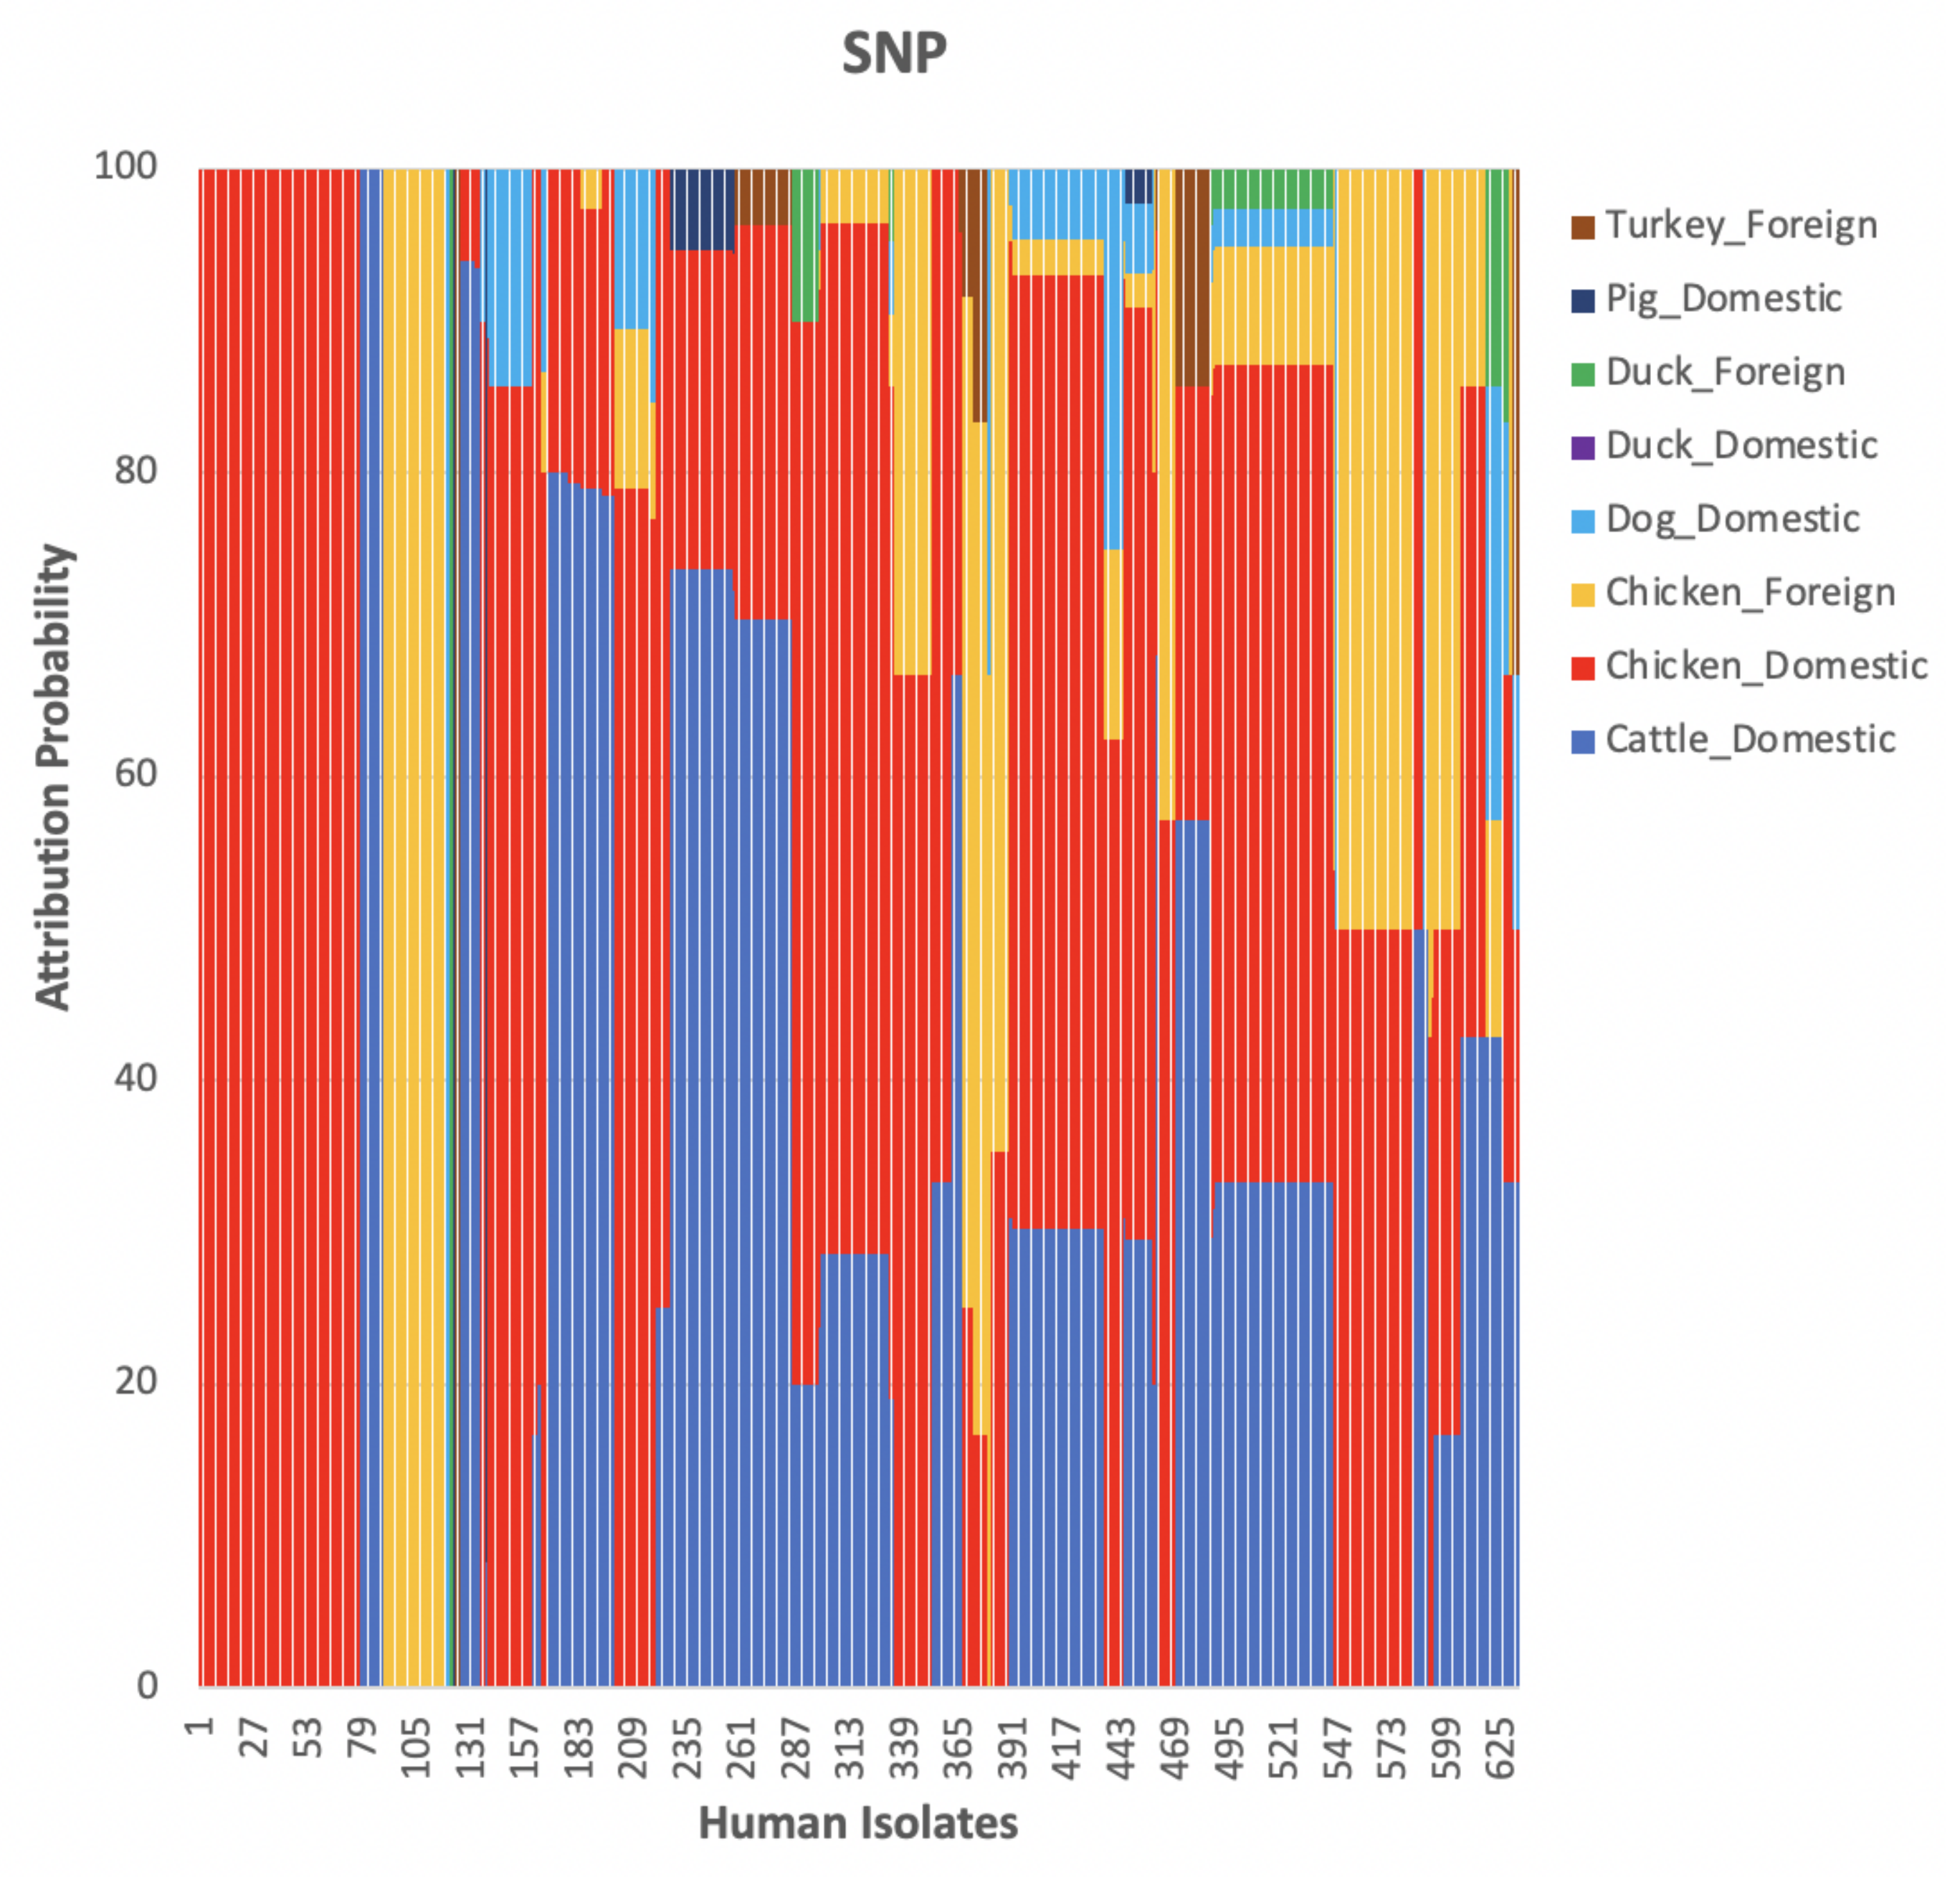
Figure 2 shows the distribution of input data which corresponded to
Figure 3 indicating the mean percentage attribution probability for the three distance matrices. We observed that chickens from Denmark were the main sources of human campylobacteriosis cases, with a percentage of attribution of
, 52.17% and 51.22% for cgMLST, wgMLST and SNP, respectively, while ducks from Denmark were the least probable source of infection. These results are in harmony with previous reports showing chicken meat as the main source of campylobacteriosis in Denmark [
3]. The best threshold values obtained from the cross-validation were
,
and 1715 for cgMLST, wgMLST and SNP distance matrices, respectively (
Table 1). These values were used to maximize the score function from 100 runs of cross-validation.
The network-based method achieved
,
and
coherent source clustering for cgMLST, wgMLST and SNP distance matrices, respectively (
Table 1). The results indicated that animal sources were the main factors driving the clustering, followed by type of
Campylobacter species and finally year of origin (
Table 2).
Table 3 shows results from adding human isolates to the network, where
,
and
were clustered within the existing animal network for cgMLST, wgMLST and SNP, respectively, while the remaining isolates were not to linked to
Campylobacter genomes from any of the animal sources. The algorithm performed reasonably well in source attribution. However, some isolates were wrongly classified. For example, 43 chicken isolates were classified as cattle isolates
Table 4. This misclassification is also apparent in
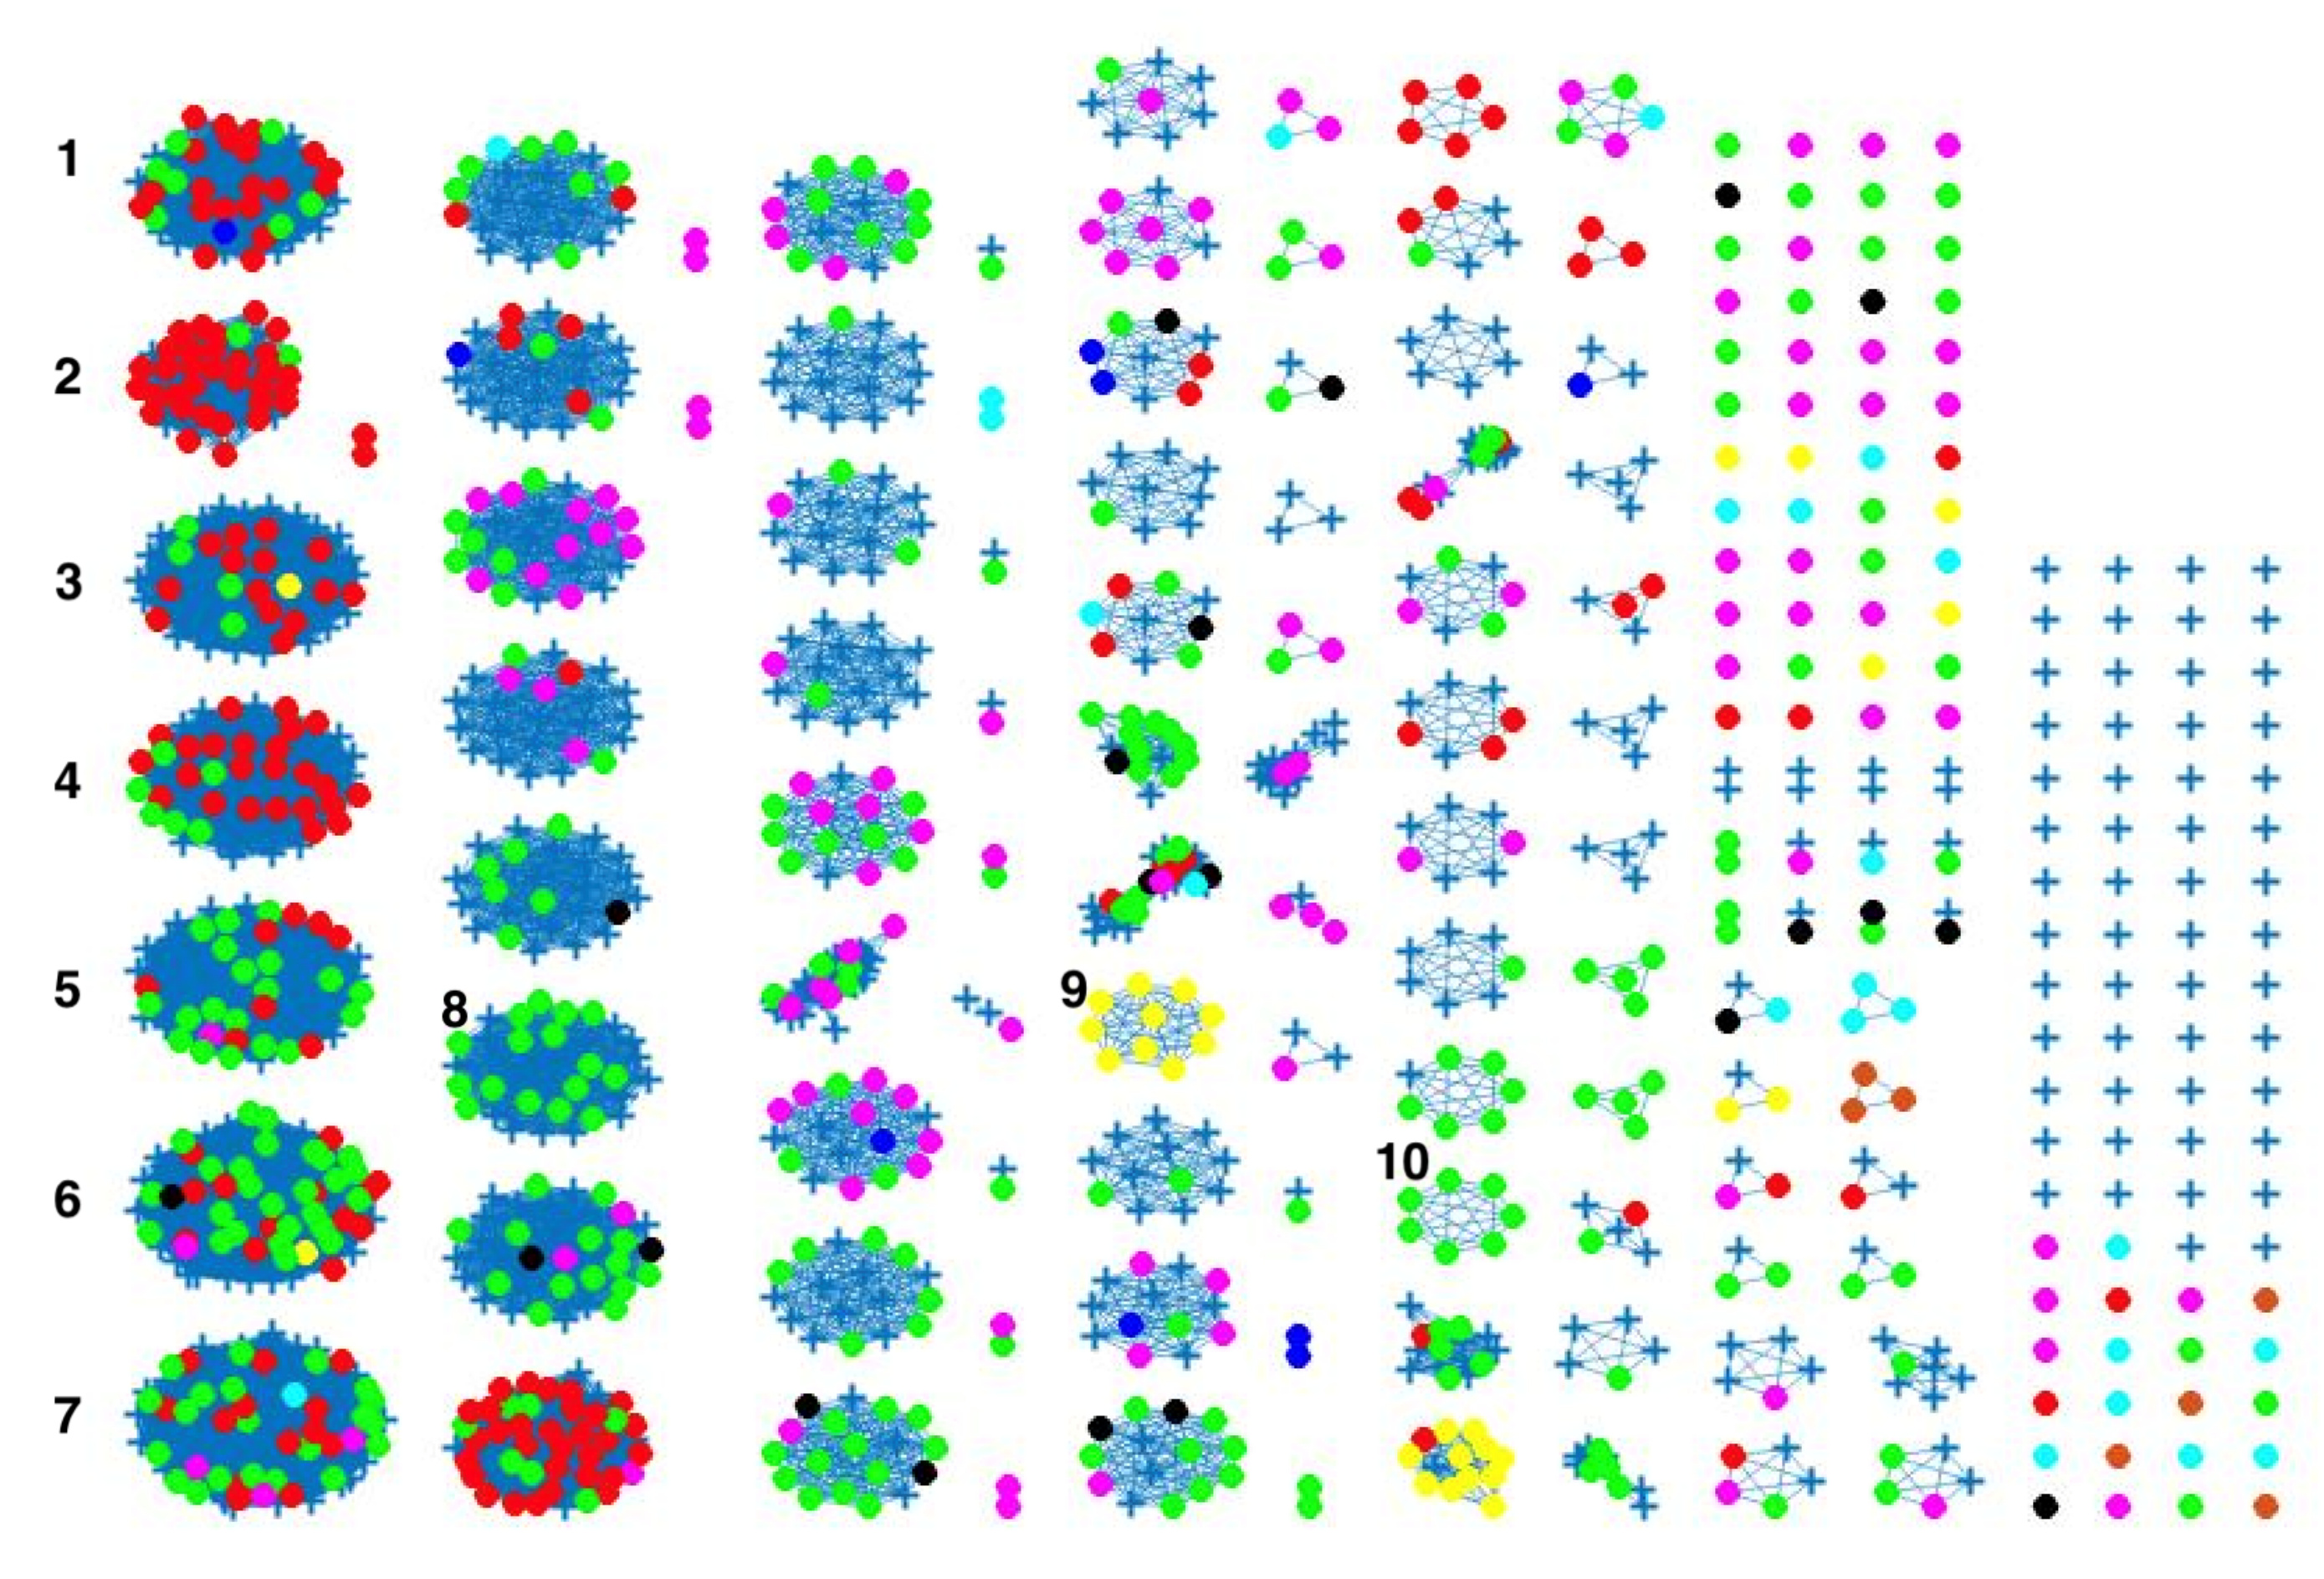
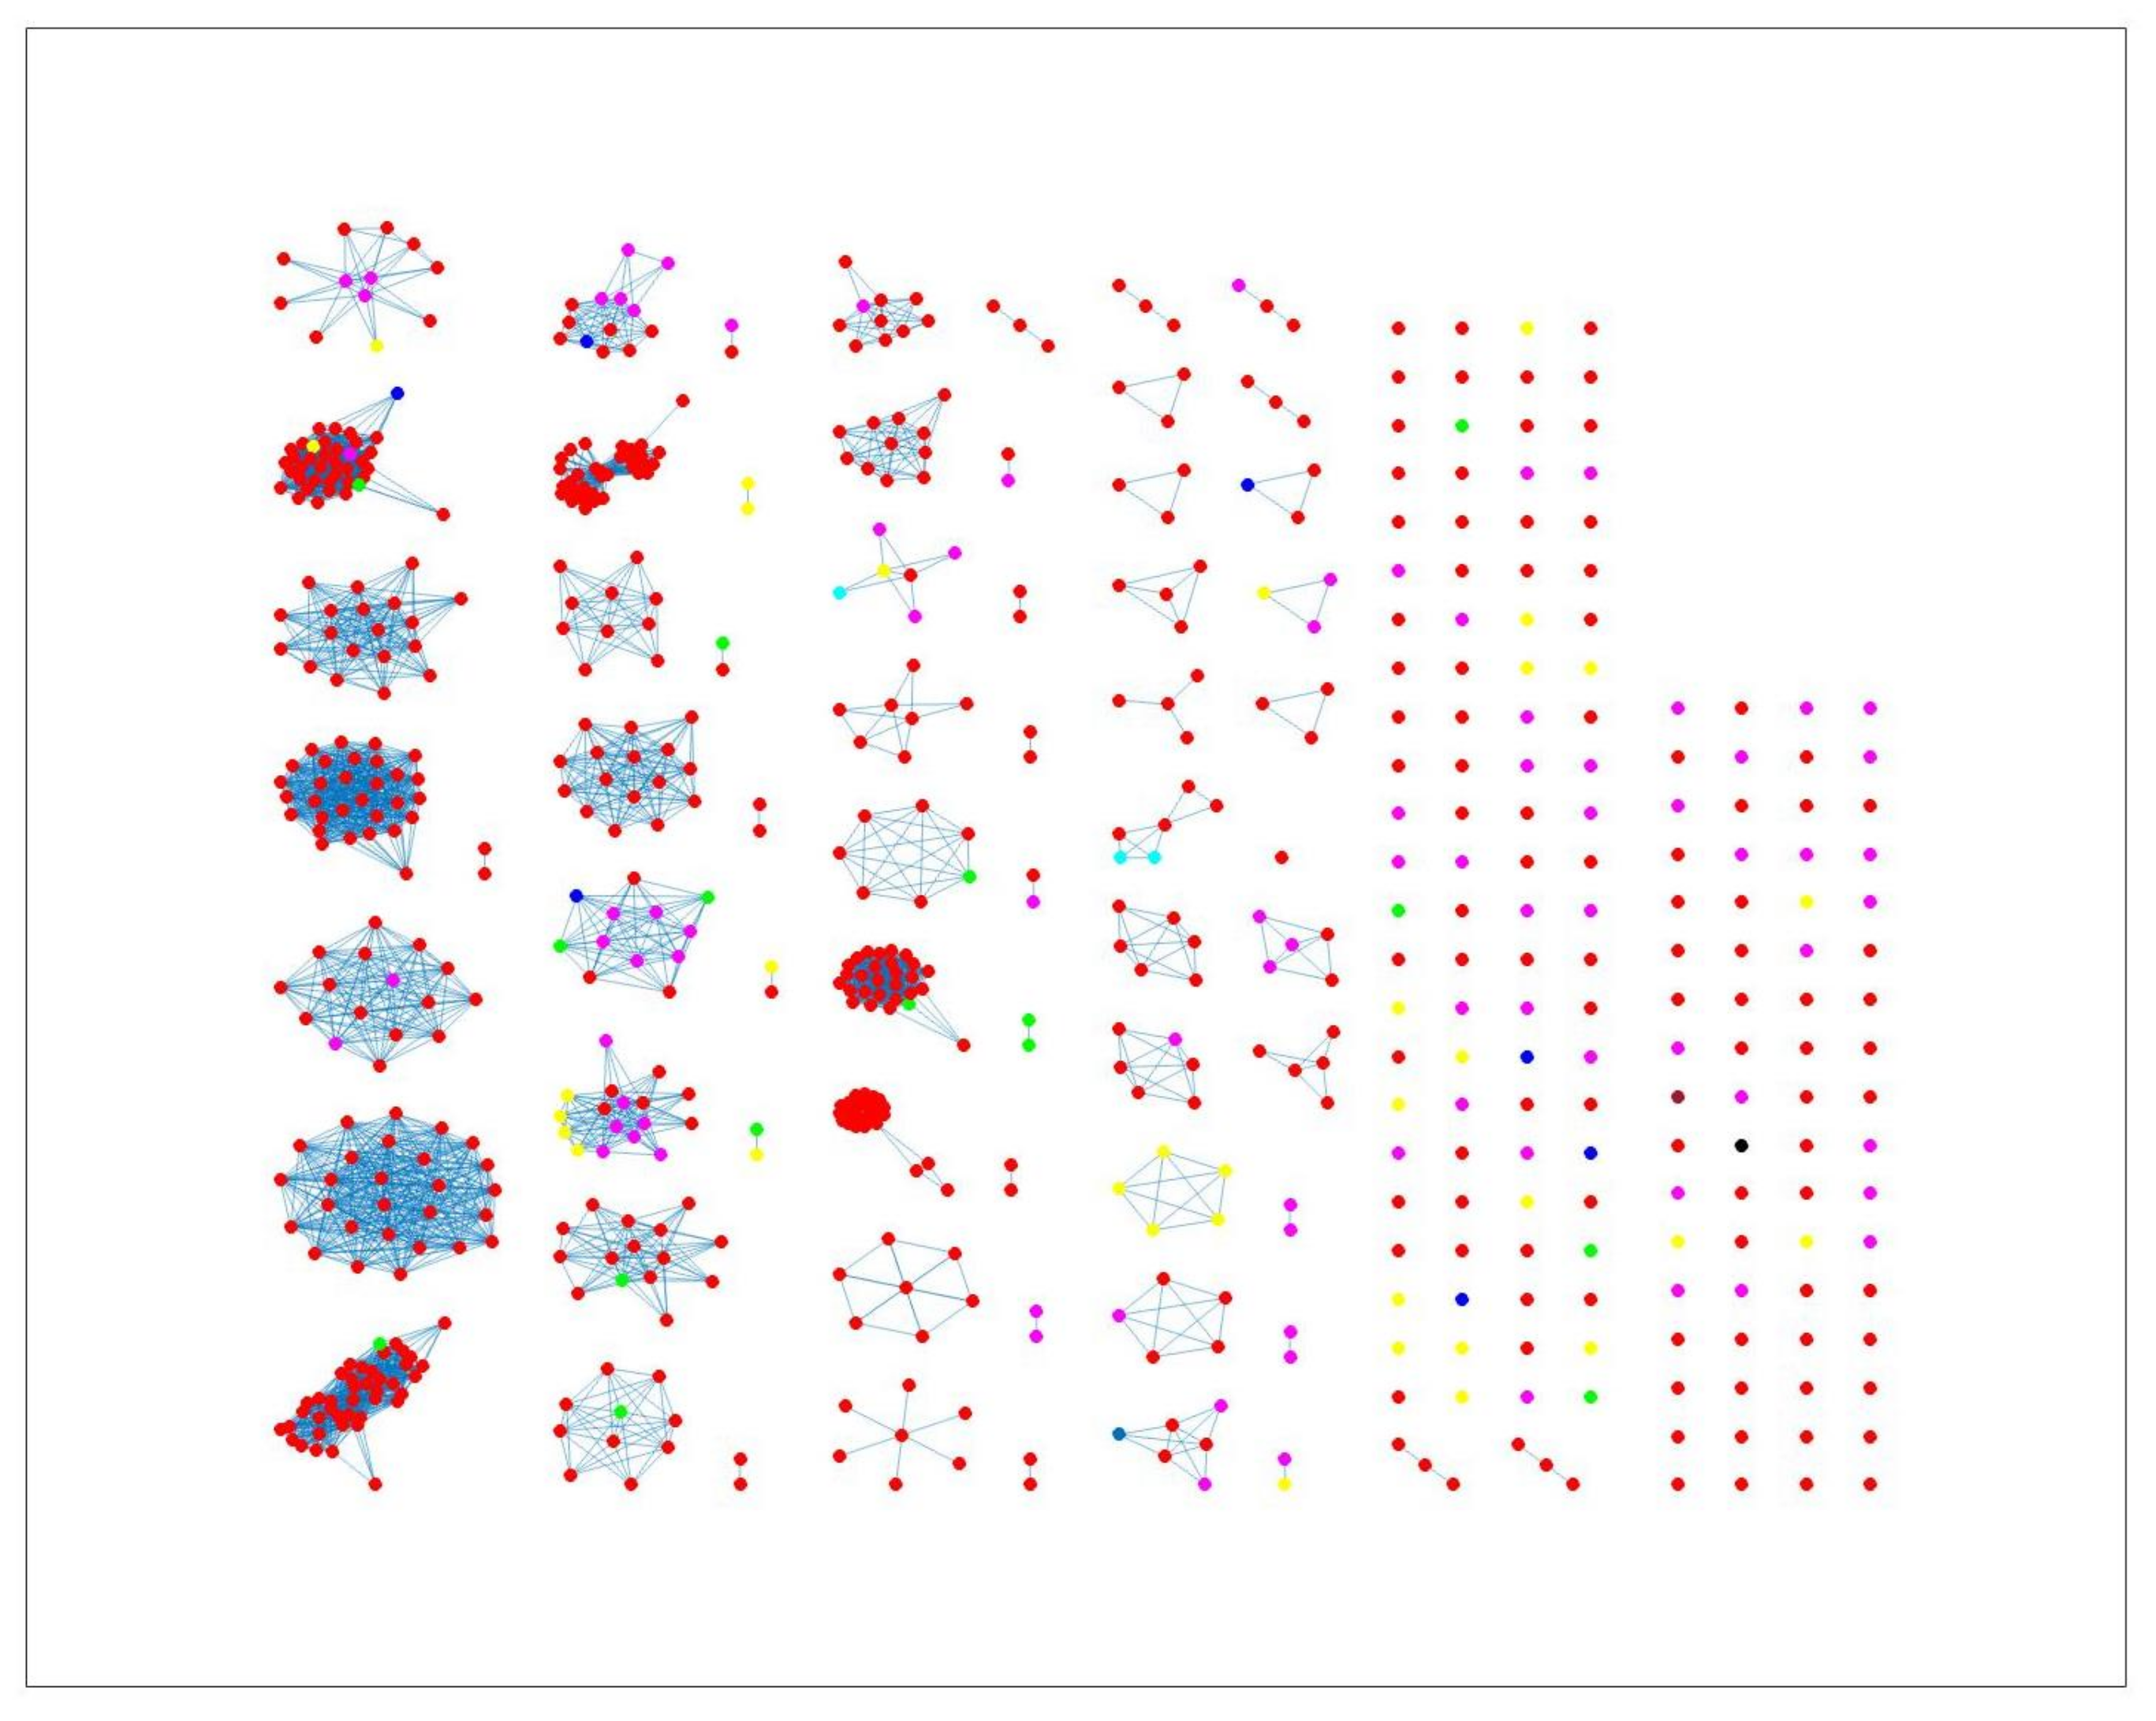
Figure 4, where different sources in the main clusters 1, 4 and 5 from network analysis using cgMLST distance matrix as input data cannot be clearly distinguished. A consideration of the country of origin of animal sources showed that regionality affects cluster formation, as seen in
Figure 5,
Figure 6 and
Figure 7, where most isolates are clustered according to origin.
We noted that despite the class imbalance in the input data (
Figure 2), the less abundant sources, such as dogs from Denmark, still had
human isolates linked to the sources, as shown in
Figure 4,
Figure 8 and
Figure 9. This is an indication that sample imbalance does not affect source attribution using the network analysis method [
4] and that the most consumed animal sources are most likely to cause the majority of
Campylobacter infections. Class imbalances in other models lead to important patterns in the predictors being associated with the larger classes which results in less predictions for classes with less samples [
40]. The best-performing model was the one with the wgMLST distance matrix as the input data, which had a CSC value of
. We calculated the confusion matrix for the cgMLST, wgMLST and SNP distance matrices’ clustering results (
Table 4,
Table 5 and
Table 6). The weighted network analysis approach provided quite good results considering the model performance in comparison to other source attribution models [
13,
18,
19,
20] and microbial infection severity and outcome prediction models such as machine learning [
21,
22,
23,
24,
25].
The F1 scores calculated from the confusion matrices above were: , and for cgMLST, wgMLST and SNP, respectively. The best-performing model from the F1 score was based on wgMLST distance matrix as input data which is also in agreement to the model’s high CSC value of .
Similar clustering results were observed from the network analysis approach as observed above.
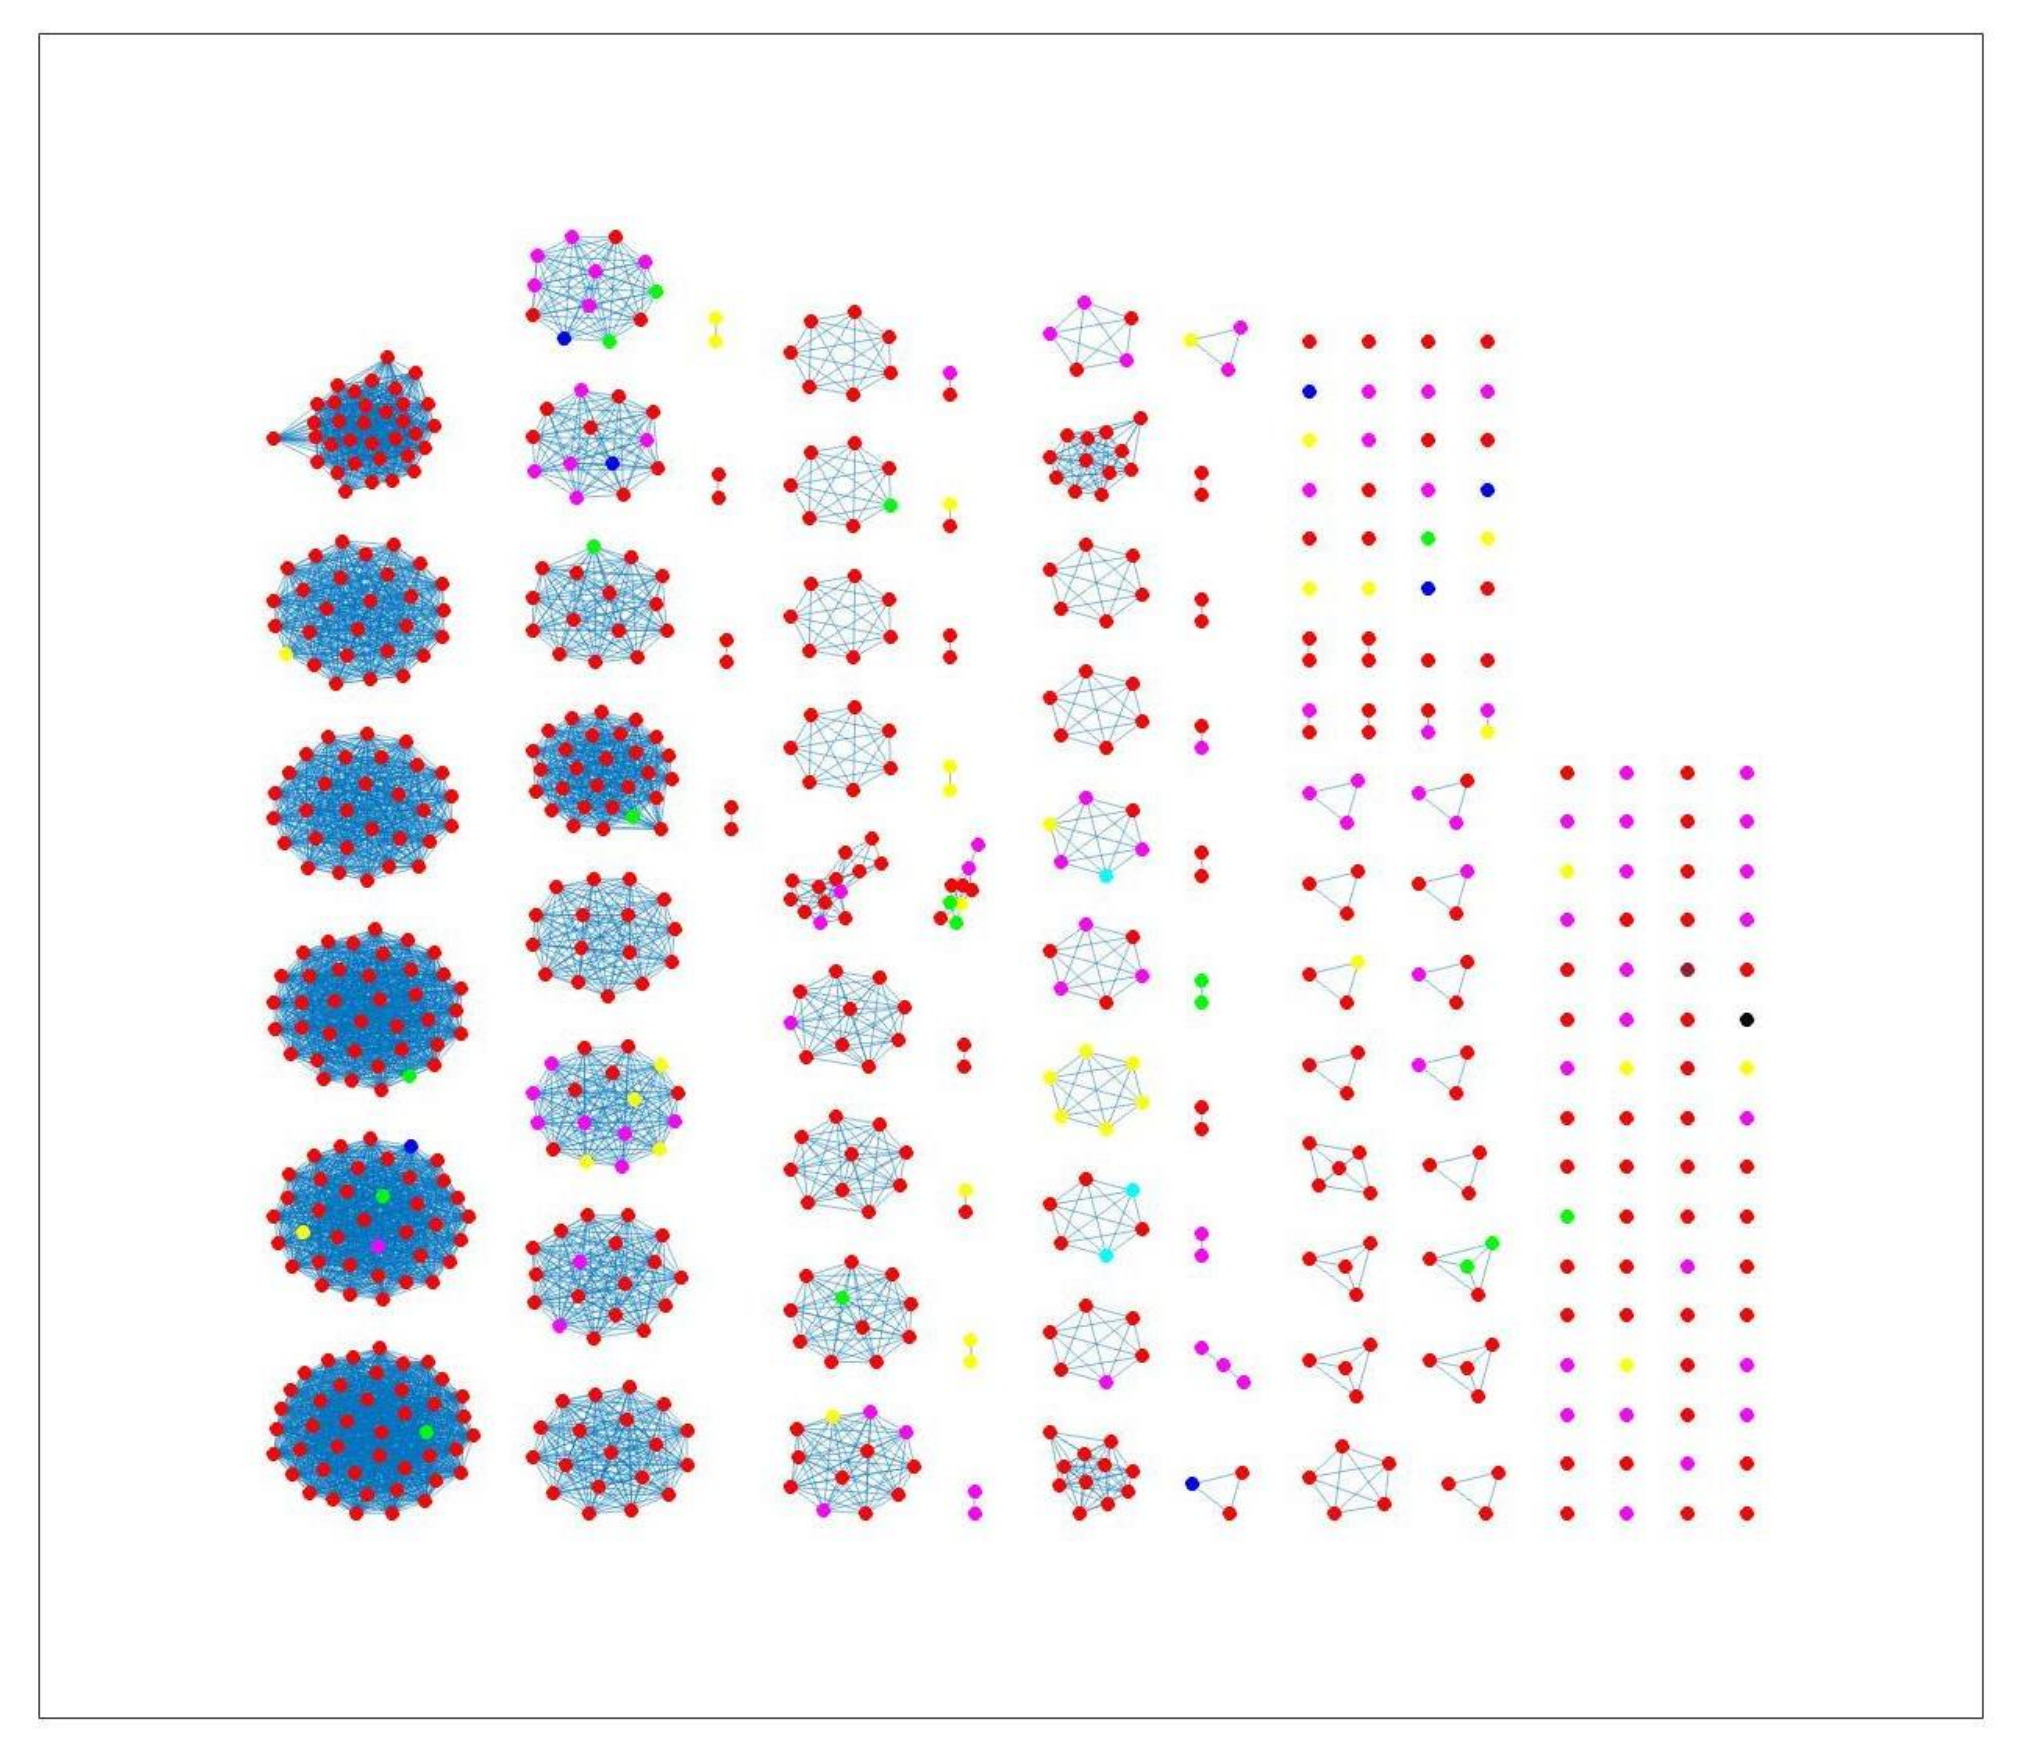
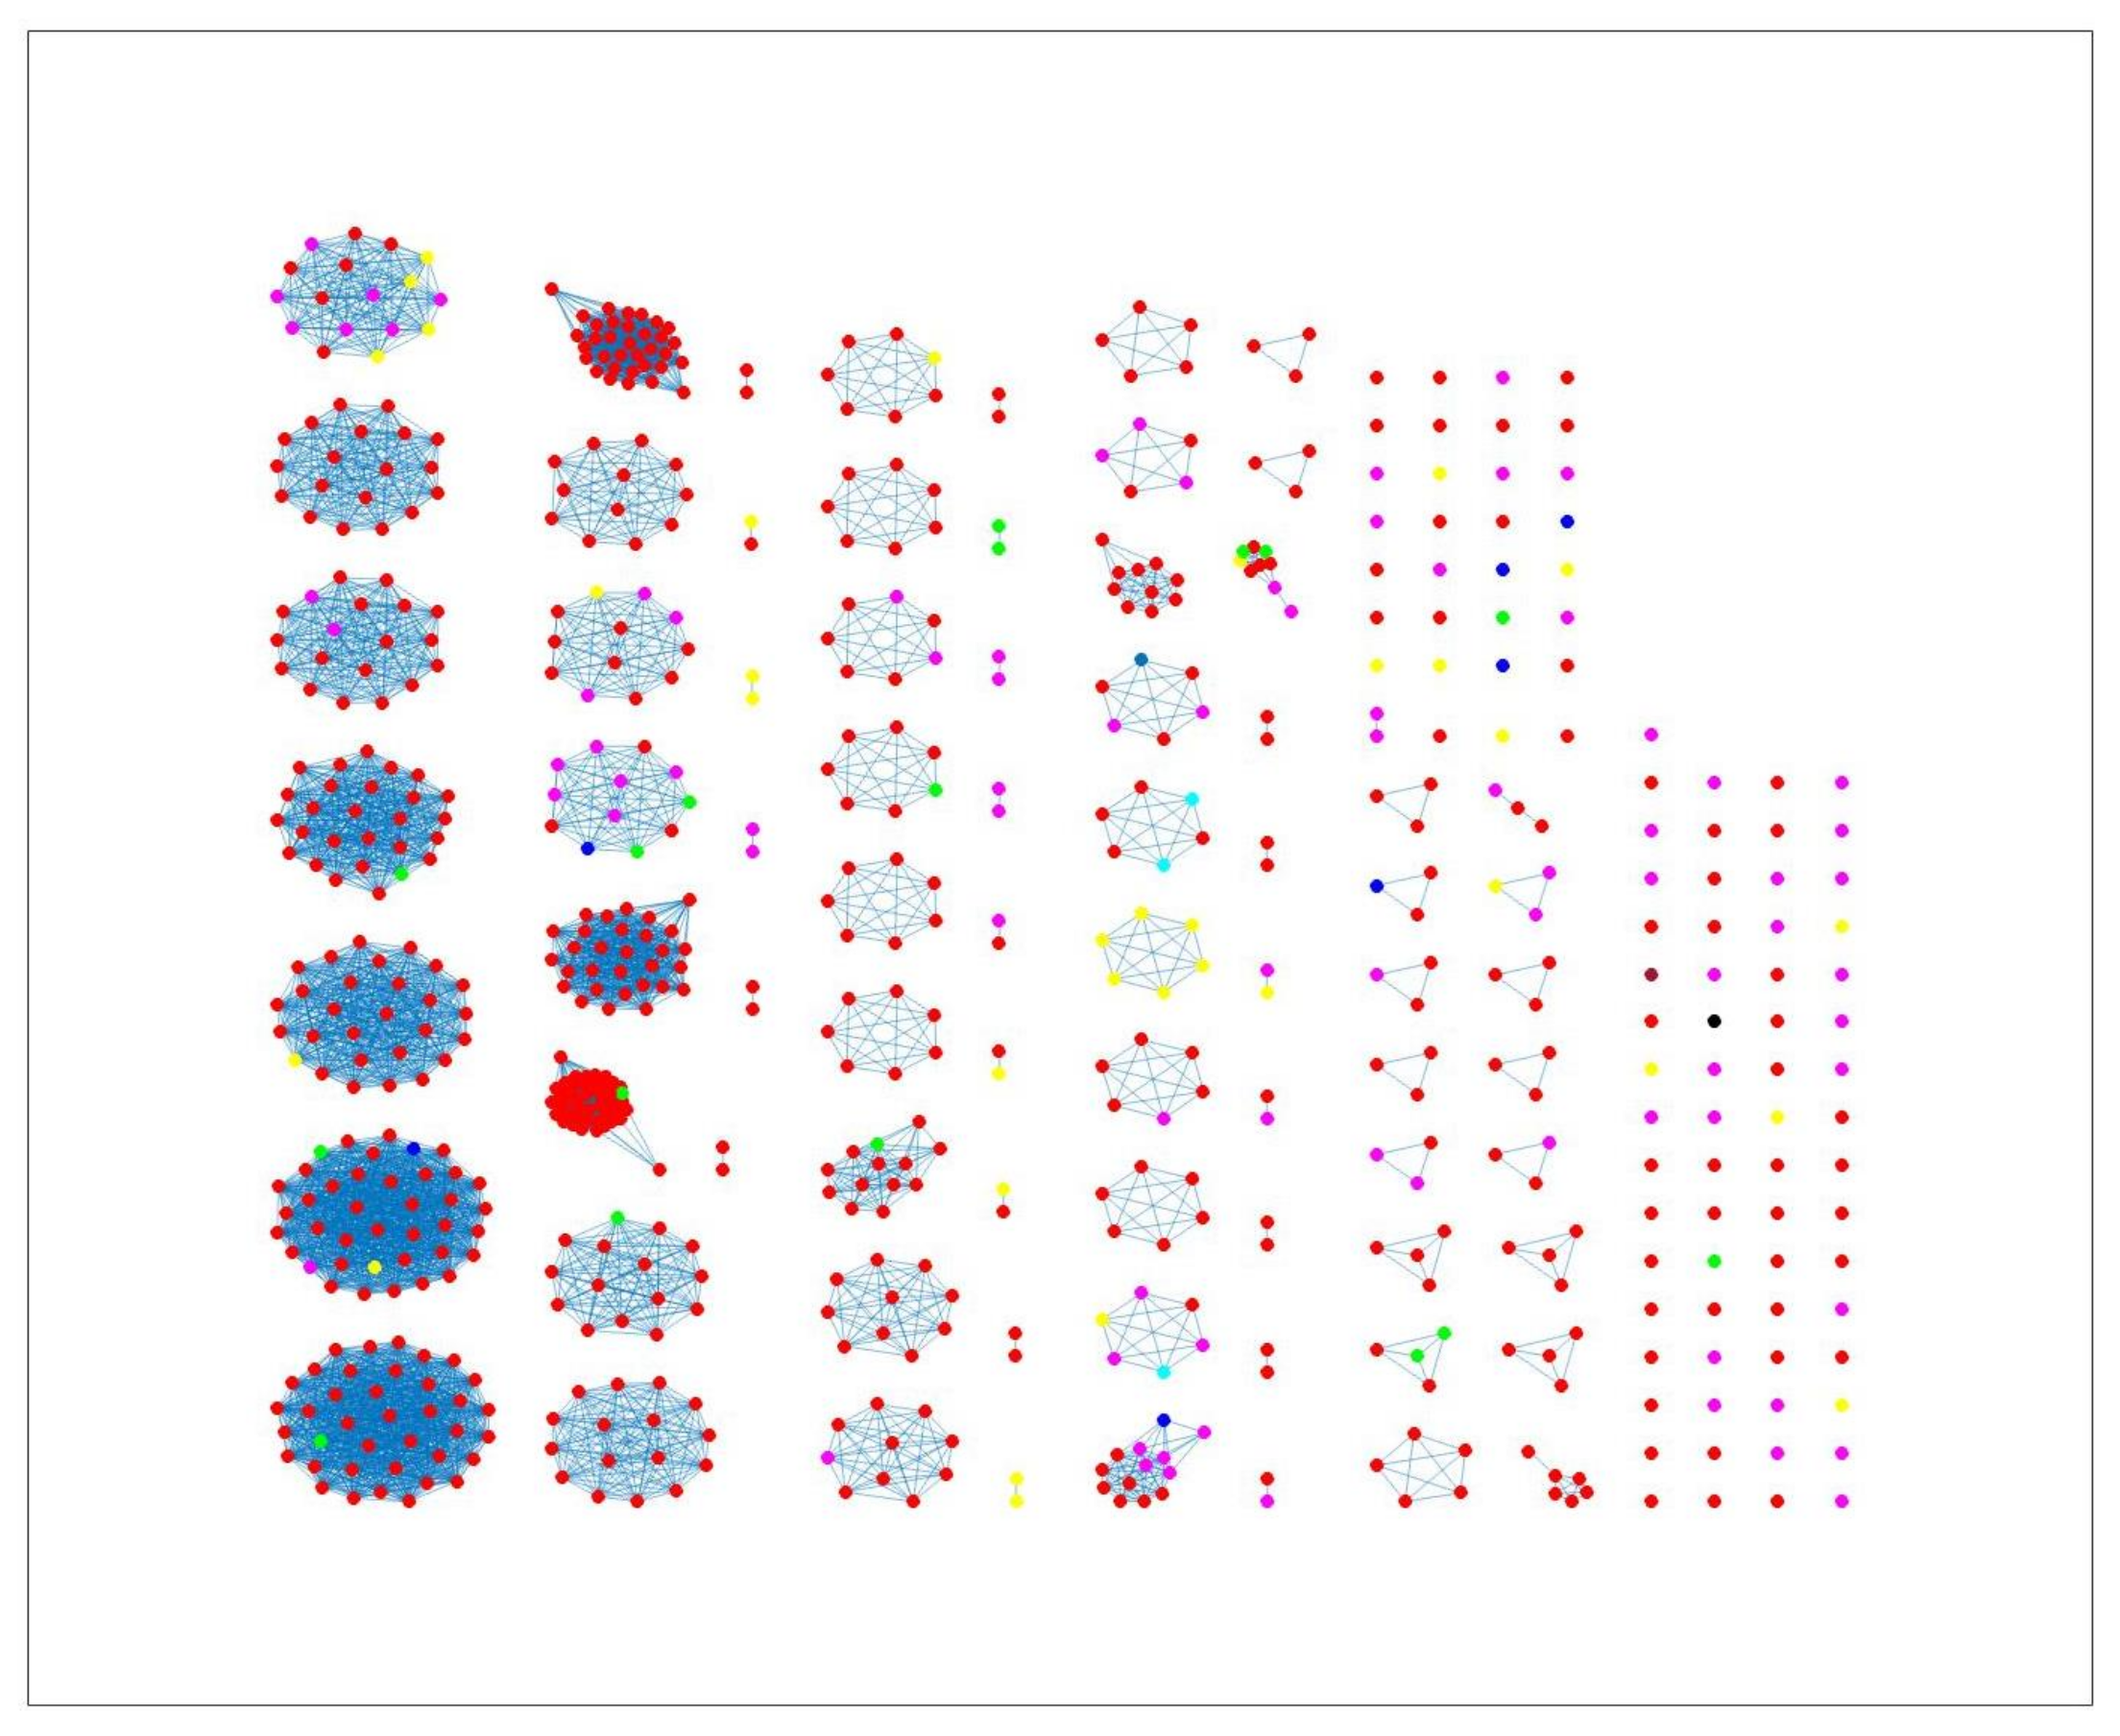
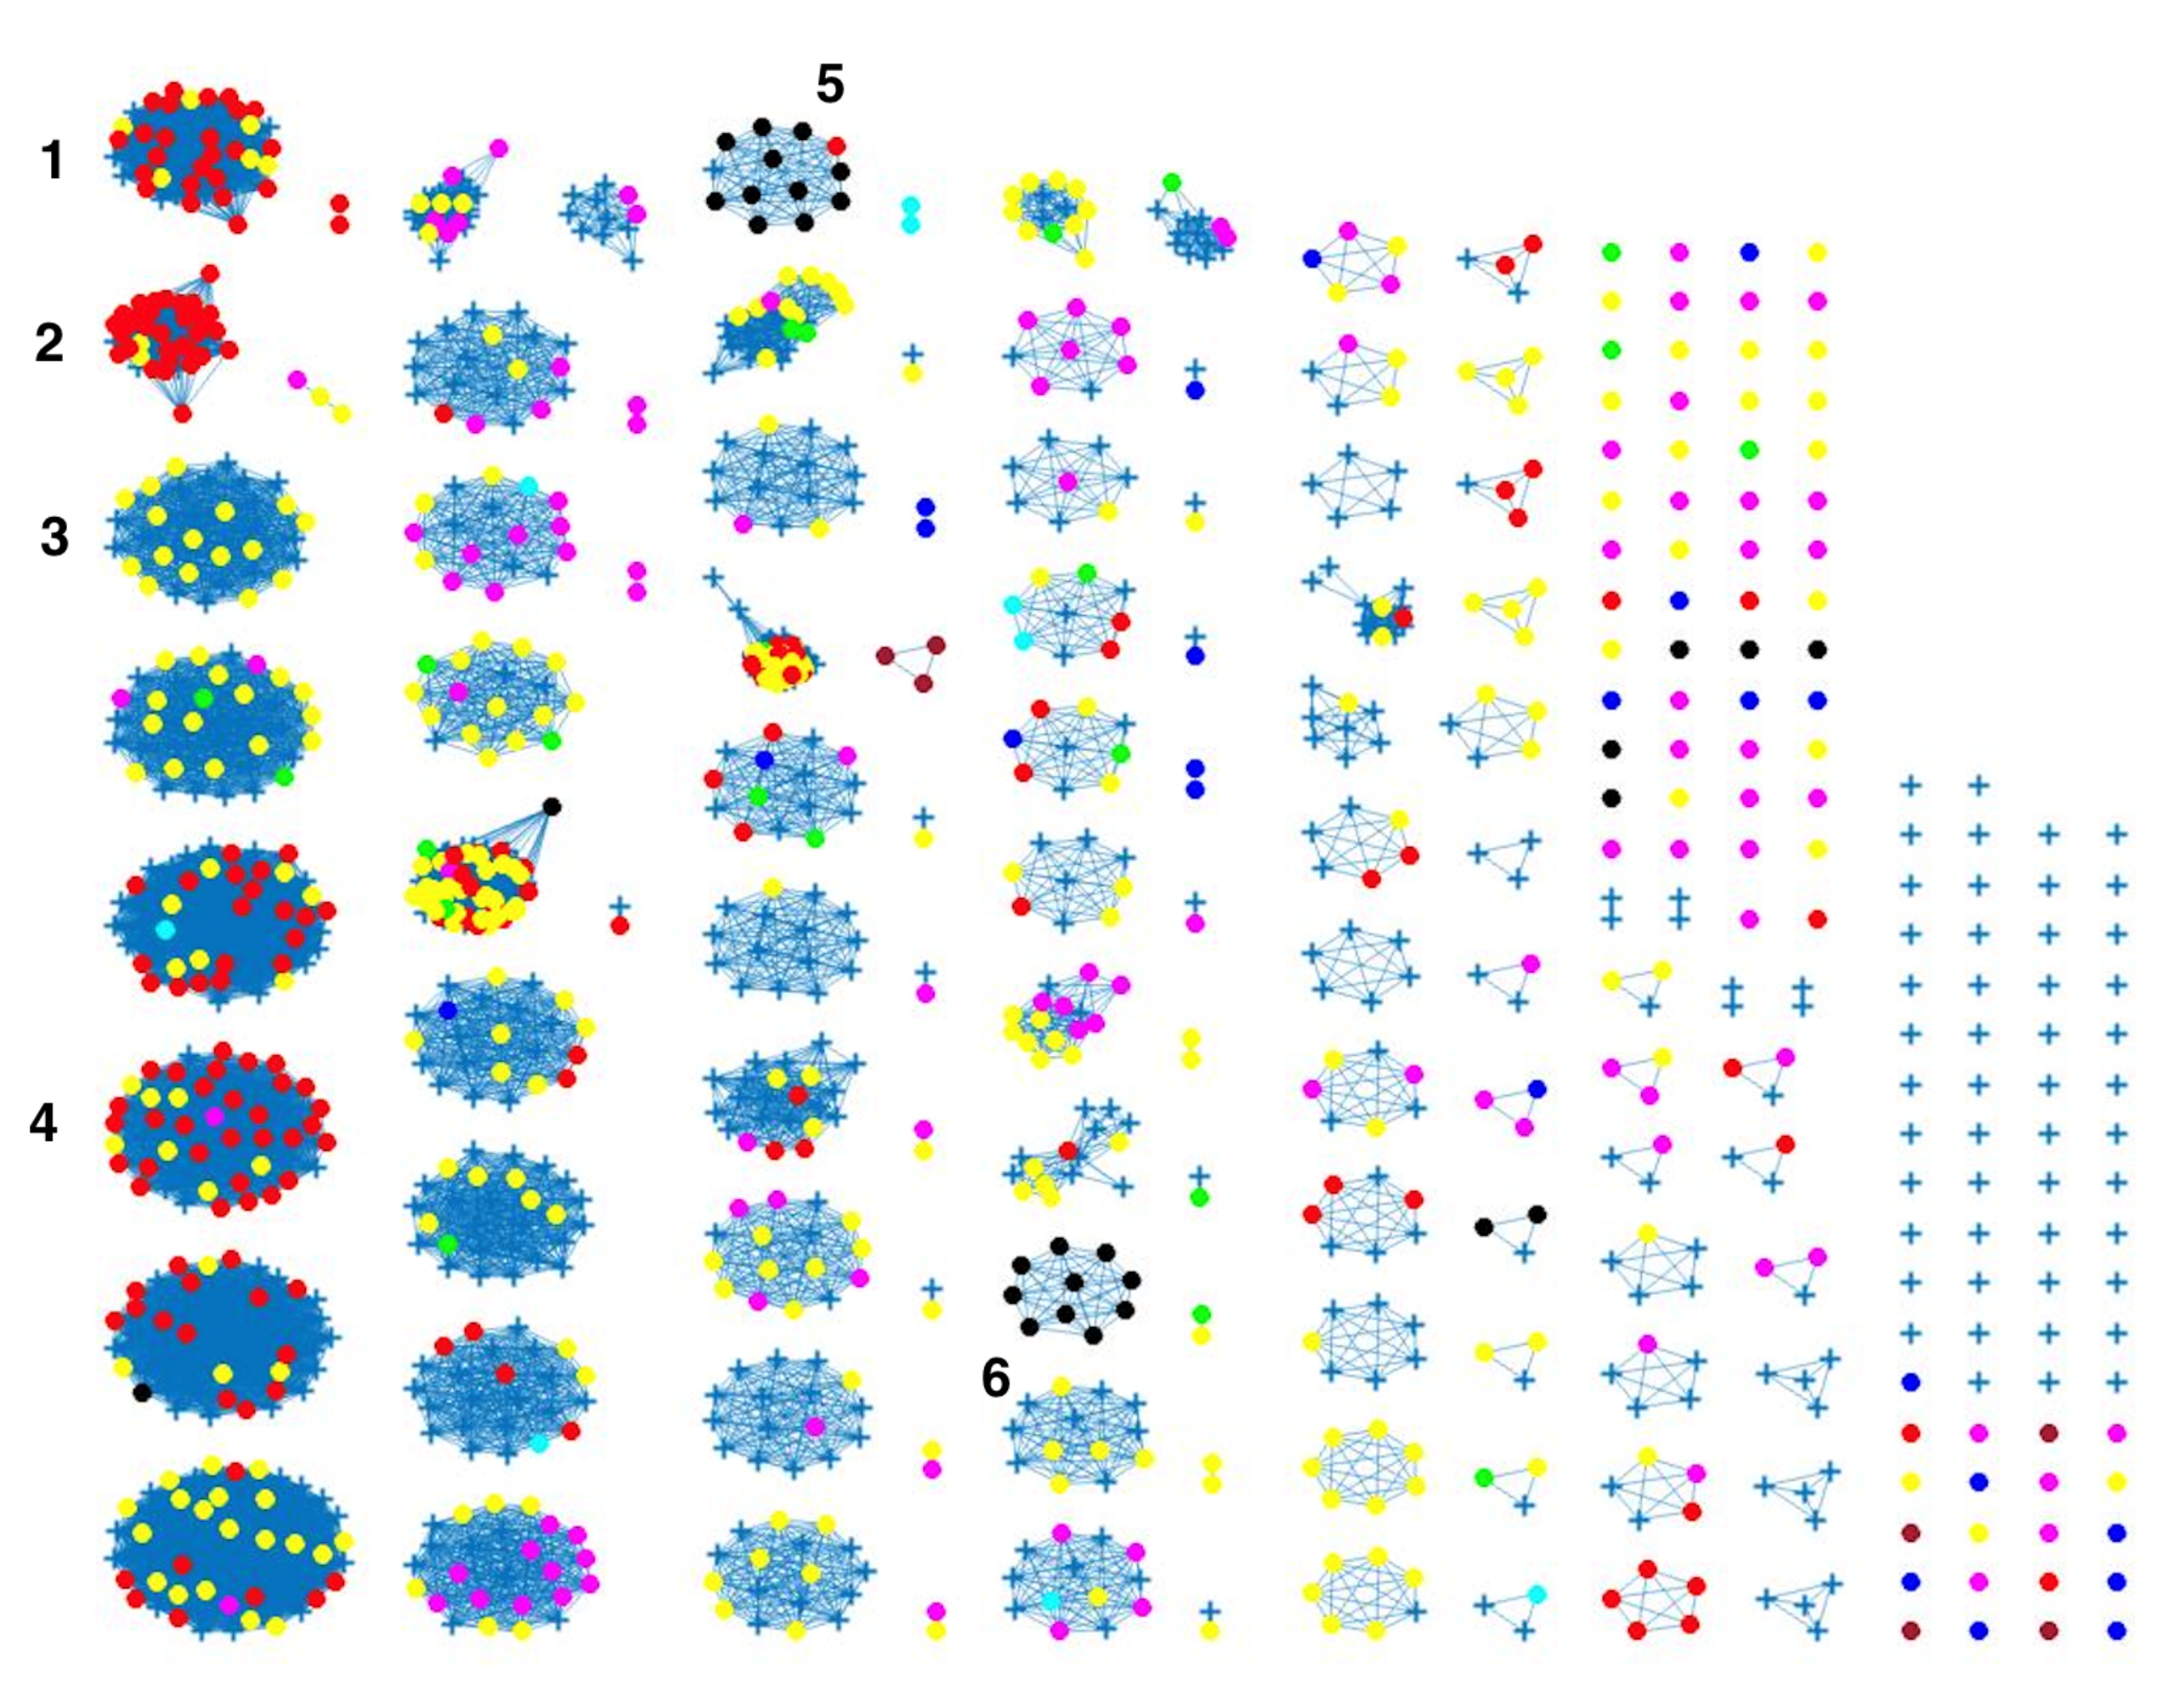
Figure 8 indicates some confusion in distinguishing between different sources. For example, in cluster 2, there is no proper separation between chickens and cattle from Denmark, which is also observed in
Figure 9 (clusters 1, 2, 4). However, a high proportion of the food sources where less isolates were available such as pigs, were attributed to human cases as observed in cluster 6 in
Figure 8. The results from the wgMLST distance matrix input data show that the network-based algorithm performs best in clustering considering the high CSC value of
. The results in
Figure 6 and
Figure 7 show that the region of origin of the animal sources has an influence on cluster formation. Considering that most of the animal isolates are from Denmark, the main clusters are dominated by Danish isolates, with some clusters consisting of less abundant isolates such as imports from Poland, as observed in
Figure 5,
Figure 6 and
Figure 7.
The weighted network-based approach showed high specificity due to the number of links between each human sample and each animal source in all three networks (cgMLST, wgMLST and SNP), as observed in
Figure 10,
Figure 11 and
Figure 12. We also observed
attribution of some human samples to less abundant sources, such as dogs from Denmark (
Figure 10,
Figure 11 and
Figure 12), an indication that the algorithm used was not influenced by the sample size. Results from the network analysis comparing the three distance matrices as inputs suggested that the model is robust to the changes in the form of WGS used as model input (
Figure 4,
Figure 8,
Figure 9 and
Table 4,
Table 5 and
Table 6). In addition, since there was a class imbalance between isolates from Denmark and imported isolates, the finding that country of origin influenced cluster formation in this analysis should be further investigated using isolates from different countries or regions.


 ,
, 


