Abstract
Mosquitoes (Culicidae) are ubiquitous flying insects that function as vectors for several viruses that cause disease in humans. Mosquito abundance and diversity are influenced by landscape features and environmental factors such as temperature and precipitation and vary across seasons and years. The range and phenology of many mosquito species that vector viruses relevant to human health are changing. We sampled mosquito communities in central Oklahoma for four years at thirteen sites, collecting over 25,000 mosquitoes; among these, we identified 27 different species, including several that transmit human pathogens and were collected in suburban backyards. Community composition differed across the landscape and changed from early season to late season and year to year. This effort to describe mosquito communities in Oklahoma is a first step toward assessing and predicting arbovirus risk, an ongoing and dynamic public health challenge.
Keywords:
Aedes; CDC light trap; community composition; Culex; mosquito; Oklahoma; surveillance; vectors 1. Introduction
Vector-borne diseases are a major burden for public health in the United States, and the number of cases of mosquito-borne diseases in humans has increased an order of magnitude in the past 15 years [1]. For example, a range expansion of Aedes mosquitoes, specifically Aedes aegypti and Aedes albopictus from Africa and southeast Asia, respectively, to North America has dramatically changed the landscape for arboviral risk in the United States. [2]. These Aedes mosquitoes account for the recently reported intermittent outbreaks and autochthonous transmission of imported Zika, dengue, and chikungunya viruses in the continental United States and associated territories [3]. These events underscore the need to describe patterns of diversity and abundance of mosquito communities in order to understand arboviral risk associated with particular vector species in a region. For example, a West Nile Virus (WNV) outbreak in Oklahoma in 2003 was driven primarily by Culex tarsalis, while subsequent outbreaks in 2007 and 2012 were driven by the Culex quinquefasciatus/pipiens complex. Because these mosquito species have different habitat and host preferences, the spatial distribution of the WNV outbreaks in Oklahoma varied [4].
Environmental conditions and ecology influence mosquito abundance, species richness, and arboviral risk [5,6,7,8]. Changes in mosquito species dominance driven by changes in environmental conditions can result in different vectors becoming prominent [8,9]. Currently, there are 64 mosquito species that have been reported in Oklahoma [10], distributed across diverse ecoregions of the state in unique assemblages that vary greatly across the landscape [11]. Mosquito population surveillance provides data to support timely and effective control efforts and to reduce the risk of mosquito-borne diseases [12]. In addition, because Oklahoma is in the central flyway for migratory birds, many of which can serve as reservoir hosts for WNV, it is a key location for WNV surveillance efforts [13]. In this study, we describe the mosquito abundance and community composition for four years in four counties that collectively span the Oklahoma City metropolitan area.
2. Results
2.1. Main Mosquito Species
Over the course of four years, 550 trapping events at 13 sites in our four-county Oklahoma sampling area (Table S1) resulted in the collection of 25,656 mosquitoes representing 6 genera and 27 species (Figure 1, Table 1 and Table 2). The mosquito community was dominated by Aedes (62%) and Culex (30%) species mosquitoes but also included significant numbers of Psorophora (5%) and Anopheles (3%) species mosquitoes (full species list in Table 1). Ae. vexans, a competent vector of West Nile Virus (WNV) and the filarial nematode Dirofilaria immitis that causes heartworm disease in dogs [14,15], accounted for 55% of all mosquitoes collected. The second most abundant species was the Cx. pipiens complex (23.5%), a known vector of viruses including western equine encephalitis and WNV. Cx. tarsalis, another important vector of WNV, contributed an additional 3.7% of mosquitoes in our samples. Mosquito species identification based on COI sequences confirmed the morphological identification for all the mosquitoes of Aedes genus and resolved taxonomic conflicts between species of the Culex genus, Cx. pipiens and Cx. salinarius. Similarly, Coquillettidia pertubans identification was based on best close match of query in the Barcode of Life data base (BOLD, boldsystems.org).
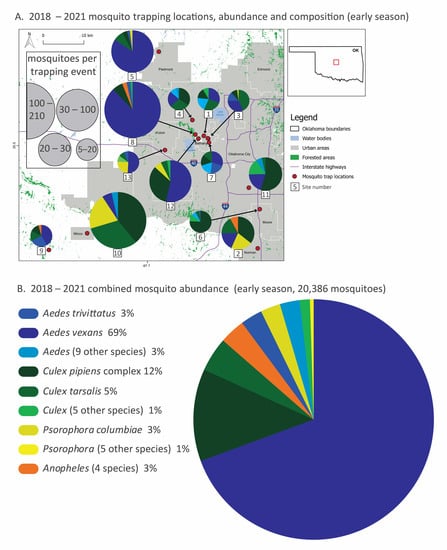
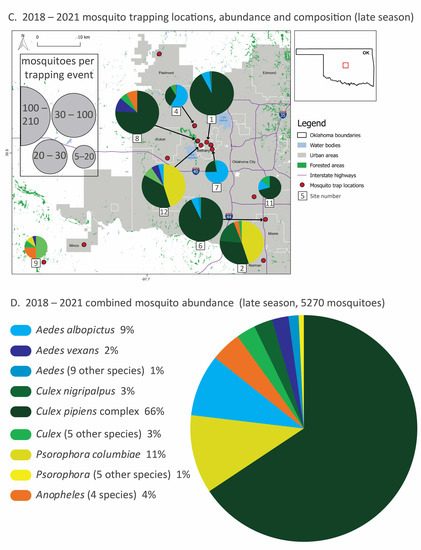
Figure 1.
Mosquito species composition, abundance and trapping locations (2018–2021) divided into early (May–June, (A,B)) and late (July–November, (C,D)) season sampling. In panels (A,C), thirteen trapping sites in the greater Oklahoma City metro area, the red box in the Oklahoma state outline, are marked with red dots, and the mosquito relative abundance and species composition of each site are represented with pie graphs. Mosquito collection totals, scaled by collection effort, are represented by the size of the pie graphs and slices represent the proportion of the top-five species at each site. Local municipalities, reservoirs and highways are noted. In panels (B,D), combined mosquito abundance (total 25,656: about 20,000 from early season sampling and 5000 from late season sampling) from all sites and all four years are displayed by species from the most abundant to the least. Species are color-coded by genus. Species that represent less than 2% of total abundance are pooled at the genus level for clarity. All species totals and percentages are listed in Table 1, and site abundance, species richness and sampling effort are listed in Table 2. A detailed list of sites sampled in this study is provided in the Supplementary Materials (Table S1).

Table 1.
Mosquito catch numbers by species collected in the Oklahoma City metro area in 2018–2021. The table summarizes the abundance for each species by year and early/late season, as well as their percentage of total abundance by species. In addition, for each year/season combination, the number of sites sampled, number of trapping events, ratio of trap types and sampling date ranges are listed.
Table 2.
The number of unique species (richness) of mosquitoes by site, year and trapping season and mosquitoes collected (abundance) and trapping events by site and trapping season. Early trapping season (yellow shading) is defined as trapping in May and June, while late (blue shading) is any trapping later in the year (mostly July and August). In the first two years of the study, only early sampling was conducted, while late season sampling was added in the last two years. The site numbers correspond to the sites in Figure 1. Most sites are suburban backyards, while a few are more rural, and one site is a riparian forest in a wildlife refuge.
2.2. Temporal Variation in Trapping Success
The duration of sampling and trapping intensity varied between years (Table 1 and Table 2). Higher sampling intensity, as measured by the number of trapping events, resulted in higher abundance and species richness at the site scale (Table 2). We collected 7804 mosquitoes in 107 trapping events during 15 May 2018–21 June 2018, 3028 mosquitoes in 70 trapping events during 20 May 2019–25 June 2019, 3880 mosquitoes in 149 trapping events during 22 May 2020–22 September 2020 and 10,944 mosquitoes in 224 trapping events during 14 May 2021–16 November 2021.
2.3. Early- and Late-Season Mosquito Communities
Mosquito community composition varied spatially and temporally. During early-season sampling (May–June), Aedes mosquitoes were most abundant overall and dominated the composition of some sites (e.g., 5 and 7), especially site 8, which had the highest mosquito abundance (Figure 1A,B). Ae. vexans alone comprised about 70% of total early season mosquitoes. Early season communities at some sites were composed predominantly of Culex species mosquitoes (e.g., 6, 10 and 11), while other sites were more evenly split between species (e.g., 1, 3, 4 and 7). Psorophora species mosquitoes, while uncommon overall, were relatively common at some sites (e.g., 2, 10 and 13).
During late-season sampling (July–November), mosquito abundance was lower overall compared to the early season (Figure 1C,D), declining by about 75%. Culex species mosquitoes were dominant; Cx. pipiens alone comprised over half of the mosquitoes in our late season sampling, dominating some of the highest abundance sites (e.g., 1, 6 and 8). Cx. nigripalpus increased in abundance over time, replacing Cx. tarsalis in the late season. In contrast, Aedes species mosquitoes were far less prominent. When Aedes species mosquitoes were abundant at a site (e.g., comprising over half of the mosquitoes caught at sites 4 and 7), it was Ae. albopictus rather than Ae. vexans. Psorophora species mosquitoes were a larger part of the overall mosquito community in the late season, especially at sites 2 and 12. The top five species abundance for each site and season are listed on Table S2.
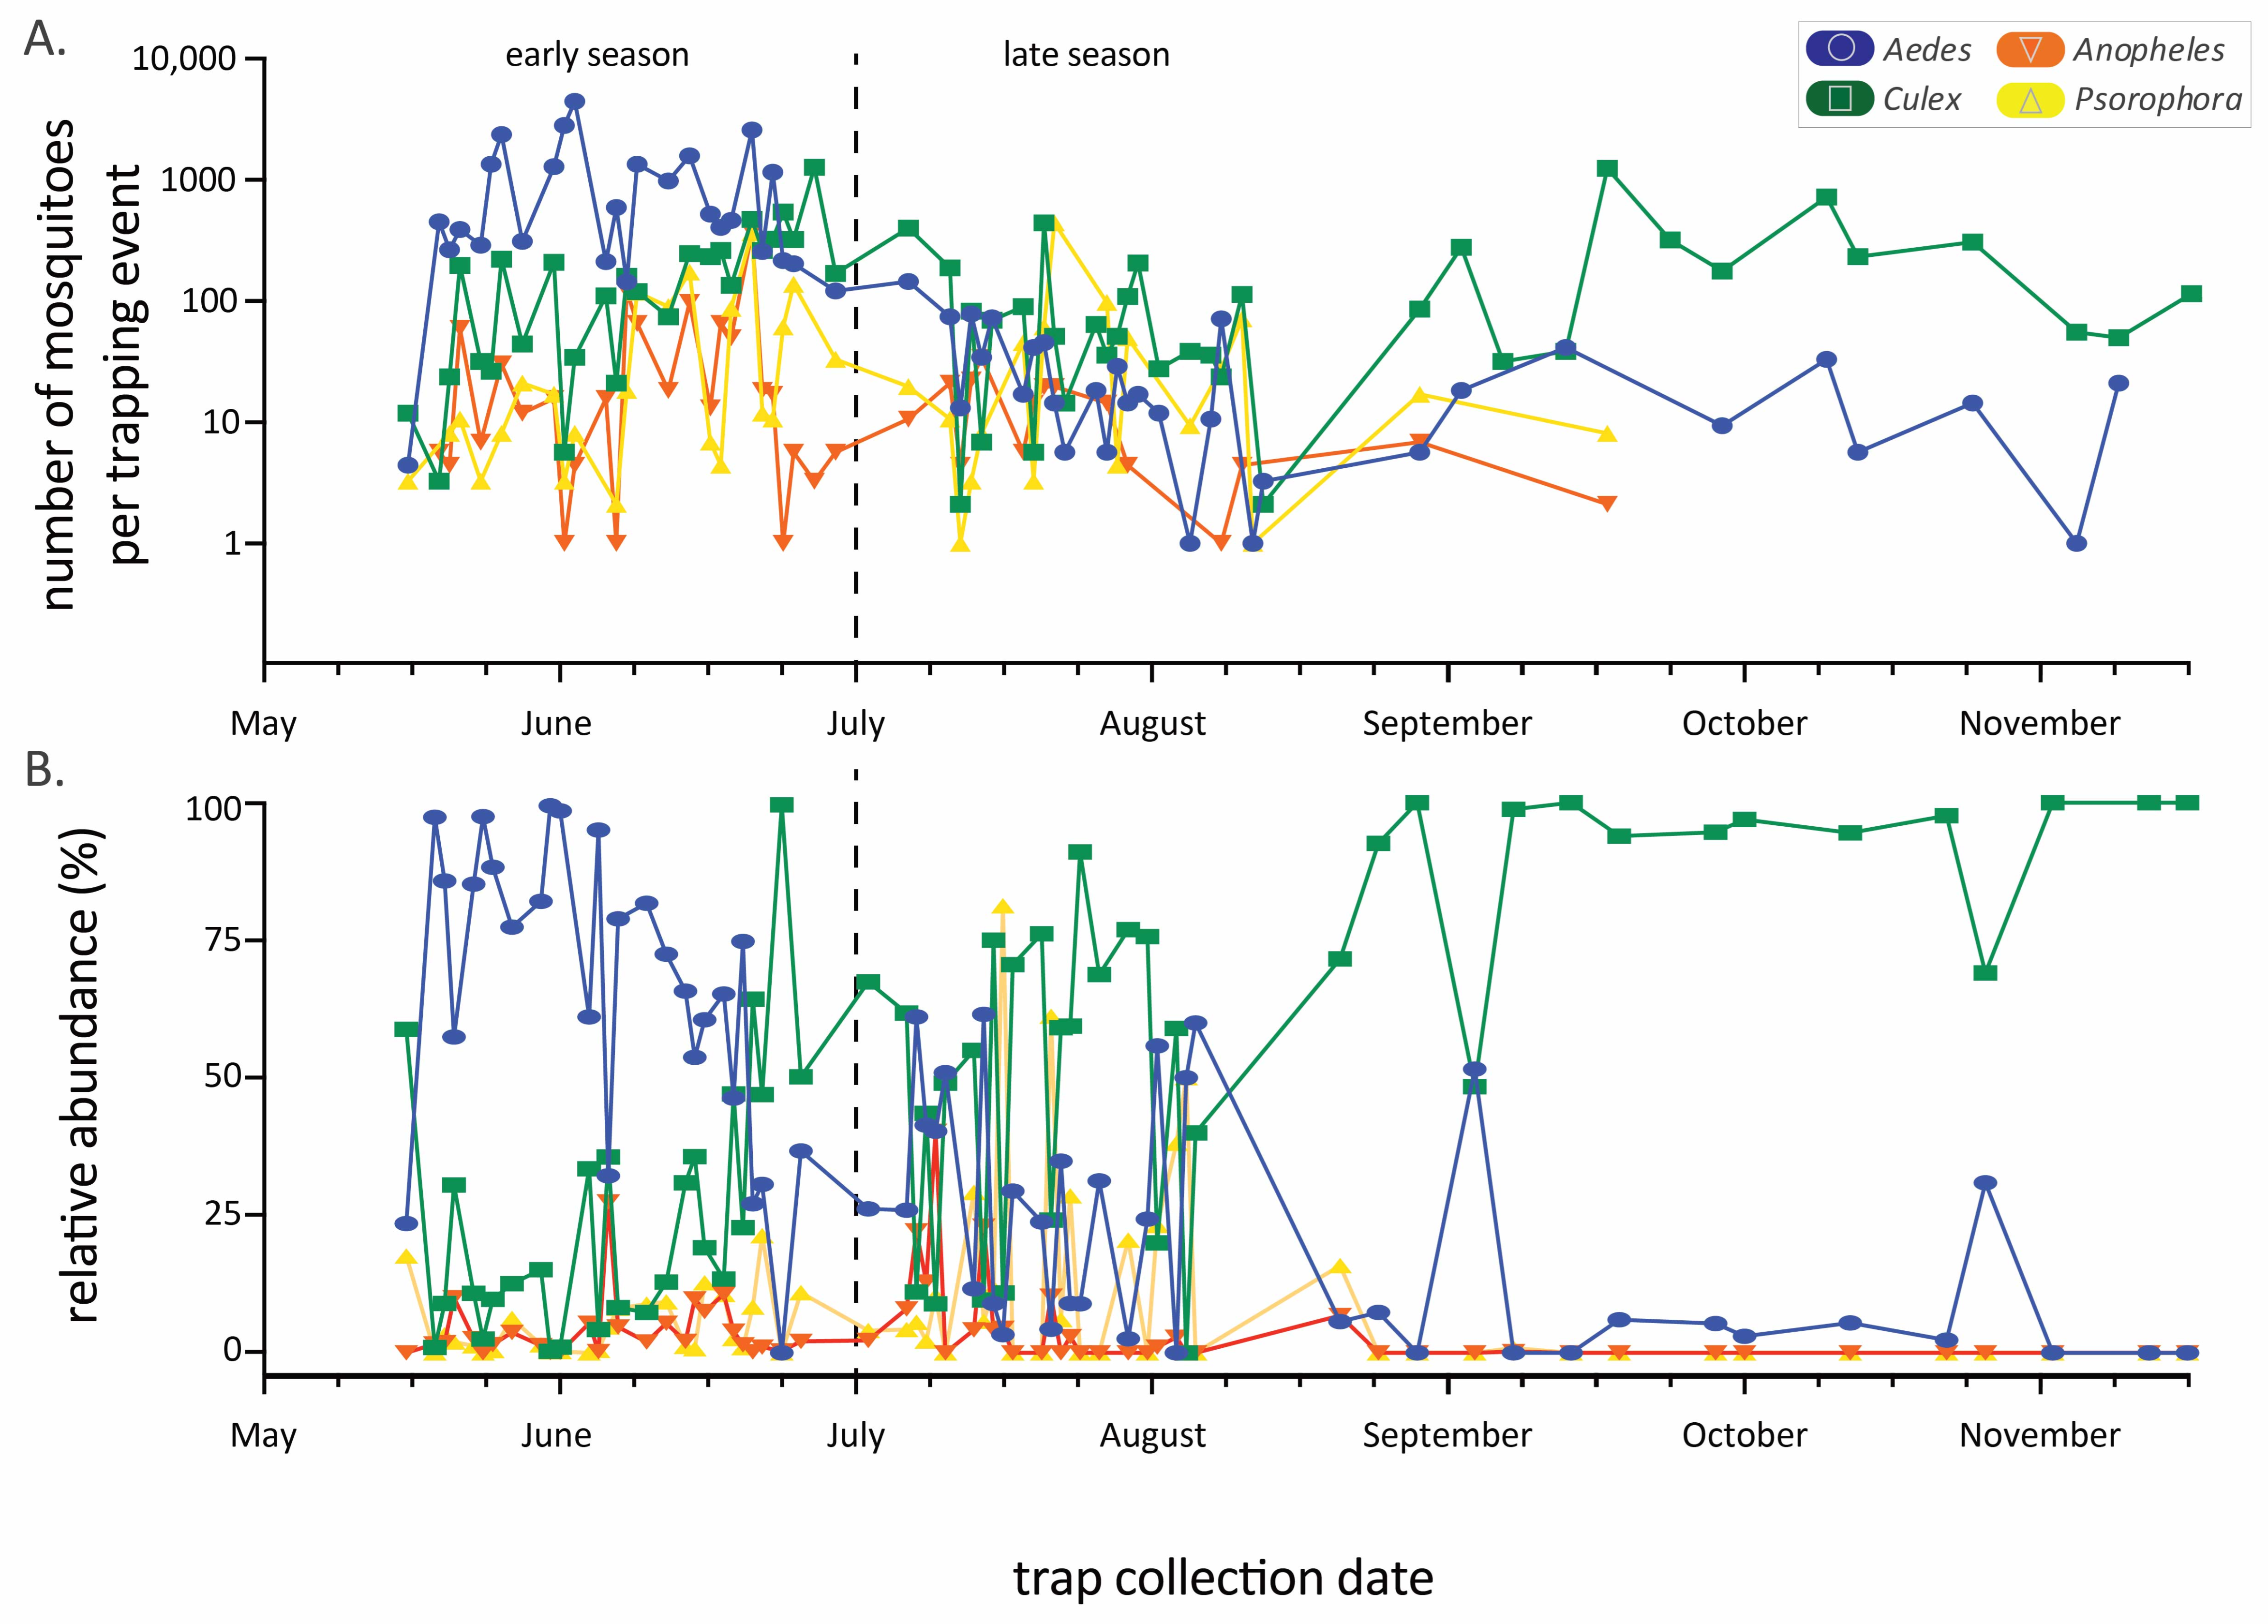
The abundance of the four main genera varied considerably throughout the annual sampling season (Figure 2), generally following a typical seasonal phenology of abundance during warmer months. Aedes species mosquitoes were most prevalent early in the season, while Culex species predominated later in the season, with a community shift occurring in July (Figure 2B). These seasonal trends in abundance and the predominance of certain genera result in changing community composition through time. Mosquito community composition also differed significantly between sampling years (using early season data, where four years can be compared, one factor ANOSIM global R = 0.47, p < 0.001, Figure 3). Specifically, comparing only 2019 and 2020, years in which we used similar numbers of each trap type (Table 1) and trapped at mostly the same sites (Table 2), the mosquito communities were statistically distinct (see Figure 3, pairwise contrast R = 0.61, p = 0.002).
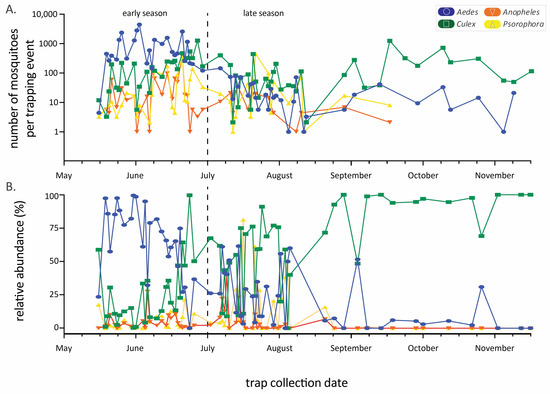
Figure 2.
Mosquito abundance by genus throughout the trapping seasons (2018–2021 data combined). Panel (A) is the raw number (logarithmic y-axis) of mosquitoes per trapping event while (B) is the relative abundance from the same dataset. Date range is from 15 May to 16 November, but the length of the sampling season varied among years. The early/late-season dividing line is drawn at 1 July.

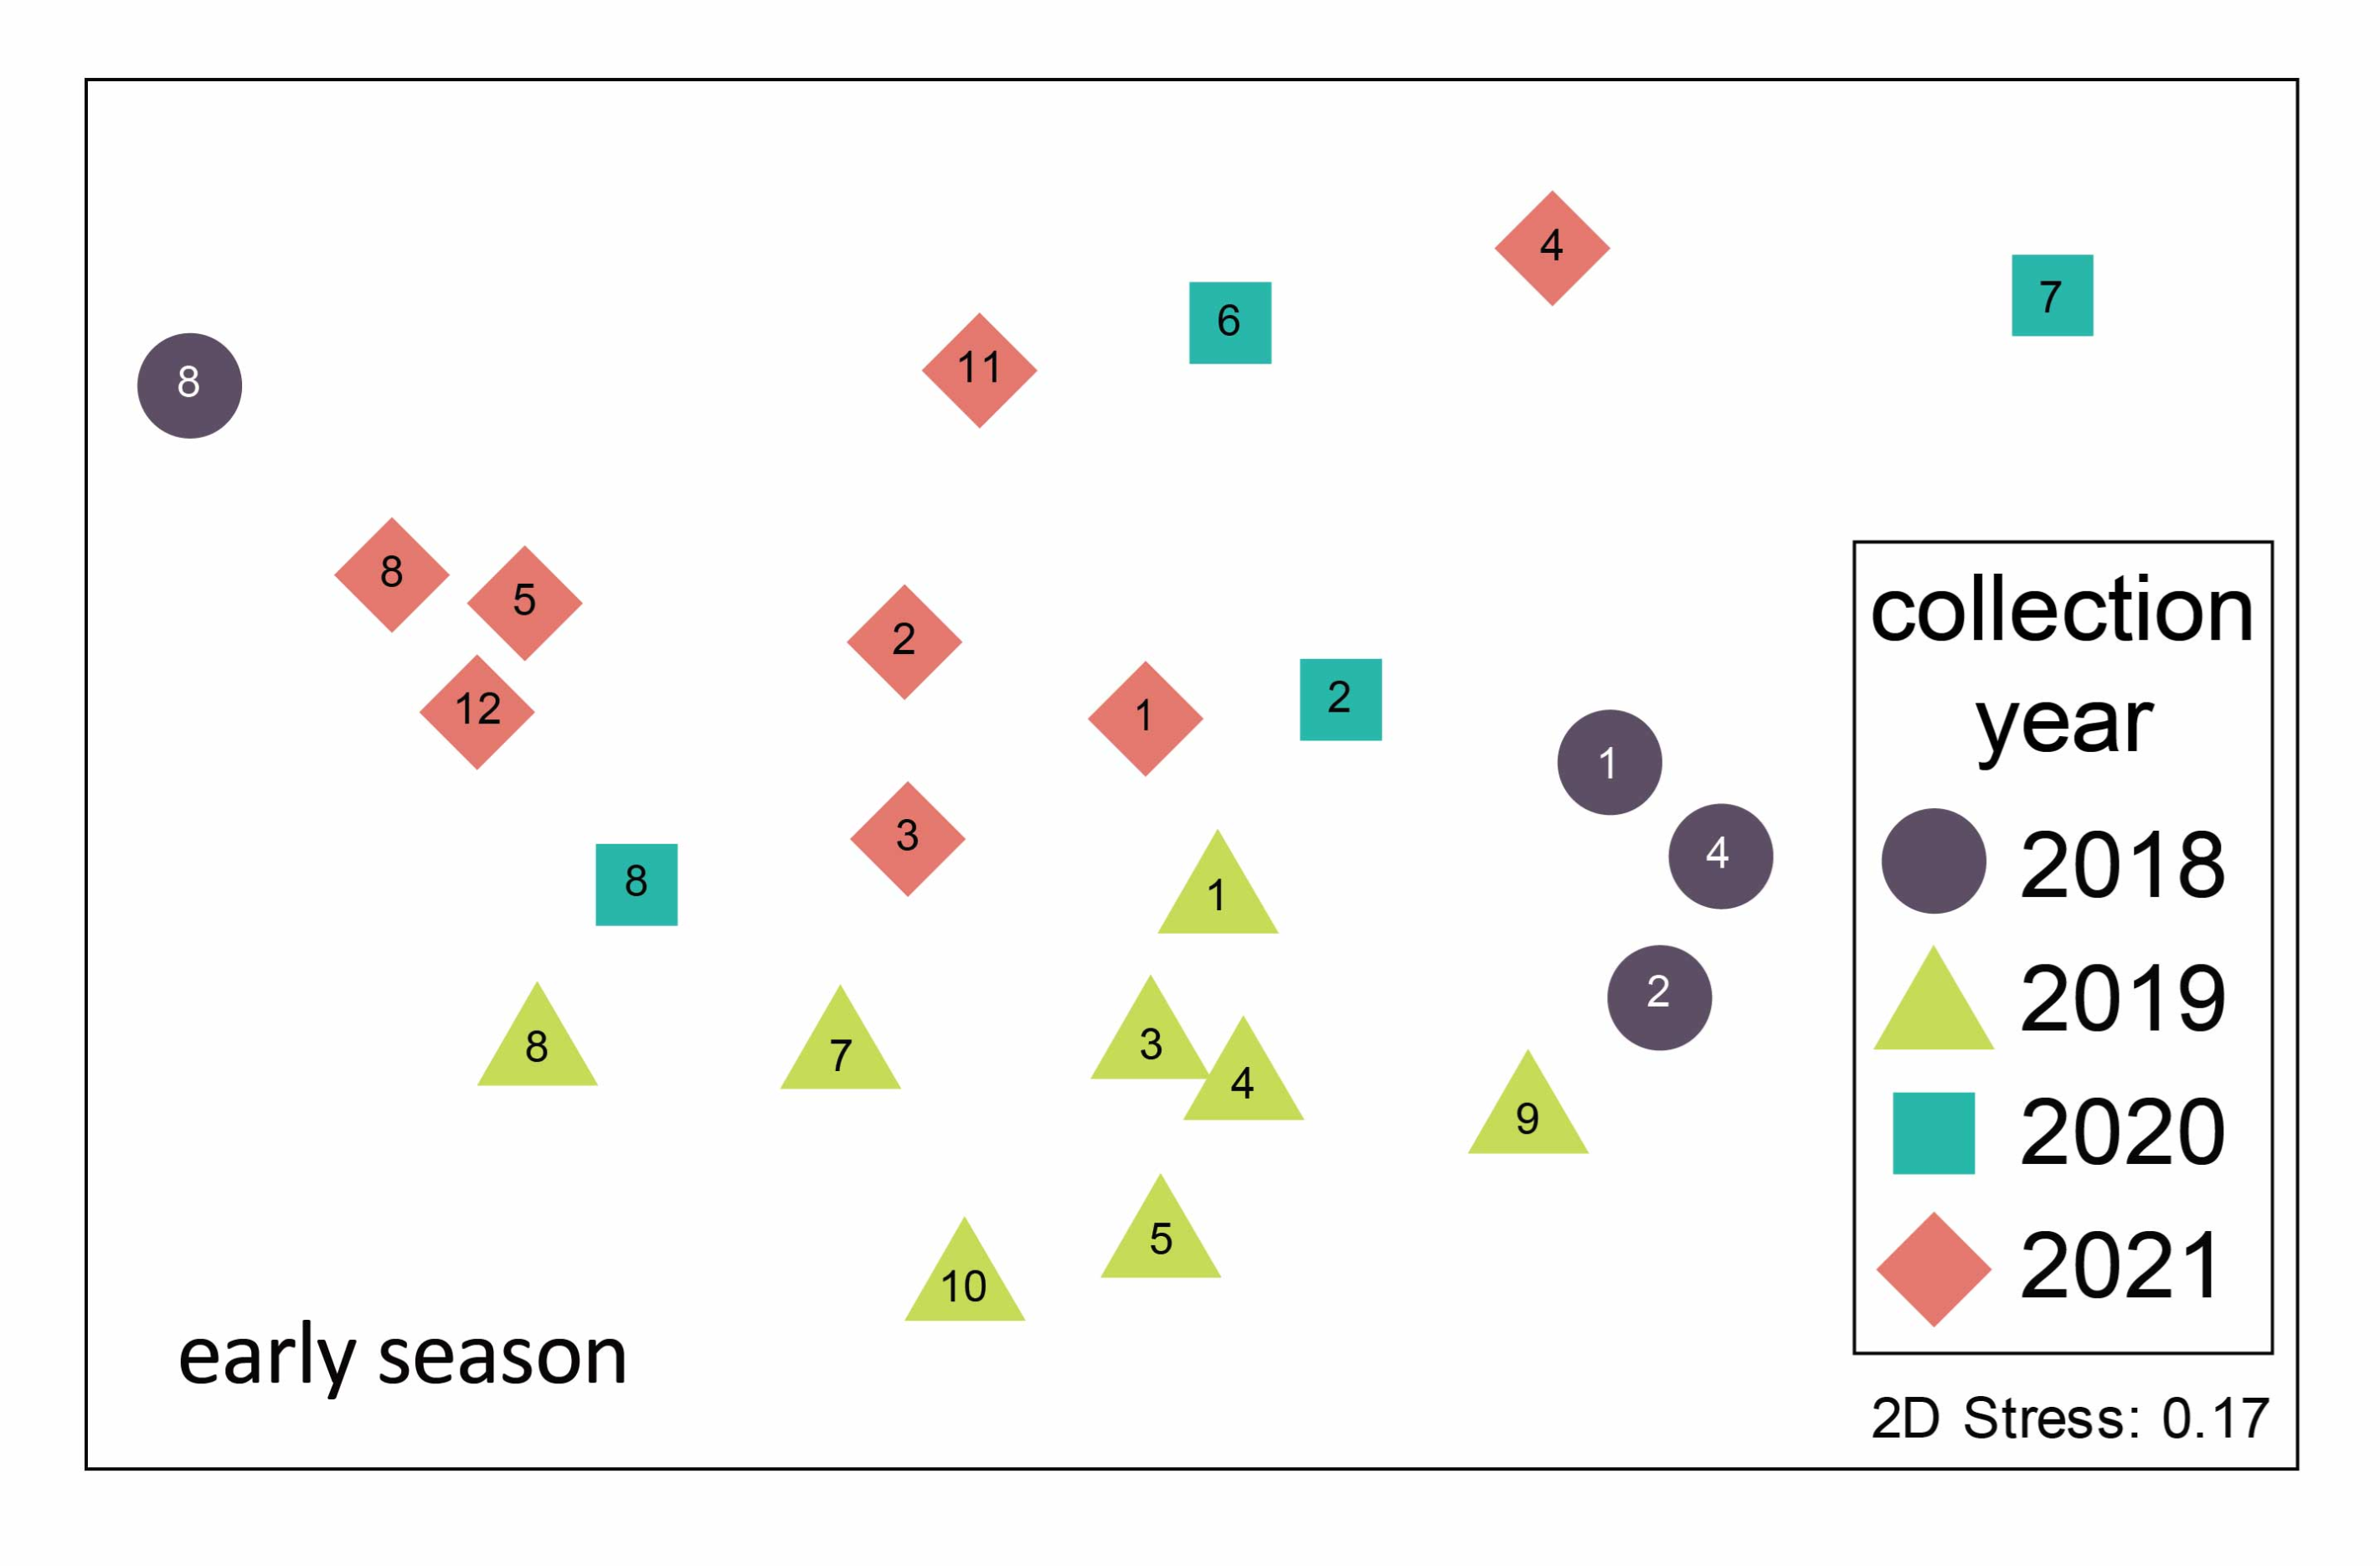
Figure 3.
Non-metric multidimensional scaling ordination of mosquito communities trapped in the Oklahoma City metro area in the early season (May–June) 2018–2021. Each point represents the early season mosquito community from a particular site–year combination. Point symbols represent the year of trapping and site numbers are noted (see Figure 1 for locations). Stress is an index of fit between the actual BrayCurtis distance matrix and its representation in two-dimensional ordination space. A stress value of 0.17 is considered low to moderate [16]. The mosquito species assemblages are statistically distinct between years (ANOSIM results in text).
3. Discussion
Mosquito communities sampled in the Oklahoma City Metropolitan area differed seasonally between years and between sampling locations. These four years of data are part of an ongoing effort to sample mosquito communities through time; associated changes may be an important indicator of environmental change [17]. In another study conducted over a larger spatial extent in Oklahoma, Bradt et al. [11] found variation in urban mosquito communities among three ecoregions within one year. Here, we report within the Central Great Plains ecoregion alone, in central Oklahoma, differences between sites in mosquito community composition across multiple years. However, communities were more similar overall between sites within the same year than between years. As illustrated in Figure 3, although some site numbers do cluster, overall, the symbols (years) group together. This suggests that regional environmental variables, including precipitation and temperature, may be the overriding drivers of community composition [9].
Habitat type has also been recognized as one of the primary drivers of mosquito community composition [18,19,20], and this likely contributed to our finding of variation in mosquito community composition among our sampling sites (Figure 1 and Figure 3). The majority of our sampling sites (all except 5, 8, 9, 10 and 12), were in suburban backyards where mosquitoes were fairly abundant, and some sites contained high species richness (Table 2). For example, we collected 17 species of mosquitoes at site 7, a backyard trapping site, in 2019. However, the sites with highest species richness tended to be rural (e.g., 5, 12), and our single riparian forest site (8) at the Stinchcomb Wildlife refuge alone accounted for half of all mosquitoes collected. The other two rural sites had much lower species richness and abundance due to low sampling effort (only eight trapping events total).
The Stinchcomb Wildlife Refuge (site 8) stands out for several reasons: it is unique among our sampling sites as the only forested site, and it has a unique mosquito community. Although community composition is generally more similar within a year than within a site across years (Figure 3), all four years of sampling at Stinchcomb cluster together in the left side of the ordination plot. The mosquito community composition at Stinchcomb is more similar to other years at Stinchcomb than to other sites during the same year, so the mosquito–environment relationship appears to have a strong influence in this habitat. The site is located along the North Canadian River and is regularly inundated following heavy rain events. It had the highest abundance of mosquitoes and an early season community dominated (90%) by Ae. vexans, a floodwater species. Although the composition is similar between years, the dominance of this species was strongly influenced by an extraordinary trapping event in 2018 where we captured about 5000 Ae. vexans in a single night in two CDC light traps. This highlights local variability as well as the ability of mosquito populations to grow explosively under the right conditions, in this case, a wet floodplain following heavy rain.
Other sites that contrasted our typical suburban backyard setting resulted in unique mosquito species compositions. Psorophora species mosquitoes were rare overall but common at two sites (12 and 2), especially in the late season. Site 12 is classified as rural, although it is situated in a suburban setting. In contrast to suburban sites, it is situated at an equestrian farm, and the local setting is open fields and forest patches. Similarly, site 2, which is in a suburban backyard, borders a large undeveloped area of open fields with forest patches. Psorophora species mosquitoes were also more abundant (included in the top five species represented in the pie charts in Figure 1A) in early-season communities at rural sites 10 and 13; both included areas with native grass and patches of forest. Though the role of Psorophora species mosquitoes (specifically Ps. ferox) in the transmission of WNV is considered to be minor [21], WNV has been detected in all Psorophora species collected in this study [22,23].
While previous studies across different regions have identified common species and their seasonality, mosquito communities in Oklahoma are not yet well characterized [10,11,24,25], and this sampling effort is an important contribution toward describing where vector species occur and are common, a critical first step in assessing human arboviral risk. We found several medically and veterinary relevant species (Table 1), often in suburban settings. Seven species of Aedes mosquitoes were collected, including Ae. albopictus, a known vector of chikungunya, dengue and Zika viruses. Ae. albopictus is currently expanding its range in the United States and represents a growing potential for local transmission of these viruses [26,27,28]. In our study, Ae. albopictus was an abundant species in several backyard sites (e.g., 1, 4, 7) in densely populated areas, especially in the late season (Figure 1C). Ae. vexans was the most abundant species we trapped, dominating early season trapping. Considering its immense numbers and preferential feeding on mammals and birds, it deserves attention as a possible bridge vector for WNV [21]. We also detected Ae. canadensis, an important vector of eastern equine encephalitis [29]. Notably, we did not find any Ae. aegypti, though previous surveillance has detected this species in southern Oklahoma and northern Texas [24]. The Cx. pipiens/quinquefasciatus complex made up 23% of our samples and are the primary known vectors of West Nile Virus in Oklahoma, as indicated by public health virus detection [10] and unpublished data from Oklahoma City County Health Department.
The sampling effort behind this surveillance study has generated a significant dataset that contributes to our understanding of mosquito communities in suburban settings but is not without limitations. In particular, the sampling design is not well balanced. We collected mosquitoes unevenly at a variety of sites (Table S3), in a number of different landscape contexts, in different years, at different times of year and using different traps. Some sites were sampled every year, while most were not, and sampling effort varied dramatically between sites, even within a year. Trapping site location and frequency was often driven by access and convenience, and our study would be more robust if sites were evenly spread across landscape types (e.g., we only have one forested site) and nearby landscape characteristics (e.g., sources of standing water) were better quantified. The first two years of data only include early-season sampling, predominantly using CDC light traps. The last two years of data offer better coverage of the entire season, but the seasonal shift in mosquito communities is confounded with a shift to gravid traps (Table 1). Ultimately, the mosquito collection effort prioritized collecting blood-fed mosquitoes for virus detection over characterizing how mosquito communities changed across space and time.
Surveillance of mosquito populations is critical for making informed public health decisions about vector control, and this study contributes to our understanding of prevalent vector mosquitoes in the Oklahoma City metropolitan area. Our next steps for this surveillance effort include examining the role of climate and land cover to explain and predict interannual and seasonal changes in mosquito community composition in central Oklahoma.
4. Materials and Methods
4.1. Field Mosquito Trapping
We selected 13 sites across four counties in central Oklahoma encompassing the Level III Central Great Plains ecoregion, where mixed-grass prairie and riparian woodlands are predominant; all sites are located in the central climate division with similar physiographic and meteorological characteristics [30,31]. The climate in central Oklahoma is subtropical, semi-arid with average annual minimum temperature of 10.5 °C, average annual maximum temperature of 22.2 °C and average annual precipitation of 860 mm [32]. The trapping locations (Figure 1) were selected to represent land-use types within the Oklahoma City metropolitan area, spanning from low- to medium-density urban areas, rural grassland locations and a riparian forest [33,34]. Collection sites were distributed across the range of environmental conditions that characterize this region to obtain a representative sample of the regional mosquito community. Most sites were located in suburban backyards (e.g., mowed grass, landscaping, trees, possible standing water in gutters or birdbaths, Table 2) accessed by permission from property owners. A temporary permit was obtained from the city of Oklahoma City to sample mosquitoes at the Stinchcomb Wildlife Refuge (site 8), which includes a bottomland hardwood forest. Rural locations were primarily pastures dominated grasses and shrubs. Sites at which sampling was conducted varied between years (Table 2), with all but one site (#10) sampled for at least two years. Weekly adult mosquito trapping took place between May and June in four years (2018–2021); the sampling season was extended into September in 2020 and November in 2021. Following Bradt et al. [11] we defined sampling during May–June as “early season” and sampling during and after July as “late season.”
Sampling was conducted with two types of mosquito traps to capture a diverse mosquito community. We used CDC miniature light traps (Bioquip, Rancho Dominguez, CA, USA), baited overnight with dry ice as a CO2 source, because of their superior effectiveness in terms of catch abundance [11]. In addition, beginning in 2019, we also sampled using CDC gravid traps (John W. Hock Company, Gainesville, FL, USA) baited with water infused with locally harvested grass for 48 hours. Sampling at each site involved six CDC light traps and two gravid traps in 2019, eight light traps and six gravid traps in 2020, and eight traps of each type in 2021. The number of sampling events per site per year are listed in Table 2. Upon collection, we transported catch bags containing mosquitoes from the field in coolers and stored them at −20 °C until processing (usually on the same day).
4.2. Lab Processing
Mosquitoes were sorted and identified based on morphology [35]. In brief, mosquitoes were euthanized by freezing at −20 °C, sorted, and adult female specimens identified to species using morphological keys from Darsie and Ward [36], Burkett-Cadena [37], and Walter Reed Biosystematics Unit (http://www.wrbu.org/VecID_MQ.html (accessed on 15 June 2018)). Adult female specimens were pooled by trap and species (pools size 5–35 individuals), placed in screw cap tubes and stored at −80 °C.
4.3. Sanger Sequencing
To resolve taxonomic uncertainty, we used genetic analysis to confirm morphological species identifications. Genomic DNA was extracted from selected individual adult female specimens using the Quick-DNATM Tissue/insect kit (Zymo Research, Irvine, CA, USA). The mitochondrial cytochrome c oxidase subunit I (COI) gene was amplified using Folmer primers [38], and bead-cleaned (KAPA Biosystems, Wilmington, MA, USA) fragments were sequenced using ThermoFisher’s BigDye Terminator v3.1 Sequencing Kit per standard protocols. Reactions were cleaned using Sephadex columns and loaded onto the 4-capillary SeqStudio Genetic Analyzer from Applied Biosystems (ThermoFisher, Waltham, MA, USA). Raw sequences were visualized, trimmed and corrected using Geneious Prime v2022.0.1 [39] entered into the Barcode of Life Data system and matched to previously identified specimens in the BOLD database (https://www.boldsystems.org/ (accessed on 5 May 2020)). COI sequences were deposited to Genbank available under the accession numbers OL437322-OL437326.
4.4. Mosquito Community Assemblage Analysis
We examined differences in mosquito community composition between seasons and years using multivariate ordination analyses and randomization tests. Samples collected within a given year were divided into early (May–June) and late (July–November) season site-level communities. Mosquito abundance was square-root transformed, and a Bray–Curtis distance matrix was calculated for the taxa–site matrix to measure the similarity of mosquito community composition between sites. First, a nonmetric multidimensional scaling (NMS) ordination was performed to visualize similarities between sites (PRIMER-E Version 6.1.5; PRIMER-E Ltd., Plymouth, UK). In an NMS ordination, the mosquito community at a site is represented by a point, and points that are closer together are more similar in terms of the relative abundance of species present at that site, whereas points that are further apart have less similar mosquito communities. Subsequently, we tested the effect of the year and season on mosquito community composition using the Bray–Curtis distances and associated analysis of similarity (ANOSIM) tests [16]. Site was excluded as a factor because of low replication and large variation in within-site sampling effort. Because early- and late-season mosquito communities differed in terms of community composition, and sampling effort varied considerably between seasons (notably, lack of late season sampling during 2018–2019), we repeated the above analysis using only early season data to test whether mosquito community composition changed across years.
Supplementary Materials
The following supporting information can be downloaded at: https://www.mdpi.com/article/10.3390/pathogens11091007/s1, Table S1. List of sample sites in the Oklahoma City metro area. The numbers correspond to the twelve sites in Figure 1. The site names are generally a household or municipality name. The landscape setting categories are suburban backyard, rural and riparian forest. Latitude and longitude are reported in decimal degrees. Table S2. Top five most abundant species per each site and their seasonal totals for the years sampled. Table S3. Because trapping effort varied among sites and which sites were sampled varied among years, we have summarized trapping effort (trap nights) and total abundance here by site and by trap type, namely CDC light trap (light) and CDC gravid traps (Gravid).
Author Contributions
Conceptualization: C.M.B.F. and D.H.; validation: D.H., M.L.; formal analysis: D.H., M.L., B.C., C.M.B.F.; investigation: H.A., N.B., R.W., N.P., K.H., C.E., K.T., H.F., C.C., A.W., R.I., M.L.; data curation: H.A., R.W., B.C., C.C., M.L., H.J., D.H.; writing—original draft preparation: C.M.B.F., D.H., and B.C.; visualization: B.C., C.C., K.H., N.B., R.W., D.H.; project administration: C.M.B.F.; funding acquisition: C.M.B.F. All authors have read and agreed to the published version of the manuscript.
Funding
This material is based upon work supported by the National Aeronautics and Space Administration under Agreement No. 80NSSC19M0058 issued through the Oklahoma NASA EPSCoR/Space Grant Consortium.
Institutional Review Board Statement
Not applicable.
Informed Consent Statement
Not applicable.
Data Availability Statement
The data used for the community assemblage presented in this study are openly available in FigShare at 10.6084/m9.figshare.20216960.
Acknowledgments
The authors thank Southern Nazarene University’s NASA Oklahoma Space Grant, the Ronald E. McNair Post-baccalaureate Achievement Program and the CDC Western Gulf Center of Excellence for Vector-Borne Diseases for providing student support. Special thanks to SNU’s Catalysts group for funding this project. We also thank the sponsoring institutions: Oklahoma City County Health Department, Oklahoma City Water Utilities Trust and Stinchcomb Wildlife Refuge and the Genomics Division of the Laboratory for Molecular Biology and Cytometry Research at the University of Oklahoma Health Science Center which provided Sanger sequencing. Thanks to Daniel G. Rocha for his collaboration with Geospatial Information Software. This manuscript was improved by helpful comments from Yuri Springer and two anonymous reviewers.
Conflicts of Interest
The authors declare no conflict of interest.
References
- Rosenberg, R.; Lindsey, N.P.; Fischer, M.; Gregory, C.J.; Hinckley, A.F.; Mead, P.S.; Paz-Bailey, G.; Waterman, S.H.; Drexler, N.A.; Kersh, G.J.; et al. Vital Signs: Trends in Reported Vectorborne Disease Cases-United States and Territories, 2004–2016. MMWR Morb. Mortal. Wkly. Rep. 2018, 67, 496–501. [Google Scholar] [CrossRef] [PubMed]
- Leta, S.; Beyene, T.J.; De Clercq, E.M.; Amenu, K.; Kraemer, M.U.G.; Revie, C.W. Global risk mapping for major diseases transmitted by Aedes aegypti and Aedes albopictus. Int. J. Infect. Dis. 2018, 67, 25–35. [Google Scholar] [CrossRef]
- Beard, C.B.; Visser, S.N.; Petersen, L.R. The Need for a National Strategy to Address Vector-Borne Disease Threats in the United States. J. Med. Èntomol. 2019, 56, 1199–1203. [Google Scholar] [CrossRef] [PubMed]
- Johnson, M.G.; Adams, J.; McDonald-Hamm, C.; Wendelboe, A.; Bradley, K.K. Seasonality and survival associated with three outbreak seasons of West Nile virus disease in Oklahoma-2003, 2007, and 2012. J. Med. Virol. 2015, 87, 1633–1640. [Google Scholar] [CrossRef] [PubMed]
- Caldwell, J.M.; LaBeaud, A.D.; Lambin, E.F.; Stewart-Ibarra, A.M.; Ndenga, B.A.; Mutuku, F.M.; Krystosik, A.R.; Ayala, E.B.; Anyamba, A.; Borbor-Cordova, M.J.; et al. Climate predicts geographic and temporal variation in mosquito-borne disease dynamics on two continents. Nat. Commun. 2021, 12, 1233. [Google Scholar] [CrossRef]
- Keyel, A.C.; Timm, O.E.; Backenson, P.B.; Prussing, C.; Quinones, S.; McDonough, K.A.; Vuille, M.; Conn, J.E.; Armstrong, P.M.; Andreadis, T.G.; et al. Seasonal temperatures and hydrological conditions improve the prediction of West Nile virus infection rates in Culex mosquitoes and human case counts in New York and Connecticut. PLoS ONE 2019, 14, e021785. [Google Scholar] [CrossRef] [PubMed]
- Petruff, T.A.; McMillan, J.R.; Shepard, J.J.; Andreadis, T.G.; Armstrong, P.M. Increased mosquito abundance and species richness in Connecticut, United States 2001–2019. Sci. Rep. 2020, 10, 19287. [Google Scholar] [CrossRef]
- Tian, H.Y.; Bi, P.; Cazelles, B.; Zhou, S.; Huang, S.-Q.; Yang, J.; Pei, Y.; Wu, X.-X.; Fu, S.-H.; Tong, S.-L.; et al. How environmental conditions impact mosquito ecology and Japanese encephalitis: An eco-epidemiological approach. Environ. Int. 2015, 79, 17–24. [Google Scholar] [CrossRef]
- Yoo, E.H.; Diao, D.C.C.; Russel, C. The Effects of Weather and Environmental Factors on West Nile Virus Mosquito Abundance in Greater Toronto Area. Earth Interact. 2016, 20, 1–22. [Google Scholar] [CrossRef]
- Noden, B.H.; Coburn, L.; Wright, R.; Bradley, K. An Updated Checklist of the Mosquitoes of Oklahoma Including New State Records and West Nile Virus Vectors, 2003–06. J. Am. Mosq. Control Assoc. 2015, 31, 336–345. [Google Scholar] [CrossRef]
- Bradt, D.; Wormington, J.D.; Long, J.M.; Hoback, W.W.; Noden, B.H. Differences in Mosquito Communities in Six Cities in Oklahoma. J. Med. Èntomol. 2019, 56, 1395–1403. [Google Scholar] [CrossRef] [PubMed]
- Connelly, C.R.; Gerding, J.A.; Jennings, S.M.; Ruiz, A.; Barrera, R.; Partridge, S.; Ben Beard, C. Continuation of Mosquito Surveillance and Control During Public Health Emergencies and Natural Disasters. MMWR. Morb. Mortal. Wkly. Rep. 2020, 69, 938–940. [Google Scholar] [CrossRef] [PubMed]
- Swetnam, D.; Widen, S.G.; Wood, T.G.; Reyna, M.; Wilkerson, L.; Debboun, M.; Symonds, D.A.; Mead, D.G.; Beaty, B.J.; Guzman, H.; et al. Terrestrial Bird Migration and West Nile Virus Circulation, United States. Emerg. Infect. Dis. 2018, 24, 2184–2194. [Google Scholar] [CrossRef] [PubMed]
- Parry, R.; Naccache, F.; Ndiaye, E.H.; Fall, G.; Castelli, I.; Lühken, R.; Medlock, J.; Cull, B.; Hesson, J.C.; Montarsi, F.; et al. Identification and RNAi Profile of a Novel Iflavirus Infecting Senegalese Aedes vexans arabiensis Mosquitoes. Viruses 2020, 12, 440. [Google Scholar] [CrossRef]
- Turell, M.J.; Dohm, D.J.; Sardelis, M.R.; Oguinn, M.L.; Andreadis, T.G.; Blow, J.A. An update on the potential of north American mosquitoes (Diptera: Culicidae) to transmit West Nile Virus. J. Med. Entomol. 2005, 42, 57–62. [Google Scholar] [CrossRef]
- Clarke, K.R. Non-parametric multivariate analyses of changes in community structure. Aust. J. Ecol. 1993, 18, 117–143. [Google Scholar] [CrossRef]
- Hoekman, D.; Springer, Y.P.; Gibson, C.; Barker, C.M.; Barrera, R.; Blackmore, M.S.; Bradshaw, W.E.; Foley, D.H.; Ginsberg, H.S.; Hayden, M.H.; et al. Design for mosquito abundance, diversity, and phenology sampling within the National Ecological Observatory Network. Ecosphere 2016, 7, e01320. [Google Scholar] [CrossRef]
- McMillan, J.R.; Armstrong, P.M.; Andreadis, T.G. Patterns of mosquito and arbovirus community composition and ecological indexes of arboviral risk in the northeast United States. PLoS Neglected Trop. Dis. 2020, 14, e0008066. [Google Scholar] [CrossRef]
- Beaulieu, M.R.S.; Hopperstad, K.; Dunn, R.; Reiskind, M.H. Simplification of vector communities during suburban succession. PLoS ONE 2019, 14, e0215485. [Google Scholar]
- Mayi, M.P.A.; Bamou, R.; Djiappi-Tchamen, B.; Fontaine, A.; Jeffries, C.L.; Walker, T.; Antonio-Nkondjio, C.; Cornel, A.J.; Tchuinkam, T. Habitat and Seasonality Affect Mosquito Community Composition in the West Region of Cameroon. Insects 2020, 11, 312. [Google Scholar] [CrossRef]
- Andreadis, T.G.; Anderson, J.F.; Vossbrinck, C.R.; Main, A.J. Epidemiology of West Nile Virus in Connecticut: A Five-Year Analysis of Mosquito Data 1999–2003. Vector-Borne Zoonotic Dis. 2004, 4, 360–378. [Google Scholar] [CrossRef] [PubMed]
- Kulasekera, V.L.; Kramer, L.; Nasci, R.S.; Mostashari, F.; Cherry, B.; Trock, S.C.; Glaser, C.; Miller, J.R. West Nile virus infection in mosquitoes, birds, horses, and humans, Staten Island, New York, 2000. Emerg. Infect. Dis. 2001, 7, 722–725. [Google Scholar] [CrossRef] [PubMed]
- CDC. 2022. Available online: https://www.cdc.gov/westnile/resources/pdfs/MosquitoSpecies1999-2016.pdf (accessed on 16 March 2022).
- Sanders, J.D.; Talley, J.L.; Frazier, A.E.; Noden, B.H. Landscape and Anthropogenic Factors Associated with Adult Aedes aegypti and Aedes albopictus in Small Cities in the Southern Great Plains. Insects 2020, 11, 699. [Google Scholar] [CrossRef]
- Rozeboom, L.E. The Mosquitoes of Oklahoma [Internet]. In Technical Bulletin T-16; Oklahoma Agricultural and Mechanical College Agricultural Experiment Station: Stillwater, OK, USA, 1942; Volume 56, Available online: https://babel.hathitrust.org/cgi/pt?id=coo.31924018295687;view=1up;seq=5 (accessed on 31 May 2019).
- Ryan, S.J.; Carlson, C.J.; Mordecai, E.A.; Johnson, L.R. Global expansion and redistribution of Aedes-borne virus transmission risk with climate change. PLoS Negl. Trop. Dis. 2019, 13, e0007213. [Google Scholar] [CrossRef]
- Richards, B.J.T.T.; Hassan, H.; Gebbiena, M.B.; Bartholomay, L.; Paskewitz, S. First Detection of Aedes albopictus (Diptera: Culicidae) and Expansion of Aedes japonicus japonicus in Wisconsin, United States. J. Med. Entomol. 2018, 56, 291–296. [Google Scholar] [CrossRef]
- Armstrong, P.M.; Andreadis, T.G.; Shepard, J.J.; Thomas, M.C. Northern range expansion of the Asian tiger mosquito (Aedes albopictus): Analysis of mosquito data from Connecticut, USA. PLoS Negl. Trop. Dis. 2017, 11, e0005623. [Google Scholar] [CrossRef]
- Sherwood, J.A.; Stehman, S.V.; Howard, J.J.; Oliver, J. Cases of Eastern equine encephalitis in humans associated with Aedes canadensis, Coquillettidia perturbans and Culiseta melanura mosquitoes with the virus in New York State from 1971 to 2012 by analysis of aggregated published data. Epidemiol. Infect. 2020, 148, e72. [Google Scholar] [CrossRef] [PubMed]
- Woods, A.J.; Omernik, J.M.; Butler, D.R.; Ford, J.G.; Henley, J.G.; Hoagland, B.W.; Arndt, D.S. Geological Survey, map scale 1:1,250,000; Ecoregions of Oklahoma: Reston, VA, USA, 2016. [Google Scholar]
- Miller, R.; Fox, G. A tool for drought planning in Oklahoma: Estimating and using drought-influenced flow exceedance curves. J. Hydrol. Reg. Stud. 2017, 10, 35–46. [Google Scholar] [CrossRef]
- Survey, O.C. Oklahoma Climate-Long Term Averages and Extremes. 2022. Available online: http://climate.ok.gov/index.php/climate (accessed on 2 August 2022).
- Yang, L.; Huang, C.; Homer, C.G.; Wylie, B.; Coan, M.J. An approach for mapping large-area impervious surfaces: Synergistic use of Landsat-7 ETM+ and high spatial resolution imagery. Can. J. Remote Sens. 2003, 29, 230–240. [Google Scholar] [CrossRef]
- Jin, S.; Homer, C.; Yang, L.; Danielson, P.; Dewitz, J.; Li, C.; Zhu, Z.; Xian, G.; Howard, D. Overall Methodology Design for the United States National Land Cover Database 2016 Products. Remote Sens. 2019, 11, 2971. [Google Scholar] [CrossRef]
- Thomas, K.; Pelletier, N.; França, C.M.B. Using metagenomics to detect West Nile virus in mosquitoes collected in Oklahoma. BIOS, 2022; in press. [Google Scholar]
- Darsie, R.F.; Ward, R.A. Identification and Geographical Distribution of the Mosquitoes of North America, North of Mexico, 2nd ed.; University Press of Florida: Gainesville, FL, USA, 2005; Volume 2. [Google Scholar]
- Burkett-Cadena, N.D. Mosquitoes of the Southeastern United States; University of Alabama Press: Tuscaloosa, AL, USA, 2013. [Google Scholar]
- Folmer, O.; Black, M.; Hoeh, W.; Lutz, R.; Vrijenhoek, R. DNA primers for amplification of mitochondrial cytochrome c oxidase subunit I from diverse metazoan invertebrates. Mol. Mar. Biol. Biotechnol. 1994, 3, 294–299. [Google Scholar] [PubMed]
- Kearse, M.; Moir, R.; Wilson, A.; Stones-Havas, S.; Cheung, M.; Sturrock, S.; Buxton, S.; Cooper, A.; Markowitz, S.; Duran, C.; et al. Geneious Basic: An integrated and extendable desktop software platform for the organization and analysis of sequence data. Bioinformatics 2012, 28, 1647–1649. [Google Scholar] [CrossRef] [PubMed]


Publisher’s Note: MDPI stays neutral with regard to jurisdictional claims in published maps and institutional affiliations. |
© 2022 by the authors. Licensee MDPI, Basel, Switzerland. This article is an open access article distributed under the terms and conditions of the Creative Commons Attribution (CC BY) license (https://creativecommons.org/licenses/by/4.0/).