
MALDI-TOF MS-Based KPC Direct Detection from Patients’ Positive Blood Culture Bottles, Short-Term Cultures, and Colonies at the Hospital

 , ,
, , 
Abstract
:1. Introduction
2. Materials and Methods
2.1. Control Strains
2.2. KPC Detection from Simulated Positive Blood Cultures, Short-Term Cultures and Colonies Using Previously Characterized Isolates
2.3. Clinical Samples
2.4. Hospitals’ Bacterial Routine Identification
2.5. Protein Extraction from Patients’ Positive Blood Culture Bottles
2.6. Protein Extraction from Short-Term Cultures
2.7. Protein Extraction from Colonies
2.8. Target Spot Loading for Bacterial Identification and KPC Detection
2.9. Spectra Acquisition
2.10. Bacterial Identification Concordance Calculation
2.11. Visual Spectra Analysis and Statistics for KPC Detection
2.12. Antimicrobial Susceptibility Testing and Genetic Characterization of Isolates
3. Results
3.1. KPC-Producing Recombinant Strains Spectra Analysis
3.2. Bacterial Identification and KPC Detection from Simulated Positive Blood Cultures, Short-Term Cultures and Colonies Evaluated with Previously Characterized Isolates
3.3. Bacterial Identification from Clinical Samples
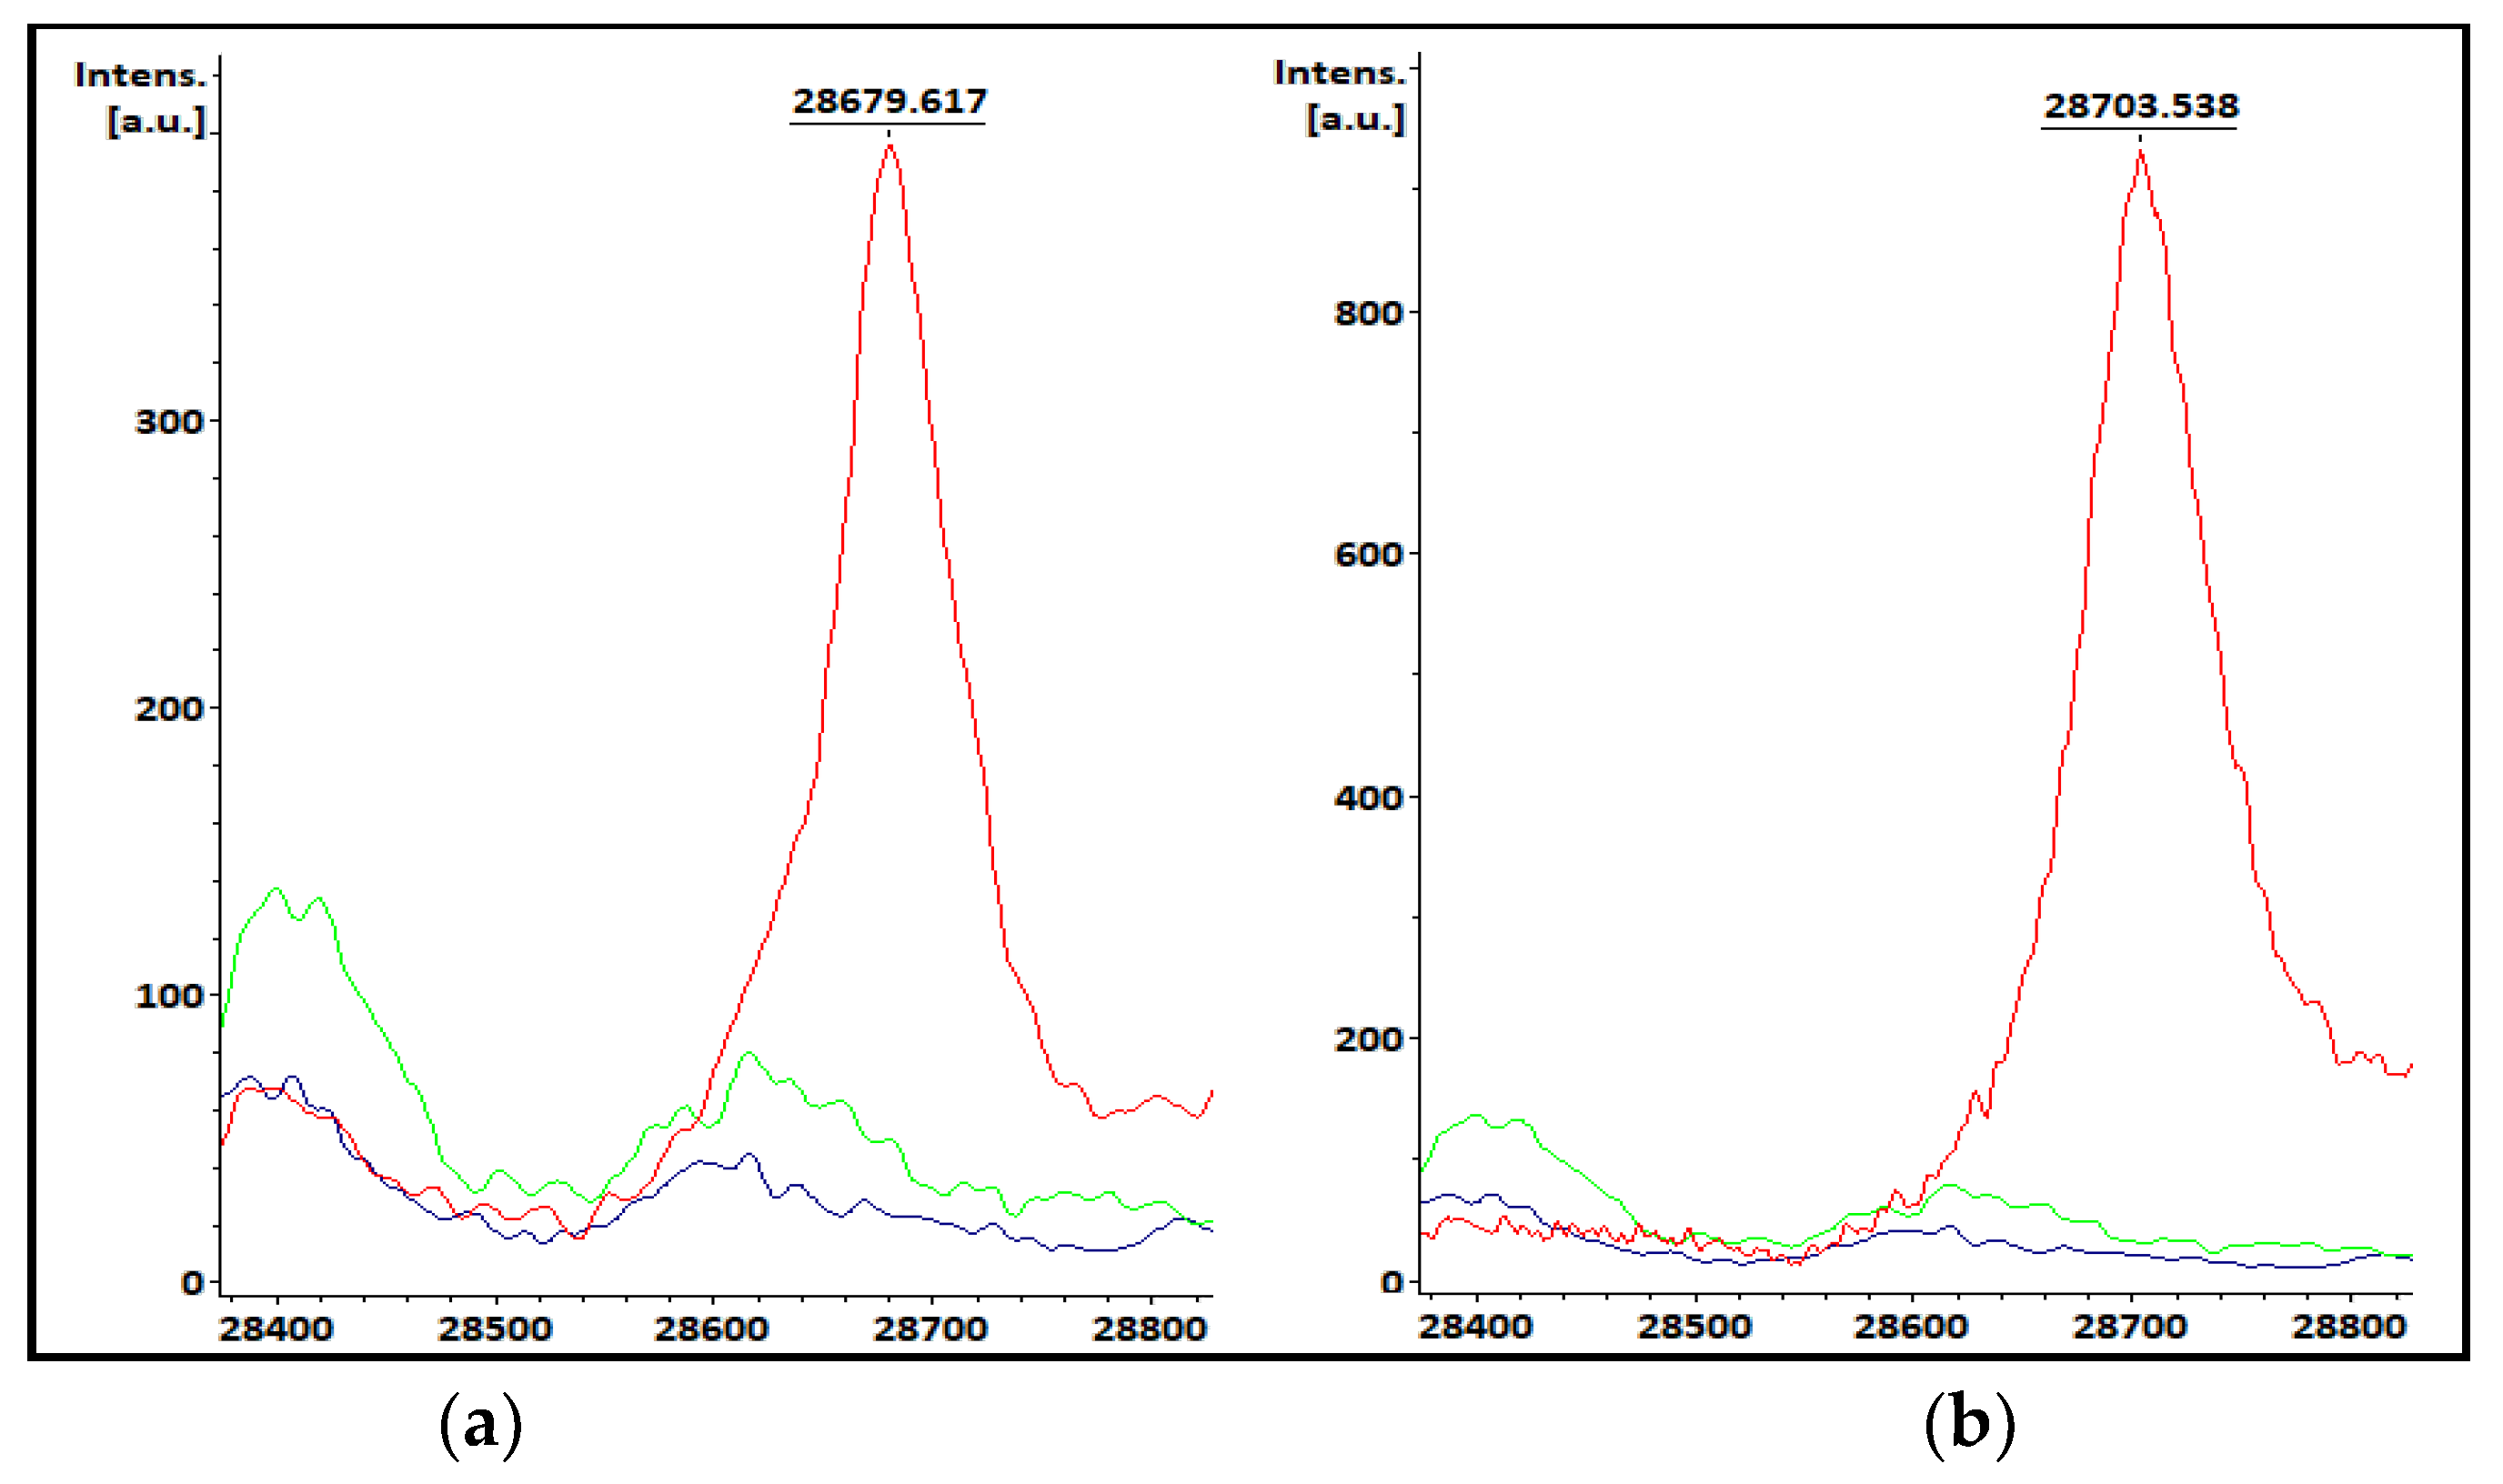
3.4. KPC Detection from Patients’ Positive BC Bottles
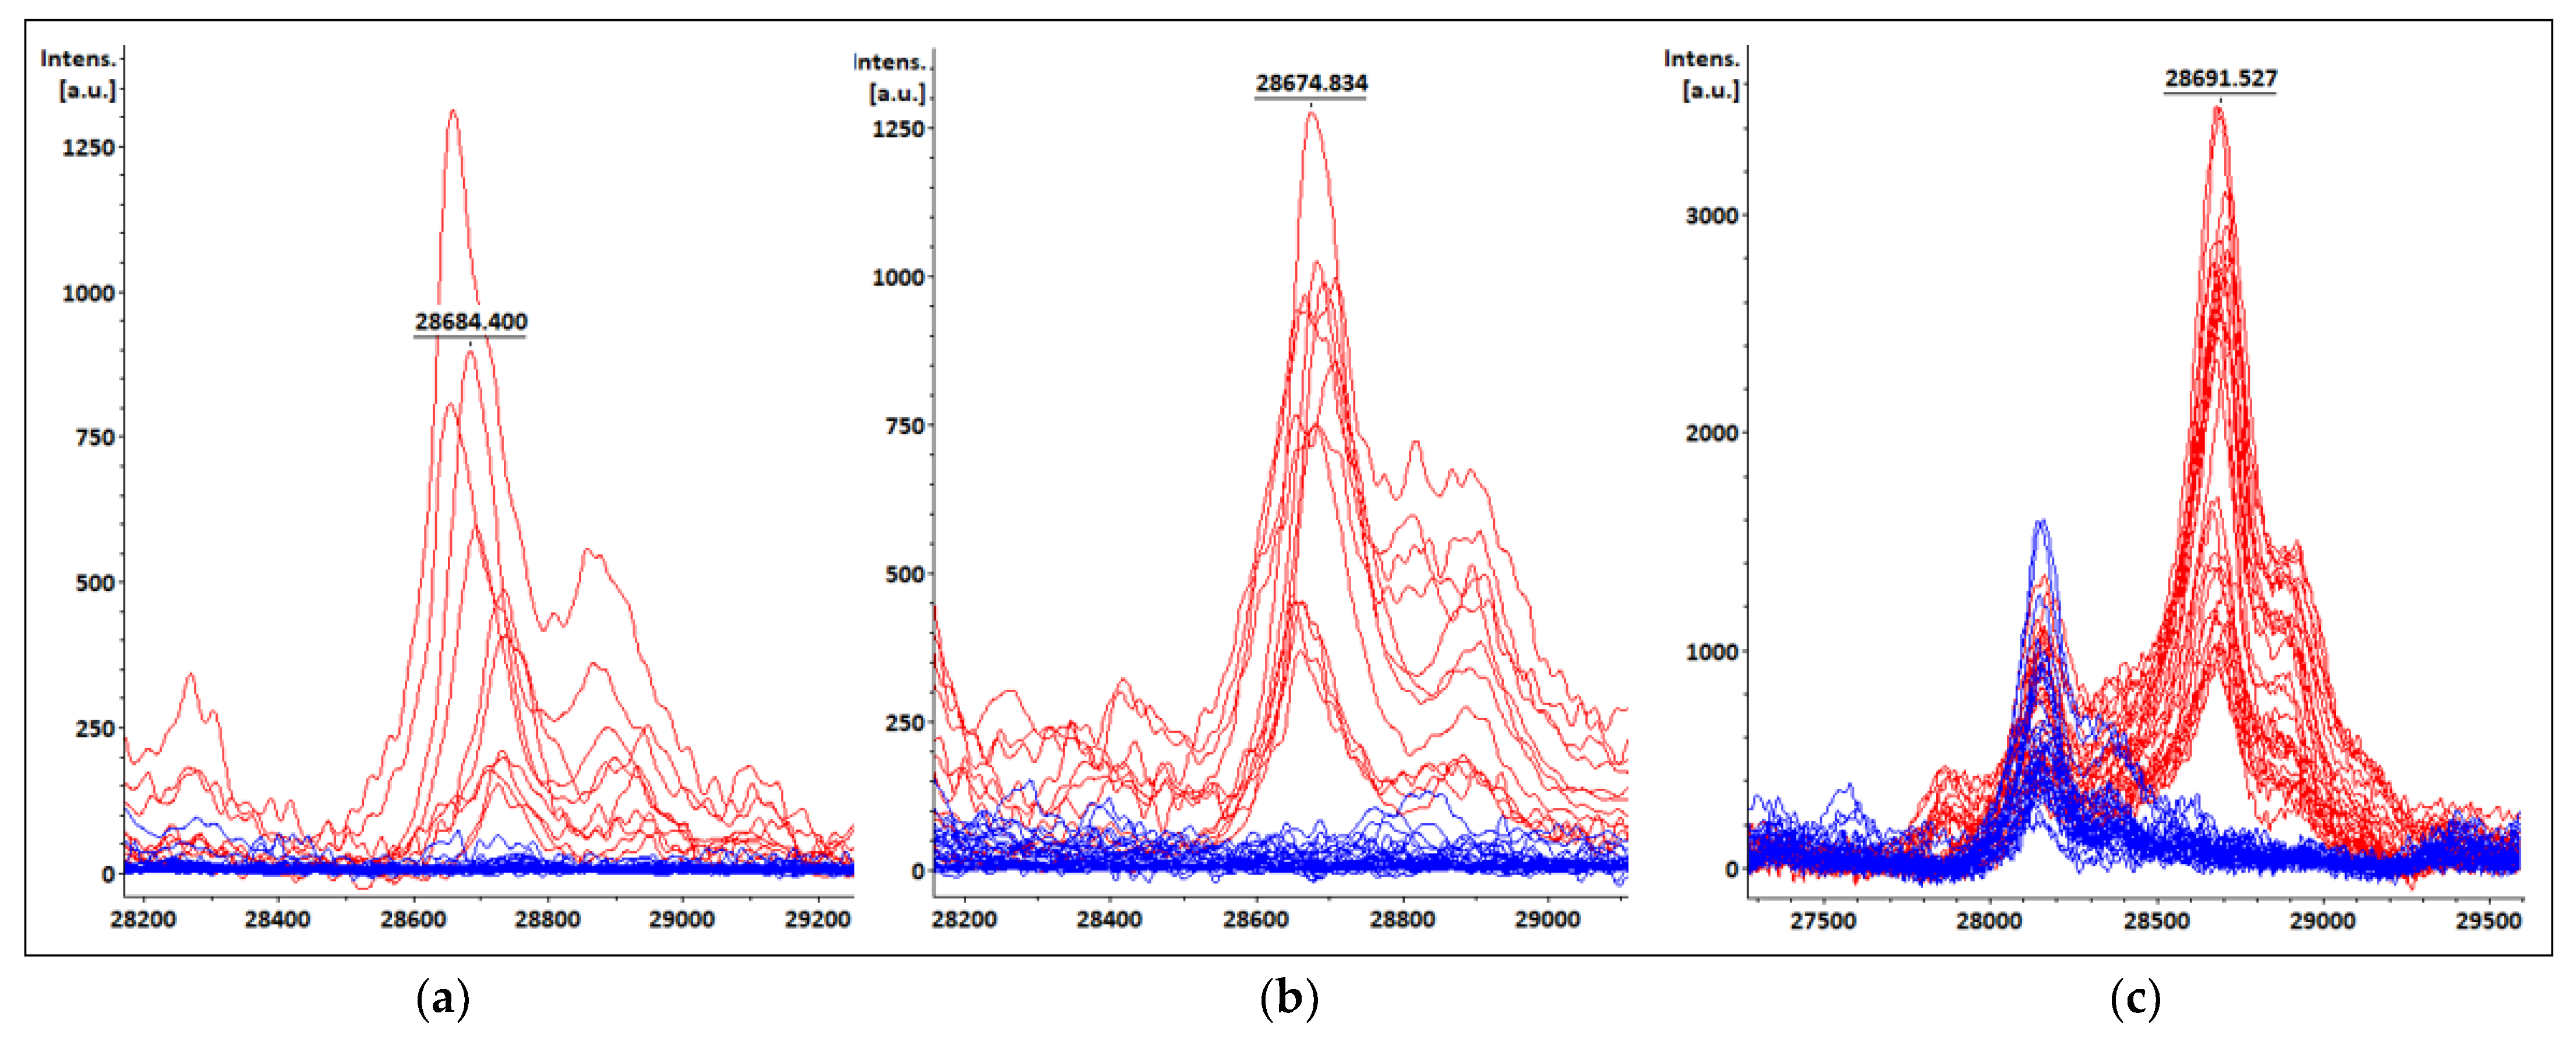
3.5. KPC Detection from STC Samples
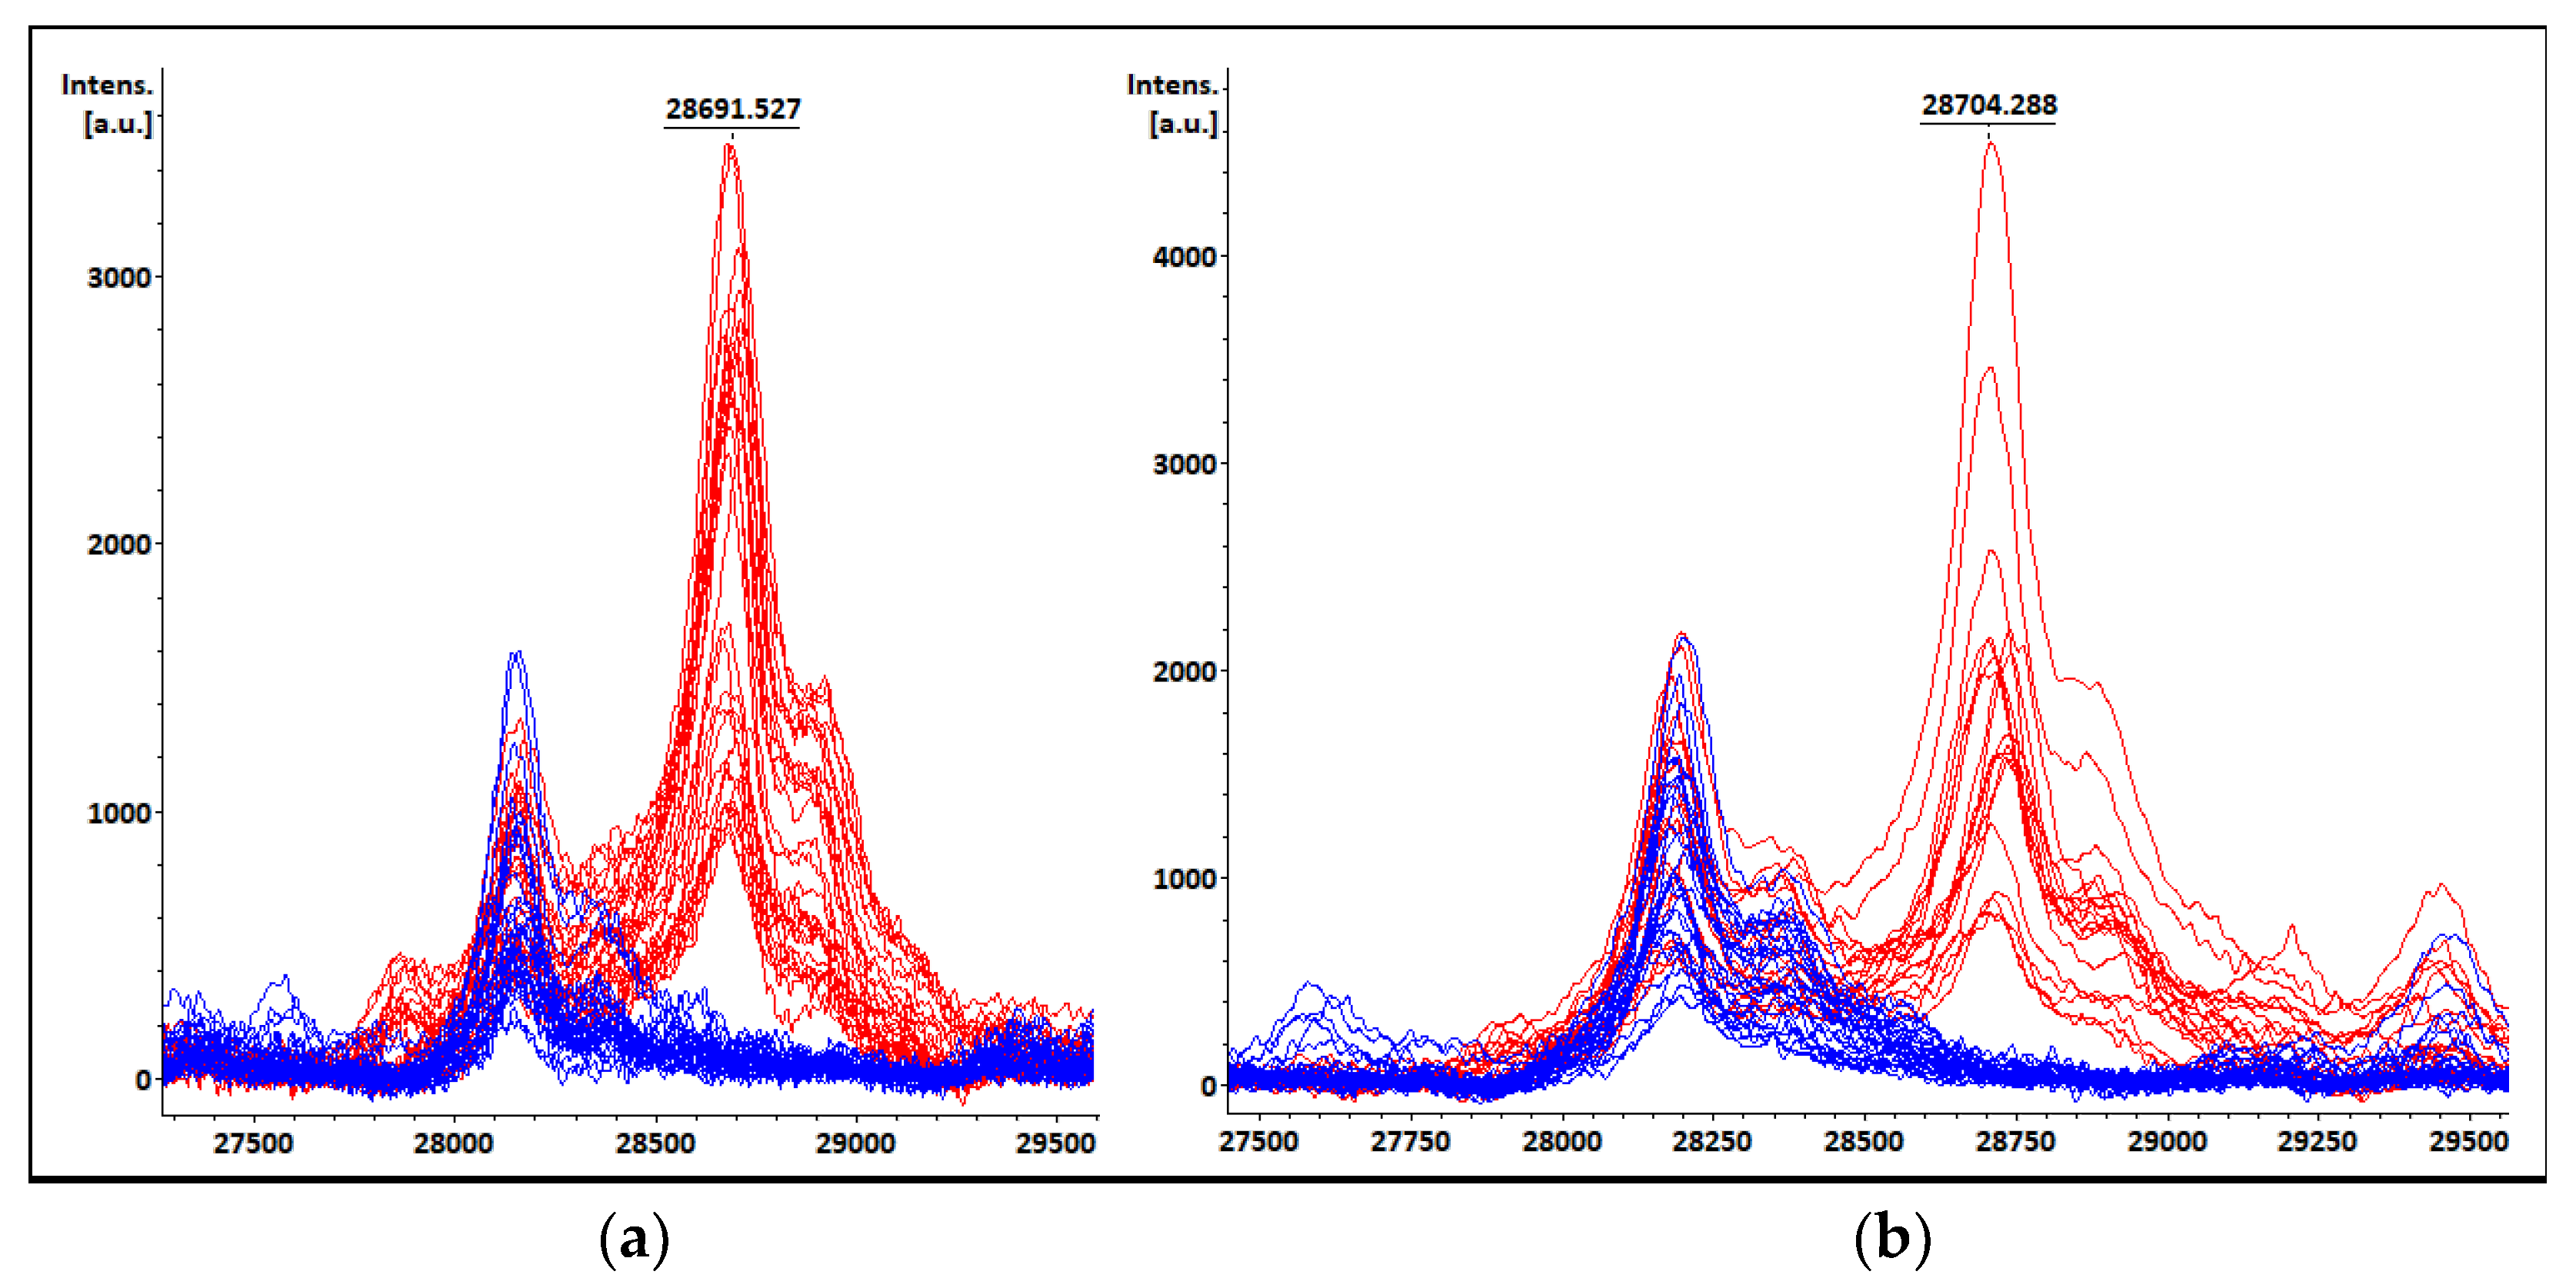
3.6. KPC Detection from COL Samples
3.7. Peak at m/z ~11,109 Da Visual Detection
3.8. Ferulic Acid Matrix Performance for KPC Detection
3.9. Antimicrobial Susceptibility Testing and Carbapenemase Gene Detection by PCR
4. Discussion
5. Conclusions
Author Contributions
Funding
Institutional Review Board Statement
Informed Consent Statement
Data Availability Statement
Conflicts of Interest
References
- Sulayyim, H.J.A.; Ismail, R.; Hamid, A.A.; Ghafar, N.A. Antibiotic Resistance during COVID-19: A Systematic Review. Int. J. Environ. Res. Public Health 2022, 19, 11931. [Google Scholar] [CrossRef] [PubMed]
- Livermore, D.M. Antibiotic resistance during and beyond COVID-19. J. Antimicrob. Chemother. 2021, 3, i5–i16. [Google Scholar] [CrossRef] [PubMed]
- Bedenić, B.; Luxner, J.; Car, H.; Sardelić, S.; Bogdan, M.; Varda-Brki´c, D.; Šuto, S.; Grisold, A.; Beader, N.; Zarfel, G. Emergence and Spread of Enterobacterales with Multiple Carbapenemases after COVID-19 Pandemic. Pathogens 2023, 12, 677. [Google Scholar] [CrossRef] [PubMed]
- Faccone, D.; Gomez, S.A.; de Mendieta, J.M.; Sanz, M.B.; Echegorry, M.; Albornoz, E.; Lucero, C.; Ceriana, P.; Menocal, A.; Martino, F.; et al. Emergence of Hyper-Epidemic Clones of Enterobacterales Clinical Isolates Co-Producing KPC and Metallo-Beta-Lactamases during the COVID-19 Pandemic. Pathogens 2023, 12, 479. [Google Scholar] [CrossRef] [PubMed]
- Karampatakis, T.; Tsergouli, K.; Behzadi, P. Carbapenem-Resistant Klebsiella pneumoniae: Virulence Factors, Molecular Epidemiology and Latest Updates in Treatment Options. Antibiotics 2023, 12, 234. [Google Scholar] [CrossRef]
- Bush, K.; Bradford, P.A. Epidemiology of β-lactamase-producing pathogens. Clin. Microbiol. Rev. 2020, 33, e00047-19. [Google Scholar] [CrossRef]
- Gaibani, P.; Giani, T.; Bovo, F.; Lombardo, D.; Amadesi, S.; Lazzarotto, T.; Coppi, M.; Rossolini, G.M.; Ambretti, S. Resistance to Ceftazidime/Avibactam, Meropenem/Vaborbactam and Imipenem/Relebactam in Gram-Negative MDR Bacilli: Molecular Mechanisms and Susceptibility Testing. Antibiotics 2022, 11, 628. [Google Scholar] [CrossRef]
- Halat, D.H.; Moubareck, C.A. The Current Burden of Carbapenemases: Review of Significant Properties and Dissemination among Gram-Negative Bacteria. Antibiotics 2020, 9, 186. [Google Scholar] [CrossRef] [Green Version]
- Perez, F.; Bonomo, R.A. Carbapenem-Resistant Enterobacteriaceae: Global Action Required. Lancet Infect. Dis. 2019, 19, 561–562. [Google Scholar] [CrossRef]
- Lespada, M.I.; Córdova, E.; Roca, V.; Gómez, N.; Badía, M.; Rodriguez, C. Bacteremia caused by Klebsiella pneumoniae carbapenemase (KPC)-producing K. pneumoniae. A retrospective study of 7 years. Rev. Esp. Quim. 2019, 32, 15–21. [Google Scholar] [PubMed]
- Kumar, A.; Roberts, D.; Wood, K.E.; Light, B.; Parrillo, J.E.; Sharma, S.; Suppes, R.; Feinstein, D.; Zanotti, S.; Taiberg, L.; et al. Duration of hypotension before initiation of effective antimicrobial therapy is the critical determinant of survival in human septic shock. Crit. Care Med. 2006, 34, 1589–1596. [Google Scholar] [CrossRef]
- Liu, Q.; Liu, L.; Li, Y.; Chen, X.; Yan, Q.; Liu, W. Fecal Carriage and Epidemiology of Carbapenem-Resistant Enterobacteriaceae Among Hospitalized Patients in a University Hospital. Infect. Drug Resist. 2019, 12, 3935–3942. [Google Scholar] [CrossRef] [Green Version]
- Singh, K.; Mangold, K.A.; Wyant, K.; Schora, D.M.; Voss, B.; Kaul, K.L.; Hayden, M.K.; Chundi, V.; Peterson, L.R. Rectal Screening for Klebsiella pneumoniae Carbapenemases: Comparison of Real-Time PCR and Culture Using Two Selective Screening Agar Plates. J. Clin. Microbiol. 2012, 50, 2596–2600. [Google Scholar] [CrossRef] [Green Version]
- Moubareck, C.A.; Halat, D.H.; Sartawi, M.; Lawlor, K.; Sarkis, D.K.; Alatoom, A. Assessment of the performance of CHROMagar KPC and Xpert Carba-R assay for the detection of carbapenem-resistant bacteria in rectal swabs: First comparative study from Abu Dhabi, United Arab Emirates. J. Glob. Antimicrob. Res. 2020, 20, 147–152. [Google Scholar] [CrossRef]
- Tamma, P.D.; Simner, P.J. Phenotypic detection of carbapenemase producing organisms from clinical isolates. J. Clin. Microbiol. 2018, 56, e01140-18. [Google Scholar] [CrossRef] [Green Version]
- Chen, L.; Mathema, B.; Chavda, K.D.; DeLeo, F.R.; Bonomo, R.A.; Kreiswirth, B.N. Carbapenemase-producing Klebsiella pneumoniae: Molecular and genetic decoding. Trends Microbiol. 2014, 22, 686–696. [Google Scholar] [CrossRef] [Green Version]
- Pires, J.; Novais, A.; Peixe, L. Blue-carba, an easy biochemical test for detection of diverse carbapenemase producers directly from bacterial cultures. J. Clin. Microbiol. 2013, 51, 4281. [Google Scholar] [CrossRef] [Green Version]
- Osterblad, M.; Hakanen, A.J.; Jalava, J. Evaluation of the Carba NP test for carbapenemase detection. Antimicrob. Agents Chemother. 2014, 58, 7553–7556. [Google Scholar] [CrossRef] [Green Version]
- Johnsson, A.T.A.; Wong, A.Y.W.; Özenci, V. The impact of delayed analysis of positive blood cultures on the performance of short-term culture followed by MALDI-TOF MS. J. Microbiol. Methods 2020, 177, 106027. [Google Scholar] [CrossRef]
- Nastro, M.; Ayora, M.; García, S.; Vay, C.; Famiglietti, A.; Rodriguez, C.H. Rapid Blue-Carba test: Reduction in the detection time of carbapenemases performed from a 4-h bacterial lawn. J. Chemother. 2017, 29, 150–153. [Google Scholar] [CrossRef]
- Maugeri, G.; Lychko, I.; Sobral, R.; Roque, A.C.A. Identification and Antibiotic-Susceptibility Profiling of Infectious Bacterial Agents: A Review of Current and Future Trends. Biotechnol. J. 2019, 14, e1700750. [Google Scholar] [CrossRef] [PubMed]
- Clark, A.E.; Kaleta, E.J.; Arora, A.; Wolk, D.M. Matrix-assisted laser desorption ionization-time of flight mass spectrometry: A fundamental shift in the routine practice of clinical microbiology. Clin. Microbiol. Rev. 2013, 26, 547–603. [Google Scholar] [CrossRef] [PubMed] [Green Version]
- Li, D.; Yi, J.; Han, G.; Qiao, L. MALDI-TOF Mass Spectrometry in Clinical Analysis and Research. ACS Meas. Sci. Au. 2022, 2, 385–404. [Google Scholar] [CrossRef]
- Torres-Sangiao, E.; Leal Rodriguez, C.; García-Riestra, C. Application and Perspectives of MALDI–TOF Mass Spectrometry in Clinical Microbiology Laboratories. Microorganisms 2021, 9, 1539. [Google Scholar] [CrossRef] [PubMed]
- Oviaño, M.; Bou, G. Matrix-Assisted Laser Desorption Ionization-Time of Flight Mass Spectrometry for the Rapid Detection of Antimicrobial Resistance Mechanisms and Beyond. Clin. Microbiol. Rev. 2019, 32, e00037-18. [Google Scholar] [CrossRef] [Green Version]
- Gato, E.; Arroyo, M.J.; Méndez, G.; Candela, A.; Rodiño-Janeiro, B.K.; Fernández, J.; Rodríguez-Sánchez, B.; Mancera, L.; Arca-Suárez, J.; Beceiro, A.; et al. Direct Detection of Carbapenemase-Producing Klebsiella pneumoniae by MALDI-TOF Analysis of Full Spectra Applying Machine Learning. J. Clin. Microbiol. 2023, 61, e0175122. [Google Scholar] [CrossRef]
- Zhang, Y.M.; Tsao, M.F.; Chang, C.Y.; Lin, K.T.; Keller, J.J.; Lin, H.C. Rapid identification of carbapenem-resistant Klebsiella pneumoniae based on matrix-assisted laser desorption ionization time-of-flight mass spectrometry and an artificial neural network model. J. Biomed Sci. 2023, 30, 25. [Google Scholar] [CrossRef]
- Yu, J.; Lin, Y.T.; Chen, W.C.; Tseng, K.H.; Lin, H.H.; Tien, N.; Cho, C.F.; Huan, J.Y.; Liang, S.J.; Ho, L.C.; et al. Direct prediction of carbapenem-resistant, carbapenemase-producing, and colistin-resistant Klebsiella pneumoniae isolates from routine MALDI-TOF mass spectra using machine learning and outcome evaluation. Int. J. Antimicrob. Agents 2023, 61, 106799. [Google Scholar] [CrossRef]
- Espinosa, R.F.; Rumi, V.; Marchisio, M.; Cejas, D.; Radice, M.; Vay, C.; Barrios, R.; Gutkind, G.; Di Conza, J. Fast and easy detection of CMY-2 in Escherichia coli by direct MALDI-TOF mass spectrometry. J. Microbiol. Methods 2018, 148, 20–28. [Google Scholar] [CrossRef]
- Figueroa-Espinosa, R.; Costa, A.; Cejas, D.; Barrios, R.; Vay, C.; Radice, M.; Gutkind, G.; Di Conza, J. MALDI-TOF MS based procedure to detect KPC-2 directly from positive blood culture bottles and colonies. J. Microbiol. Methods 2019, 159, 120–127. [Google Scholar] [CrossRef]
- Figueroa-Espinosa, R.; Costa, A.; Cejas, D.; Magariños, F.; Nicola, F.; Rodriguez, C.H.; Vay, C.; Radice, M.; Gutkind, G.; Di Conza, J. Ensayo preliminar para la detección de variantes de KPC- (KPC-2, KPC-3, KPC-8 y KPC-31) por espectrometría de masas MALDI-TOF a partir de aislamientos clínicos. In Proceedings of the Sociedad Argentina de Infectología Congress, Buenos Aires, Argentina, 25–27 October 2021. [Google Scholar]
- Tsakris, A.; Kristo, I.; Poulou, A.; Themeli-Digalaki, K.; Ikonomidis, A.; Petropoulou, D.; Pournaras, S.; Sofianou, D. Evaluation of boronic acid disk tests for differentiating KPC-possessing Klebsiella pneumoniae isolates in the clinical laboratory. J. Clin. Microbiol. 2009, 47, 362–367. [Google Scholar] [CrossRef] [Green Version]
- Dominguez, J.E.; Redondo, L.M.; Figueroa Espinosa, R.A.; Cejas, D.; Gutkind, G.O.; Chacana, P.A.; Di Conza, J.A.; Fernandez Miyakawa, M.E. Simultaneous carriage of mcr-1 and other antimicrobial resistance determinants in Escherichia coli from poultry. Front. Microbiol. 2018, 9, 1679. [Google Scholar] [CrossRef] [Green Version]
- Madonna, A.J.; Basile, F.; Ferrer, I.; Meetani, M.A.; Rees, J.C.; Voorhees, K.J. On-probe sample pretreatment for the detection of proteins above 15 KDa from whole cell bacteria by matrix-assisted laser desorption/ionization time-of-flight mass spectrometry. Rapid Commu. Mass Spectrom. 2000, 14, 2220–2229. [Google Scholar] [CrossRef]
- Meetani, M.A.; Voorhees, K.J. MALDI Mass Spectrometry Analysis of High Molecular Weight Proteins from Whole Bacterial Cells: Pretreatment of Samples with Surfactants. J. Am. Soc. Mass Spectrom. 2005, 16, 1422–1426. [Google Scholar] [CrossRef] [Green Version]
- Clark, R.B.; Lewinski, M.A.; Loeffelholz, M.J.; Tibbets, R.J. Verification and Validation of Procedures in the Clinical Microbiology Laboratory, Coordinating ed.; Cumitech31A; Sharp, S.E., Ed.; ASM Press: Washington, DC, USA, 2009. [Google Scholar]
- Red Nacional de Espectrometría de Masas Aplicada al Laboratorio de Microbiología Clínica. Available online: http://www.anlis.gov.ar/renaem/ (accessed on 20 May 2023).
- Youn, J.H.; Drake, S.K.; Weingarten, R.A.; Frank, K.M.; Dekker, J.P.; Lau, A.F. Clinical performance of a matrix-assisted laser desorption ionization-time of flight mass spectrometry method for detection of certain blaKPC-containing plasmids. J. Clin. Microbiol. 2016, 54, 35–42. [Google Scholar] [CrossRef] [Green Version]
- Gaibani, P.; Galea, A.; Fagioni, M.; Ambretti, S.; Sambri, V.; Landini, M.P. Evaluation of matrix-assisted laser desorption ionization-time of flight mass spectrometry for identification of KPC-producing Klebsiella pneumoniae. J. Clin. Microbiol. 2016, 54, 2609–2613. [Google Scholar] [CrossRef] [Green Version]
- Centonze, A.R.; Bertoncelli, A.; Savio, C.; Orza, P.; Bedenic, B.; Mazzariol, A. Evaluation of rapid KPC carbapenemase detection method based on MALDI-TOF VITEK MS spectra analysis. J. Med. Microbiol. 2018, 67, 1474–1479. [Google Scholar] [CrossRef]
- Ketterlinus, R.; Hsieh, S.; Teng, S.; Lee, H.; Pusch, W. Fishing for biomarkers: Analyzing mass spectrometry data with the new ClinProTools software. Biotechniques 2005, 38, 37–40. [Google Scholar] [CrossRef]
- CLSI. Performance standards for antimicrobial susceptibility testing. In 33rd Informational Supplement M100; USACLSI: Wayne, PA, USA, 2023. [Google Scholar]
- Moreira, N.K.; Wilhelm, C.M.; Wink, P.L.; Barth, A.L.; Caierão. MALDI-TOF mass spectrometry for direct KPC detection among Enterobacterales. Braz. J. Microbiol. 2022. published online. [Google Scholar] [CrossRef]
- Moreira, N.K.; Wilhelm, C.M.; Echevarria, A.D.; Volpato, F.C.Z.; Wink, P.L.; Barth, A.L.; Caierão, J. Direct Detection of KPC Peak from Positive Blood Cultures Using MALDI-TOF MS: Are We There Yet? Antibiotics 2023, 12, 601. [Google Scholar] [CrossRef]
- Yoon, E.-J.; Lee, E.H.; Hwang, D.H.; Lee, H.; Baek, J.-H.; Jeong, S.H. Direct detection of intact Klebsiella pneumoniae carbapenemases produced by Enterobacterales using MALDI-TOF MS. J. Antimicrob. Chemother. 2020, 75, 1174–1181. [Google Scholar] [CrossRef] [PubMed]
- Lau, A.F.; Wang, H.; Weingarten, R.A.; Drake, S.K.; Suffredini, A.F.; Garfield, M.K.; Chen, Y.; Gucek, M.; Youn, J.-H.; Stock, F.; et al. A Rapid Matrix-Assisted Laser Desorption Ionization–Time of Flight Mass Spectrometry-Based Method for Single-Plasmid Tracking in an Outbreak of Carbapenem-Resistant Enterobacteriaceae. J. Clin. Microbiol. 2014, 52, 2804–2812. [Google Scholar] [CrossRef] [PubMed] [Green Version]
- González, L.J.; Bahr, G.; Nakashige, T.G.; Nolan, E.M.; Bonomo, R.A.; Vila, A.J. Membrane-anchoring stabilizes and favors secretion of New Delhi Metallo-β-lactamase. Nat. Chem. Biol. 2016, 12, 516–522. [Google Scholar] [CrossRef] [PubMed] [Green Version]


| Species | Total Isolates | KPC-Producing Isolates | Non-KPC-Producing Isolates |
|---|---|---|---|
| Simulated positive blood cultures and short-term cultures | |||
| K. pneumoniae | 60 | 32 | 28 |
| E. coli | 33 | 5 | 28 |
| Total | 93 | 37 | 56 |
| Isolated colonies | |||
| K. pneumoniae | 60 | 39 | 21 |
| E. coli | 28 | 4 | 24 |
| E. cloacae complex | 12 | 7 | 5 |
| C. braakii | 3 | 1 | 2 |
| S. marcescens | 15 | 4 | 11 |
| Total | 118 | 55 | 63 |
| Sample | Hospital Routine ID | ID from BC | KPC Peak m/z from BC (Da) | Intensity (a.u.) | Peak at m/z ~11,109 Da | Resistance Markers |
|---|---|---|---|---|---|---|
| 1HD02 | K. pneumoniae | K. pneumoniae | 28,687 | 762 | (+) | blaKPC-2 |
| 1HD19 | K. pneumoniae | K. pneumoniae | 28,722 | 221 | Absent | blaKPC-2 |
| 1HD21 | K. pneumoniae | K. pneumoniae | 28,655 | 1095 | (+) | blaKPC-2 |
| 1HD22 | K. pneumoniae | K. pneumoniae | 28,660 | 613 | (+) | blaKPC-2 |
| HD63 | K. pneumoniae | K. pneumoniae | 28,736 | 355 | Absent | blaKPC-2 |
| HD64 | K. pneumoniae | K. pneumoniae | 28,725 | 311 | Absent | blaKPC-2 |
| HD65 | K. pneumoniae | K. pneumoniae | 28,740 | 610 | Absent | blaKPC-2 |
| 1HD03 * | K. pneumoniae | NRI | NA | NA | NA | blaKPC-2 |
| HD01 | K. pneumoniae | K. pneumoniae | Absent | 27 | Absent | NCD |
| HD02 | K. pneumoniae | K. pneumoniae | Absent | 130 | Absent | NCD |
| HD03 | K. pneumoniae | K. pneumoniae | Absent | 50 | Absent | NCD |
| HD04 | K. pneumoniae | K. pneumoniae | Absent | 40 | Absent | NCD |
| HD06 | K. pneumoniae | K. pneumoniae | Absent | 11 | Absent | NCD |
| HD07 | K. pneumoniae | K. pneumoniae | Absent | 0 | Absent | NCD |
| HD08 | E. coli | E. coli | Absent | 0 | Absent | NCD |
| HD10 | E. coli | E. coli | Absent | 30 | Absent | NCD |
| HD11 | E. coli | E. coli | Absent | 33 | Absent | NCD |
| HD12 | E. coli | E. coli | Absent | 28 | Absent | NCD |
| HD14 | E. coli | E. coli | Absent | 80 | Absent | NCD |
| HD15 | K. pneumoniae | K. pneumoniae | Absent | 154 | Absent | NCD |
| HD16 | E. coli | E. coli | Absent | 24 | Absent | NCD |
| HD18 | E. coli | E. coli | Absent | 143 | Absent | NCD |
| HD20* | E. coli | NRI | NA | NA | NA | NCD |
| HD21 | E. coli | E. coli | Absent | 62 | Absent | NCD |
| HD22 | E. coli | E. coli | Absent | 69 | Absent | NCD |
| HD23 | K. pneumoniae | K. variicola | Absent | 0 | Absent | NCD |
| HD24 | K. pneumoniae | K. pneumoniae | Absent | 20 | Absent | NCD |
| HD25* | K. pneumoniae | NRI | NA | NA | NA | NCD |
| HD26* | E. coli | NRI | NA | NA | NA | NCD |
| HD27* | K. pneumoniae | NRI | NA | NA | NA | NCD |
| HD28 | E. coli | E. coli | Absent | 34 | Absent | NCD |
| HD29 | E. coli | E. coli | Absent | 78 | Absent | NCD |
| HD30 | E. coli | E. coli | Absent | 8 | Absent | NCD |
| HD33 | K. pneumoniae | K. variicola | Absent | 106 | Absent | NCD |
| HD35 | P. mirabilis | P. mirabilis | Absent | 88 | Absent | NCD |
| HD36 | E. coli | E. coli | Absent | 125 | Absent | NCD |
| HD40 | K. pneumoniae | K. pneumoniae | Absent | 65 | Absent | NCD |
| HD42 | E. coli | E. coli | Absent | 33 | Absent | NCD |
| HD43 | E. coli | E. coli | Absent | 122 | Absent | NCD |
| HD44 | E. coli | E. coli | Absent | 68 | Absent | NCD |
| HD45 | E. coli | E. coli | Absent | 6 | Absent | NCD |
| HD47 | K. pneumoniae | K. pneumoniae | Absent | 71 | Absent | NCD |
| HD48 | K. pneumoniae | K. pneumoniae | Absent | 55 | Absent | NCD |
| HD49 | K. pneumoniae | K. pneumoniae | Absent | 69 | Absent | NCD |
| HD50 | K. pneumoniae | K. pneumoniae | Absent | 29 | Absent | NCD |
| HD51 | K. pneumoniae | K. pneumoniae | Absent | 87 | Absent | NCD |
| HD52* | K. pneumoniae | NRI | NA | NA | NA | NCD |
| HD53 | E. coli | E. coli | Absent | 29 | Absent | NCD |
| HD54 | K. variicola | K. pneumoniae | Absent | 15 | Absent | NCD |
| HD56 | K. pneumoniae | K. pneumoniae | Absent | 97 | Absent | NCD |
| HD57 | K. pneumoniae | K. pneumoniae | Absent | 64 | Absent | NCD |
| HD59 | E. cloacae complex | E. hormaechei | Absent | 176 | Absent | NCD |
| HD61 | E. coli | E. coli | Absent | 21 | Absent | NCD |
| HD62 | E. coli | E. coli | Absent | 24 | Absent | NCD |
| 1HD01 * | E. cloacae complex | NRI | NA | NA | NA | NCD |
| 1HD04 | S. marcescens | S. marcescens | Absent | 7 | Absent | NCD |
| 1HD05 | S. marcescens | S. marcescens | Absent | 20 | Absent | NCD |
| 1HD06 | K. pneumoniae | K. pneumoniae | Absent | 2 | Absent | NCD |
| 1HD07 | K. pneumoniae | K. pneumoniae | Absent | 7 | Absent | NCD |
| 1HD08 | K. pneumoniae | K. pneumoniae | Absent | 7 | Absent | blaNDM |
| 1HD09 | E. coli | E. coli | Absent | 7 | Absent | NCD |
| 1HD10 | E. coli | E. coli | Absent | 8 | Absent | NCD |
| 1HD11 | K. pneumoniae | K. pneumoniae | Absent | 7 | Absent | blaNDM |
| 1HD12 | K. pneumoniae | K. pneumoniae | Absent | 5 | Absent | blaNDM |
| 1HD13 | K. pneumoniae | K. pneumoniae | Absent | 6 | Absent | blaNDM |
| 1HD14 | K. pneumoniae | K. pneumoniae | Absent | 5 | Absent | blaNDM |
| 1HD15 | K. pneumoniae | K. pneumoniae | Absent | 47 | Absent | blaNDM |
| 1HD16 | K. pneumoniae | K. pneumoniae | Absent | 55 | Absent | blaNDM |
| 1HD17 | S. marcescens | S. marcescens | Absent | 11 | Absent | NCD |
| 1HD18 | S. marcescens | S. marcescens | Absent | 46 | Absent | NCD |
| 1HD20 | K. pneumoniae | K. pneumoniae | Absent | 14 | Absent | NCD |
| 1HD23 | K. pneumoniae | K. pneumoniae | Absent | 9 | Absent | NCD |
| 1HD24 | K. pneumoniae | K. pneumoniae | Absent | 12 | Absent | blaNDM |
| 1HD25 | K. pneumoniae | K. pneumoniae | Absent | 4 | Absent | blaNDM |
| 1HD26 | K. pneumoniae | K. pneumoniae | Absent | 12 | Absent | blaNDM |
| 1HD27 | S. marcescens | S. marcescens | Absent | 11 | Absent | NCD |
| 1HD28 | K. pneumoniae | K. pneumoniae | Absent | 6 | Absent | NCD |
| 1HD29 | K. pneumoniae | K. pneumoniae | Absent | 9 | Absent | NCD |
| Sample | Hospital Routine ID | ID from STC | KPC Peak m/z from STC (Da) | Intensity (a.u.) | Peak at m/z ~11,109 Da | Resistance Markers |
|---|---|---|---|---|---|---|
| 1HC02 | K. pneumoniae | K. pneumoniae | 28,686 | 1031 | (+) | blaKPC-2 |
| 1HC03 | K. pneumoniae | K. pneumoniae | 28,679 | 1013 | (+) | blaKPC-2 |
| 1HC19 | K. pneumoniae | K. pneumoniae | 28,728 | 1283 | Absent | blaKPC-2 |
| 1HC21 | K. pneumoniae | K. pneumoniae | 28,675 | 823 | (+) | blaKPC-2 |
| 1HC22 | K. pneumoniae | K. pneumoniae | 28,675 | 848 | Absent | blaKPC-2 |
| HC63 | K. pneumoniae | K. pneumoniae | 28,660 | 637 | Absent | blaKPC-2 |
| HC64 | K. pneumoniae | K. pneumoniae | 28,662 | 415 | Absent | blaKPC-2 |
| HC65 | K. pneumoniae | K. pneumoniae | 28,676 | 261 | Absent | blaKPC-2 |
| HC01 | K. pneumoniae | K. pneumoniae | Absent | 49 | Absent | NCD |
| HC02 | K. pneumoniae | K. pneumoniae | Absent | 102 | Absent | NCD |
| HC03 | K. pneumoniae | K. pneumoniae | Absent | 117 | Absent | NCD |
| HC04 | K. pneumoniae | K. pneumoniae | Absent | 70 | Absent | NCD |
| HC06 | K. pneumoniae | K. pneumoniae | Absent | 427 | Absent | NCD |
| HC07 | K. pneumoniae | K. pneumoniae | Absent | 18 | Absent | NCD |
| HC08 | E. coli | E. coli | Absent | 149 | Absent | NCD |
| HC10 | E. coli | E. coli | Absent | 24 | Absent | NCD |
| HC11 | E. coli | E. coli | Absent | 103 | Absent | NCD |
| HC12 | E. coli | E. coli | Absent | 50 | Absent | NCD |
| HC14 | E. coli | E. coli | Absent | 45 | Absent | NCD |
| HC15 | K. pneumoniae | K. pneumoniae | Absent | 121 | Absent | NCD |
| HC16 | E. coli | E. coli | Absent | 47 | Absent | NCD |
| HC18 | E. coli | E. coli | Absent | 37 | Absent | NCD |
| HC20 | E. coli | E. coli | Absent | 23 | Absent | NCD |
| HC21 | E. coli | E. coli | Absent | 124 | Absent | NCD |
| HC22 | E. coli | E. coli | Absent | 39 | Absent | NCD |
| HC23 | K. pneumoniae | K. variicola | Absent | 405 | Absent | NCD |
| HC24 | K. pneumoniae | K. variicola | Absent | 445 | Absent | NCD |
| HC25 | K. pneumoniae | K. variicola | Absent | 192 | Absent | NCD |
| HC26 | E. coli | E. coli | Absent | 48 | Absent | NCD |
| HC27 | K. pneumoniae | K. variicola | Absent | 63 | Absent | NCD |
| HC28 | E. coli | E. coli | Absent | 45 | Absent | NCD |
| HC29 | E. coli | E. coli | Absent | 334 | Absent | NCD |
| HC30 | E. coli | E. coli | Absent | 112 | Absent | NCD |
| HC33 | K. pneumoniae | K. variicola | Absent | 22 | Absent | NCD |
| HC35 | P. mirabilis | P. mirabilis | Absent | 158 | Absent | NCD |
| HC36 | E. coli | E. coli | Absent | 311 | Absent | NCD |
| HC40 | K. pneumoniae | K. pneumoniae | Absent | 329 | Absent | NCD |
| HC42 | E. coli | E. coli | Absent | 163 | Absent | NCD |
| HC43 | E. coli | E. coli | Absent | 116 | Absent | NCD |
| HC44 | E. coli | E. coli | Absent | 106 | Absent | NCD |
| HC45 | E. coli | E. coli | Absent | 330 | Absent | NCD |
| HC47 | K. pneumoniae | K. pneumoniae | Absent | 52 | Absent | NCD |
| HC48 | K. pneumoniae | K. pneumoniae | Absent | 157 | Absent | NCD |
| HC49 | K. pneumoniae | K. pneumoniae | Absent | 60 | Absent | NCD |
| HC50 | K. pneumoniae | K. pneumoniae | Absent | 103 | Absent | NCD |
| HC51 | K. pneumoniae | K. pneumoniae | Absent | 93 | Absent | NCD |
| HC52 | K. pneumoniae | K. pneumoniae | Absent | 15 | Absent | NCD |
| HC53 | E. coli | E. coli | Absent | 3 | Absent | NCD |
| HC54 | K. variicola | K. variicola | Absent | 10 | Absent | NCD |
| HC56 | K. pneumoniae | K. pneumoniae | Absent | 111 | Absent | NCD |
| HC57 | K. pneumoniae | K. pneumoniae | Absent | 265 | Absent | NCD |
| HC59 | E. cloacae complex | E hormaechei | Absent | 520 | Absent | NCD |
| HC61 | E. coli | E. coli | Absent | 13 | Absent | NCD |
| HC62 | E. coli | E. coli | Absent | 30 | Absent | NCD |
| 1HC01 | E. cloacae complex | E. cloacae | Absent | 13 | Absent | NCD |
| 1HC04 | S. marcescens | S. marcescens | Absent | 4 | Absent | NCD |
| 1HC05 | S. marcescens | S. ureilytica | Absent | 11 | Absent | NCD |
| 1HC06 | K. pneumoniae | K. pneumoniae | Absent | 2 | Absent | NCD |
| 1HC07 | K. pneumoniae | K. pneumoniae | Absent | 3 | Absent | NCD |
| 1HC08 | K. pneumoniae | K. pneumoniae | Absent | 5 | Absent | blaNDM |
| 1HC09 | E. coli | E. coli | Absent | 16 | Absent | NCD |
| 1HC10 | E. coli | E. coli | Absent | 9 | Absent | NCD |
| 1HC11 | K. pneumoniae | K. pneumoniae | Absent | 7 | Absent | blaNDM |
| 1HC12 | K. pneumoniae | K. pneumoniae | Absent | 13 | Absent | blaNDM |
| 1HC13 | K. pneumoniae | K. pneumoniae | Absent | 0 | Absent | blaNDM |
| 1HC14 | K. pneumoniae | K. pneumoniae | Absent | 13 | Absent | blaNDM |
| 1HC15 | K. pneumoniae | K. pneumoniae | Absent | 94 | Absent | blaNDM |
| 1HC16 | K. pneumoniae | K. pneumoniae | Absent | 62 | Absent | blaNDM |
| 1HC17 | S. marcescens | S. marcescens | Absent | 38 | Absent | NCD |
| 1HC18 | S. marcescens | S. marcescens | Absent | 9 | Absent | NCD |
| 1HC20 | K. pneumoniae | K. pneumoniae | Absent | 34 | Absent | NCD |
| 1HC23 | K. pneumoniae | K. pneumoniae | Absent | 25 | Absent | NCD |
| 1HC24 | K. pneumoniae | K. pneumoniae | Absent | 46 | Absent | blaNDM |
| 1HC25 | K. pneumoniae | K. pneumoniae | Absent | 91 | Absent | blaNDM |
| 1HC26 | K. pneumoniae | K. pneumoniae | Absent | 83 | Absent | blaNDM |
| 1HC27 | S. marcescens | S. marcescens | Absent | 31 | Absent | NCD |
| 1HC28 | K. pneumoniae | K. pneumoniae | Absent | 9 | Absent | NCD |
| 1HC29 | K. pneumoniae | K. pneumoniae | Absent | 16 | Absent | NCD |
| Sample | Hospital Routine ID | ID from COL | KPC Peak m/z from COL (Da) | Intensity (a.u.) | Peak at m/z ~11,109 Da | Resistance Markers |
|---|---|---|---|---|---|---|
| POR02 | K. pneumoniae | K. pneumoniae | 28,662 | 1734 | (+) | blaKPC-2, blaNDM |
| POR03 | K. pneumoniae | K. pneumoniae | 28,685 | 1203 | (+) | blaKPC-2, blaNDM |
| POR06 | K. pneumoniae | K. pneumoniae | 28,712 | 735 | (+) | blaKPC-3 |
| POR08 | K. pneumoniae | K. pneumoniae | 28,679 | 1158 | (+) | blaKPC-2 |
| POR09 | K. pneumoniae | K. pneumoniae | 28,710 | 1227 | (+) | blaKPC-3 |
| POR11 | K. pneumoniae | K. pneumoniae | 28,686 | 3184 | (+) | blaKPC-2, blaNDM |
| POR14 | K. pneumoniae | K. pneumoniae | 28,716 | 2567 | (+) | blaKPC-3 |
| POR15 | K. pneumoniae | K. pneumoniae | 28,704 | 2829 | (+) | blaKPC-2, blaNDM |
| POR16 | K. pneumoniae | K. pneumoniae | 28,676 | 3949 | (+) | blaKPC-2, blaNDM |
| POR17 | K. pneumoniae | K. pneumoniae | 28,681 | 2386 | (+) | blaKPC-2, blaNDM |
| POR18 | K. pneumoniae | K. pneumoniae | 28,687 | 2555 | (+) | blaKPC-3 |
| POR21 | K. pneumoniae | K. pneumoniae | 28,706 | 2963 | (+) | blaKPC-3 |
| POR23 | K. pneumoniae | K. pneumoniae | 28,685 | 1086 | (+) | blaKPC-2 |
| POR29 | K. pneumoniae | K. pneumoniae | 28,675 | 727 | Absent | blaKPC-2, blaNDM |
| UC16 | K. pneumoniae | K. pneumoniae | 28,668 | 1321 | (+) | blaKPC-2 |
| UC24 | K. pneumoniae | K. pneumoniae | 28,677 | 1095 | Absent | blaKPC-2 |
| UC75 | K. pneumoniae | K. pneumoniae | 28,675 | 1546 | (+) | blaKPC-2 |
| COL65 | K. pneumoniae | K. pneumoniae | 28,680 | 1461 | Absent | blaKPC-2 |
| POR01 | K. pneumoniae | K. pneumoniae | Absent | 120 | Absent | blaNDM |
| POR04 | K. pneumoniae | K. pneumoniae | Absent | 211 | Absent | blaNDM |
| POR07 | K. pneumoniae | K. pneumoniae | Absent | 4 | Absent | blaNDM |
| POR10 | K. pneumoniae | K. pneumoniae | Absent | 29 | Absent | blaNDM |
| POR19 | K. pneumoniae | K. pneumoniae | Absent | 519 | Absent | blaNDM |
| POR20 | K. pneumoniae | K. pneumoniae | Absent | 72 | Absent | blaNDM |
| POR22 | K. pneumoniae | K. pneumoniae | Absent | 403 | Absent | blaNDM |
| POR26 | K. pneumoniae | K. pneumoniae | Absent | 17 | Absent | blaNDM |
| POR27 | K. pneumoniae | K. pneumoniae | Absent | 105 | Absent | blaNDM |
| POR28 | K. pneumoniae | K. pneumoniae | Absent | 74 | Absent | blaNDM |
| POR30 | K. pneumoniae | K. pneumoniae | Absent | 27 | Absent | blaNDM |
| UC20 | K. pneumoniae | K. pneumoniae | Absent | 65 | Absent | blaNDM |
| UC40 | K. pneumoniae | K. pneumoniae | Absent | 58 | Absent | blaIMP |
| UC42 | K. pneumoniae | K. pneumoniae | Absent | 60 | Absent | blaNDM |
| UC47 | K. pneumoniae | K. pneumoniae | Absent | 140 | Absent | blaNDM |
| UC76 | K. pneumoniae | K. pneumoniae | Absent | 20 | Absent | blaNDM |
| UC104 | K. pneumoniae | K. pneumoniae | Absent | 67 | Absent | blaIMP |
| UC105 | K. pneumoniae | K. pneumoniae | Absent | 73 | Absent | blaNDM |
| UC107 | P. mirabilis | P. mirabilis | Absent | 18 | Absent | blaNDM |
| Parameter | Positive BC | STC | COL | Overall |
|---|---|---|---|---|
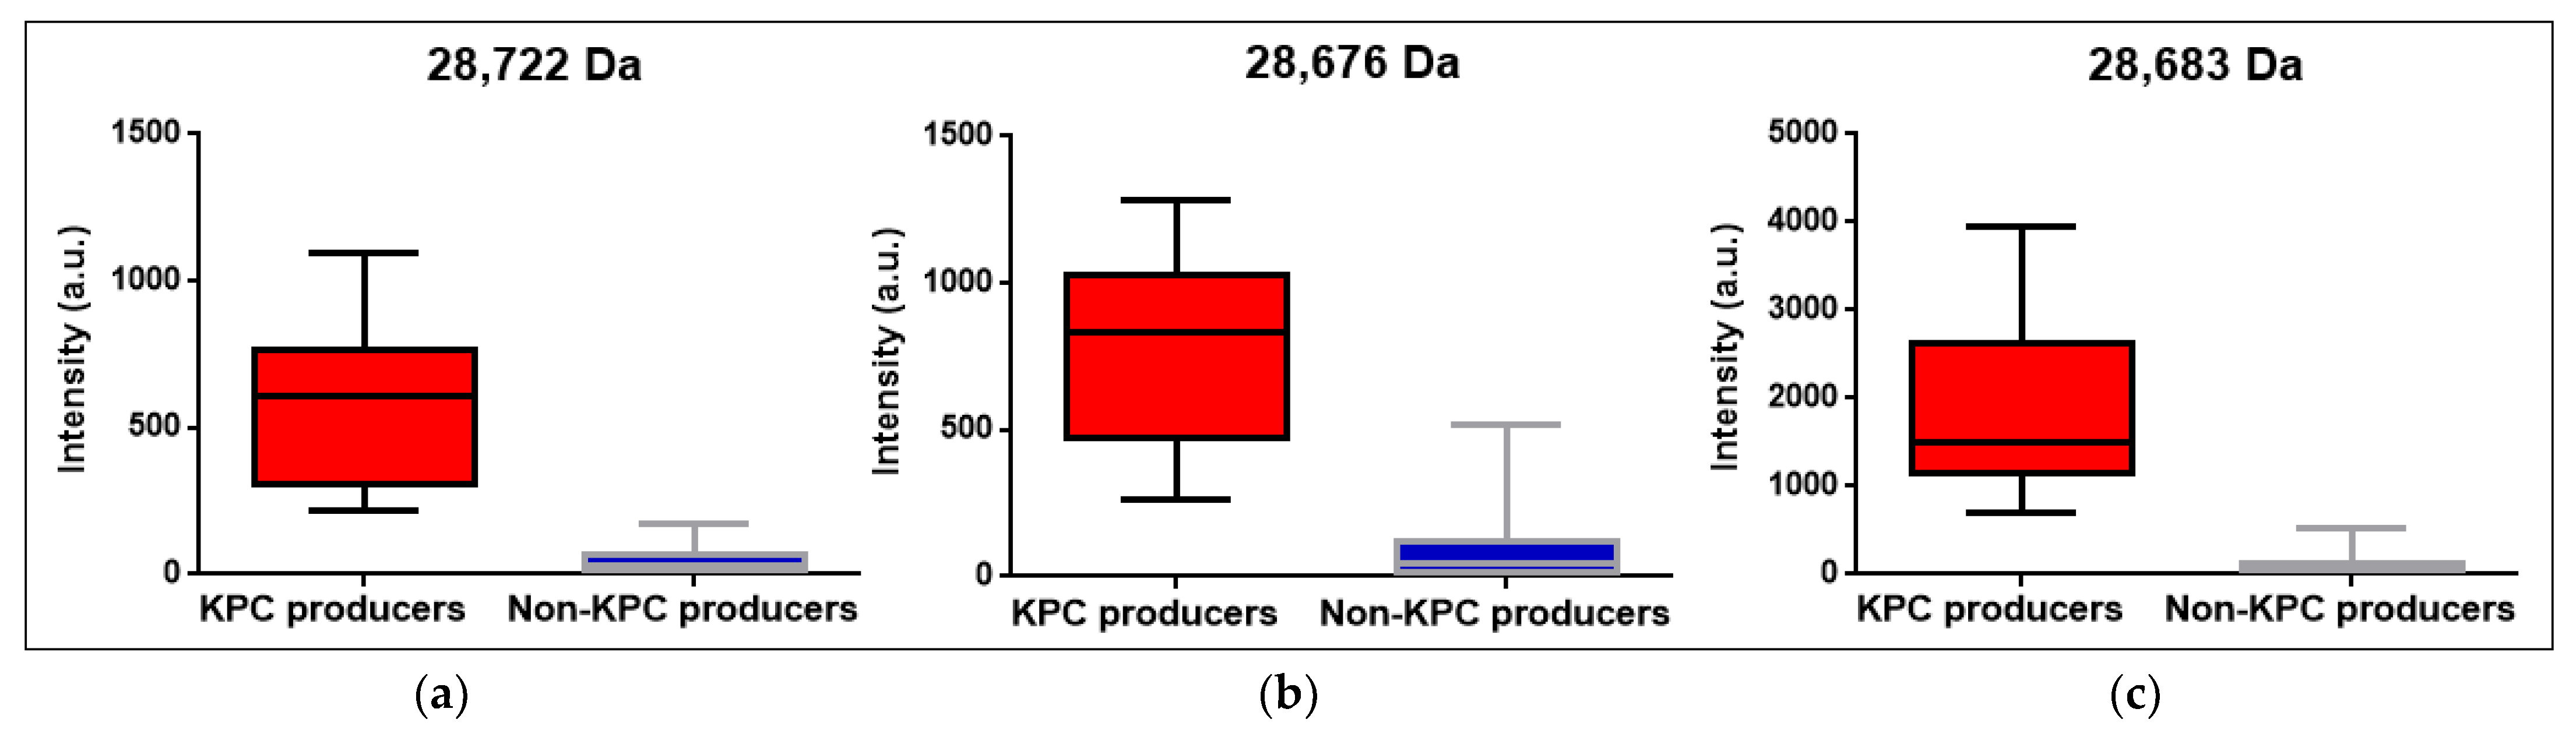
| KPC m/z median | 28,722 Da CI95%: [28,655 Da; 28,740 Da] | 28,676 Da CI95%: [28,660 Da; 28,728 Da] | 28,683 Da CI95%: [28,676 Da; 28,698 Da] | 28,681 Da CI95%: [28,676 Da; 28,687 Da] |
| KPC m/z intensity median and range (KPC producers) | 610 a.u. (221 a.u.–1095 a.u.) | 835.5 a.u. (261 a.u.–1283 a.u.) | 1503.5 a.u. (727 a.u.–3949 a.u.) | 1095 a.u. (221 a.u.–3949 a.u.) |
| KPC m/z intensity median and range (non-KPC producers) | 27.5 a.u. (0 a.u.–176 a.u.) | 48.5 a.u. (0 a.u.–520 a.u.) | 67 a.u. (4 a.u.–519 a.u.) | 46 a.u. (0 a.u.–520 a.u.) |
| KPC detection sensibility | 100% CI95%: [77%; 100%] | 100% CI95%: [79%; 100%] | 100% CI95%: [90%; 100%] | 100% CI95%: [95%; 100%] |
| KPC detection specificity | 100% CI95%: [97%; 100%] | 100% CI95%: [97%; 100%] | 100% CI95%: [91%; 100%] | 100% CI95%: [99%; 100%] |
Disclaimer/Publisher’s Note: The statements, opinions and data contained in all publications are solely those of the individual author(s) and contributor(s) and not of MDPI and/or the editor(s). MDPI and/or the editor(s) disclaim responsibility for any injury to people or property resulting from any ideas, methods, instructions or products referred to in the content. |
© 2023 by the authors. Licensee MDPI, Basel, Switzerland. This article is an open access article distributed under the terms and conditions of the Creative Commons Attribution (CC BY) license (https://creativecommons.org/licenses/by/4.0/).
Share and Cite
Costa, A.; Figueroa-Espinosa, R.; Martínez, J.A.; Fernández-Canigia, L.; Maldonado, M.I.; Bergese, S.A.; Schneider, A.E.; Vay, C.; Rodriguez, C.H.; Nastro, M.; et al. MALDI-TOF MS-Based KPC Direct Detection from Patients’ Positive Blood Culture Bottles, Short-Term Cultures, and Colonies at the Hospital. Pathogens 2023, 12, 865. https://doi.org/10.3390/pathogens12070865
Costa A, Figueroa-Espinosa R, Martínez JA, Fernández-Canigia L, Maldonado MI, Bergese SA, Schneider AE, Vay C, Rodriguez CH, Nastro M, et al. MALDI-TOF MS-Based KPC Direct Detection from Patients’ Positive Blood Culture Bottles, Short-Term Cultures, and Colonies at the Hospital. Pathogens. 2023; 12(7):865. https://doi.org/10.3390/pathogens12070865
Chicago/Turabian StyleCosta, Agustina, Roque Figueroa-Espinosa, Jerson A. Martínez, Liliana Fernández-Canigia, María I. Maldonado, Silvina A. Bergese, Ana E. Schneider, Carlos Vay, Carlos H. Rodriguez, Marcela Nastro, and et al. 2023. "MALDI-TOF MS-Based KPC Direct Detection from Patients’ Positive Blood Culture Bottles, Short-Term Cultures, and Colonies at the Hospital" Pathogens 12, no. 7: 865. https://doi.org/10.3390/pathogens12070865
APA StyleCosta, A., Figueroa-Espinosa, R., Martínez, J. A., Fernández-Canigia, L., Maldonado, M. I., Bergese, S. A., Schneider, A. E., Vay, C., Rodriguez, C. H., Nastro, M., Gutkind, G. O., & Di Conza, J. A. (2023). MALDI-TOF MS-Based KPC Direct Detection from Patients’ Positive Blood Culture Bottles, Short-Term Cultures, and Colonies at the Hospital. Pathogens, 12(7), 865. https://doi.org/10.3390/pathogens12070865