Abstract
The dissemination of resistant pathogens through food supply chains poses a significant public health risk, spanning from farm to fork. This study analyzed the distribution of Shiga toxin-producing Escherichia coli (STEC) across various sources within the animal-based food supply chain. A total of 500 samples were collected from livestock, poultry, the environment, fisheries, and dairy. Standard microbiological procedures were employed to isolate and identify E. coli isolates, which were further confirmed using MALDI-TOF and virulence-associated genes (VAGs) such as stx1, stx2, ompT, hylF, iutA, fimH, and iss. The phenotypic resistance patterns of the isolates were determined using the disc diffusion method, followed by molecular identification of antibiotic resistance genes (ARGs) through PCR. STEC were subjected to PCR-based O typing using specific primers for different O types. Overall, 154 (30.5%) samples were confirmed as E. coli, of which 77 (50%) were multidrug-resistant (MDR) E. coli. Among these, 52 (67.53%) isolates exhibited an array of VAGs, and 21 (40.38%) were confirmed as STEC based on the presence of stx1 and stx2. Additionally, 12 out of 52 (23.07%) isolates were identified as non-O157 STEC co-harbouring mcr-1 and blaNDM-1. O26 STEC was found to be the most prevalent among the non-O157 types. The results suggest that the detection of STEC in food supply chains may lead to serious health consequences, particularly in developing countries with limited healthcare resources.
1. Introduction
The misuse of antimicrobials in food-producing animals (FPAs), either for growth promotion or as a preventive measure, has created selection pressure that fosters the development of resistant bacterial strains. These resistant bacteria can then spread to humans through the food supply chain, either by consuming contaminated food, direct contact with FPAs, or indirectly through animal waste that contaminates production systems, agriculture, aquaculture, and the environment [1]. The complexity of animal-based food chains, due to the extensive diversity in production, processing, packaging, and transportation, often leads to the persistence and recurrence of microbes responsible for foodborne illnesses [2].
Foodborne infections (FBIs) are serious global health concerns, resulting in substantial socioeconomic impact and contributing to significant morbidity and high mortality rates across various age groups worldwide. FBIs are predominantly caused by specific microbial pathogens or other food contaminants such as bacteria, fungi, and mycotoxins. Additionally, environmental contaminants can contribute to these infections by contaminating food during production and transportation [3]. Among the most prevalent pathogens causing FBIs globally are Shiga toxin-producing E. coli (STEC), along with Salmonella, Campylobacter, and Listeria [4]. STEC, a zoonotic pathotype of E. coli, is particularly noteworthy for its role in causing diarrhea, hemorrhagic colitis, and hemolytic uremic syndrome.
However, the emergence of non-O157 STEC in recent years has been sporadically reported and is considered a potential health threat [5]. Various serogroups of non-O157 STEC, including O26, O103, and O145, have been prevalent in different outbreaks of STEC. Stx produced by STEC consists of two distinct immunodominant epitopes: Stx1 and Stx2. These Stx toxins play a crucial role in the virulence of STEC within the host, contributing to the onset of infection. Shiga toxins act as ribotoxins, inhibiting protein synthesis within eukaryotic host cells and inducing apoptosis [6]. Identifying specific research gaps in the context of MDR STEC transmission within food supply chains is critical for developing targeted interventions to mitigate the risk of foodborne infections [7]. In recent years, various studies have highlighted the public health significance of non-O157 STEC occurrences worldwide [8,9]. Food-producing animals (FPAs) are recognized reservoirs of STECs, and the characterization of STEC strains from a variety of domesticated animals has been documented [9]. Previously, MDR E. coli has been reported in poultry, fresh, and frozen meat [10,11]. Building on this foundation, the present study aims to investigate MDR STEC across various sources within the food supply chain. However, there is limited data available on STEC transmission from farm to fork in Pakistan, likely due to inadequate surveillance and monitoring programs.
2. Materials and Methods
2.1. Ethical Approval
The present study was conducted following approval from the Institutional Review Board (IRB) and Ethical Review Committee (ERC) (Ref No. GCUF/ERC/137, dated 3 February 2023) at the Government College of the University Faisalabad. Samples were collected with prior permission and written consent from stakeholders. All experiments were conducted at the One Health AMR laboratory (OH-AMR lab) at the Institute of Microbiology, Government College, University Faisalabad. The Matrix-assisted Laser Desorption/Ionization-Time of Flight (MALDI-TOF) experiment was carried out at the National Institutes of Health, M4QP + GW7 Islamabad, Pakistan.
2.2. Collection, Processing, and Transportation of Sample
Food samples were collected and divided into five categories livestock products, poultry, environmental samples, fisheries, and dairy which were further divided into sub-categories as mentioned Overall, a total of 500 samples were collected in sterile containers from various food and animal-related sources. These included livestock samples (n = 75), such as chicken, meat, and veal; poultry samples (n = 75), including chicken, cloacal/anal swabs, and droppings; environmental samples (n = 125) from slaughterhouses, open markets, dairy and poultry waste, and various transport vehicles; fisheries samples (n = 100) comprising fish, shrimps, market waste, and transport vehicles; and dairy samples (n = 125), including raw milk, yogurt, dairy cream, cheese, and outlet waste. Samples were preserved in peptone water and transported in ice bags to the Institute of Microbiology’s laboratory for further investigation (Table 1).

Table 1.
The collection and distribution of samples from various food origins.
2.3. Isolation and Purification of E. coli
Enriched samples were streaked on MacConkey agar and Eosine Methylene Blue (EMB) agar (OXOID®, Basingstoke, UK), and incubation was done for 24 h at 37 °C. Samples were processed for cultural and morphological characteristics. Furthermore, isolates were subjected to Biochemical identification using an API 20E kit (Biomeurex, Craponne, France) according to the manufacturer protocol.
2.4. MALDI-TOF
All the isolates were confirmed through MALDI-TOF-based VITEK® MS V3.2 (Biomeurex, Craponne, France). All the procedure was carried out as per guidelines and recommendations available in the manufacturer manual and protocol. The cyanohyrodxycinamic acid (CHCA @ 0.01 µL) was used as a matrix for the isolates. Whereas ATCC™ E. coli (8739) was kept in control. The slides for VITEK® MS were prepared by using Vitek® PICKME NIBS (Biomeurex, Craponne, France), ATCC™ control, and the isolates were inoculated and directed circles, correspondingly. Subsequently, CHCA (0.01 µL). was added to make the tested sample ready to be interpreted through MYLA® software v. 4.9.1 (Biomeurex, Craponne, France).
2.5. Detection of VAGs
Detection of various virulence-associated genes (VAGs) in E. coli (stx1, stx2, ompT, hylF, papC, eae, ampC, traT, fimH, and iss) was performed using PCR with specific primers [12,13,14,15,16,17,18,19] (see Supplementary Materials). DNA extraction was carried out using the GeneJET Genomic DNA purification kit K0722 (Thermo Scientific™) following the provided protocol.
PCR for VAGs was conducted on a Thermo-cycler:48 Biomerta™ (Göttingen, Germany) under specific conditions and respective annealing temperatures (Supplementary Materials). The reaction setup included initial denaturation of template DNA at 94 °C for 5 min, followed by 30 cycles of DNA denaturation at 94 °C for 1 min, primer annealing for 55 s, and extension at 72 °C for 60 s. A final extension step at 72 °C for 10 min was performed. The PCR reaction mixture was prepared according to the manufacturer (Ambion-AM9932, Thermo Scientific™, Waltham, MA, USA). PCR amplicons were visualized by running 1.5% agarose gel electrophoresis (CSL-AG500; CLEAVER SCIENTIFIC®, Rugby, UK) and observed under a gel transilluminator (BioRad, Hercules, CA, USA).
2.6. Antibiotic Susceptibility Testing
Antibiotic resistance profiling of E. coli isolates (n = 52) was conducted using the Kirby–Bauer disc diffusion assay following the 2021 CLSI guidelines. The antibiotics tested are included, as mentioned in Table 6. E. coli ATCC™ 8739 served as a quality control during the experiment. Minimum inhibitory concentrations (MICs) were determined using the Broth microdilution method (BMD), as per CLSI guidelines, except for colistin and tigecycline, which were assessed following EUCAST-CLSI and FDA recommendations [20].
2.7. Phenotypic Confirmation of Colistin Resistance
The Rapid Polymyxin Test (RPT) was carried out for the phenotypic confirmation of colistin-resistant isolates as described previously [21]. Polymyxin stock solution was prepared in Muller Hinton Broth (MHB) with colistin (Oxoid™), as a final concentration of 0.2 mg/mL was reached. Afterward, rapid polymyxin NP solution (RPS) was prepared by adding 6.25 g of MHB and 0.0125 g phenol red, the pH of the RPS was adjusted to 6.7. Moreover, sterilized filtered D + glucose (1%) was also added in RPS. At the start of the experiment, colistin was dispensed in RPS to get a solution having colistin @ 5 μg/150 μL. Bacterial inoculum was prepared from freshly grown E. coli culture; bacterial colonies were resuspended to obtain 3.5 McFarland standard for further procedure according to EUCAST recommendation. All the isolates that grew in the presence of colistin were classified as colistin-resistant.
2.8. Carbapenemase Nordmann-Poirel CLSI (CarbaNP CLSI) Test
CLSI recommended CarbNP assay was carried out to confirm carbapenem-resistant isolates [22]. Two Eppendorf tubes were prepared and labeled separately by adding 20 mM Tris-HCl buffer (100 µL) in each. Moreover, two solutions were prepared and named Solution A and Solution B. Solution A was prepared with 0.1 mm/L ZnSO4 and 0.5% phenol red indicator, and the pH of Solution A was kept at 7.8. To prepare solution B, 6 mg/mL of imipenem was mixed in Solution A. Afterwards, Solution A was dispensed into Tube 1, and Solution B was added in Tube 2. Both tubes were incubated for 2 h at 37 °C. The appearance of a yellow color in Tube 2 was interpreted as positive for the CarbNP test.
2.9. Molecular Characterization of ARGs
Along with phenotypic-resistance profiling, various ARGs were identified, including, ESBLs (CTX-M, SHV, TEM, OXA, and CMY), MBLs (NDM, KPC, OXA, VMP, and IMP), and Qnrs (qnrS, qnrB, qnrA, gyrA, gyrB, sul1, sul2, tetA, tetB, mcr-1, and mcr-11). This was performed with the help of PCR using specific primers [23,24,25,26,27,28,29,30,31] (see Supplementary Materials). The DNA was extracted using a genomic DNA purification kit, called K0722 (Thermo-Scientific™, Waltham, MA, USA). A total of 25 µL of the reaction mixture for PCR was used, which comprised 5 µL of DNA template, 10 µL of Green DreamTaq Mix (Thermo Fisher Scientific, Waltham, MA, USA), and F&R primers (100 pM), 1 µL each. A total of 8 µL of SuperQ nuclease-free water was added to achieve the desired volume (25 µL). Lastly, a total of 1.5% agarose (CSL-AG500; CLEAVER SCIENTIFIC®, Rugby, UK) gel electrophoresis was used to observe the PCR products’ instructions.
2.10. O Typing
Shiga toxins (stx1, stx2), which produce E. coli (STEC; n = 21), were subjected to O typing through PCR using specific primers for various O types, i.e., O26,103,111,121, and O145 [32] (see Supplementary Materials). Conventional PCR was performed as described previously. A total of 25 µL PCR mix composed of 4–5 µL of template DNA, 8 µL of Green DreamTaq Mix (Thermo Fisher Scientific, USA), 1 µL of each primer (F&R), and 10 µL of SuperQwater was added to reach the required volume. A PCR reaction was conducted with the following conditions: 30 cycles of denaturation at 94 °C for 35 s, annealing at 55 °C for 35 s, and extension at 72 °C for 1 min, followed by final extension for 10 min. Furthermore, agarose (CSL-AG500; CLEAVER SCIENTIFIC®, Rugby, UK) gel (1.5 % with 1 mg/mL ethidium bromide) was prepared for electrophoresis to examine the PCR products.
2.11. Statistical Analysis
The particulars were combined in Excel (Microsoft Office 365) spreadsheets for various different statistical analyses. The relationship between variables from different sample sources was studied through correlation and linear regression. The strength of the existing relationship among variables was quantified. For comparison of means, data was subjected to analysis of variance (ANOVA), to find out if the associated source means were significantly different, and p-value < 0.05 was set as significant.
3. Results
3.1. Distribution of E. coli from Various Food Sources
A total of 154 out of 500 (30.8%) food samples tested positive for E. coli, sample distribution showed that among several groups, poultry and fisheries acquired significantly higher numbers of E. coli. The highest prevalence of E. coli was observed in poultry 38.67% followed by Fisheries 32%. Additionally, environmental and dairy samples exhibited 29.6%, while 25.37% E. coli was detected in livestock samples. Further distribution of the prevalence of samples and E. coli per category is given in (Table 2).
Table 2.
Prevalence and Distribution of E. coli from selected food categories.
3.2. Distribution of Non-O157 STEC among Various Sample Sources
Overall, our VAGs confirmed 21/52 (40.38%) isolates were observed as STEC. According to distribution, the highest distribution of STEC was 75%, observed in beef samples followed by mutton, cloacal/anal swabs, chicken meat, veal, and poultry droppings, i.e., 42.85%, 40%, 27.27%, and 25%, respectively. Furthermore, among STEC, a total of 12 (57.14%) were found to be non-O157 STEC co-harboring blaNDM-1 and mcr-1. Likewise, various sample sources exhibited results as in non-O157 STEC co-harboring blaNDM-1 and mcr-1. (Table 3; Supplementary Materials).
Table 3.
Non-O157 STEC co-harboring blaNDM-1 and mcr-1 among various sample sources along with detected O types.
A total of 21 (40.38%) STEC samples were observed for their respective O types, among them, 11 (52.38%) isolates belong to O26m, including 4 (36.36%) from a beef sample and 2 (18.18%) from chicken, cloacal/anal swabs, and poultry droppings. While 1 (33.33%) and 2 (50%) non-O157 STEC co-harboring blaNDM-1 and mcr-1 isolates were detected with O103, O121, O111, and O145, respectively, in poultry, livestock category and slaughterhouse samples (Table 4; Supplementary Materials).
Table 4.
Non-o157 O types among STEC isolated from various sources along with co-existence of ARGs.
3.3. Distribution of non-O157 STEC Co-Harboring blaNDM-1 and mcr-1 among Various Sample Sources
Overall, out of STEC, a total of 12/21 (57.14%) were distinguished as non-O157 STEC co-harboring blaNDM-1 and mcr-1, where sample-wise division was shown the higher number 3 (25%) in chicken meat followed by 2 (16.67%) in beef samples, cloacal/anal swabs and poultry droppings, while 1 (8.33%) was observed in mutton and slaughterhouse samples, details are given in Table 2.
3.4. VAGs Detection
Overall, 52 (67.53%) isolates have shown the presence of a range of VAGs (Figure 1b). Inclusively, the highest 11 (14.28%) of the chicken isolates carry eight VRGs. Additionally, 8 (10.38%) of beef isolates carry seven ARGs followed by mutton isolates 7 (9.09%) having five VRGs. Moreover, veal and slaughterhouse 4 (5.19%), droppings 8 (10.38%) and cloacal/anal swabs 10 (12.98%) of the isolates carried four VRGs respectively. Furthermore, within all the isolates 23 (29.87%), three marker genes i.e., ompT, hylF, and iss, were identified. In addition to these, the most common VAGs among E. coli were stx-1 and stx-2, followed by eae, papC, and traT (Figure 1).
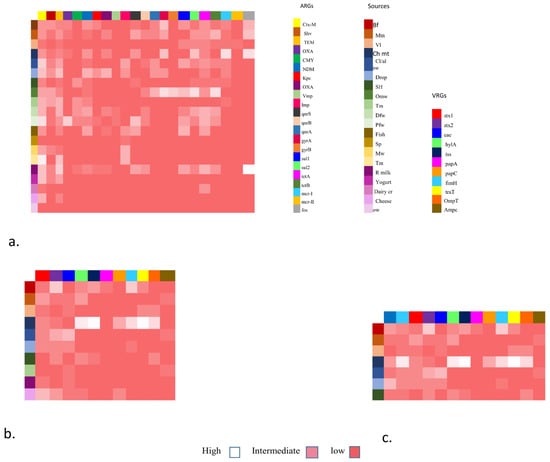
Figure 1.
Heat map showing the distribution of antibiotic resistance gene (ARGs), virulence resistance genes (VRGs), and co-existence of NDM-1 and mcr-1 associated with VRGs-based E. coli detection from various sources.
Furthermore, in addition to the stx1 and stx2, all non-O157 STEC co-harboring blaNDM-1 and mcr-1 isolates have shown the presence of a range of VAGs including hylA, eae, iss, papC, papA, papG, tsh, ibeA, iuOD, fimH, traT, ompT, ampC, etc. (Table 5; Figure 1c). (The abbreviations used for food sources are Bf (beef), Mn (mutton), VL (veal), CH mt (chicken), cl/al sb (cloacal/ansl swab), Drop (droppings), SH (slaughterhouse), OMW (open market waste), Tm (transport means), DFW (dairy farm waste), Pfw (poultry farm waste), fish (fish), SP (shrimp), MW (market waste), Tm (transport mean), R milk (raw milk), Yogurt, Dairy cr (dairy cream), cheese, OW (outlet waste))
Table 5.
Co-existence of blaNDM-1 and mcr-1 in VAGs based confirmed E. coli.
The heat map shows the distribution of five major categories of food specimens from various food origins. The y-axis shows these origins with colored boxes. Antibiotic resistance genes including ESBLs, MBLs, qnrs, sul, tet, mcr (1,11), and fos are shown in colored boxes on the x-axis. These genes were grouped as low, intermediate, and high frequency.
The heat map also shows the placement of virulence genes associated with Fimbrae, mobility, toxin, iron uptake, etc. The x-axis shows E. coli isolates from various food groups (y-axis) mainly livestock (mutton, beef, veal), poultry (chicken, cloacal/nasal swabs and dropping), environment (slaughterhouse and transport means), and dairy (raw milk and cheese) and each is shown as low, intermediate and high on the right side.
The heat map also shows the co-existence of NDM-1 and mcr-1 with VRGs-based E. coli detection. In this case, VRGs were detected mainly from livestock (mutton, beef, veal), poultry (chicken meat, cloacal/nasal swabs, and droppings), and one environmental sample (slaughterhouse). They are grouped as high, low, and intermediate values and also show the co-occurrence of ARGs (NDM-1 and mcr-1).
3.5. Resistance Profiling of the Isolates
The resistance pattern of the non-O157 STEC co-harboring blaNDM-1 and mcr-1 isolates showed 100% resistance to ampicillin followed by cefepime. Additionally, chloramphenicol showed 75% tetracycline, 72% trimethoprim, 65% ciprofloxacin, 51% levofloxacin, 45% colistin, and 40% fosfomycin, 10% imipenem and meropenem. The least resistance is shown in the case of tigecycline, which was just 4% (Figure 2; Table 6). Moreover, all non-O157 STEC co-harboring blaNDM-1 and mcr-1 have shown positive for CarbaNP and rapid polymyxin confirmation (see Supplementary Materials).
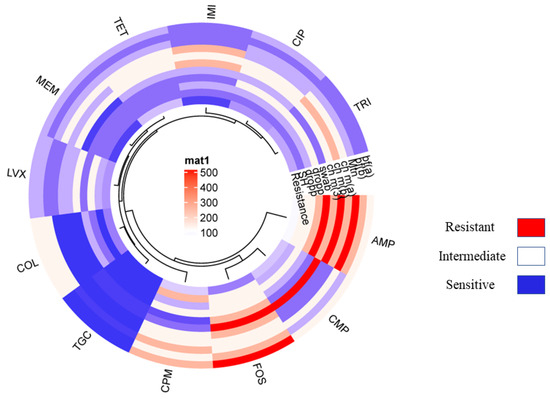
Figure 2.
Showing the circular cluster heat map illustrated the Resistance pattern of various standard antibiotics against VRGs based confirmed E. coli isolates co-harboring NDM-1 and mcr-1. The resistance pattern among E. coli isolates harboring NDM-1 and mcr-1 represented by color and cluster showing overall resistance percentages against antibiotics (AMP, CMP, COL, LVX, MEM, IMI, CIP, TRI, TOC, and FOS).
Table 6.
Antibiotic susceptibility testing of non-O157, blaNDM-1, and mcr-1co-harboring STEC isolates.
3.6. ARGs
In general, a total of 77/154 (50%) isolates showed the presence of different ARGs (Figure 1a). Among various ESBLs, the following detection patterns were observed: CTX-M (52.94%), SHV (66.67%), TEM (83.33%), OXA (77.78%), and CMY (75%). Regarding detection rate of MBLs, they showed blaNDM (62.5%) followed by blaIMP (71.42%), blaOXA (62.50%), and blaKPC (25%). The rate was the lowest for blaVMP (11.11%). Regarding Qnr genes, qnrS was observed in 66.67% of isolates, followed by qnrA (50%) and qnrB (28.57%) (Figure 3). Likewise, the detection rate of gyrA, gyrB, sul1, and sul2 was 80%, 70%, 80%, and 50% respectively. Furthermore, the rate of tetB and tetA was 80% and 66.67%, respectively.
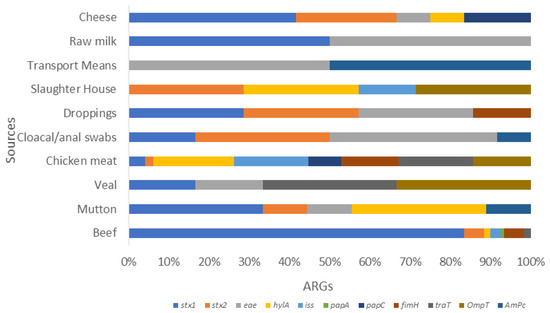
Figure 3.
Stacked bar showcasing the prevalence of various VRGs in E. coli isolates from various food sources. This stalked bar describes the detection of various VRGs (stx1, stx2, eae, hylA, iss, pap A. papC, papG, fimH, traT, ompT, and ampC) shown in various colors set against selected food sources from livestock. It shows poultry, dairy, and environmental sample categories. The highest prevalence rates were stx1 in cheese, followed by stx2 in slaughterhouse samples. The chicken meat carried more hylA, iss, traT, ompT, and papC, whereas papA and fimH were more prevalent in beef. This was followed by ampC, which was high in various transport means from environment samples.
- (a)
- The scatter plot shows the presence of ESBL genes in various food sources. A high number of blaCTX-M was detected in fisheries via transport means whereas blaSHV is more in beef. Among blaTEM and blaOXA, blaCMY showed the highest prevalence in raw milk, poultry waste, and slaughterhouse samples, respectively.
- (b)
- The scatter plot in MBLs showcases the highest prevalence of blaNDM-1 and blaOXA in poultry droppings and the lowest in poultry farm waste while blaIMP in fisheries market waste.
- (c)
- The scatter plot shows qnrS. qnrS was highest in poultry farm waste, followed by qnrA which was found to more prevalent in open market waste, along with qnrB, which was found to be more prevalent in raw milk. Out of the different types of gyrs, gyrA is more prevalent than gyrB and was detected in higher quantities in open market waste.
- (d)
- The scatter plot also elaborates on the prevalence of sul and tet genes. Here, sul1 and sul2 are shown to be more prevalent in environmental waste samples. Meanwhile, tetA is higher in dairy waste. Consider this in comparison to tetB, which is found more in open market waste.
4. Discussion
E. coli emerges as a key protagonist due to its ubiquity in various ecosystems and its ability to readily exchange genetic material containing resistance genes. This characteristic illustrates how antimicrobial use and resistance development in one sector can swiftly disseminate and manifest in other domains [33]. Therefore, studies are needed to elucidate the pathogenicity and resistance paradigm of E. coli originating from food sources, which may play a significant role in mitigating the health impacts caused by such pathogens.
In this regard, the present study focused on non-O157 STEC strains co-harboring blaNDM-1 and mcr-1 across various sources, highlighting the complexity of the food supply chain (Figure 4). Overall, 2.4% (12/500) of non-O157 STEC strains co-harboring mcr-1 and blaNDM-1 were detected in all studied sources, indicating a concerning distribution of non-O157 STEC within the food supply chain. While STEC O157 strains are often associated with outbreaks, recent reports suggest that non-O157 STEC strains also possess the ability to cause illnesses such as HUS [34]. Consequently, research on the distribution, incidence, and pathogenicity of non-O157 STEC has gained significant attention due to recent outbreaks involving these serogroups. A recent study reported on the antimicrobial resistance (AMR) profiles of non-O157 STEC from both human and domesticated animal sources, revealing a notable incidence of non-O157 STEC strains co-harboring the mcr-1 gene [5], which supports the findings of the current investigation. Similarly, our findings align with previous work [31] that identified STEC strains in poultry in Nigeria, and with another study [35], which reported the detection of STEC (stx1, stx2) in poultry droppings and cloacal swabs. These results are consistent with findings reported from various low- and middle-income countries (LMICs) as well as China [36,37].
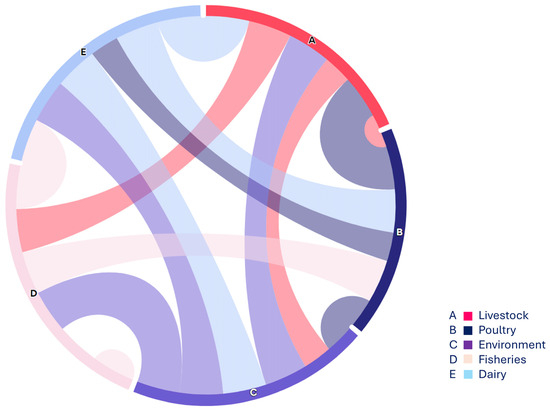
Figure 4.
The chord diagram (https://www.everviz.com/, accessed on 18 March 2024) represented the flow between various studied sample sources i.e., nodes. Each source is displayed with an alphabet on the outer circle and arcs between different sources showing the connection and relevance with adjacent sources.
Overall, 21 out of 500 isolates (4.2%) were confirmed as STEC, with both stx1 and stx2 detected in these isolates. Previously reported data on non-O157 STEC have shown incidence rates ranging from 5% to 10% [38,39]. However, due to geographical variations, differences in food categories, processing methods, transportation practices, and STEC identification protocols, direct comparisons of these findings are challenging. Nevertheless, the current results corroborate previous data and offer insights into the relative distribution of STEC among the studied sources. Moreover, available literature indicates that among various non-O157 STEC serogroups, O26 is the most prevalent. Consistent with this, the current study found that O26 was the most common serogroup, comprising 52% of the isolates among the studied samples. Recently, a study in China reported the presence of O26 in non-O157 STEC isolated from retail foods [40], further supporting our findings. Similarly, the detection of non-O157 STEC in this investigation aligns with previous reports from different regions, underscoring the increasing concern over foodborne illnesses associated with non-O157 STEC [41].
All STEC isolates exhibited an array of virulence-associated genes (VAGs), including stx1 and stx2. These findings are consistent with previous reports documenting the distribution of stx1 and stx2 among STEC isolated from diverse food sources. Epidemiological and clinical investigations have indicated that the presence of stx2 is crucial for causing hemolytic uremic syndrome (HUS), and strains carrying additional VAGs can lead to severe illnesses [42]. Furthermore, the findings of the present study align with published research indicating that non-O157 STEC originating from food sources exhibit a variety of VAGs [42]. Recent studies from Pakistan have highlighted that the most common VAG among STEC isolated from food animals is the stx2 gene (24.81%) [43]. Similarly, a study conducted in the USA reported a prevalence of stx genes (16.6%) in STEC isolated from food animals [44]. These findings are consistent with studies from several European countries, such as Hungary, Poland, Switzerland, and Austria, which have also reported similar patterns of VAGs in various meat samples [45].
The isolates in this study exhibited considerable resistance to the tested antibiotics. The statistically significant resistance pattern (Supplementary Materials) observed aligns with previously reported findings concerning STEC from food samples [46]. Antibiotic resistance, particularly against quinolones, may enhance the virulence of STEC by facilitating the induction of stx1 or stx2 genes. The significant resistance observed among the isolates underscores the concern that unregulated and inappropriate antimicrobial use contributes to the emergence and spread of antimicrobial resistance (AMR) and resistant bacterial strains.
A range of antibiotic resistance genes (ARGs) were detected in the studied isolates, consistent with findings from previous studies [17,47,48,49,50,51] (Figure 5). Additionally, metallo-beta-lactamases (MBLs) were prevalent, detected in up to 68 out of 500 isolates (13.8%), which correlates with findings reported in clinical isolates [52]. Another study from Nigeria highlighted the presence of blaVIM specifically in E. coli isolated from diarrheal samples associated with foodborne illnesses [53].
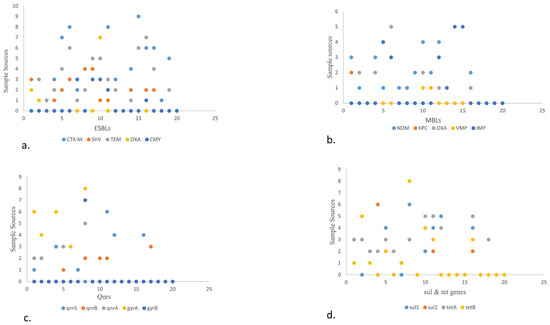
Figure 5.
Scatter plot describing the sample sources against different VRGs from different food origins. Scatter plot showing the sample sources and ARGs in the form of numerical value. The Y-axis shows the sample source. 0–9 depicts beef, mutton, veal, chicken, cloacal/anal swabs, droppings, environmental samples (slaughterhouse, open market, and transport waste, dairy and poultry waste), fish, shrimps, market waste, transport means, and dairy (raw milk, yogurt, dairy cream, cheese, and outlet waste) and x-axis showing ARGs (ESBLs, MBLs, qnrs, tet, and sul).
The current research indicates a significant correlation between the antibiotic resistance profiles of STEC isolates and the presence of ARGs (Supplementary Materials). For instance, the highest resistance among E. coli isolates was observed against ampicillin, with blaTEM detected in 83% of the isolates. Similarly, 40% of the isolates exhibited resistance to colistin, with blaIMP detected in 40% of these resistant strains [54]. These findings align with previous work demonstrating high resistance patterns and the detection of various ARGs among STEC isolated from food-producing animals.
In the poultry and livestock sectors, common practices such as indiscriminate antibiotic use as growth promoters and within food production chains significantly contribute to the dissemination of ARGs, contaminating the environment and posing serious health hazards to ecosystems [55]. This practice facilitates the emergence of antibiotic-resistant strains, including those harboring mcr-1 and blaNDM-1 genes. The current study supports this notion, with nearly 40% of STEC isolates exhibiting resistance to colistin, a last-resort antibiotic for Gram-negative bacteria (GNB). Similar observations have been reported globally: in Malaysia, a 100% detection rate of mcr-1 among E. coli isolated from poultry and poultry meat showed resistance to colistin [56]. In Bangladesh, a study reported 55.77% of mcr-1-harboring E. coli in commercial poultry meat [57]. Studies from the Czech Republic and China also reported significant levels of colistin resistance among E. coli isolates from meat samples and river water, respectively [58,59].
In developing countries, high levels of colistin and blaNDM-1 resistance, particularly in the poultry and livestock sectors where the environment serves as a major reservoir, underscore the urgent need for action. There should be a complete ban on the indiscriminate use of antibiotics as growth promoters in poultry and livestock production to mitigate the emergence and spread of various antibiotic-resistant strains.
AMR monitoring and surveillance of foodborne pathogens within the food supply chain represent a multifaceted and complex challenge. However, the present study has several limitations that should be acknowledged. Firstly, the geographical distribution of the samples was limited, which may restrict the generalizability of the findings. Future research should adopt a more comprehensive approach by including samples from various geographical locations with diverse socioeconomic conditions and food production practices. Moreover, the current study lacks detailed genomic analysis of STEC isolates, such as whole genome sequencing, sequence typing, and functional genomics. Future investigations should incorporate these advanced genomic techniques to enhance our understanding of STEC dynamics, particularly in relation to antimicrobial resistance.
5. Conclusions
In conclusion, this study provides valuable insights into the molecular characteristics of non-O157 STEC isolated from diverse food sources. Our findings highlight the impact of indiscriminate antibiotic use in poultry and livestock farms, not only in disrupting the food supply chain but also in facilitating the transmission of resistant superbugs, such as STEC carrying mcr-1 and blaNDM-1, to the wider community through contaminated environments. The pervasive presence of these resistant E. coli strains throughout the food supply chain is concerning and demands immediate action. It is imperative to implement measures to ensure the safety and quality of food from farm to fork. Addressing these challenges requires coordinated efforts across sectors to promote judicious antibiotic use, enhance surveillance of antimicrobial resistance, and implement stringent food safety protocols. By taking proactive steps now, we can mitigate the risks posed by antimicrobial resistance and safeguard public health.
Supplementary Materials
The following supporting information can be downloaded at: https://www.mdpi.com/article/10.3390/pathogens13080659/s1, Table S1: Detail of Primers used in study; Figure S1: Distribution of E. coli in various food origin; Figure S2: Linear regression analysis from different food sources.
Author Contributions
Research work, manuscript writing: A.S.; supervision, methods, manuscript revision: B.A. and M.H.R.; manuscript revision, methods validations, and funding acquisition: M.M.S.B. and J.S. All authors have read and agreed to the published version of the manuscript.
Funding
Funds for the study: Project Contract No. 25099 in Coordinated Research Project No. D52044 from the International Atomic Energy Agency (IAEA), Vienna Austria.
Informed Consent Statement
Not applicable.
Data Availability Statement
The original contributions presented in the study are included in the article/supplementary material, further inquiries can be directed to the corresponding author/s.
Acknowledgments
The authors would like to extend their sincere appreciation to the Researchers Supporting Project Number (RSPD2024R986), King Saud University, Riyadh, Saudi Arabia.
Conflicts of Interest
Authors declared no conflicts of interest.
References
- Gompel, L.V.; Luiken, R.E.C.; Hansen, R.B.; Munk, P.; Bouwknegt, M.; Heres, L.; Greve, G.D.; Scherpenisse, P.; Jongerius-Gortemaker, B.G.M.; Tersteeg-Zijderveld, M.H.G.; et al. Description and determinants of the faecal resistome and microbiome of farmers and slaughterhouse workers: A metagenome-wide cross-sectional study. Environ.Int. 2020, 143, 105939. [Google Scholar] [CrossRef]
- Pokharel, S.; Priyanka, S.; Bipin, A. Antimicrobial use in food animals and human health: Time to implement ‘One Health’approach. Antimicrob. Resist. Infect. Control. 2020, 9, 181. [Google Scholar] [CrossRef] [PubMed]
- Hu, Y.; Wang, J.; Zhang, R.; Chen, L.; Zhang, H.; Qi, X.; Chen, J. Epidemiology of foodborne diseases caused by Salmonella in Zhejiang Province, China, between 2010 and 2021. Front. Public Health 2023, 11, 1127925. [Google Scholar]
- Gallo, M.; Ferrara, L.; Calogero, A.; Montesano, D.; Naviiglio, D. Relationships between food and diseases: What to know to ensure food safety. Food Res. Int. 2020, 137, 109414. [Google Scholar] [CrossRef]
- Pan, Y.; Hu, B.; Bai, X.; Yang, X.; Cao, L.; Liu, Q.; Sun, H.; Li, J.; Zhang, J.; Jin, D.; et al. Antimicrobial Resistance of Non-O157 Shiga Toxin Producing Escherichia coli Isolated from Humans and Domestic Animals. Antibiotics 2021, 10, 74. [Google Scholar] [CrossRef]
- Joseph, A.; Cointe, A.; Kurkdijan, P.M.; Rafat, C.; Hertig, A. Shiga Toxin-Associated Hemolytic Uremic Syndrome: A Narrative Review. Toxins 2020, 12, 67. [Google Scholar] [CrossRef]
- Tiseo, K.; Huber, L.; Gilbert, M.; Robinson, T.P.; Van Boeckel, T.P. Global trends in antimicrobial use in food animals from 2017 to 2030. Antibiotics 2020, 9, 918. [Google Scholar] [CrossRef] [PubMed]
- Galarce1, N.; Sánchez, F.; Fuenzalida, V.; Ramos, R.; Escobar, B.; Lisette Lapierre, L.; Paredes-Osses, E.; Arriagada, G.; Alegría-Morán1, R.; Lincopán, N.; et al. Phenotypic and Genotypic Antimicrobial Resistance in Non-O157 Shiga Toxin-Producing Escherichia coli Isolated From Cattle and Swine in Chile. Front. Veter- Sci. 2020, 7, 367. [Google Scholar] [CrossRef]
- Yang, G.; Zhang, S.; Huang, Y.; YE, Q.; Zhang, J.; WU, Q.; Wang, J.; Chen, M.; Xue, L. Isolation and Characterization of Non-O157 Shiga Toxin–Producing Escherichia coli in Foods Sold at Retail Markets in China. J. Food Prot. 2020, 83, 460–467. [Google Scholar] [CrossRef] [PubMed]
- Nawaz, Z.; Aslam, B.; Zahoor, M.A.; Siddique, A.B.; Rafique, A.; Aslam, R.; Qamar, M.U.; Ali, S.; Mubeen, M. Frequency of Extended Spectrum Beta Lactamase Producing Escherichia coli in Fresh and Frozen Meat. Pak. Vet. J. 2020, 41, 102–106. [Google Scholar] [CrossRef]
- Usman, M.; Rasool, M.H.; Khurshid, M.; Aslam, B.; Baloch, Z. Co-Occurrence of mcr-1 and Carbapenem Resistance in Avian Pathogenic, E. coli Serogroups O78 ST95 from Colibacillosis-Infected Broiler Chickens. Antibiotics 2023, 12, 812. [Google Scholar] [CrossRef] [PubMed]
- Bording-Jorgensen, M.; Parsons, B.; Szelewicki, J.; Lioyd, C.; Chui, L. Molecular Detection of Non-O157 Shiga Toxin Producing Escherichia coli (STEC) Directly from Stool Using Multiplex qPCR Assays. Microorganism 2022, 10, 329. [Google Scholar] [CrossRef] [PubMed]
- Harada, T.; Iguchi, A.; Iyoda, S.; Seto, K.; Taguchi, M.; Kumeda, Y. Multiplex Real-Time PCR Assays for Screening of Shiga Toxin 1 and 2 Genes, Including All Known Subtypes, and Escherichia coli O26-, O111-, and O157-Specific Genes in Beef and Sprout Enrichment Cultures. J. Food Prot. 2015, 78, 1800–1811. [Google Scholar] [CrossRef] [PubMed]
- Subedi, M.; Luitel, H.; Devkota, B.; Bhattarai, R.K.; Phuyal, S.; Panthi, P.; Shrestha, A.; Chaudhary, D.K. Antibiotic resistance pattern and virulence genes content in avian pathogenic Escherichia coli (APEC) from broiler chickens in Chitwan, Nepal. BMC Vet. Res. 2018, 14, 113. [Google Scholar] [CrossRef] [PubMed]
- Islam, M.A.; Heuvelink, A.E.; De Boer, E.; Sturm, P.D.; Beumer, R.R.; Zwietering, M.H.; Faruque, A.S.G.; Haque, R.; Sack, D.A.; Talukder, K.A. Shiga toxin-producing Escherichia coli isolated from patients with diarrhoea in Bangladesh. J. Med. Microbiol. 2007, 56, 380–385. [Google Scholar] [CrossRef] [PubMed][Green Version]
- Heuvelink, A.E.; de Van, K.N.; Meis, J.; Monnens, L.A.H.; Melchers, W.J.G. Characterization of verocytotoxin-producing Escherichia coli O157 isolates from patients with hemolytic uremic syndrome in Western Europe. Epidemiol. Infect. 1995, 115, 1–3. [Google Scholar] [CrossRef] [PubMed]
- Oswald, E.; Schmidt, H.; Morabito, S.; Karch, H.; Marches, O.; and Caprioli, A. Typing of intimin genes in human and animal enterohemorrhagic and enteropathogenic Escherichia coli: Characterization of a new intimin variant. Infect. Immun. 2000, 68, 64–71. [Google Scholar] [CrossRef] [PubMed]
- Zhang, S.; Chen, S.; Rehman, M.U.; Yang, H.; Yang, Z.; Wang, M.; Jia, R.; Chen, S.; Liu, M.; Zhu, D.; et al. Distribution and association of antimicrobial resistance and virulence traits in Escherichia coli isolates from healthy waterfowls in Hainan, China. Ecotoxicol. Enviorn. Saf. 2021, 220, 112317. [Google Scholar] [CrossRef] [PubMed]
- Perez-Bou, L.; Gonzalez-Martinez, A.; Cabrera, J.; Juarez-Jimenez, B.; Rodelas, B.; Gonzalez-Lopez, J.; and David Correa-Galeote, D. Design and Validation of Primer Sets for the Detection and Quantification of Antibiotic Resistance Genes in Environmental Samples by Quantitative PCR. Microb. Ecol. 2024, 87, 1–12. [Google Scholar] [CrossRef]
- Vanstokstraeten, R.; Belasri, N.; Demuyser, T.; Crombé, F.; Barbé, K.; Piérard, D. A comparison of E. coli susceptibility for amoxicillin/clavulanic acid according to EUCAST and CLSI guidelines. Eur. J. Clin. Microbiol. 2021, 40, 2371–2377. [Google Scholar] [CrossRef]
- Silva, V.; Correia, S.; Pereira, J.E.; Igrejas, G.; Poeta, P. Surveillance and environmental risk assessment of antibiotics and amr/args related with mrsa: One health perspective. Antibiot. Antimicrob. Resist. Genes 2020, 2020, 271–295. [Google Scholar]
- Huang, H.Y.; Wang, C.H.; Lu, P.L.; Tseng, S.P.; Wang, Y.L.; Chen, T.C.; Chang, K.; Hung-Tu, P.; Lin, S.-Y. Clinical Impact of the Revised 2019 CLSI Levofloxacin Breakpoints in Patients with Enterobacterales Bacteremia. Antimicrob. Agents Chemother. 2021, 65, 10–1128. [Google Scholar] [CrossRef] [PubMed]
- Kanokudom, S.; Assawakongkarat, T.; Akeda, Y.; Ratthawongjirakul, P.; Chuanchuen, R.; Chaichanawongsaroj, N. Rapid detection of extended spectrum β-lactamase producing Escherichia coli isolated from fresh pork meat and pig cecum samples using multiplex recombinase polymerase amplification and lateral flow strip analysis. PLoS ONE 2021, 16, e0248536. [Google Scholar] [CrossRef]
- Ben Yahia, H.; Ben Sallem, R.; Tayh, G.; Klibi, N.; Ben Amor, I.; Gharsa, H.; Boudabbous, A.; Ben Slama, K. Detection of CTX-M-15 harboring Escherichia coli isolated from wild birds in Tunisia. BMC Microbiol. 2018, 18, 26. [Google Scholar] [CrossRef]
- Kim, Y.B.; Yoon, M.Y.; Ha, J.S.; Seo, K.W.; Noh, E.B.; Son, S.H.; Lee, Y.J. Molecular characterization of avian pathogenic Escherichia coli from broiler chickens with colibacillosis. Poult. Sci. 2020, 99, 1088–1095. [Google Scholar] [CrossRef] [PubMed]
- Jamil, A.; Zahoor, M.A.; Nawaz, Z.; Siddique, A.B.; Khurshid, M. Genetic Diversity of Escherichia coli Coharboring mcr-1 and Extended Spectrum Beta-Lactamases from Poultry. BioMed. Res. Int. 2022, 2022, 8224883. [Google Scholar] [CrossRef]
- Sarwar, F.; Rasool, M.H.; Khurshid, M.; Qamar, M.U.; Aslam, B. Escherichia coli Isolates Harboring bla(NDM) Variants and 16S Methylases Belonging to Clonal Complex 131 in Southern Punjab, Pakistan. Microb. Drug Resist. 2022, 28, 623–635. [Google Scholar] [CrossRef]
- Aslam, B.; Chaudhry, T.H.; Arshad, M.I.; Muzammil, S.; Siddique, A.B.; Yasmeen, N.; Khurshid, M.; Amir, A.; Salman, M.; Rasool, M.H.; et al. Distribution and genetic diversity of multi-drug-resistant Klebsiella pneumoniae at the human-animal-environment interface in Pakistan. Front. Microbiol. 2022, 13, 898248. [Google Scholar] [CrossRef]
- Chaudhry, T.H.; Aslam, B.; Arshad, M.I.; Alvi, R.F.; Muzammil, S.; Yasmeen, N.; Aslam, M.A.; Khurshid, M.; Rasool, M.H.; Baloch, Z. Emergence of bla (NDM-1) Harboring Klebsiella pneumoniae ST29 and ST11 in Veterinary Settings and Waste of Pakistan. Infect. Drug Resist. 2020, 13, 3033–3043. [Google Scholar] [CrossRef]
- Vuthy, Y.; Lay, K.S.; Seiha, H.; Kerleguer, A.; Aidara-Kane, A. Antibiotic susceptibility and molecular characterization of resistance genes among Escherichia coli and among Salmonella subsp. in chicken food chains. Asian. Pac. J. Trop. Biomed. 2017, 7, 670–674. [Google Scholar] [CrossRef]
- Sivakumar, M.; Abass, G.; Vivekanandhan, R.; Anukampa, S.D.K.; Bhilegaonkar, K.; Kumar, S.; Grace, M.R.; Dubal, Z. Extended-spectrum beta-lactamase (ESBL) producing and multidrug-resistant Escherichia coli in street foods: A public health concern. J. Food Sci. Technol. 2021, 58, 1247–1261. [Google Scholar] [CrossRef] [PubMed]
- Li, Y.; Liu, D.; Cao, B.; Han, W.; Liu, Y.; Liu, F.; Guo, X.; Bastin, D.A.; Feng, L.; Wang, L. Development of a serotype-specific DNA microarray for identification of some Shigella and pathogenic Escherichia coli strains. J. Clin. Microbiol. 2006, 44, 4376–4383. [Google Scholar] [CrossRef] [PubMed]
- Kinnula, S.; Hemminki, K.; Kotilainen, H.; Ruotsalainen, E.; Tarkka, E.; Salmenlinna, S.; Hallanvuo, S.; Leinonen, E.; Jukka, O.; Rimhanen-Finne, R.; et al. Outbreak of multiple strains of non-O157 Shiga toxin-producing and enteropathogenic Escherichia coli associated with rocket salad, Finland, autumn 2016. Eurosurveillance 2018, 23, 1700666. [Google Scholar] [CrossRef] [PubMed]
- Al-Mustapha, A.I.; Raufu, I.A.; Ogundijo, Q.A.; Brouwer, M.S.M.; Adetunji, V.; Heikinheimo, A. Antibiotic resistance genes, mobile elements, virulence genes, and phages in cultivated ESBL-producing Escherichia coli of poultry origin in Kwara State, North Central Nigeria. Int. J. Food. Microbiol. 2023, 389, 110086. [Google Scholar] [CrossRef]
- Hasona, I.F.; Helmy, S.M.; El Gamal, A.D. Prevalence, virulence factors, and antimicrobial resistance profiles of Shiga toxin-producing Escherichia coli isolated from broiler chickens in Egypt. Vet. Res. Forum. 2023, 14, 131–138. [Google Scholar]
- Anyanwu, M.U.; Jaj, F.I.; Okpala, C.O.; Njoga, E.O.; Okafor, N.A.; Oguttu, J.W. Mobile colistin resistance (mcr) gene-containing organisms in poultry sector in low-and middle-income countries: Epidemiology, characteristics, and one health control strategies. Antibiotics 2023, 12, 1117. [Google Scholar] [CrossRef]
- Sadek, J.; Rosa, J.M.O.; Maky, M.A.; Dandrawy, M.K.; Nordman, P.; Poirel, L. Genomic Features of MCR-1 and Extended-Spectrum β-Lactamase Producing Enterobacterales from Retail Raw Chicken in Egypt Mustafa. Microorganisms 2021, 9, 195. [Google Scholar] [CrossRef]
- Zhang, J.; Chen, L.; Wang, J.; Yassin, A.K.; Butaye, P.; Kelly, P.; Gong, J.; Guo, W.; Li, J.; Li, M.; et al. Molecular detection of colistin resistance genes (mcr-1, mcr-2 and mcr-3) in nasal/oropharyngeal and anal/cloacal swabs from pigs and poultry. Sci. Rep. 2018, 8, 3705. [Google Scholar] [CrossRef]
- Islam, M.A.; Mondol, A.S.; Azmi, I.J.; Boer, E.D.; Beumer, R.R.; Zwietering, M.H.; Heuvelink, A.E.; Talukder, K.A. Occurrence and Characterization of Shiga Toxin–Producing Escherichia coli in Raw Meat, Raw Milk, and Street Vended Juices in Bangladesh. Foodborne Pathog. Dis. 2010, 7, 1381–1385. [Google Scholar] [CrossRef]
- Ju, W.; Shen, J.; Li, Y.; Toro, M.A.; Zahoo, S.; Ayers, S.; Najjar, M.B.; Meng, J. Non-O157 Shiga toxin-producing Escherichia coli in retail ground beef and pork in the Washington, D. C. area. Food Microbiol. 2012, 32, 371–377. [Google Scholar] [CrossRef]
- Yang, X.; Sun, H.; Fan, R.; Fu, S.; Zhang, J.; Matussek, A.; Xiong, Y.; Bai, X. Genetic diversity of the intimin gene (eae) in non-O157 Shiga toxin-producing Escherichia coli strains in China. Sci. Rep. 2020, 10, 3275. [Google Scholar] [CrossRef] [PubMed]
- Lee, J.B. Pathogenic and phylogenetic characteristics of non-O157 Shiga toxin-producing Escherichia coli isolates from retail meats in South Korea. J. Vet. Sci. 2018, 19, 251–259. [Google Scholar] [CrossRef] [PubMed]
- Byrne, L.; Adams, N.; Jenkins, C. Association between Shiga Toxin–Producing Escherichia coli O157:H7 stx Gene Subtype and Disease Severity, England, 2009–2019. Emerg. Infect. Dis. 2020, 26, 2394. [Google Scholar] [CrossRef] [PubMed]
- Li, Y.; Huang, T.Y.; Ye, C.; Chen, L.; Liang, Y.; Wang, K.; Liu, J. Formation and Control of the Viable but Non-culturable State of Foodborne Pathogen Escherichia coli O157:H7. Front. Microbiol. 2020, 11, 1202. [Google Scholar] [CrossRef] [PubMed]
- Shah, I.H. Molecular Characterization and Virulence Gene Profile of Entero-Pathogenic and Shiga-Toxin Producing Escherichia coli from Food of Animal Origin and Environmental Sources. Ph.D. Thesis, SKUAST Kashmir, Shalimar, India, 2023. [Google Scholar]
- Alotaibi, K.; and Khan, A.A. Prevalence and Molecular Characterization of Shiga Toxin Producing Escherichia coli from Food and Clinical Samples. Pathogens 2023, 12, 1302. [Google Scholar] [CrossRef] [PubMed]
- Nüesch-Inderbinen, M.; Treier, A.; Stevens, M.J.A.; Stephen, R. Whole genome sequence-based characterisation of Shiga toxin-producing Escherichia coli isolated from game meat originating from several European countries. Sci. Rep. 2023, 13, 3247. [Google Scholar] [CrossRef] [PubMed]
- Shakerian, A.; Rahimi, E.; Emad, P. Vegetables and Restaurant Salads as a Reservoir for Shiga Toxigenic Escherichia coli: Distribution of Virulence Factors, O-Serogroups, and Antibiotic Resistance Properties. J. Food Prot. 2016, 79, 1154–1160. [Google Scholar] [CrossRef]
- Sakthikarthikeyan, S.; Sivakumar, M.; Manikandan, R.; Senthkumar, P.; Sureskumar, V.; Malmarugan, S.; Prabhu, M.; Ramakrishnan, V. Prevalence and Molecular Characterization of Multidrug-resistant ESBL-producing E. coli in Commercial Poultry. Indian J. Anim. Res. 2024, 1, 6. [Google Scholar] [CrossRef]
- Tiedje, J.M.; Fu, Y.; Mei, Z.; Schaffer, A.; Dou, Q.; Amelung, W.; Elsner, M.; Adu-Gyamfi, J.; Heng, L.; Virta, M.; et al. Antibiotic resistance genes in food production systems support One Health opinions. Curr. Opin. Environ. Sci. Health. 2023, 43, 100492. [Google Scholar] [CrossRef]
- Hinthong, W.; Thaotumpitak, V.; Sripradite, J.; Indrrawttana, N.; Srisook, T.; Kongngoen, T.; Atwill, E.R.; Jeamsripong, S. Antimicrobial resistance, virulence profile, and genetic analysis of ESBL-producing Escherichia coli isolated from Nile tilapia in fresh markets and supermarkets in Thailand. PLoS ONE 2024, 19, e0296857. [Google Scholar] [CrossRef]
- Zhang, S.; Huang, Y.; Yang, G.; Wu, Q.; Zhang, J.; Wang, J.; Ding, Y.; Ye, Q.; Wu, S.; Gu, Q.; et al. High prevalence of multidrug-resistant Escherichia coli in retail aquatic products in China and the first report of mcr-1-positive extended-spectrum β-lactamase-producing E. coli ST2705 and ST10 in fish. Int. J. Food Microbiol. 2024, 408, 110449. [Google Scholar] [CrossRef]
- Ilham, D.; Souad, L.; Asmae, L.H.; Kawtar, N.; Mohammed, T.; Nabila, S. Prevalence, antibiotic resistance profile, MBLs encoding genes, and biofilm formation among clinical carbapenem-resistant enterobacterales isolated from patients in Mohammed VI University Hospital Centre, Morocco. Lett. Appl. Microbiol. 2023, 76, ovad107. [Google Scholar] [CrossRef] [PubMed]
- Nwike, I.E.; Ugwu, M.C.; Ejikeugwu, P.C.; Ujam, N.T.; Iroha, I.R.; Esimone, C.O. Phenotypic and molecular characterization of enteropathogenic Escherichia coli and Salmonella spp. causing childhood diarrhoea in Awka, South-Eastern Nigeria. Bull. Natl. Res. Cent. 2023, 47, 97. [Google Scholar] [CrossRef]
- Karim, M.R.; Zakaria, Z.; Hassan, L.; Faiz, N.K.; Ahmad, N.I. Antimicrobial Resistance Profiles and Co-Existence of Multiple Antimicrobial Resistance Genes in mcr-Harbouring Colistin-Resistant Enterobacteriaceae Isolates Recovered from Poultry and Poultry Meats in Malaysia. Antibiotics 2023, 12, 1060. [Google Scholar] [CrossRef] [PubMed]
- Ali, M.W.; Utsho, K.S.; Karmakar, S.; Hoque, M.N.; Rahman, M.T.; Hassan, J. First report on the molecular characteristics of mcr-1 colistin resistant E. coli isolated from retail broiler meat in Bangladesh. Int. J. Food Microbiol. 2023, 388, 110065. [Google Scholar] [CrossRef] [PubMed]
- Sismova, P.; Sukar, I.; Kolidentsev, N.; Chytilova, I.; Bardon, J.; Dolejska, M.; Nesporova, K. Plasmid-mediated colistin resistance from fresh meat and slaughtered animals in the Czech Republic: Nation-wide surveillance 2020–2021. Microbiol. Spectr. 2023, 11, e00609–e00623. [Google Scholar] [CrossRef] [PubMed]
- Ullah, M.; Rasool, F.; Khan, N.; Ali, S.; Sheikh, A.A. Antibiotic resistance and its gene profile in Escherichia coli isolated from diseased farmraised carps in Punjab, Pakistan. Pak. Vet. J. 2023, 41, 1–7. [Google Scholar]
- Guo, C.H.; Liu, Y.Q.; Duan, X.X.; Yang, T.Y.; Li, F.Y.; Zou, M.; Liu, B.T. High prevalence and genomic characteristics of carbapenem-resistant Enterobacteriaceae and colistin-resistant Enterobacteriaceae from large-scale rivers in China. Environ. Pollut. 2023, 331, 121869. [Google Scholar] [CrossRef]


Disclaimer/Publisher’s Note: The statements, opinions and data contained in all publications are solely those of the individual author(s) and contributor(s) and not of MDPI and/or the editor(s). MDPI and/or the editor(s) disclaim responsibility for any injury to people or property resulting from any ideas, methods, instructions or products referred to in the content. |
© 2024 by the authors. Licensee MDPI, Basel, Switzerland. This article is an open access article distributed under the terms and conditions of the Creative Commons Attribution (CC BY) license (https://creativecommons.org/licenses/by/4.0/).