

Scaling Effects on Morphing Structures: Preliminary Guidelines for Managing the Effects on a Case Study

Abstract
:1. Introduction
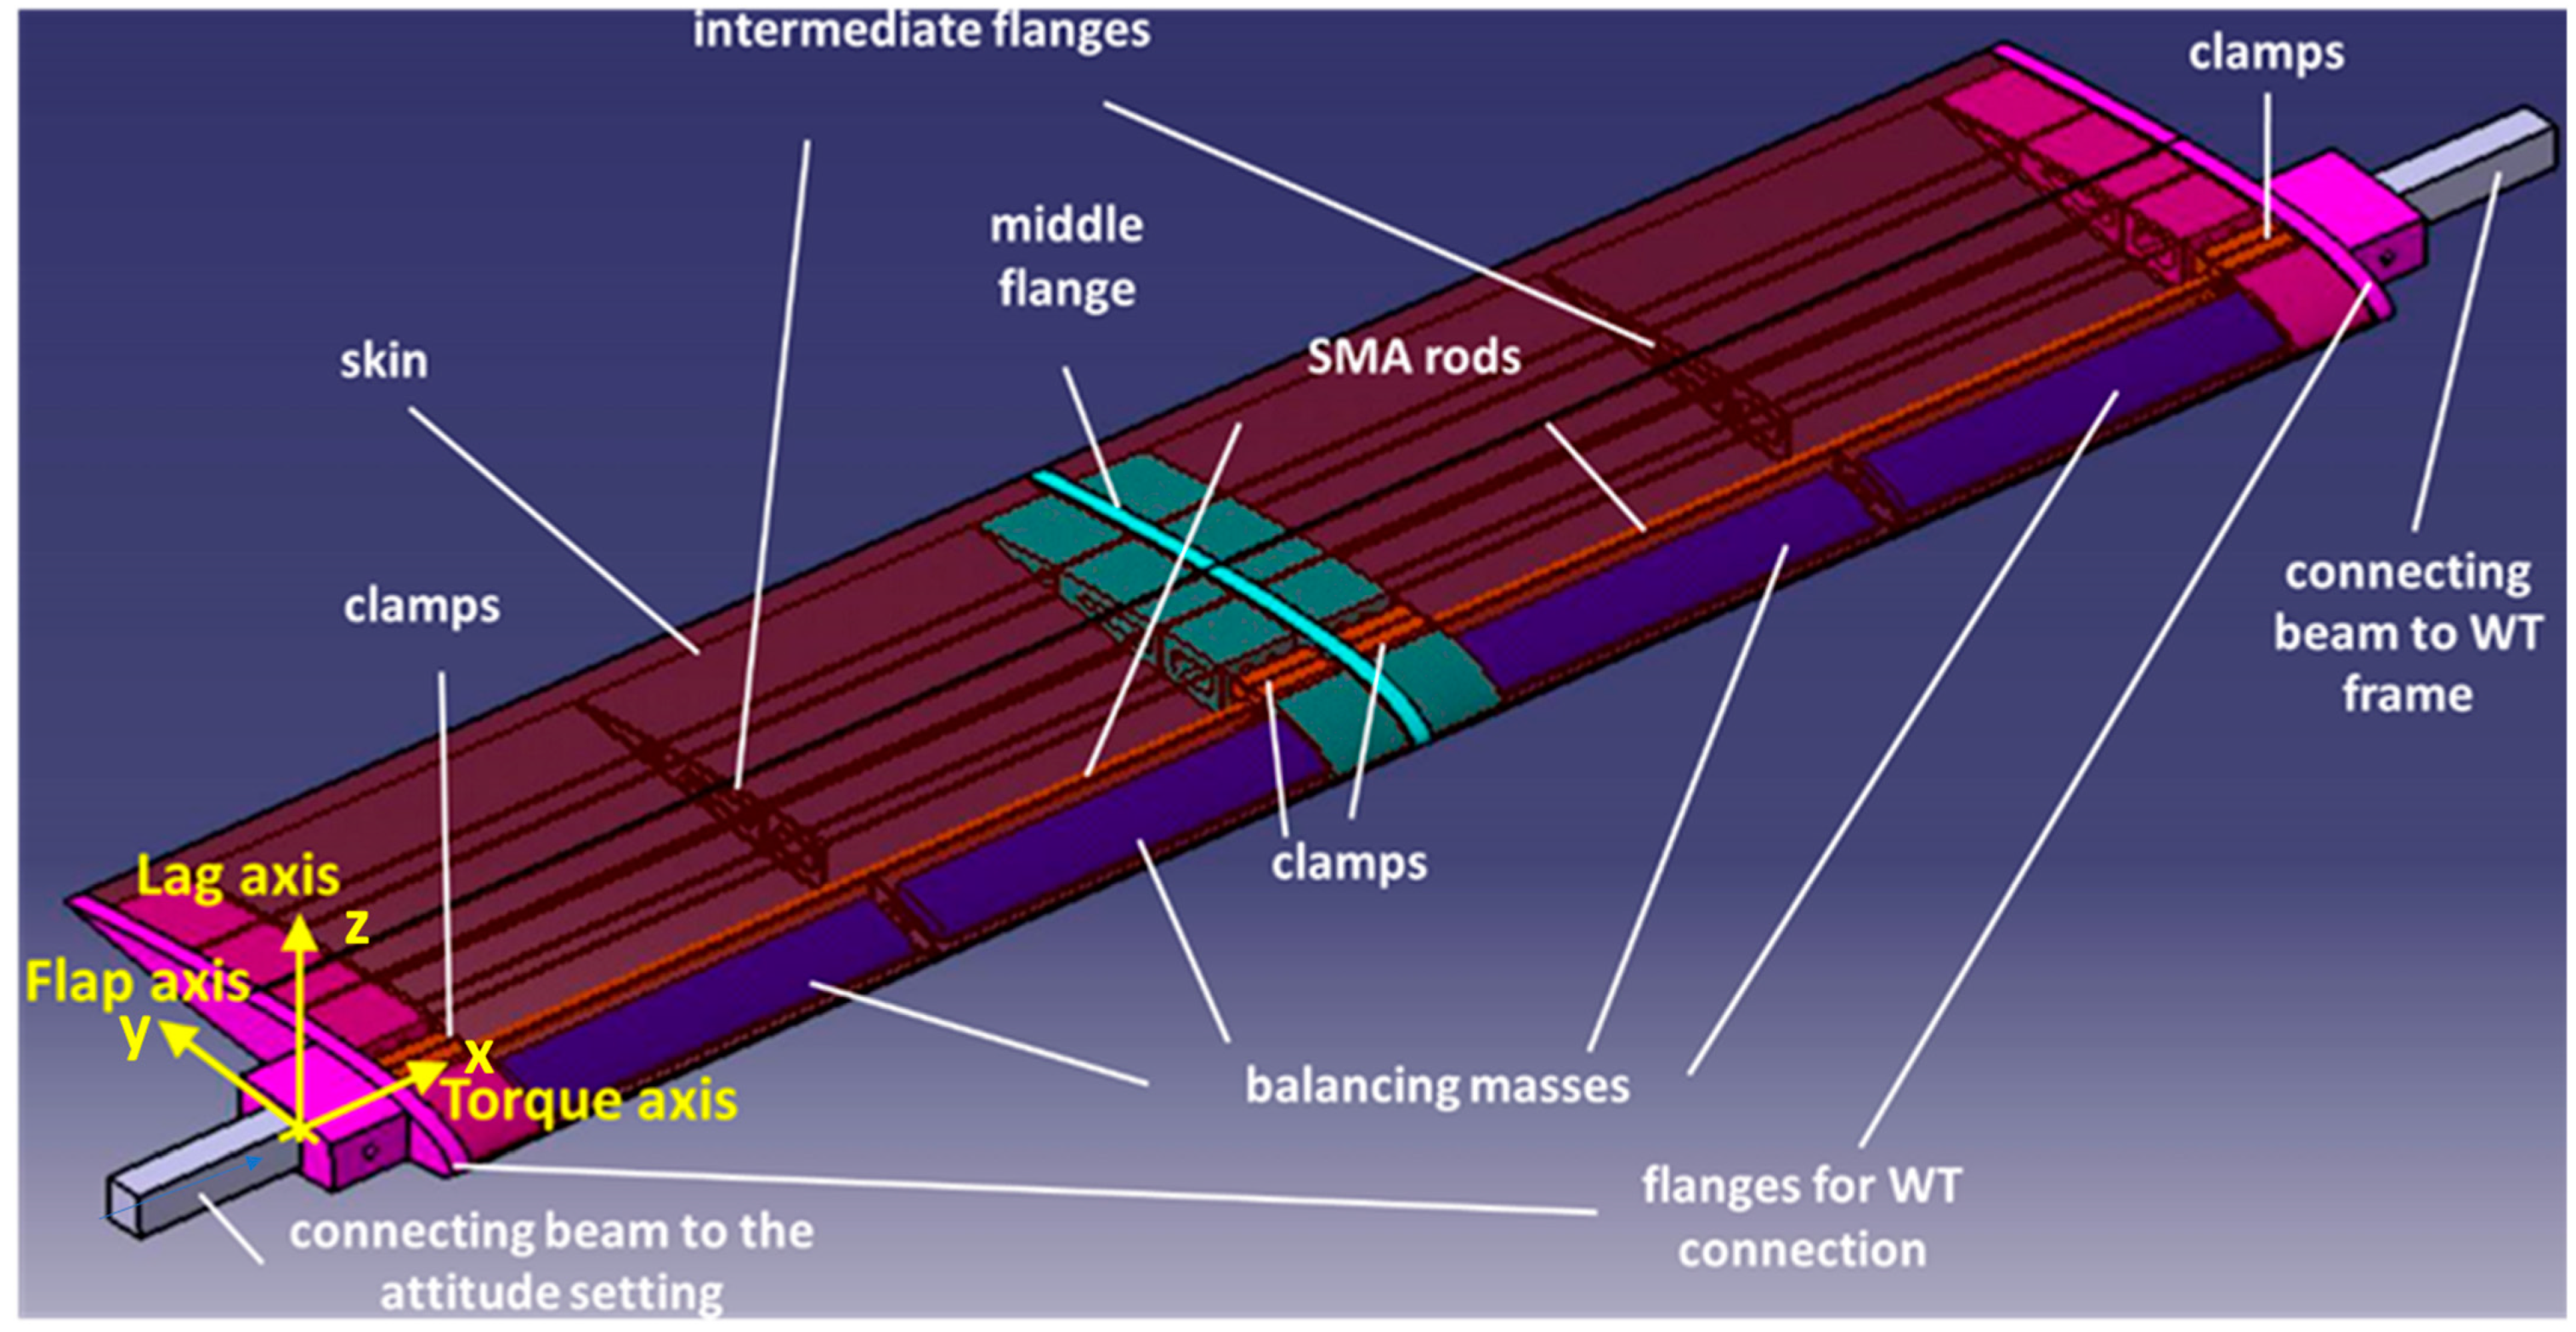
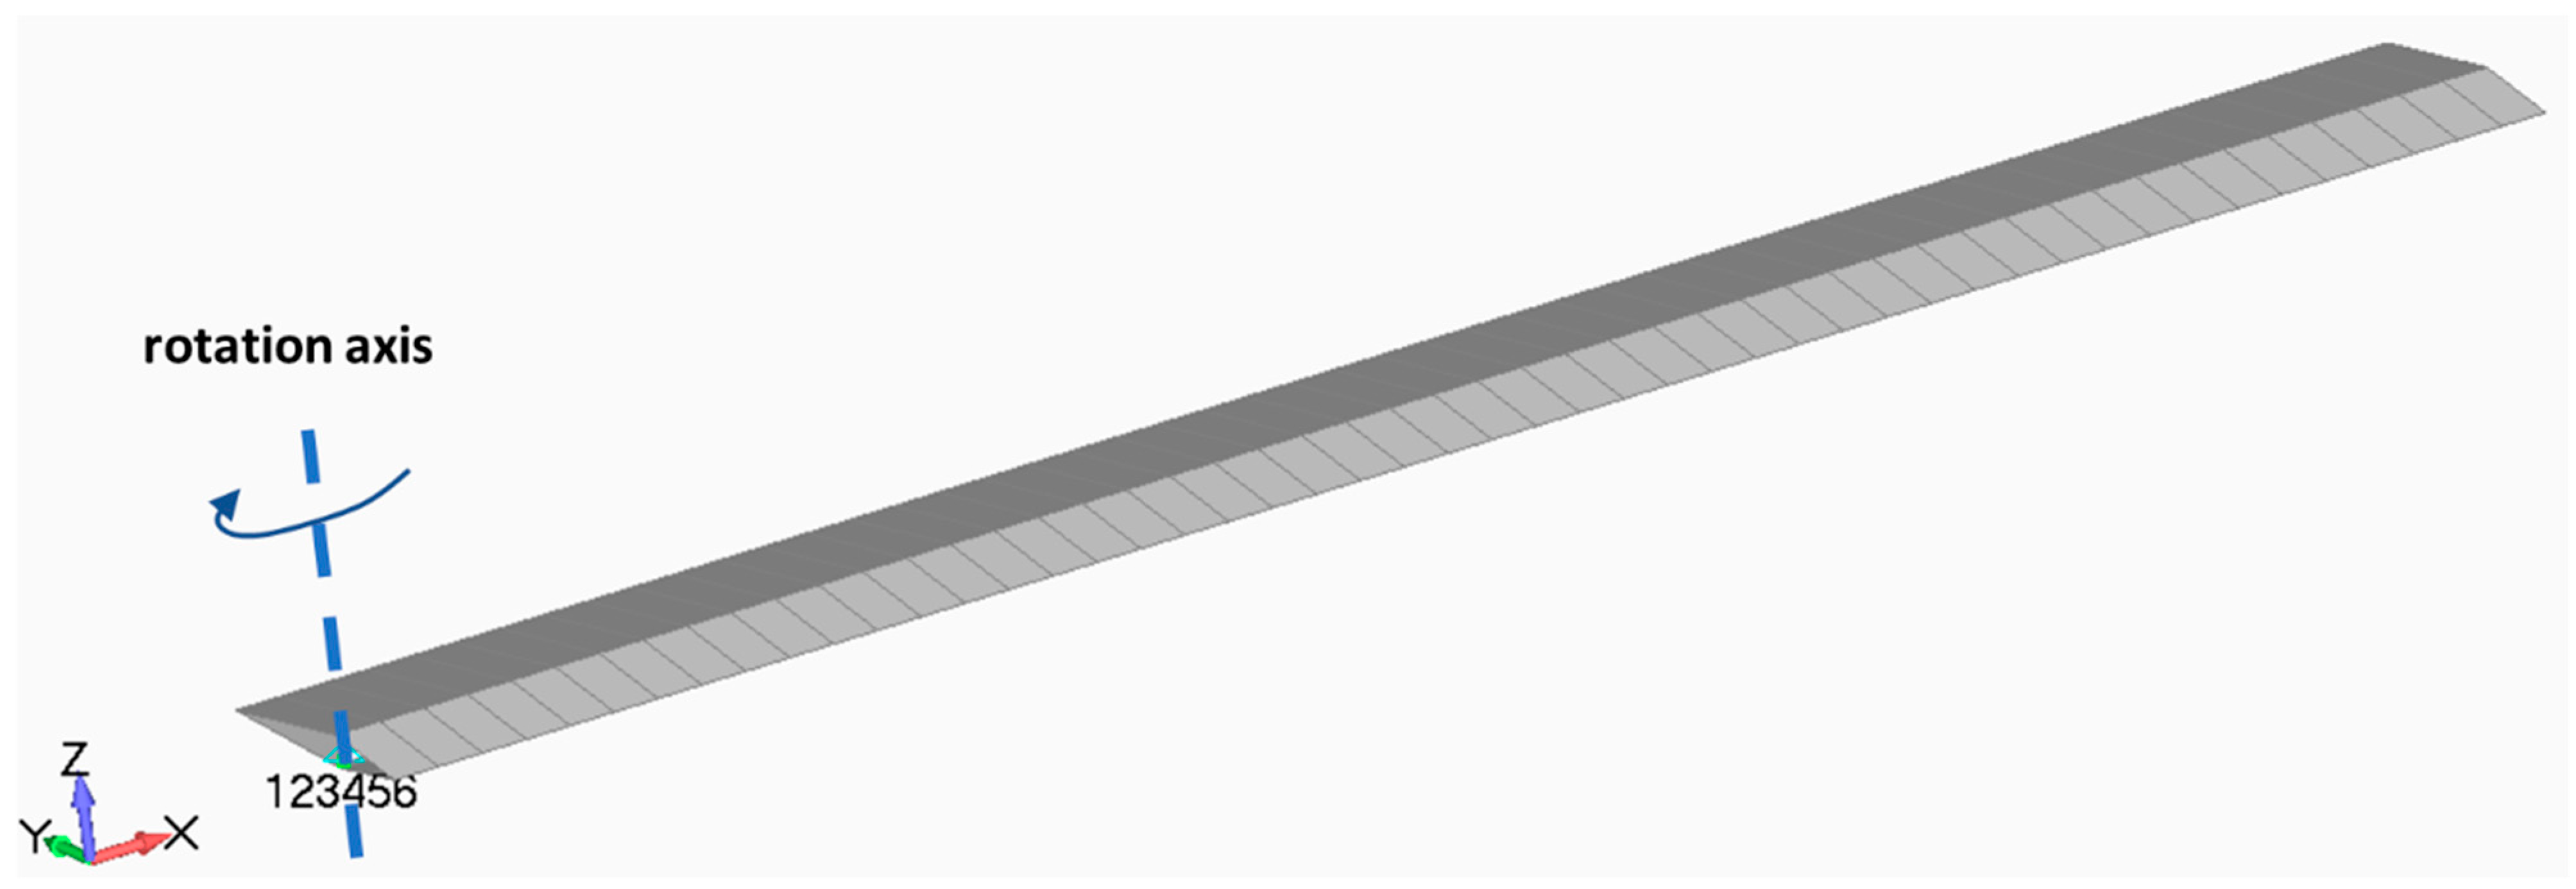
2. The Case Study: An Adaptive Twist Blade Model
- Structural integrity: a safety factor higher than two with respect to the ultimate material stress should have been guaranteed for the most severe load conditions on all of its parts, except for the SMA elements; the surrounding structure was then imposed to bear the operation loads without the cooperation of the shape memory alloy rods. The herein defined safety factor was computed with respect to the ultimate strength of the adopted materials, excluding the shape memory alloy;
- Morphing twist performance: the SMA torque actuators should have been designed to guarantee at least a 2 deg/m twist under the most severe load conditions;
- Shape preservation: in the same way as requested for the external loads, the actuator-induced twist should have preserved the original airfoil geometry; this requirement was quantified by assuming a maximum absolute shape deviation vs. the nominal one, smaller than the typical roughness of 350 μm, adopted for laminar wind tunnel tests [52].
- The maximum SMA temperature was set to never exceed 180 °C, to avoid any property degradation or the onset of damage to the surrounding components; this requirement, which is well over the operational temperature considered in the next sections (never surpassing 100 °C), was met through a dedicated temperature control logic and, for safety reasons, through the implementation of thermal fuses aimed at interrupting the heating supply circuit if a certain threshold should have been overcome.
- The structural safety factor was set to a minimum value of two for all parts of the demonstrator except for the SMA rods. In the latter case, in fact, to produce enough martensite exploitable for actuation, an adequate pre-load should have been provided. This exception was possible because of the location of the SMA components that, being embedded within the main structure, prevented any projection of possible debris during the tests following the crisis of those specific components.
- The mass layout was designed so that its centre of gravity fell within the first quarter of the chord to ensure aeroelastic stability; even though this requirement was met by the adopted layout, further balancing masses could have been used to shift the barycentre further forward.
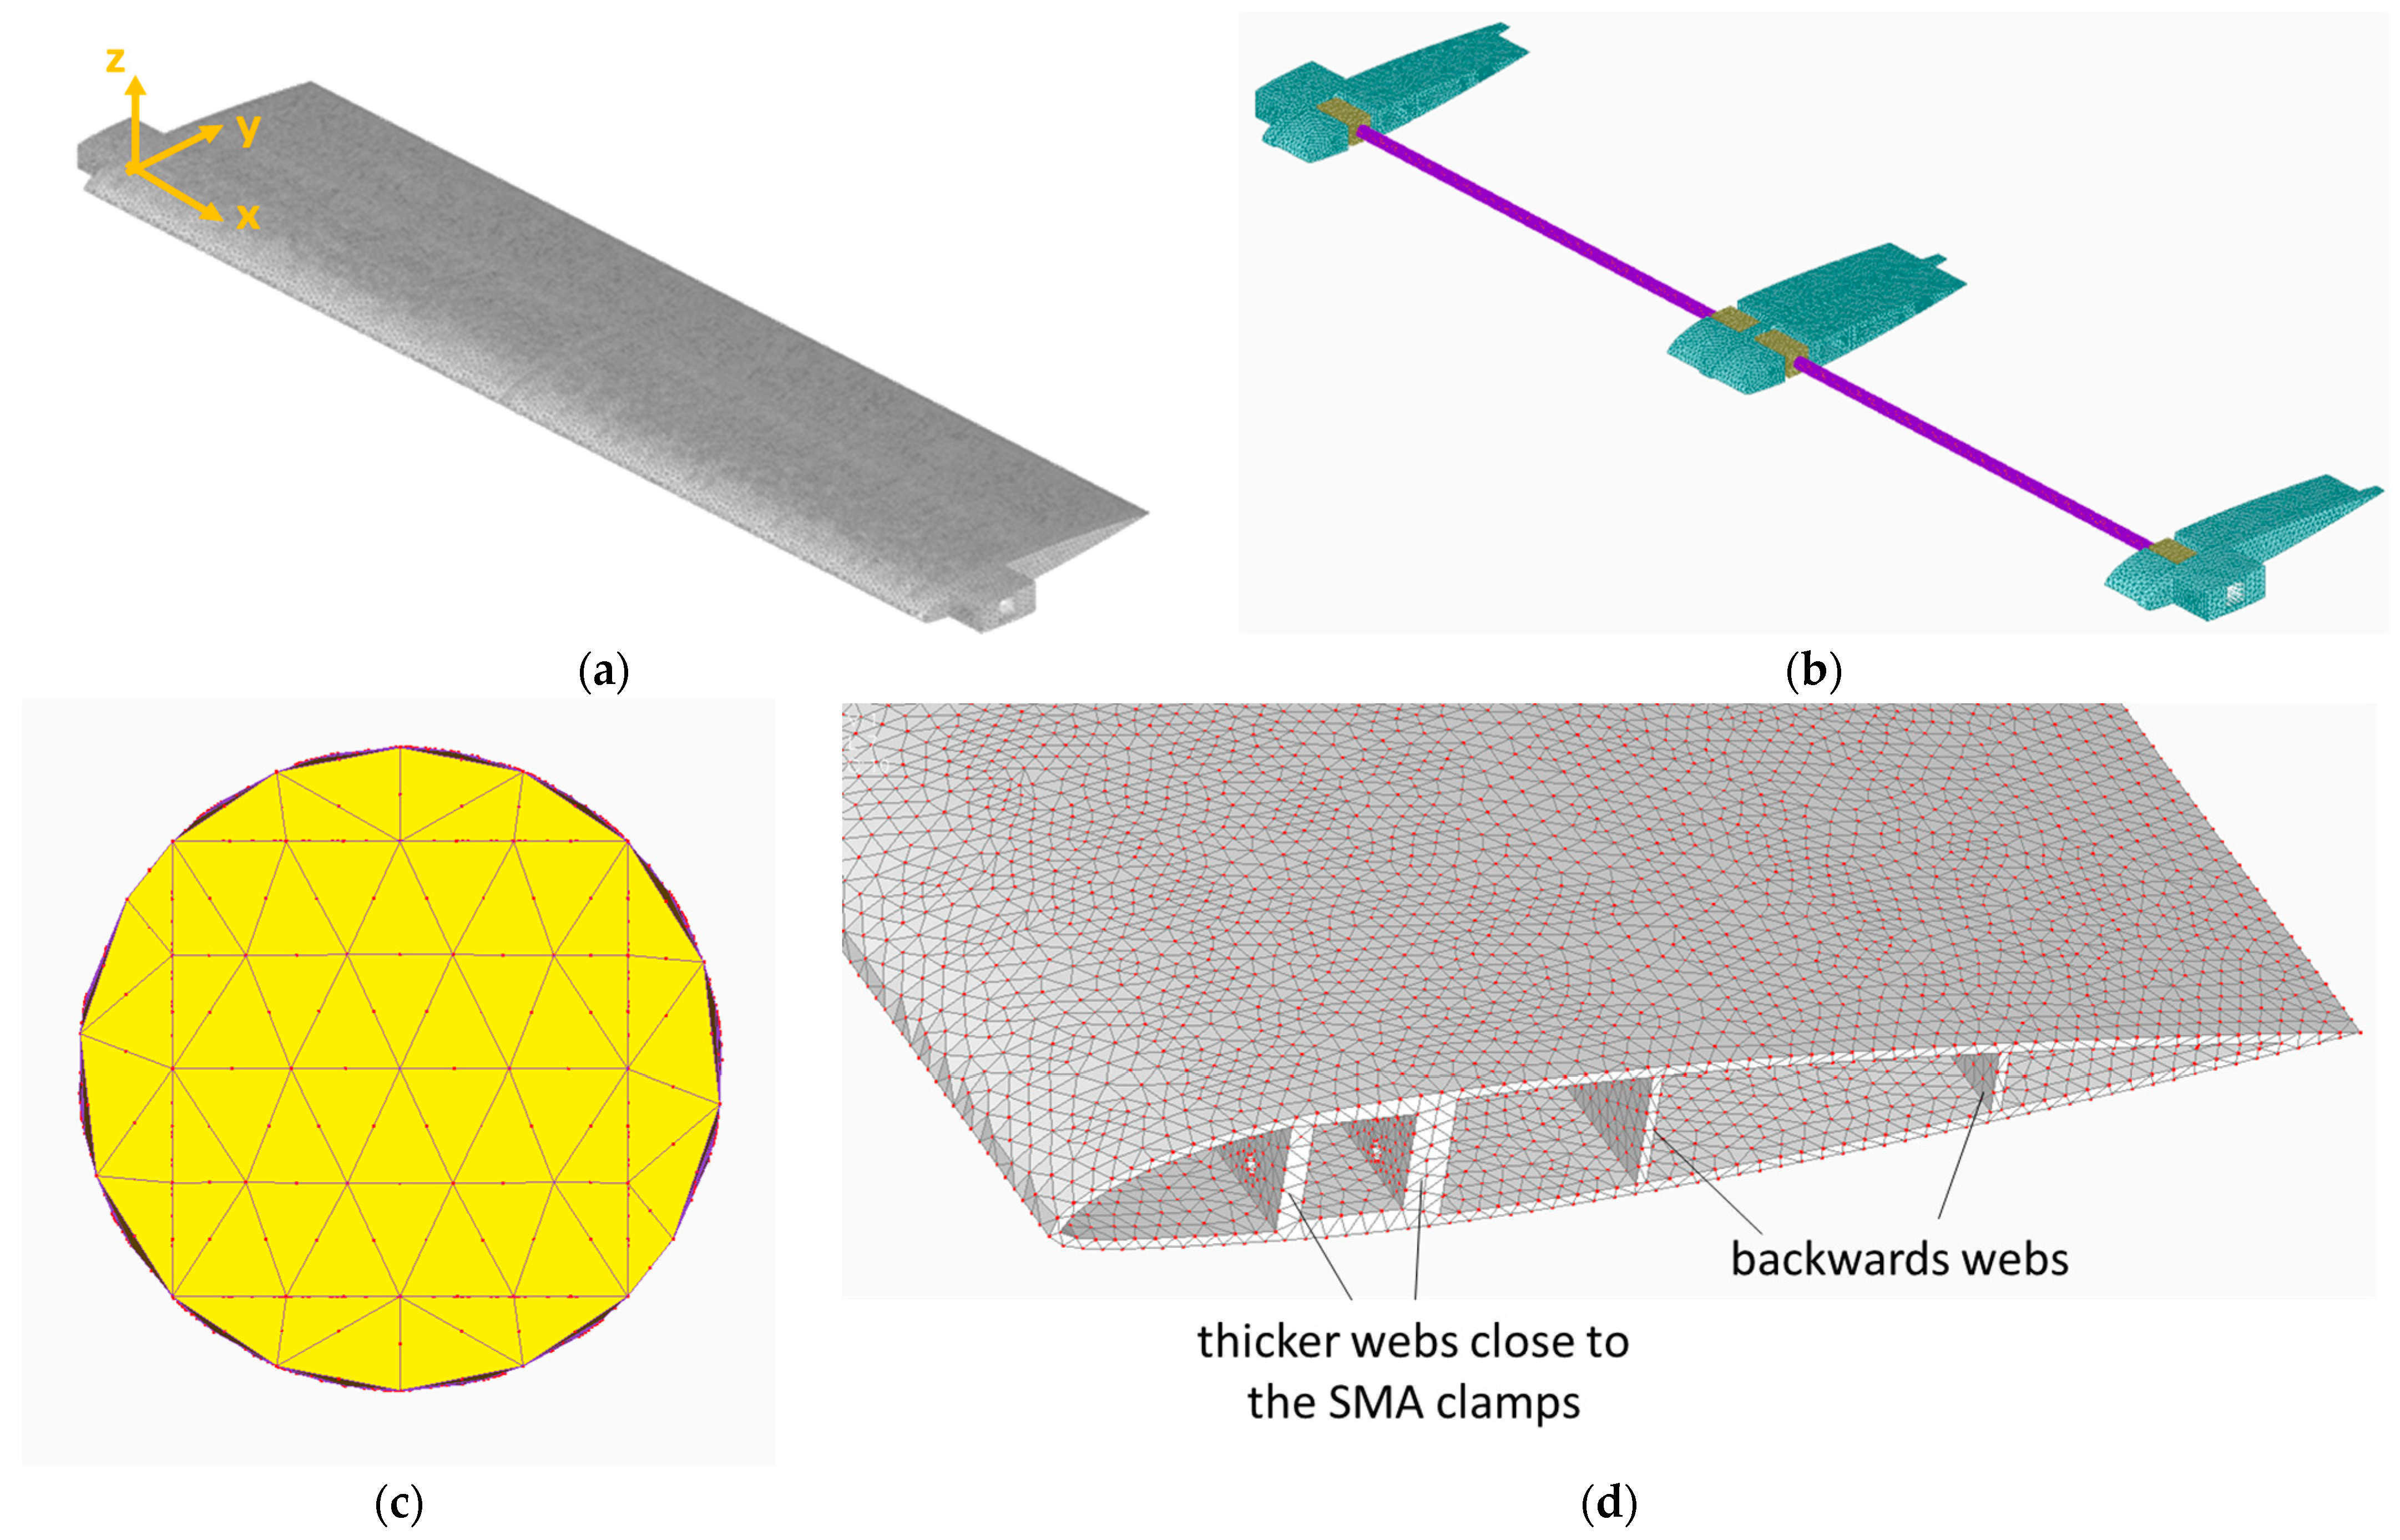
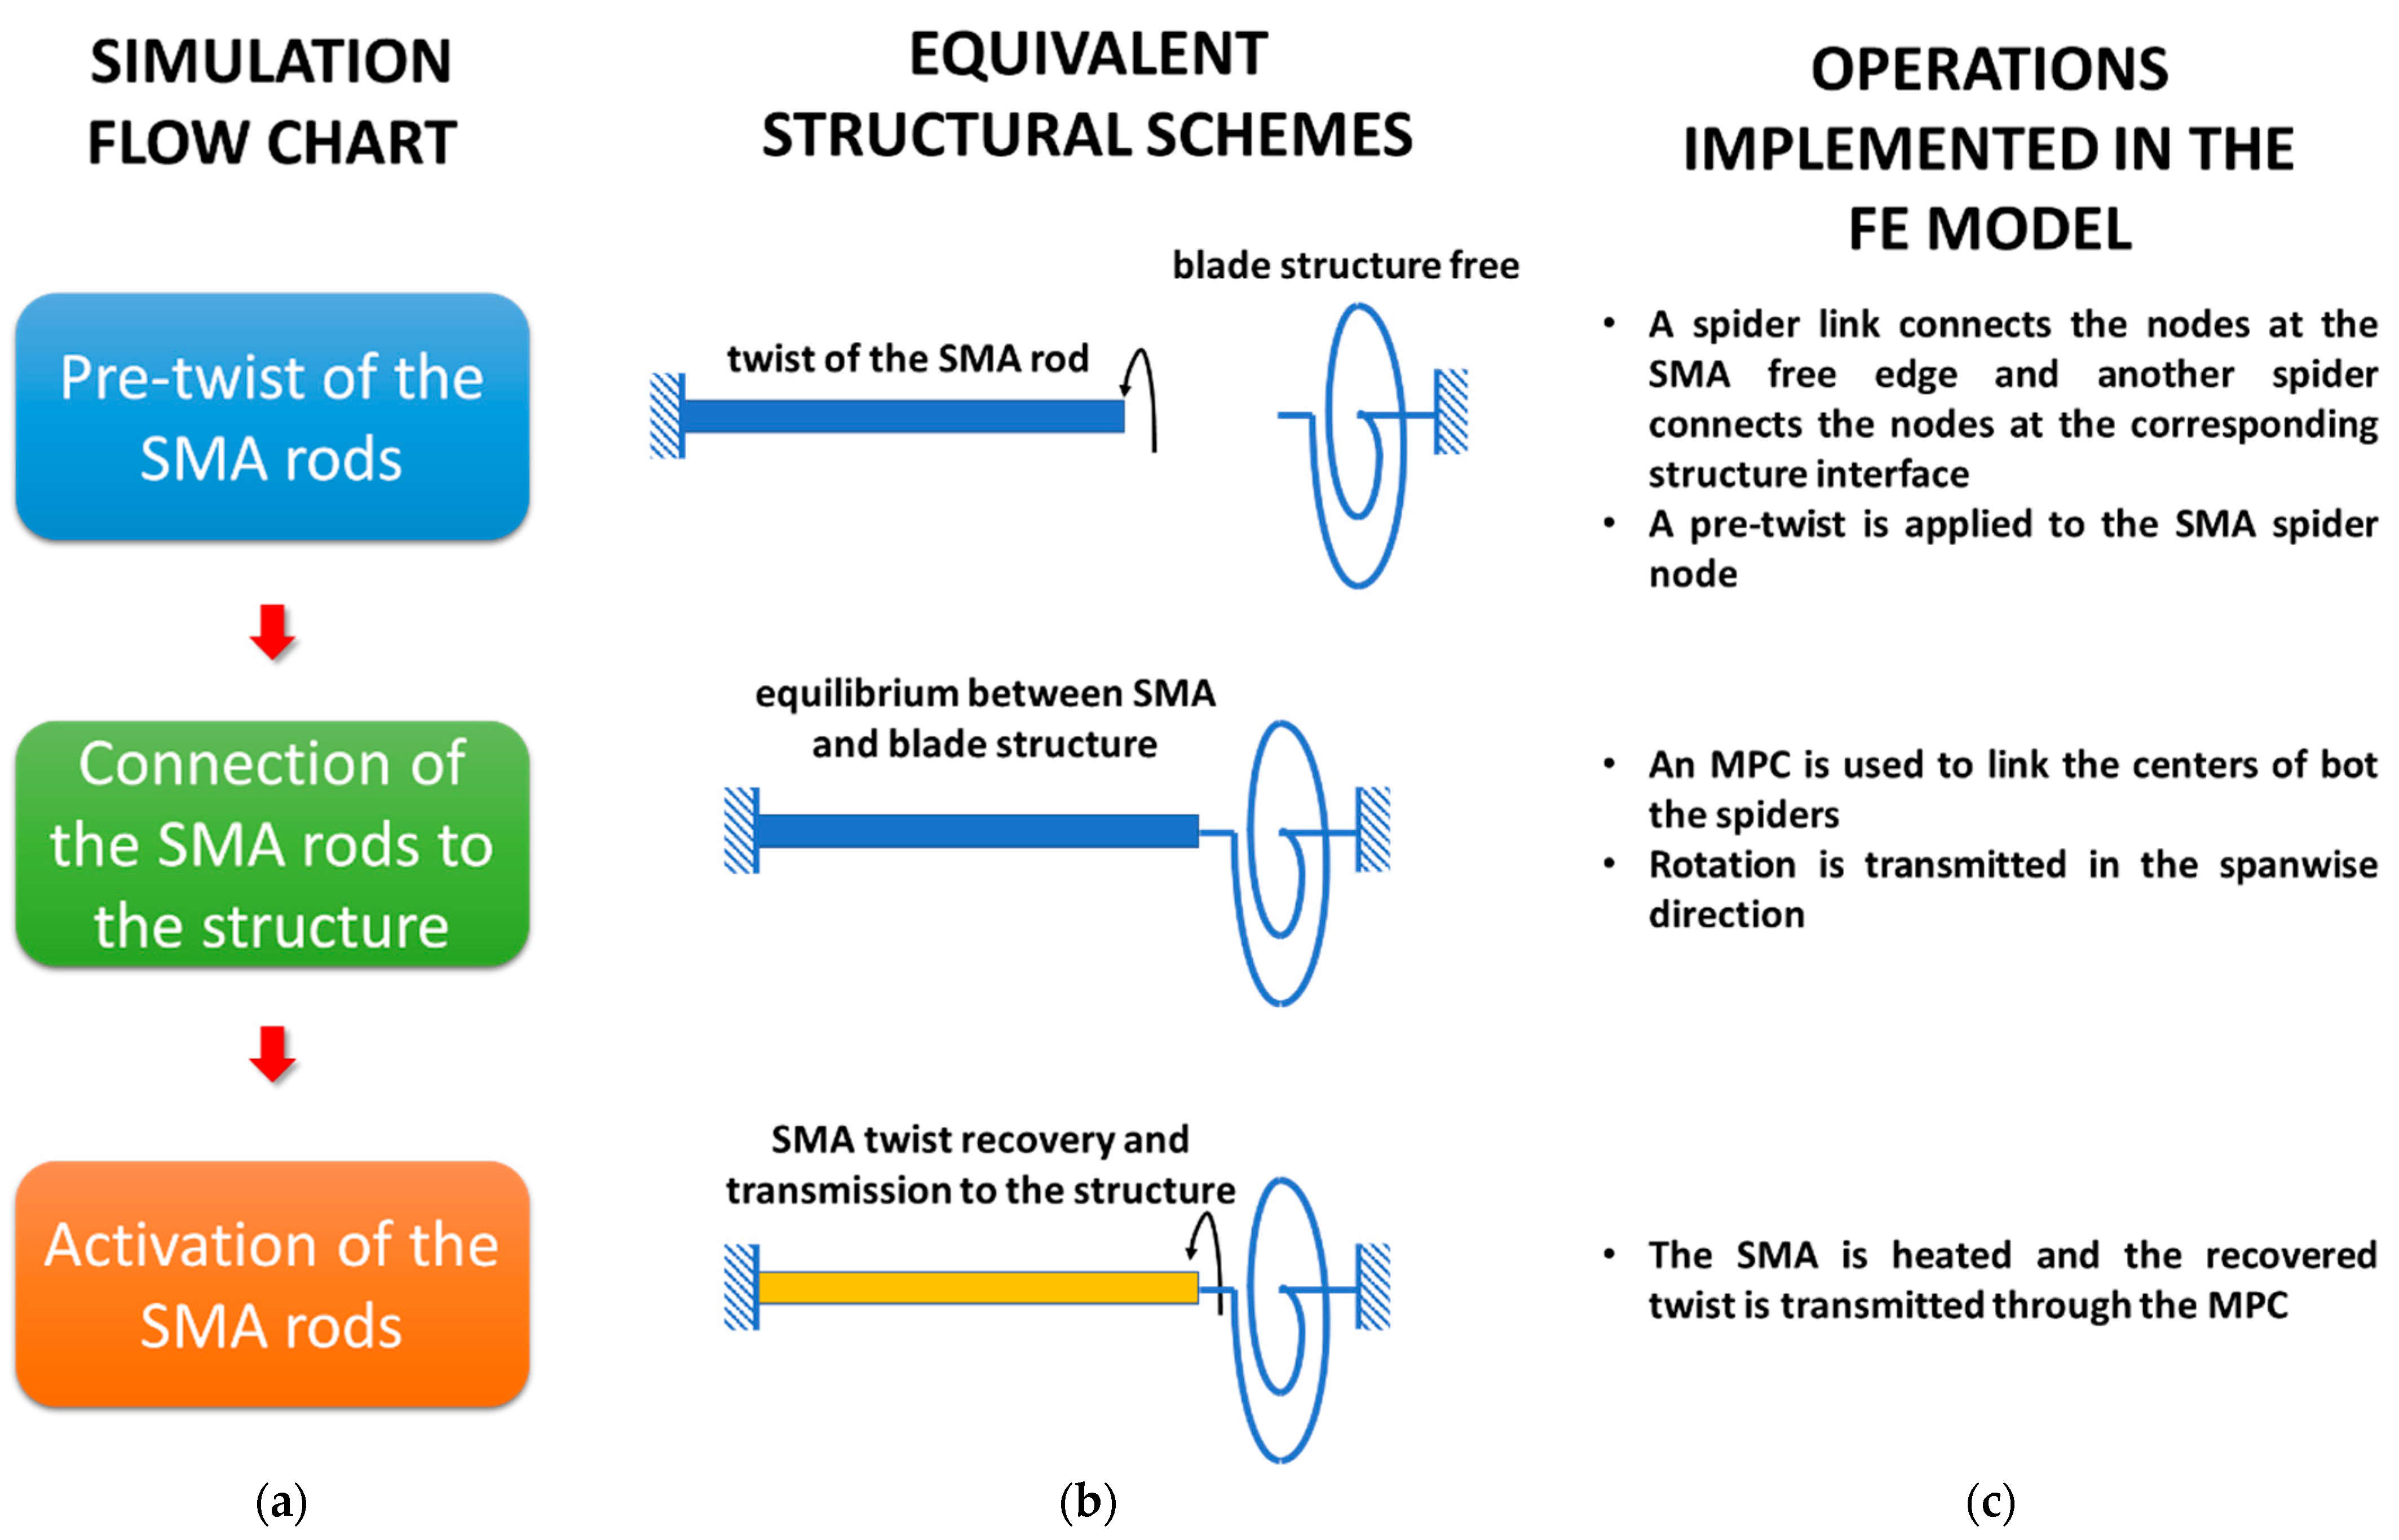
3. FE Model Development
- In the pre-twist phase, (a), the actuator is twisted by an imposed torque applied to a node on the centre of the edge of the SMA rod, linked to the other surrounding nodes through a spider rigid element. This generates a pre-existing stress field within the active element that is not yet connected to the main body at this stage. To the zone of the elastic structure that will be connected to the SMA, another spider is applied, connecting all surrounding interface nodes to a central one.
- In the connection phase, (b), the interface sections of the SMA rod and the structure body are connected via a multi-point constraint, or MPC. The MPC is used to define a linear relation among the components of the above-mentioned central nodes’ displacement by introducing the coefficients of that function. In that manner, the displacements reported in the MPC cards block are distinguished between dependent and independent degrees of freedom, therefore reducing the effective degrees of freedom to a pre-defined set [58]. The applied twist moment (a) is then removed and the system reaches an equilibrium point, as the increased structural elastic forces balance the residual twisting action of the SMA.
- In the activation phase, (c), the shape memory alloy element is heated, inducing a strain recovery, and therefore transferring a further deformation to the structure. Since it tends to report the SMA deformation as zero, it has the same level of deformation as the one experienced in phase (b), for both the blade and the active rod. In the real operation, the temperature variation is provided by a heater coil deployed around the SMA rod, while, in the simulation process, a uniform temperature is simply imposed to the shape memory alloy.
4. Parametric Analysis
- The Young modulus, the Poisson ratio, and the density in both the martensite and austenite phases;
- The transformation stresses, and the associated transformation temperatures;
- The stress and temperature slopes along the forward (A → M) and rearward (M → A) transformation processes.
- Axial, flap, and lag bending stiffness and torque rigidity vs. sc;
- Actuation performance vs. sc;
- Stress level vs. Reynolds (Re) and Mach (M) numbers;
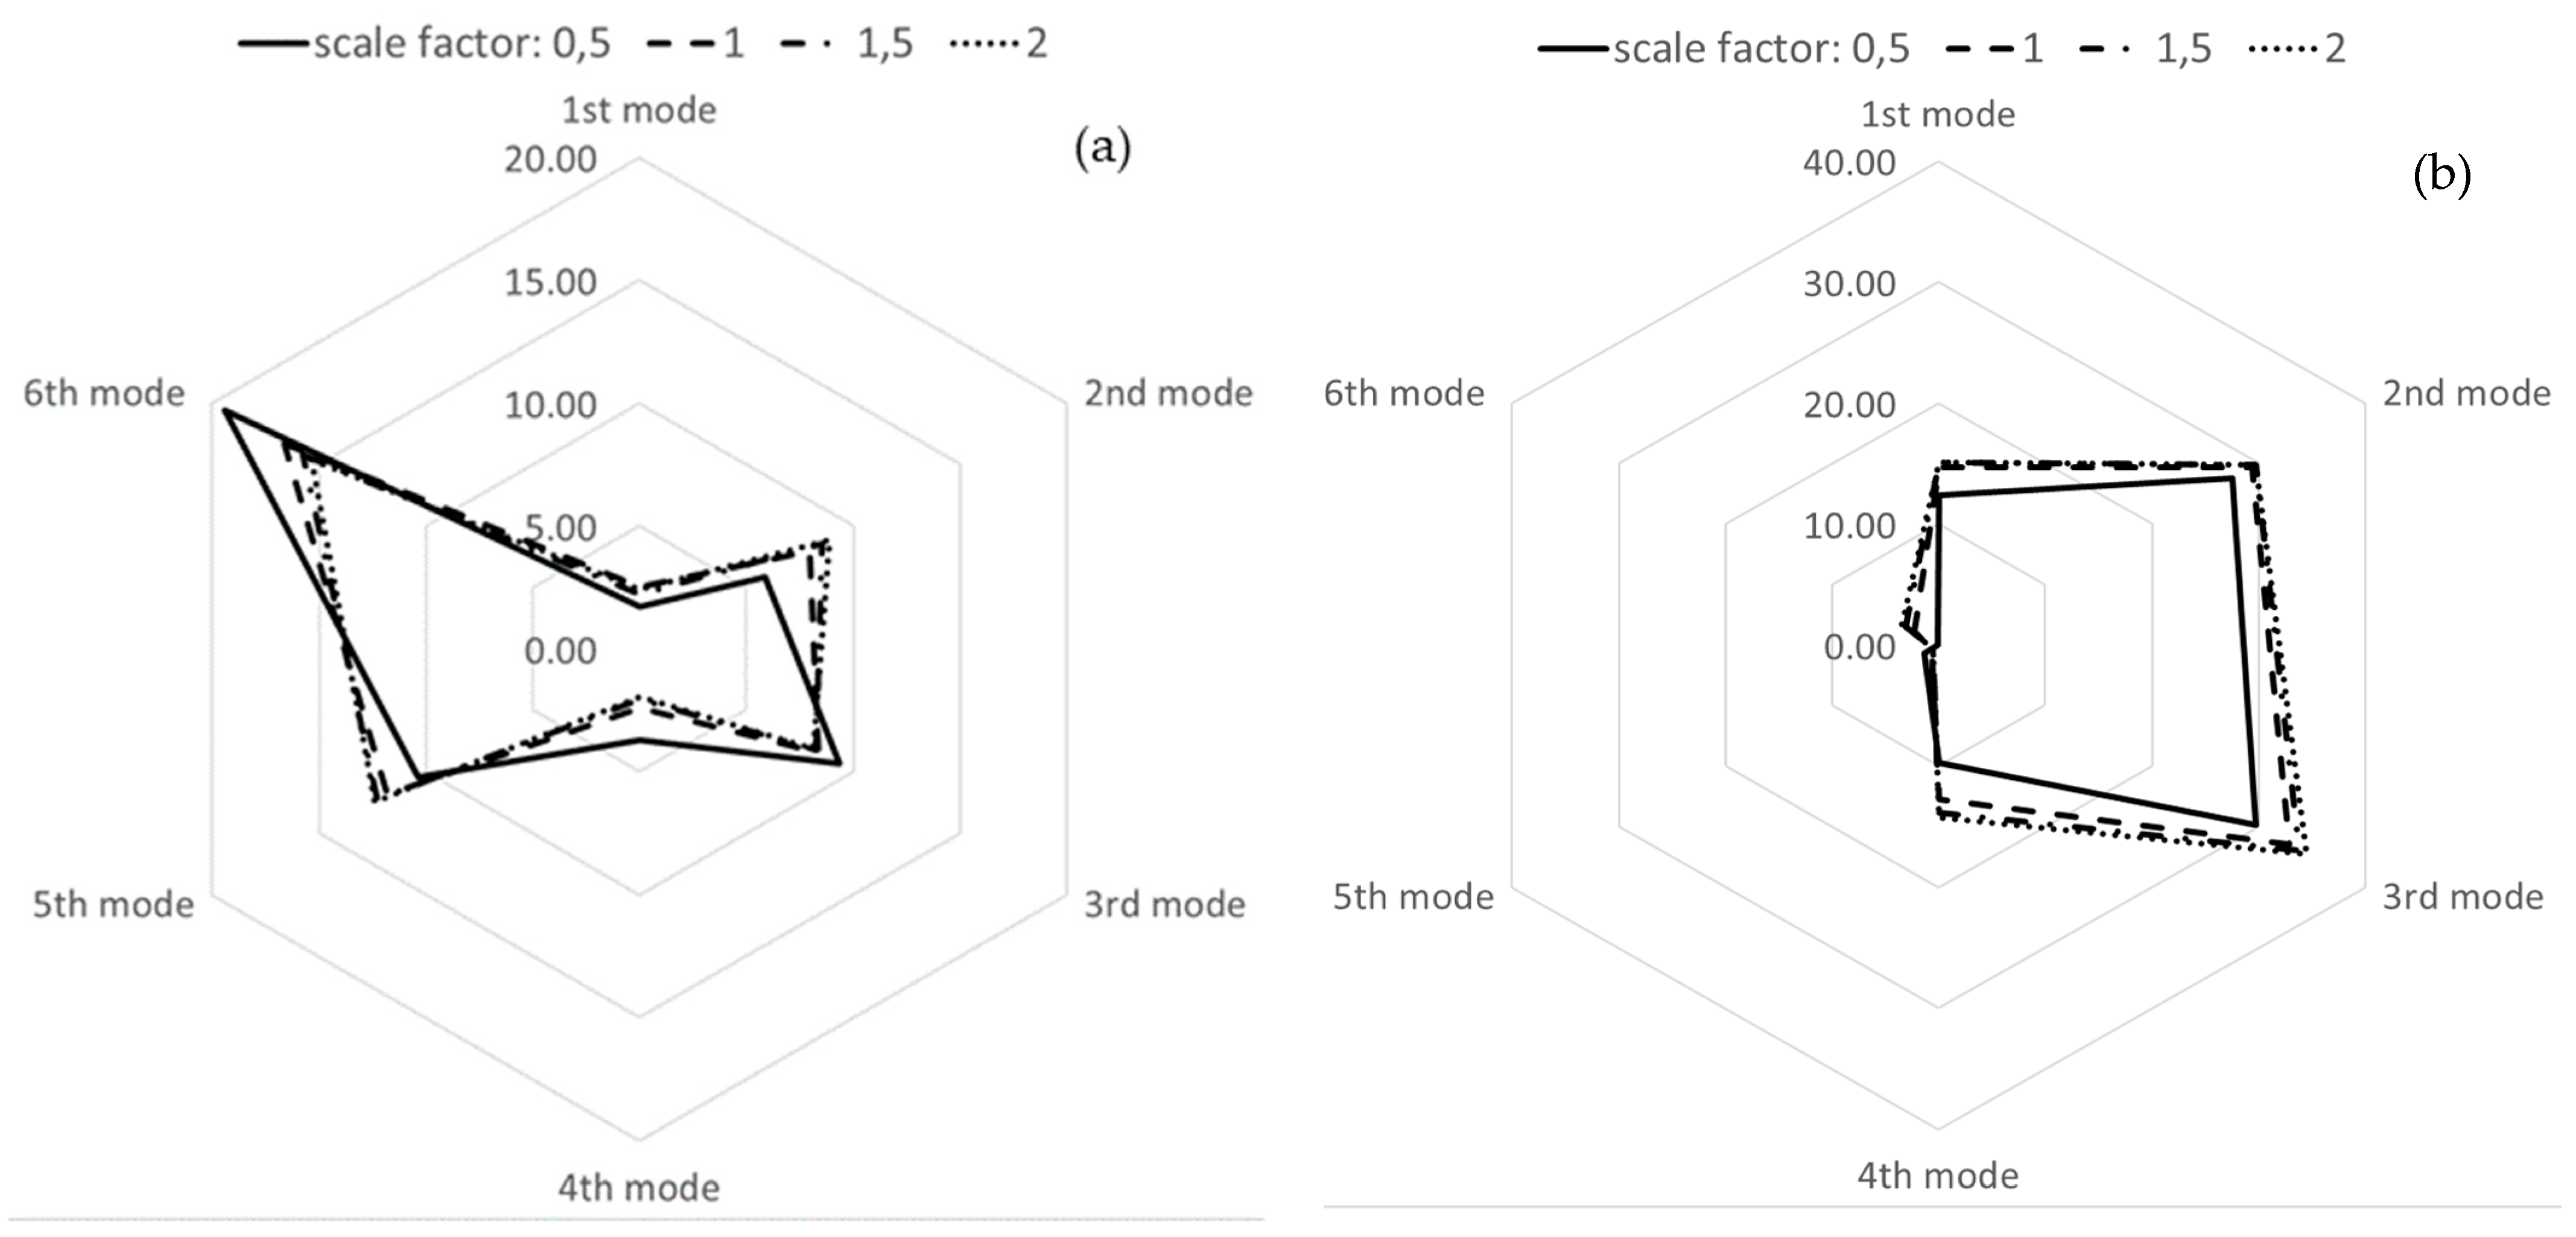
- Normal mode characteristics vs. sc;
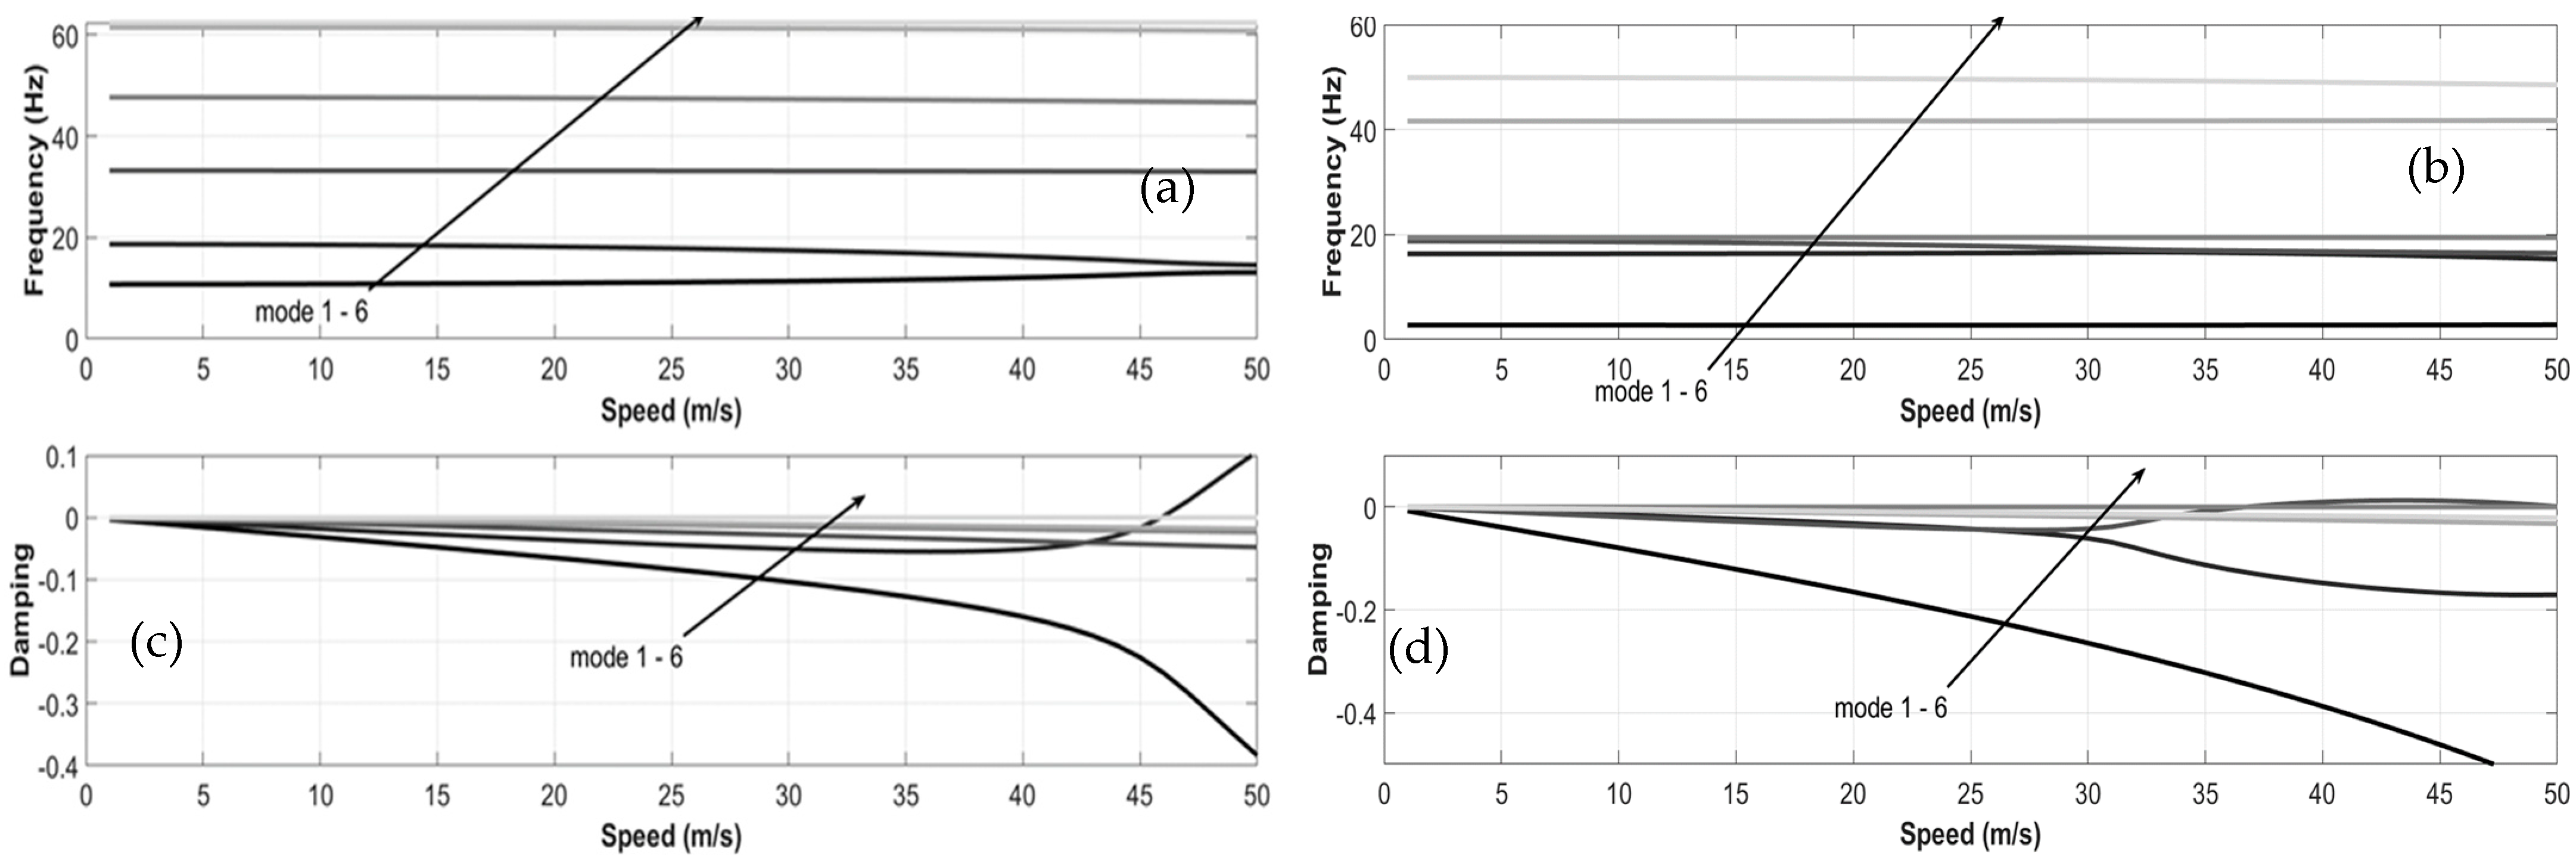
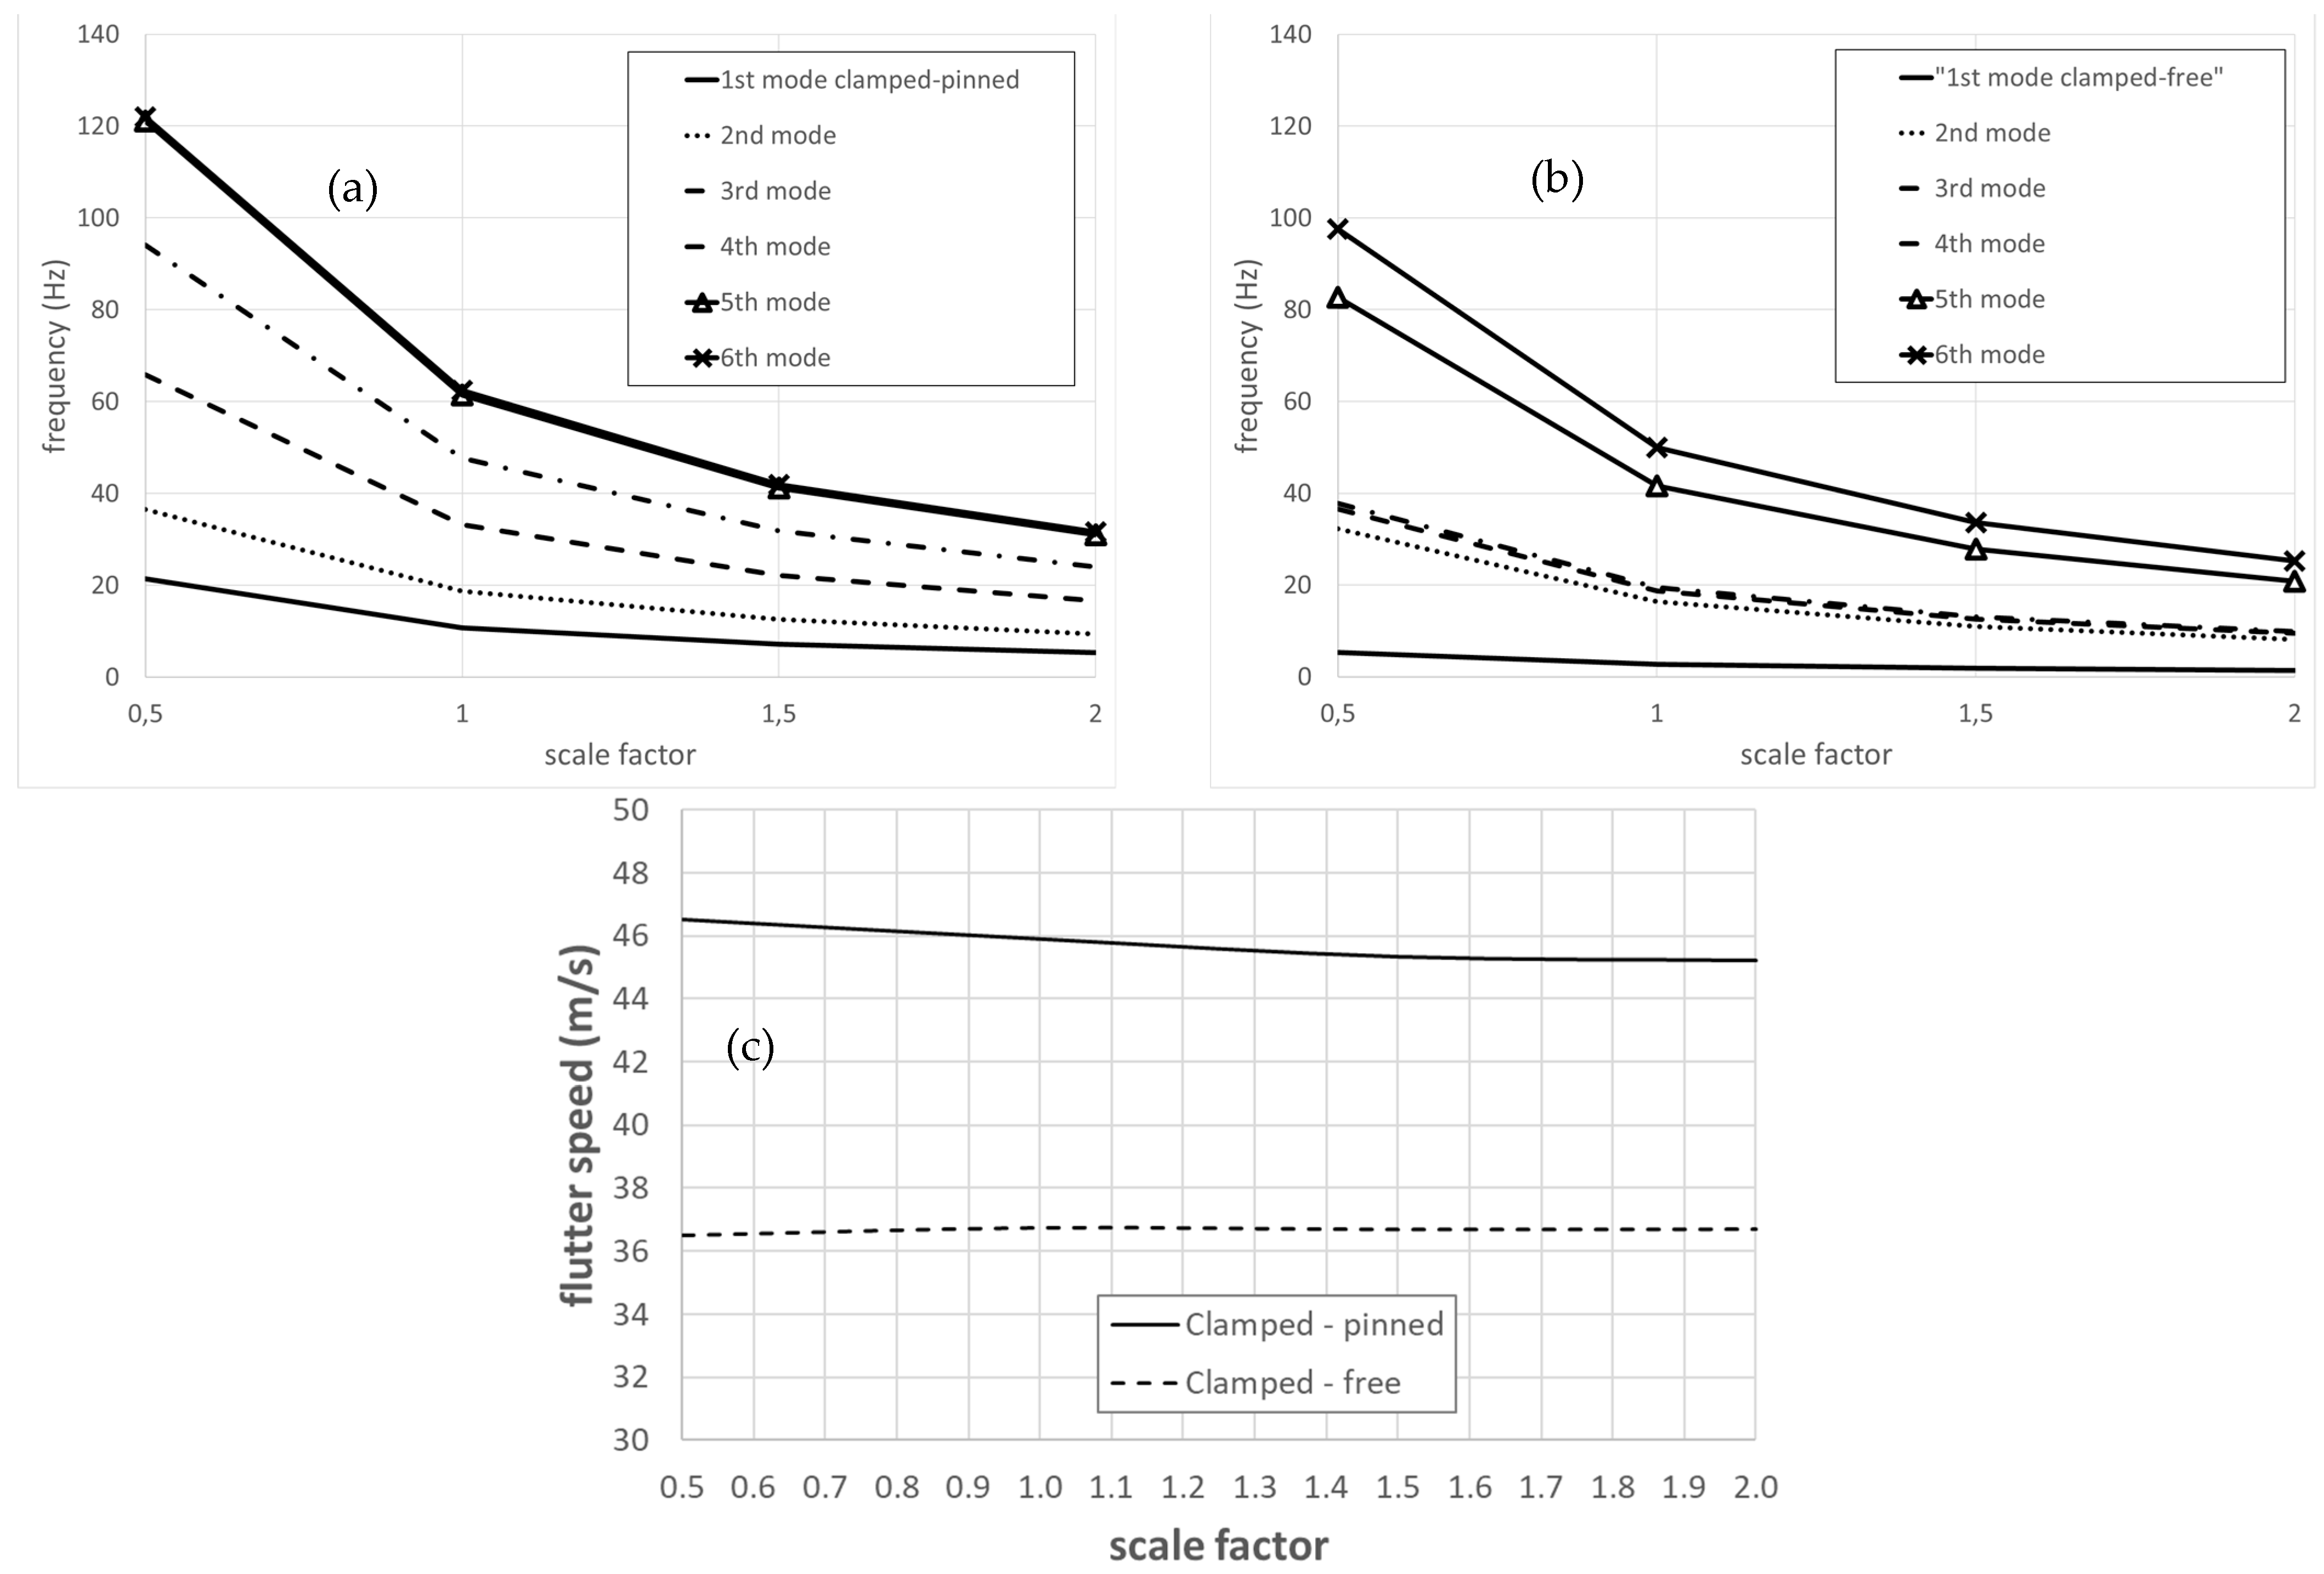
- Aeroelastic behaviour (flutter analysis) vs. sc;
- Rotodynamic features (Campbell diagram) vs. sc.
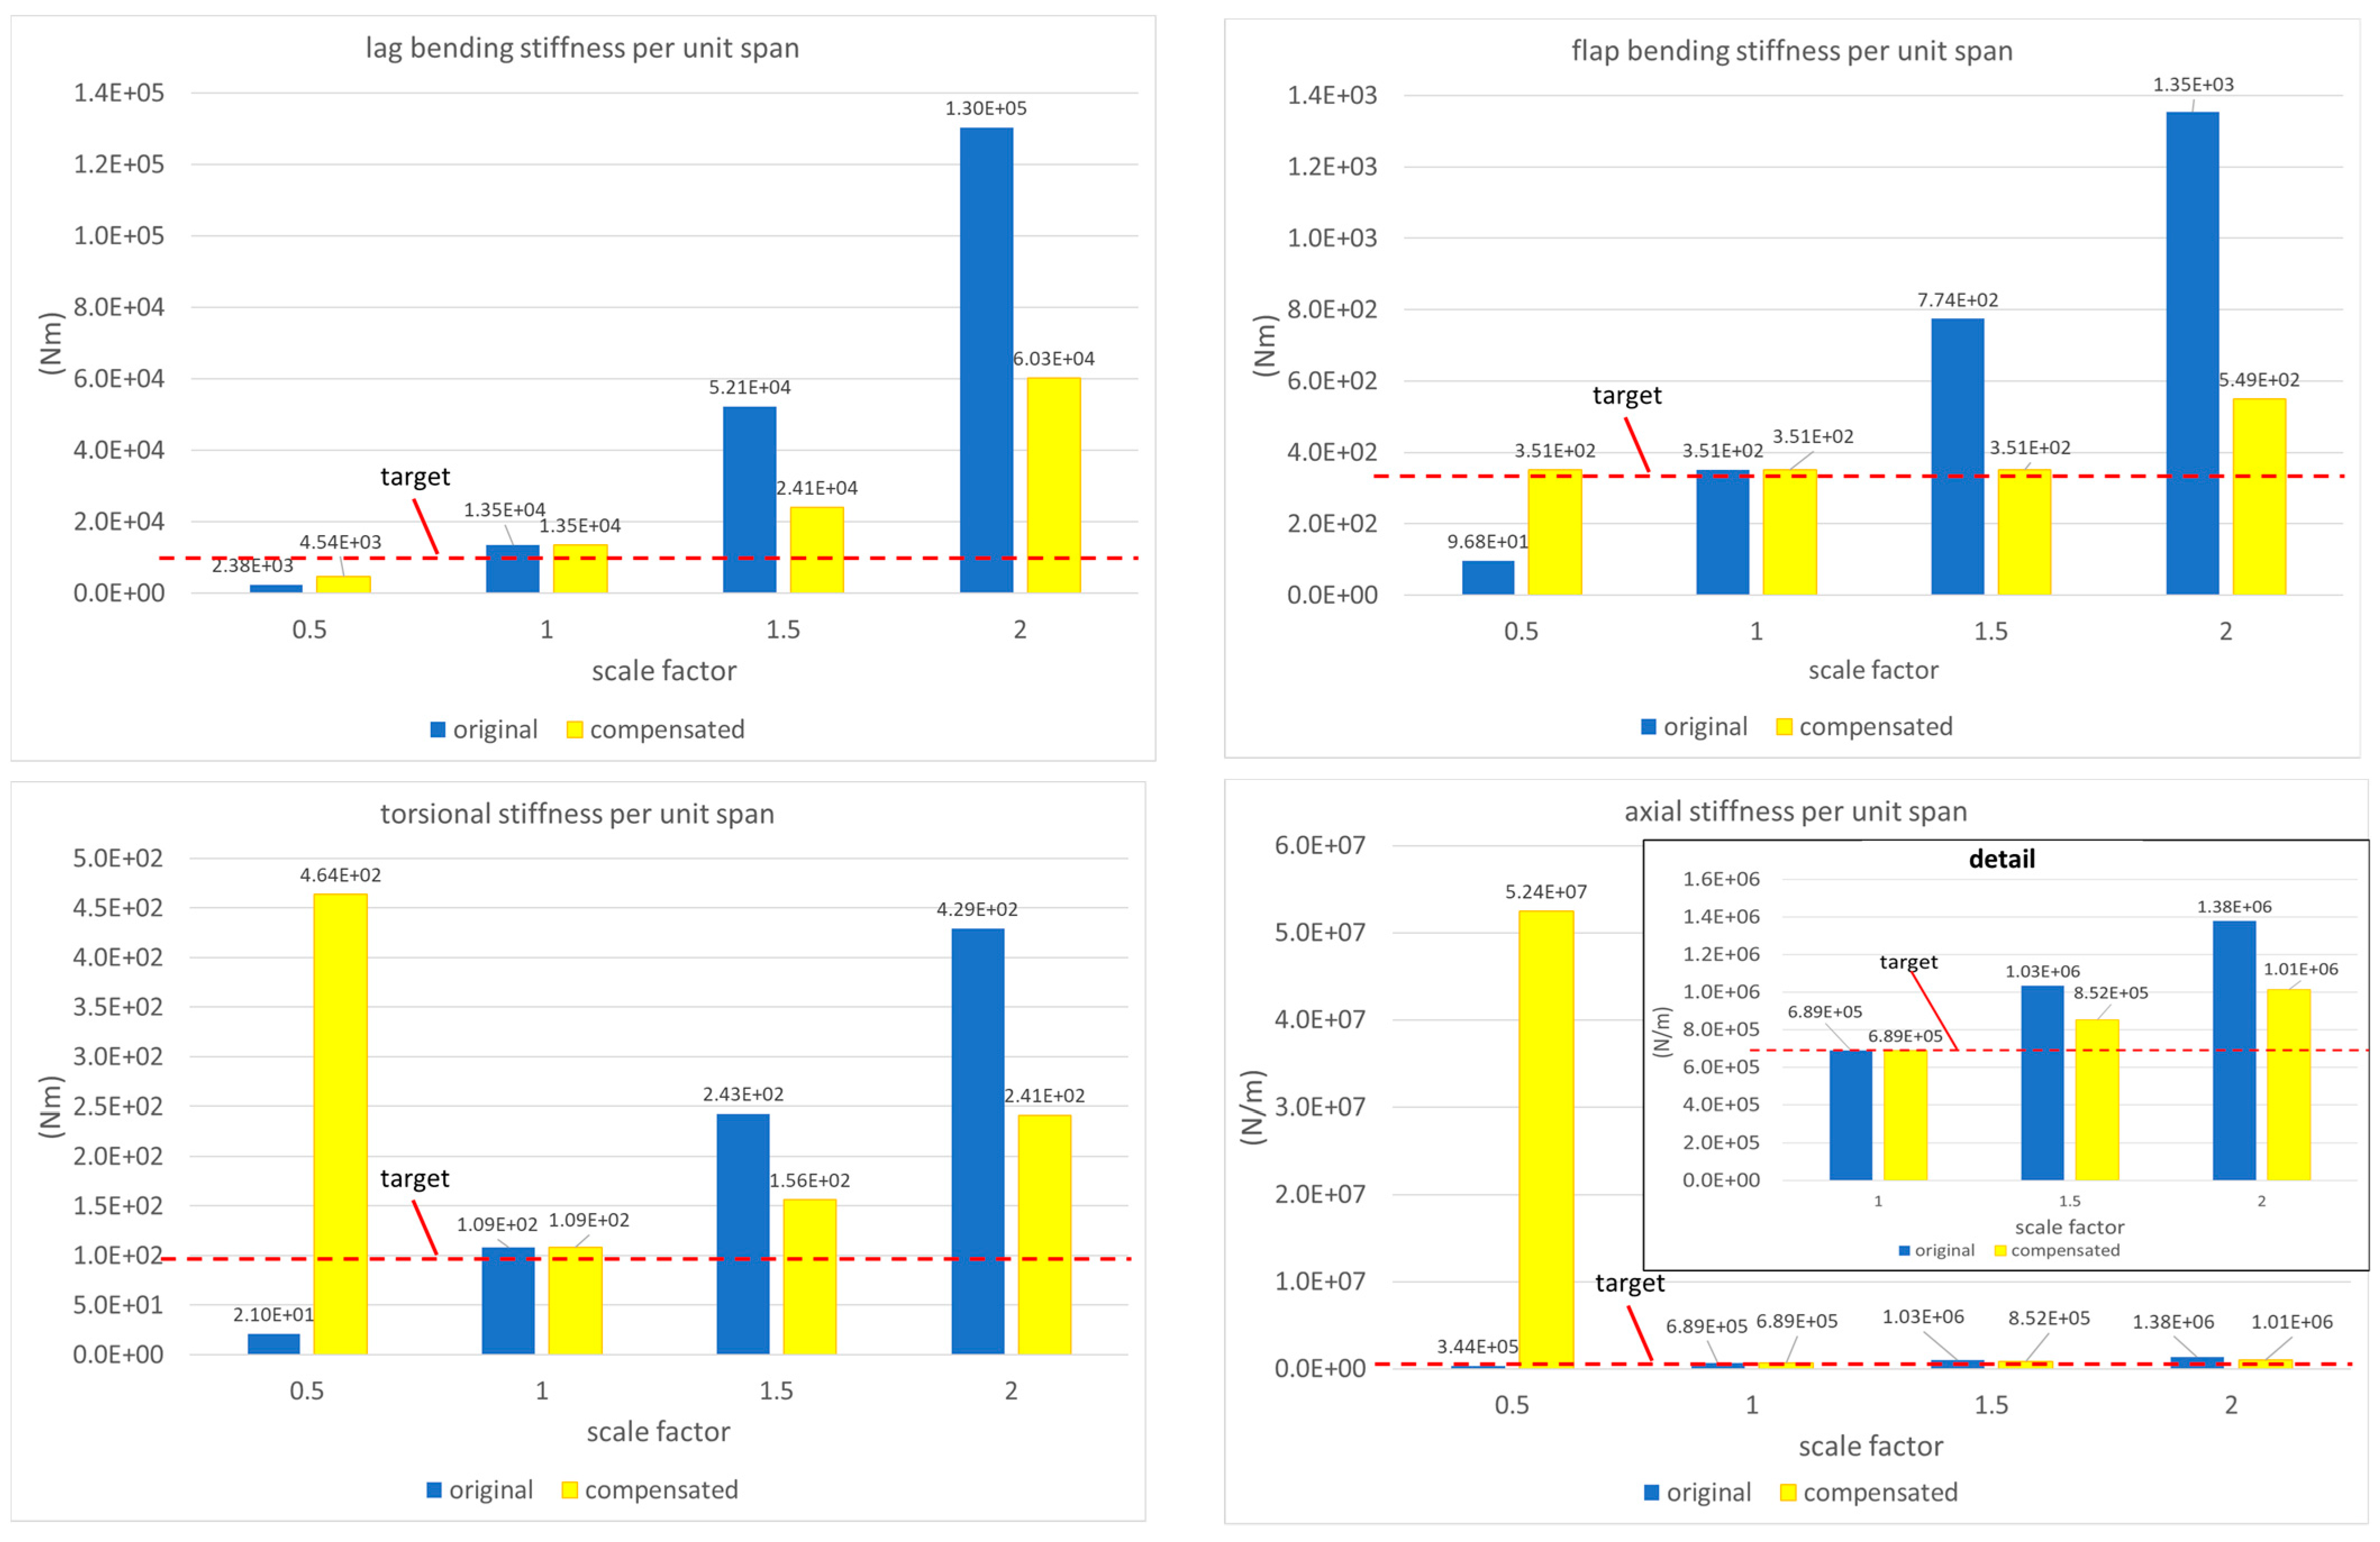
5. Stiffness versus sc
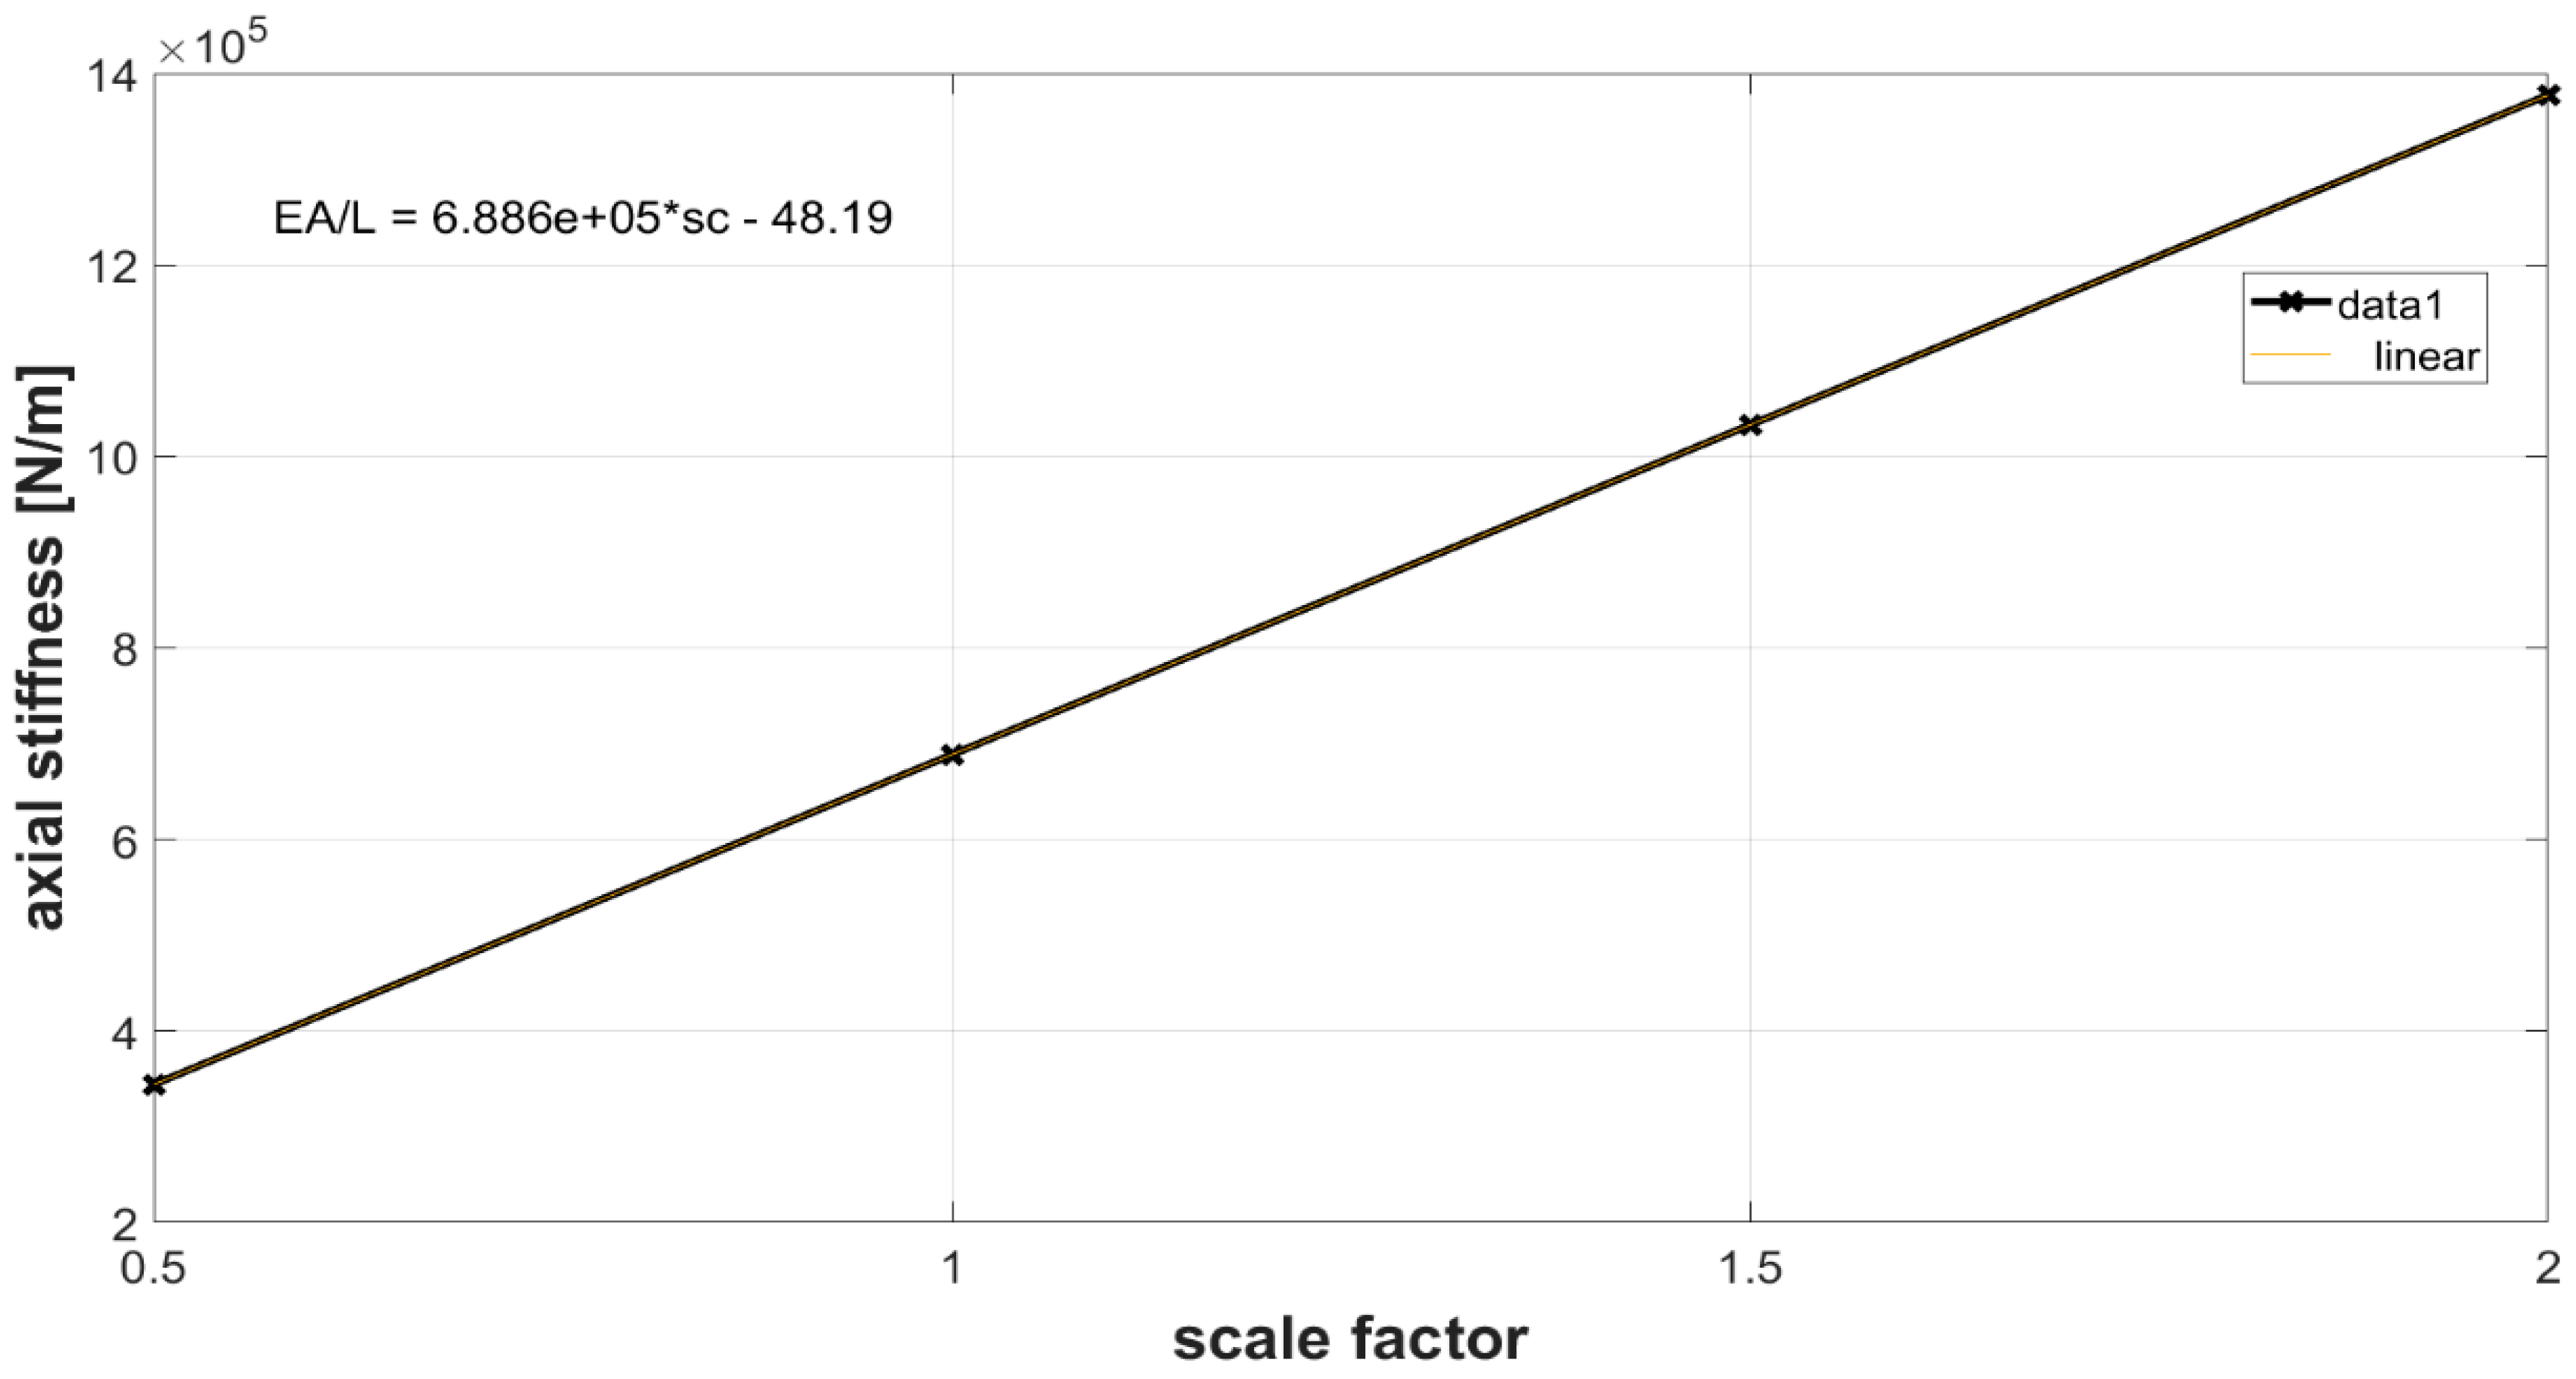
5.1. Axial Rigidity
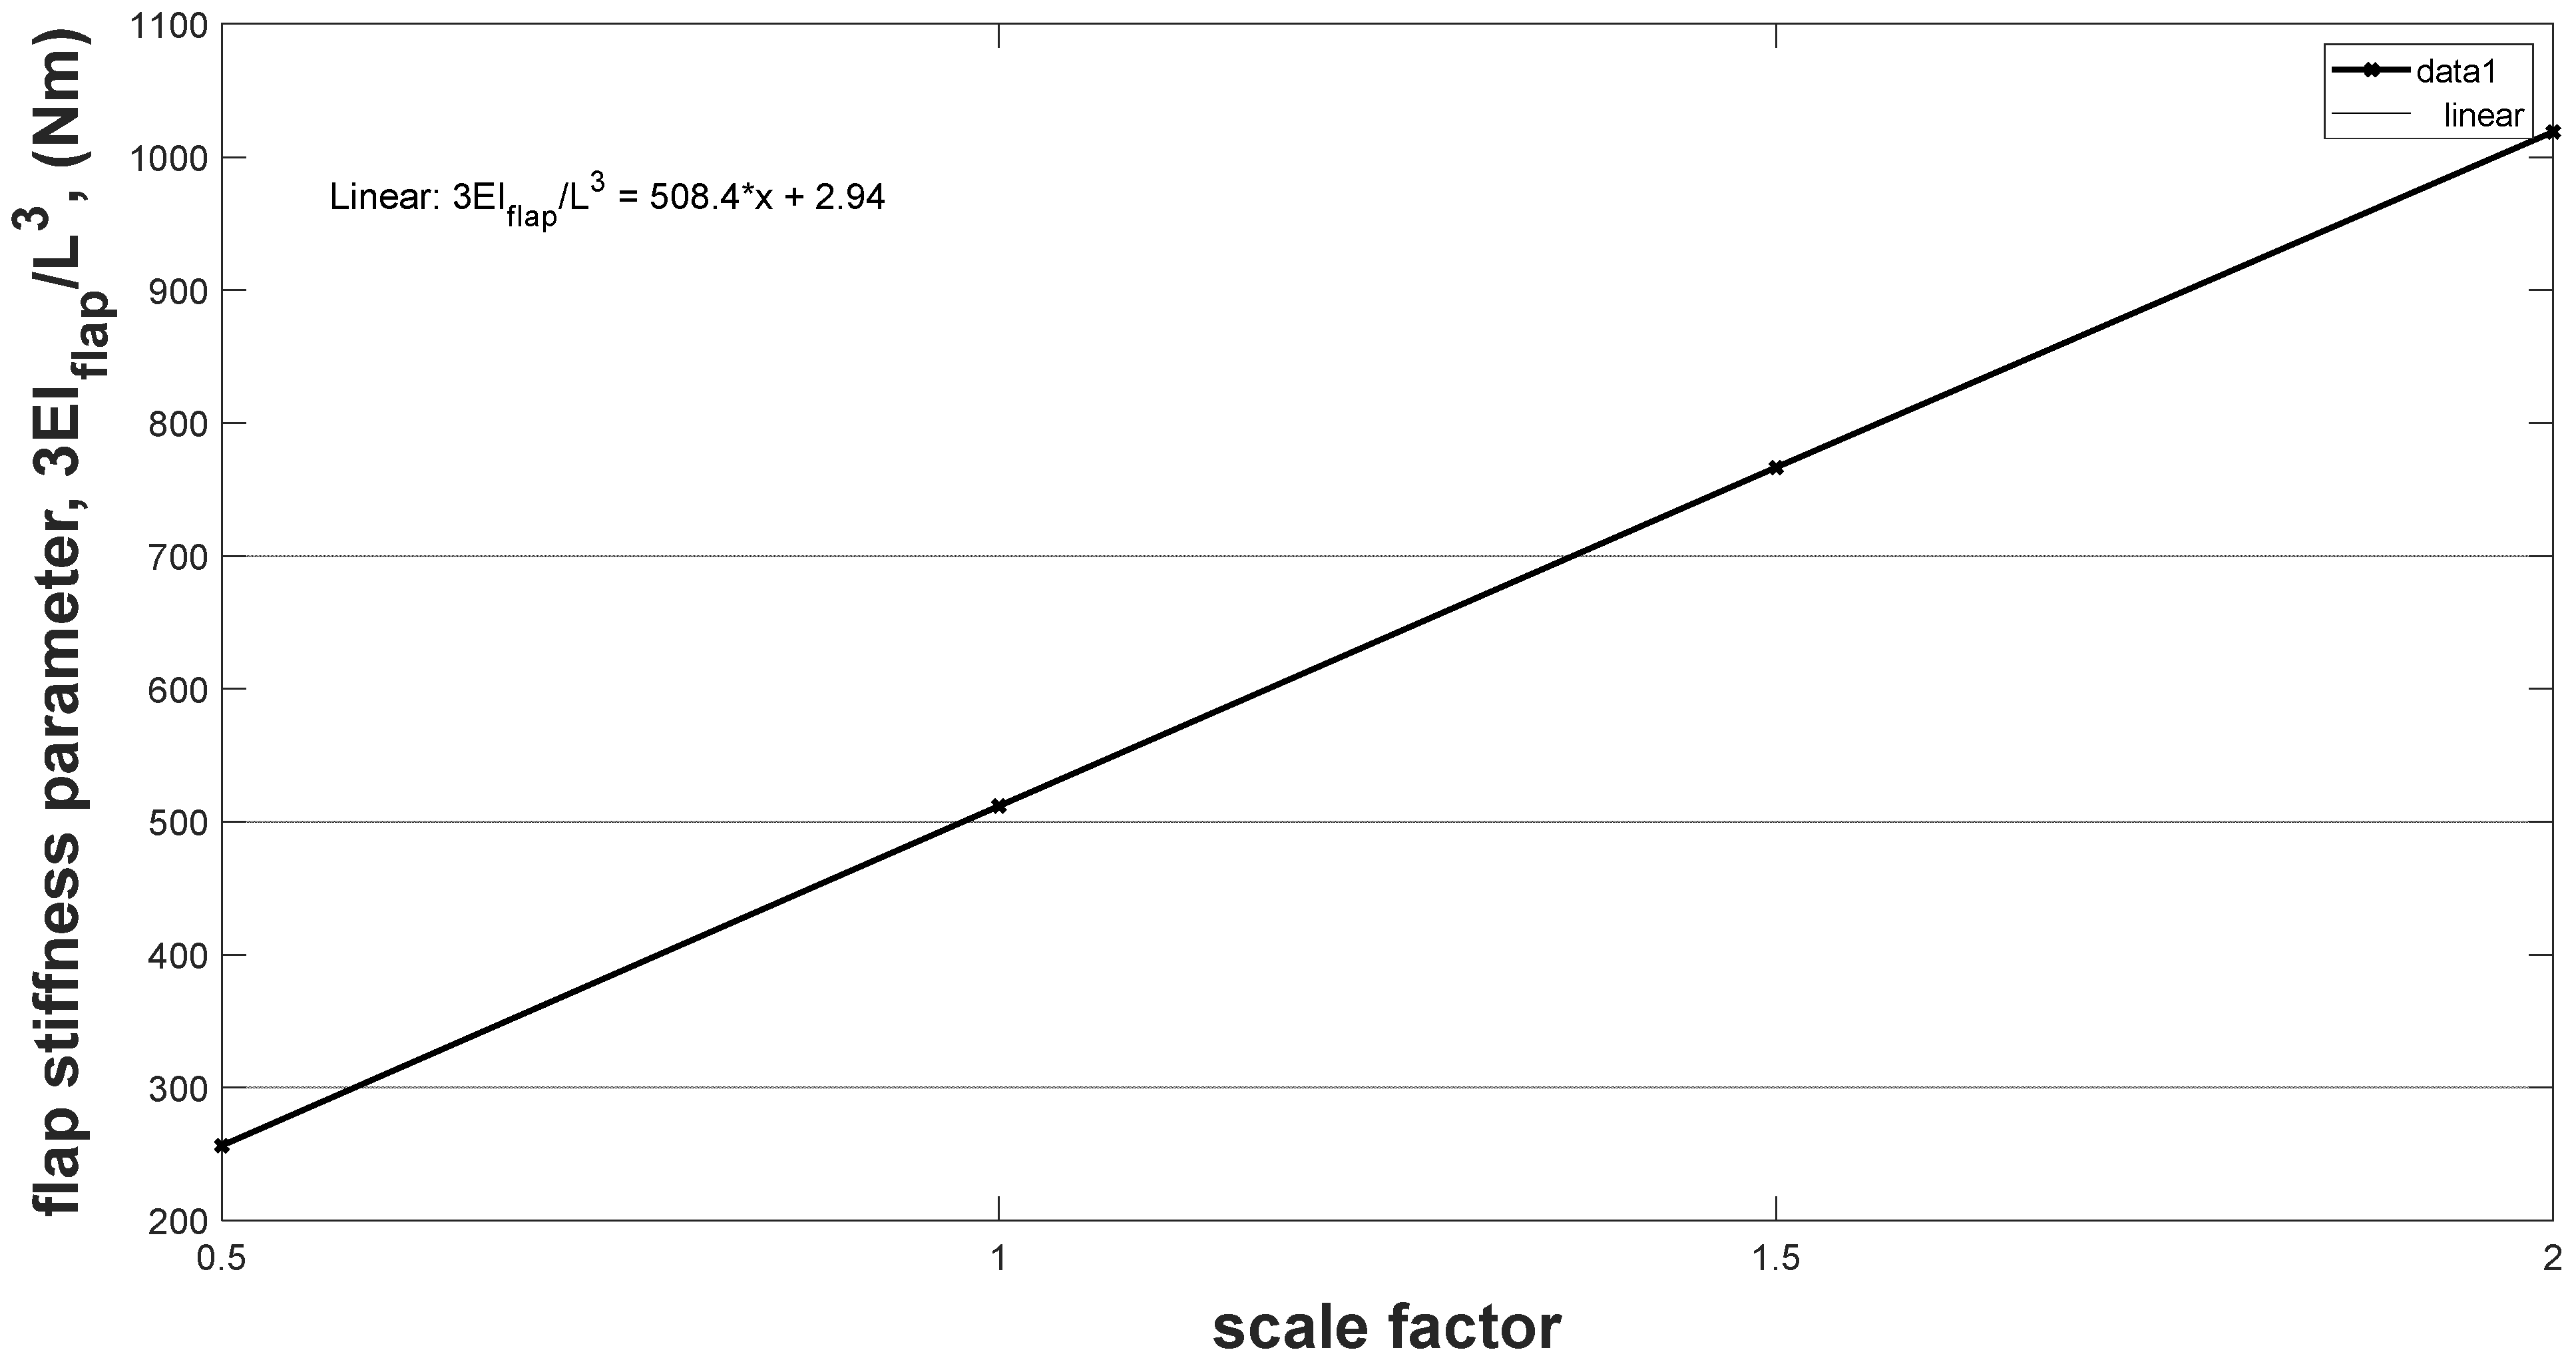
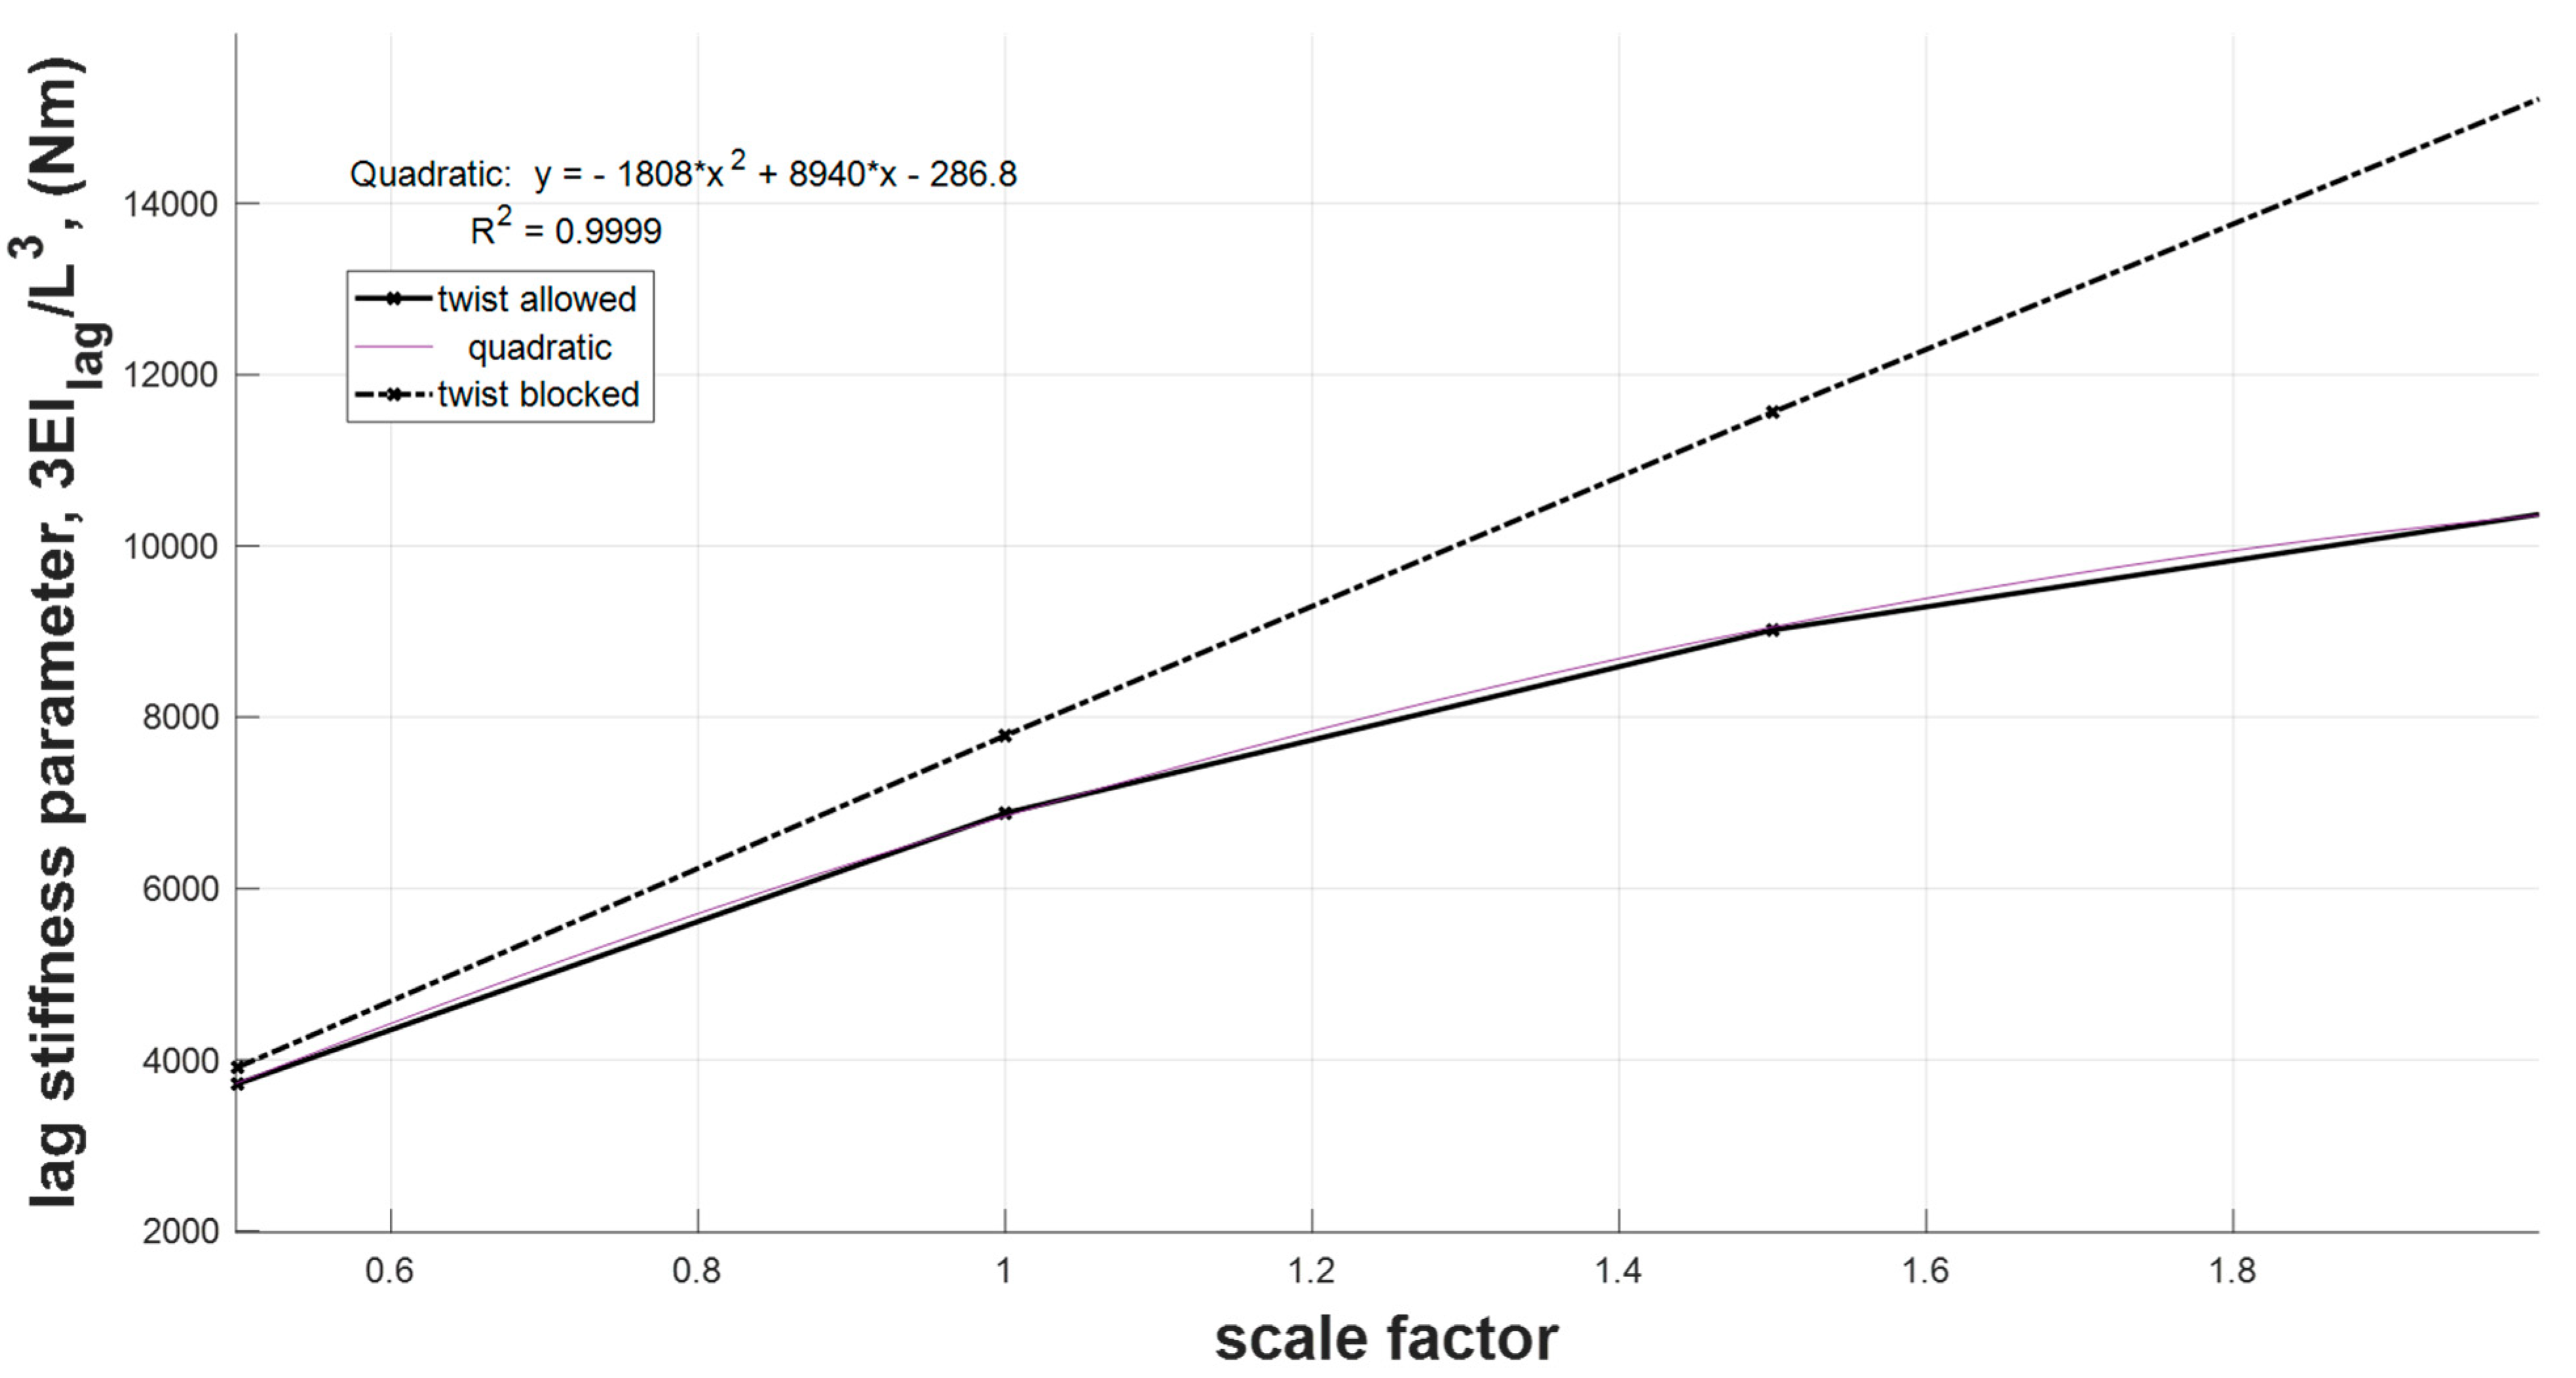
5.2. Bending Rigidity
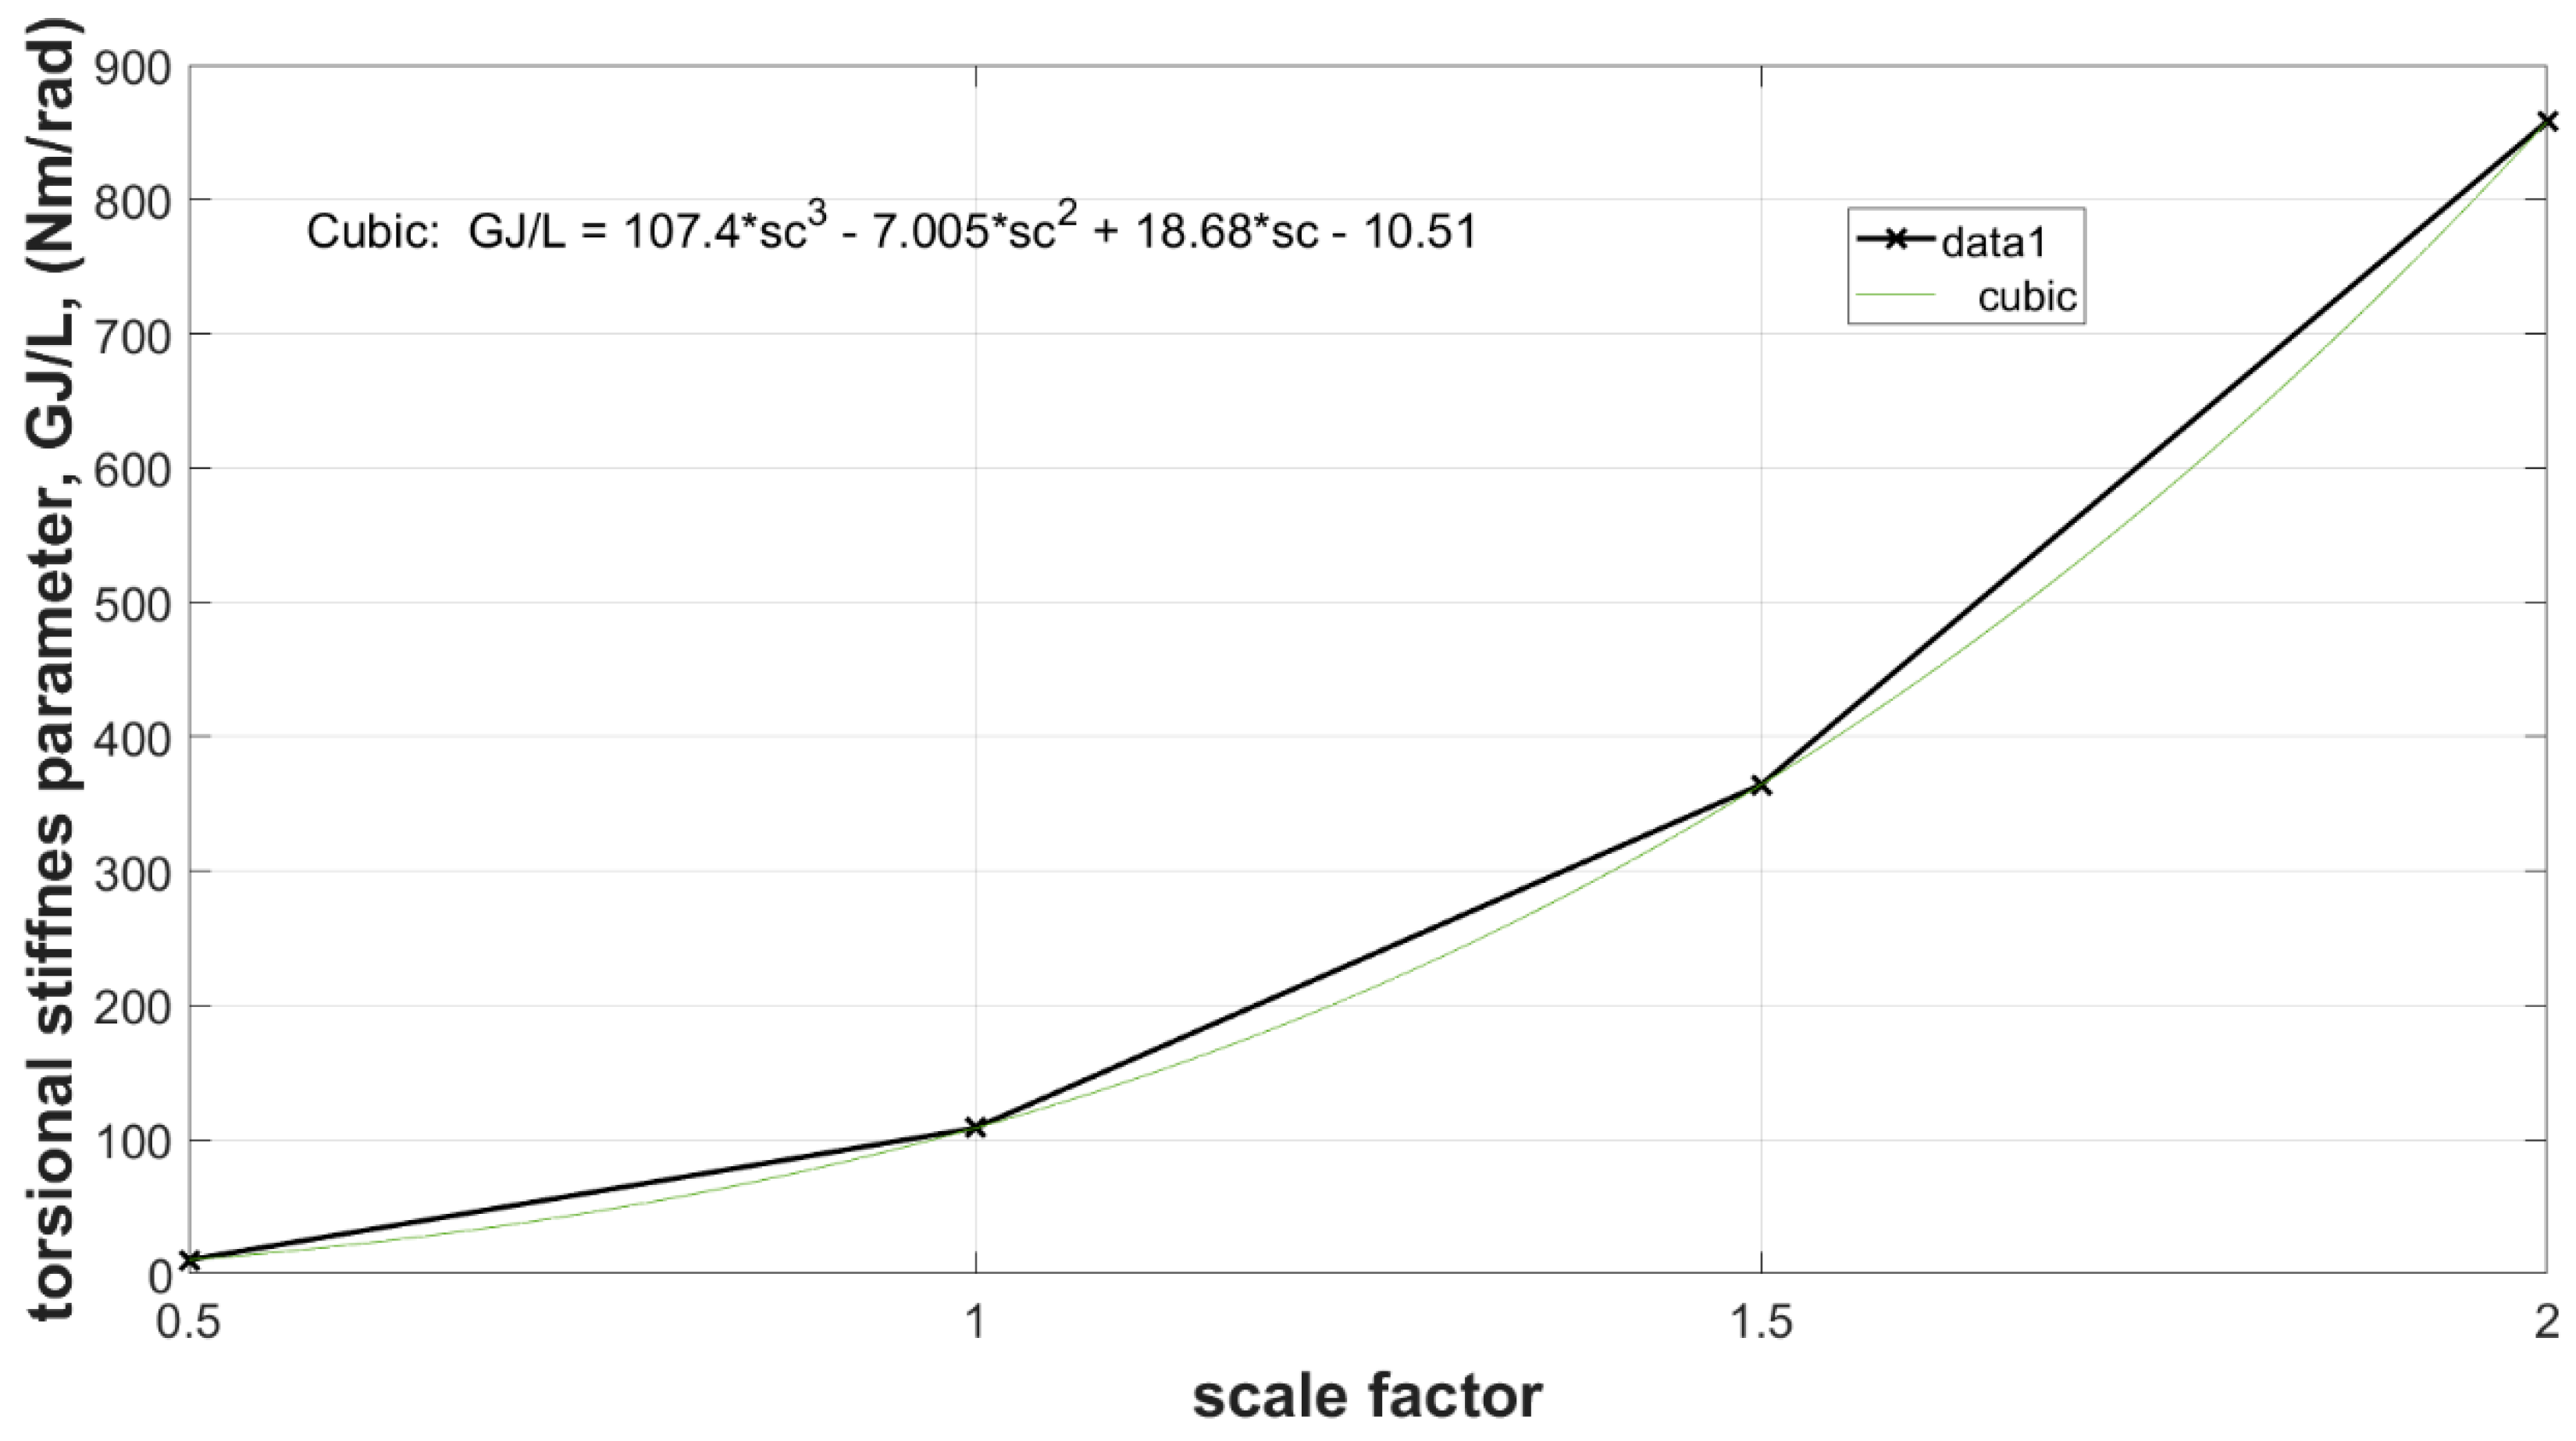
5.3. Torsional Rigidity
5.4. A Consideration
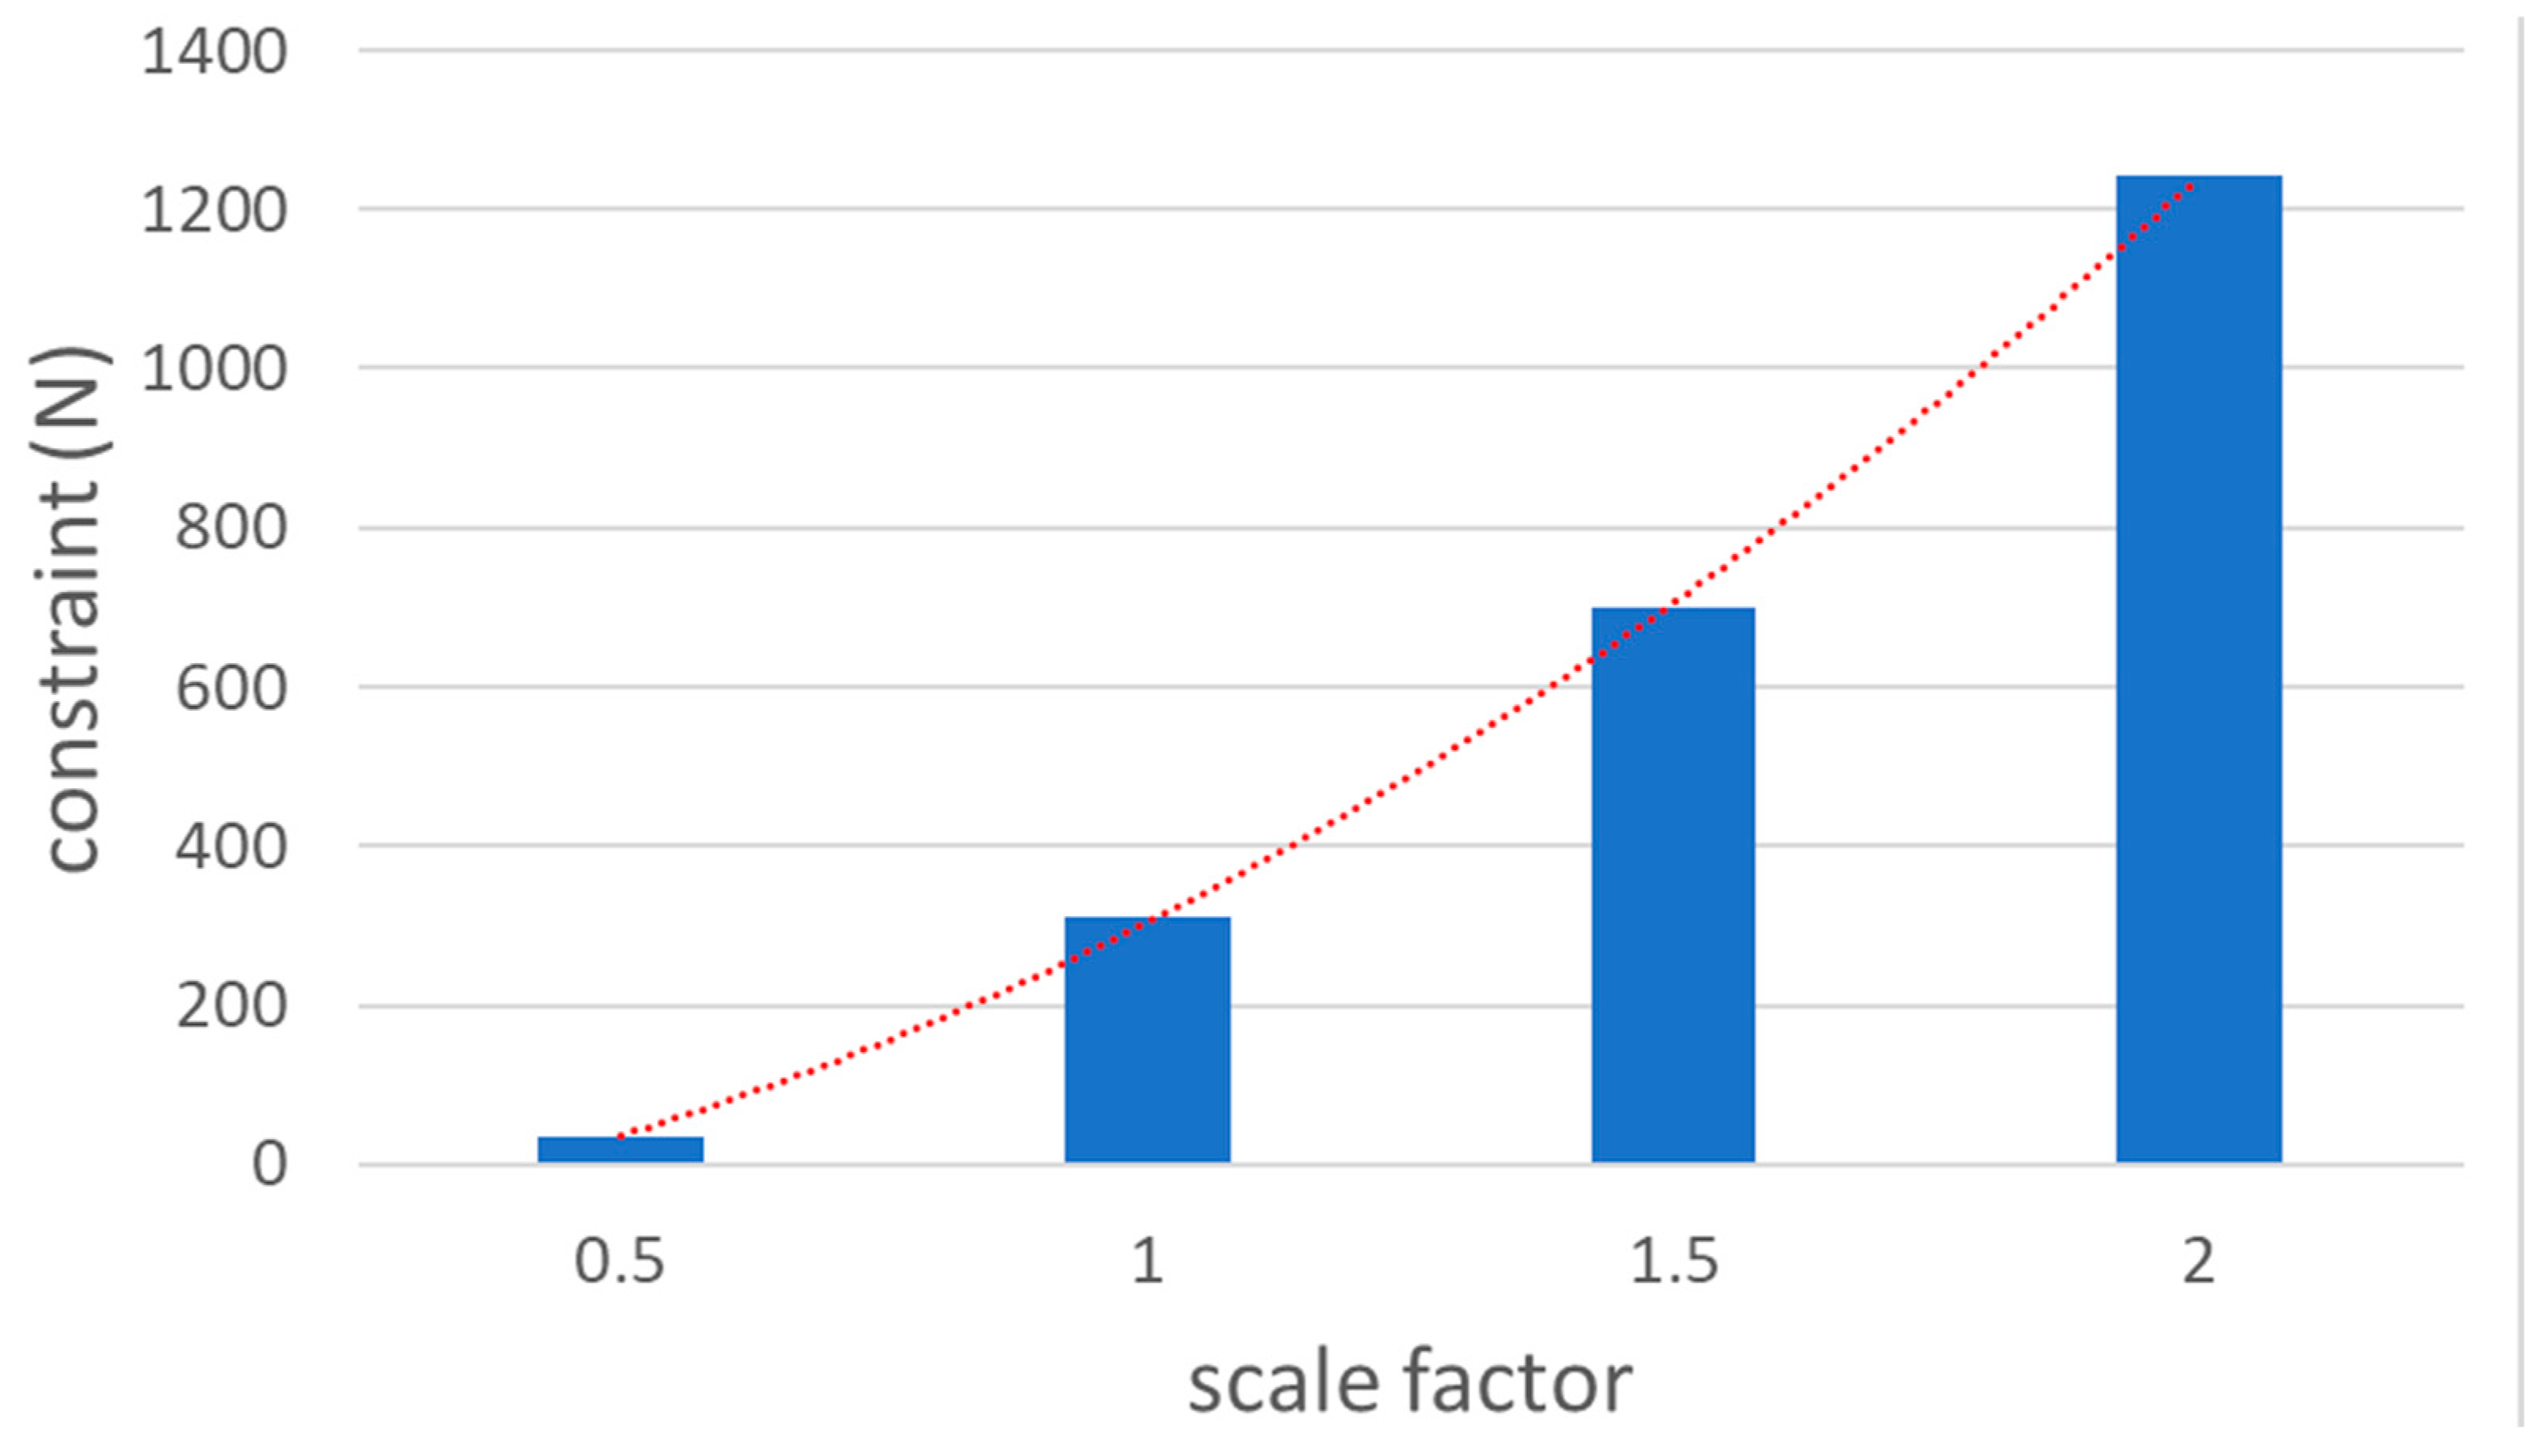
6. Stress Level vs. Re and M
7. SMA Actuator Performance
7.1. Axial Load
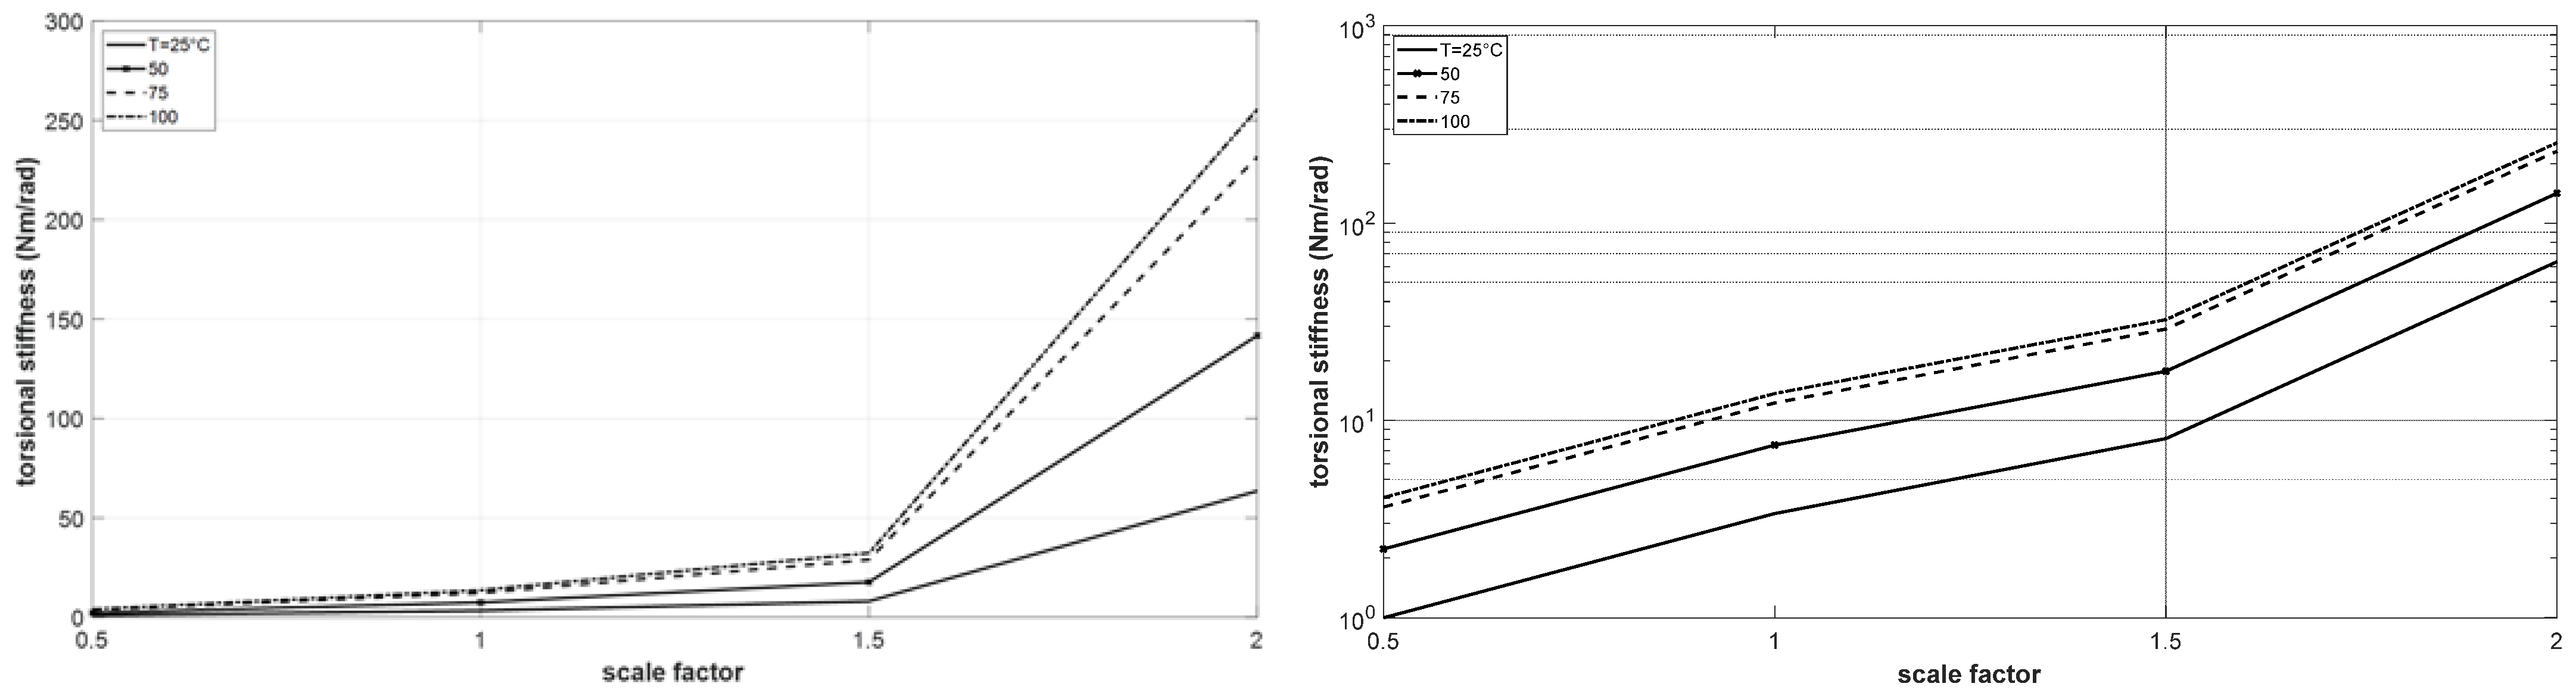
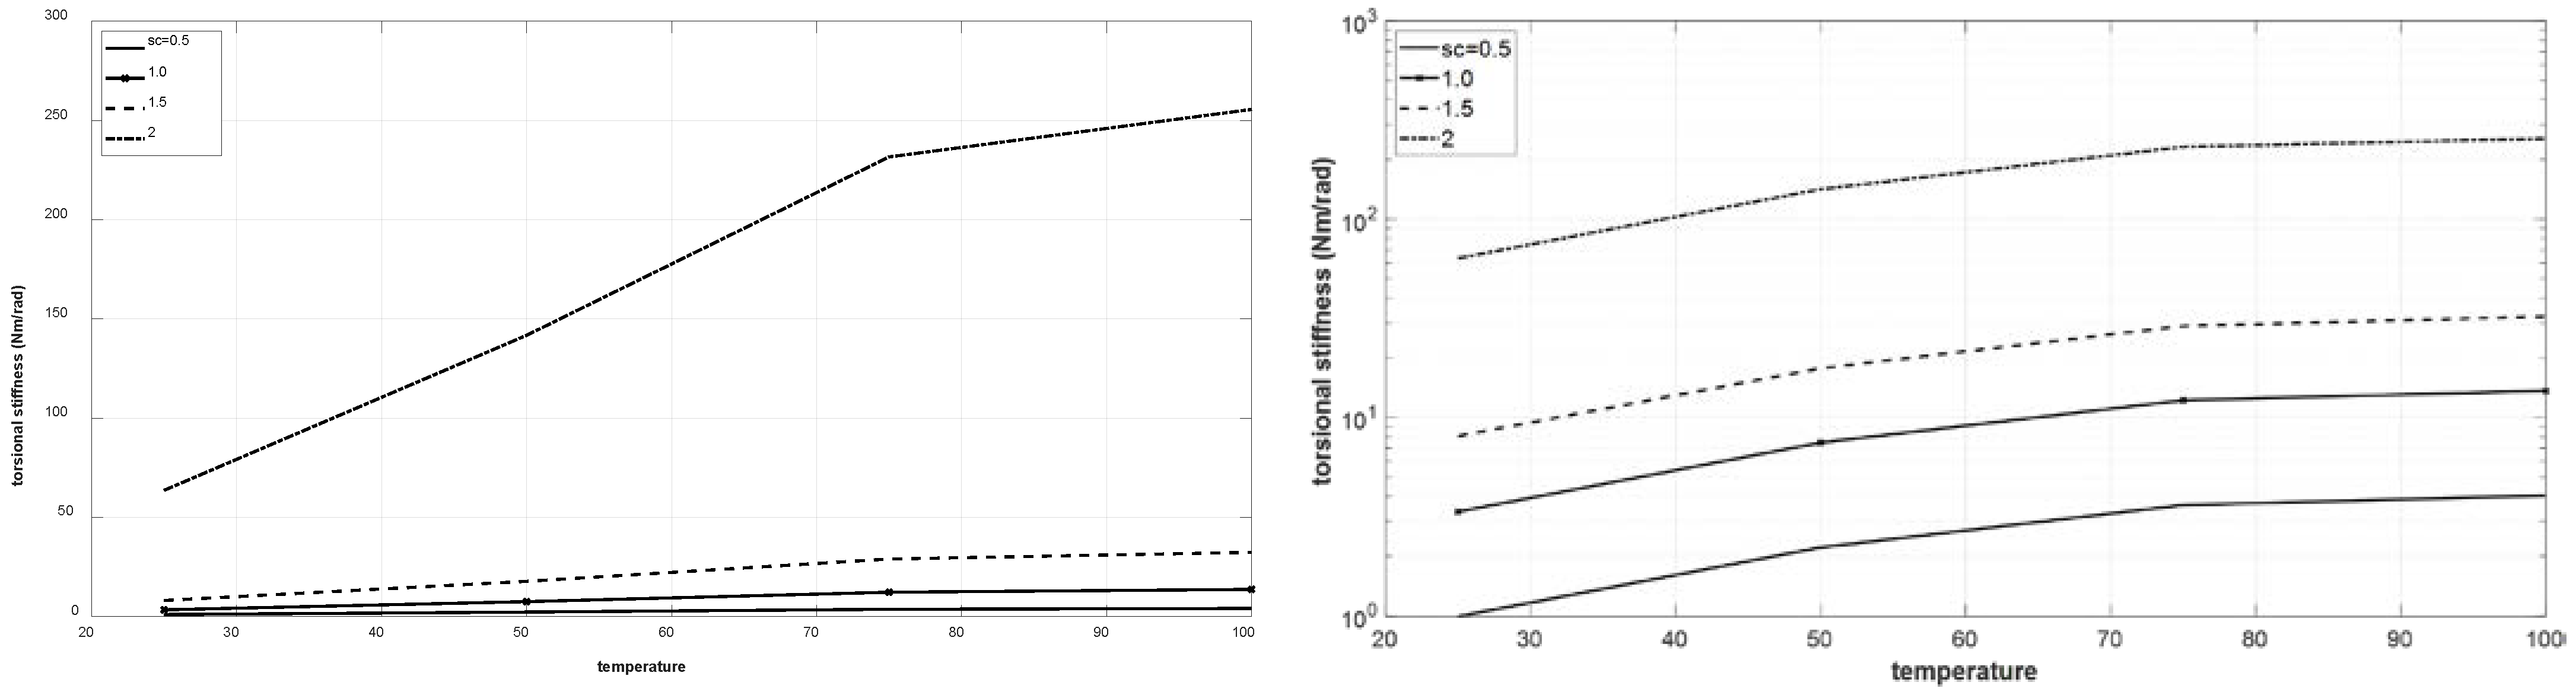
7.2. Torsional Load
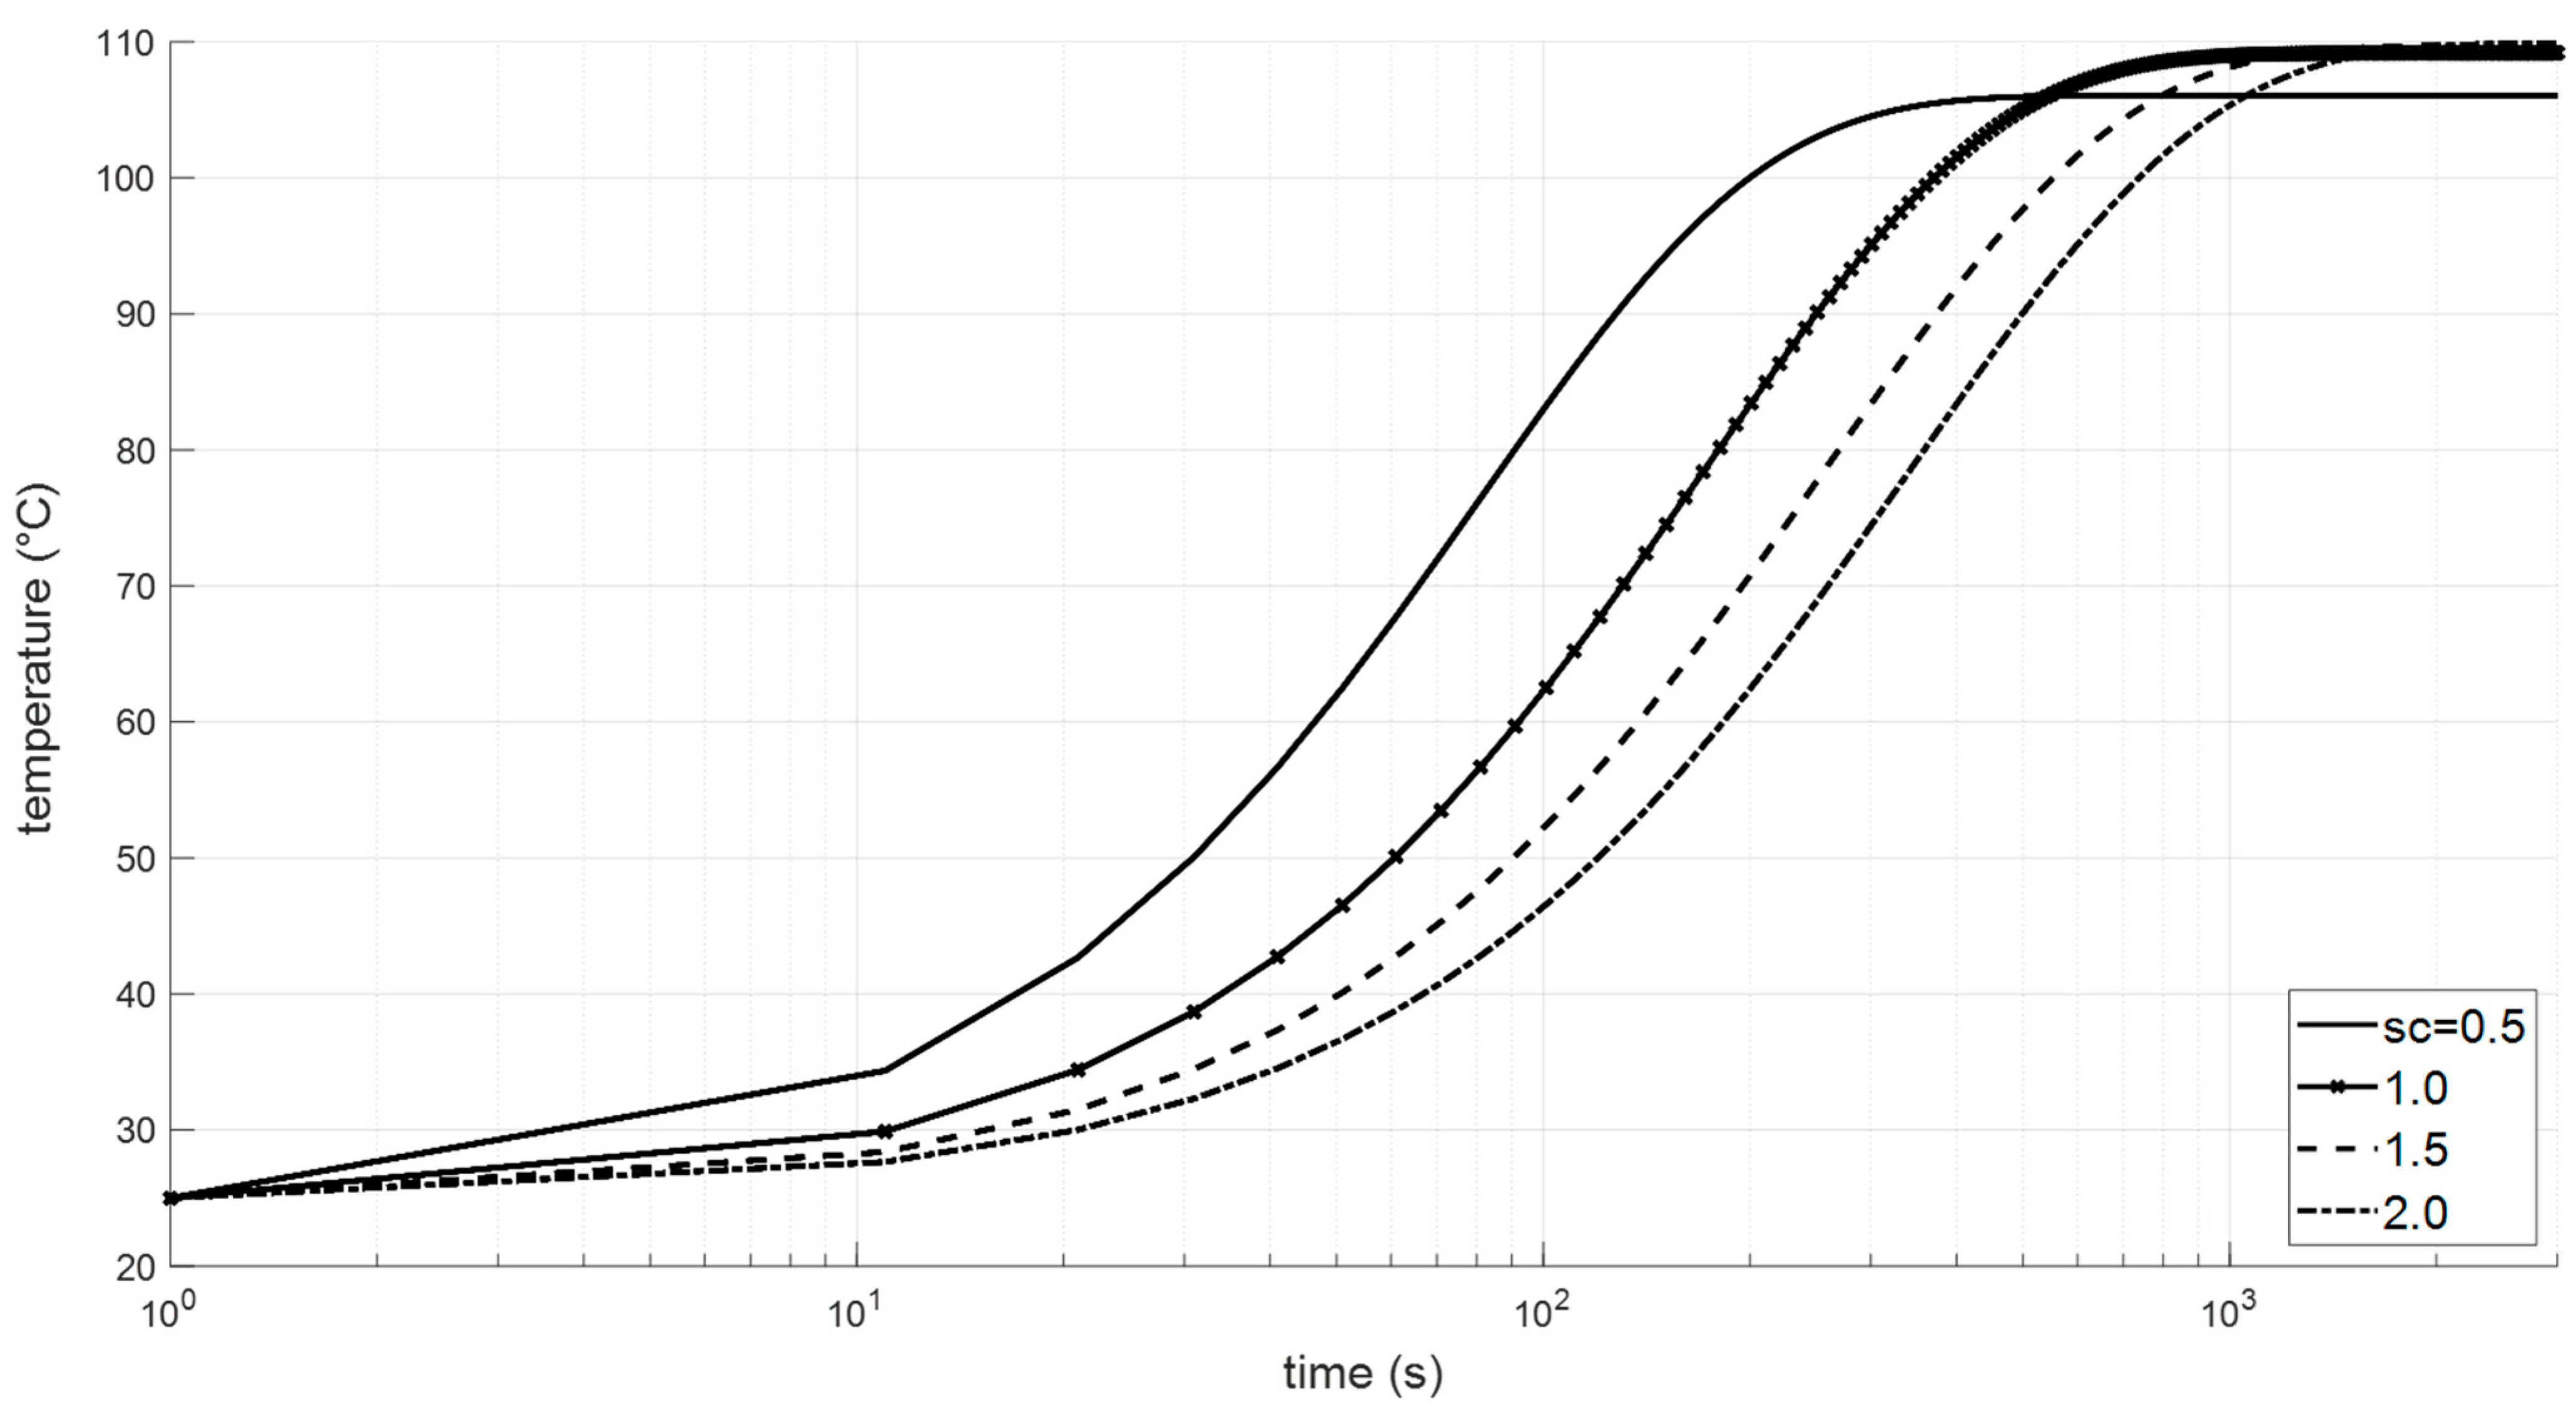
7.3. Heating Aspect
8. Dynamic Behaviour
8.1. Aeroelastic Analysis
8.2. Rotor-Dynamic Behaviour
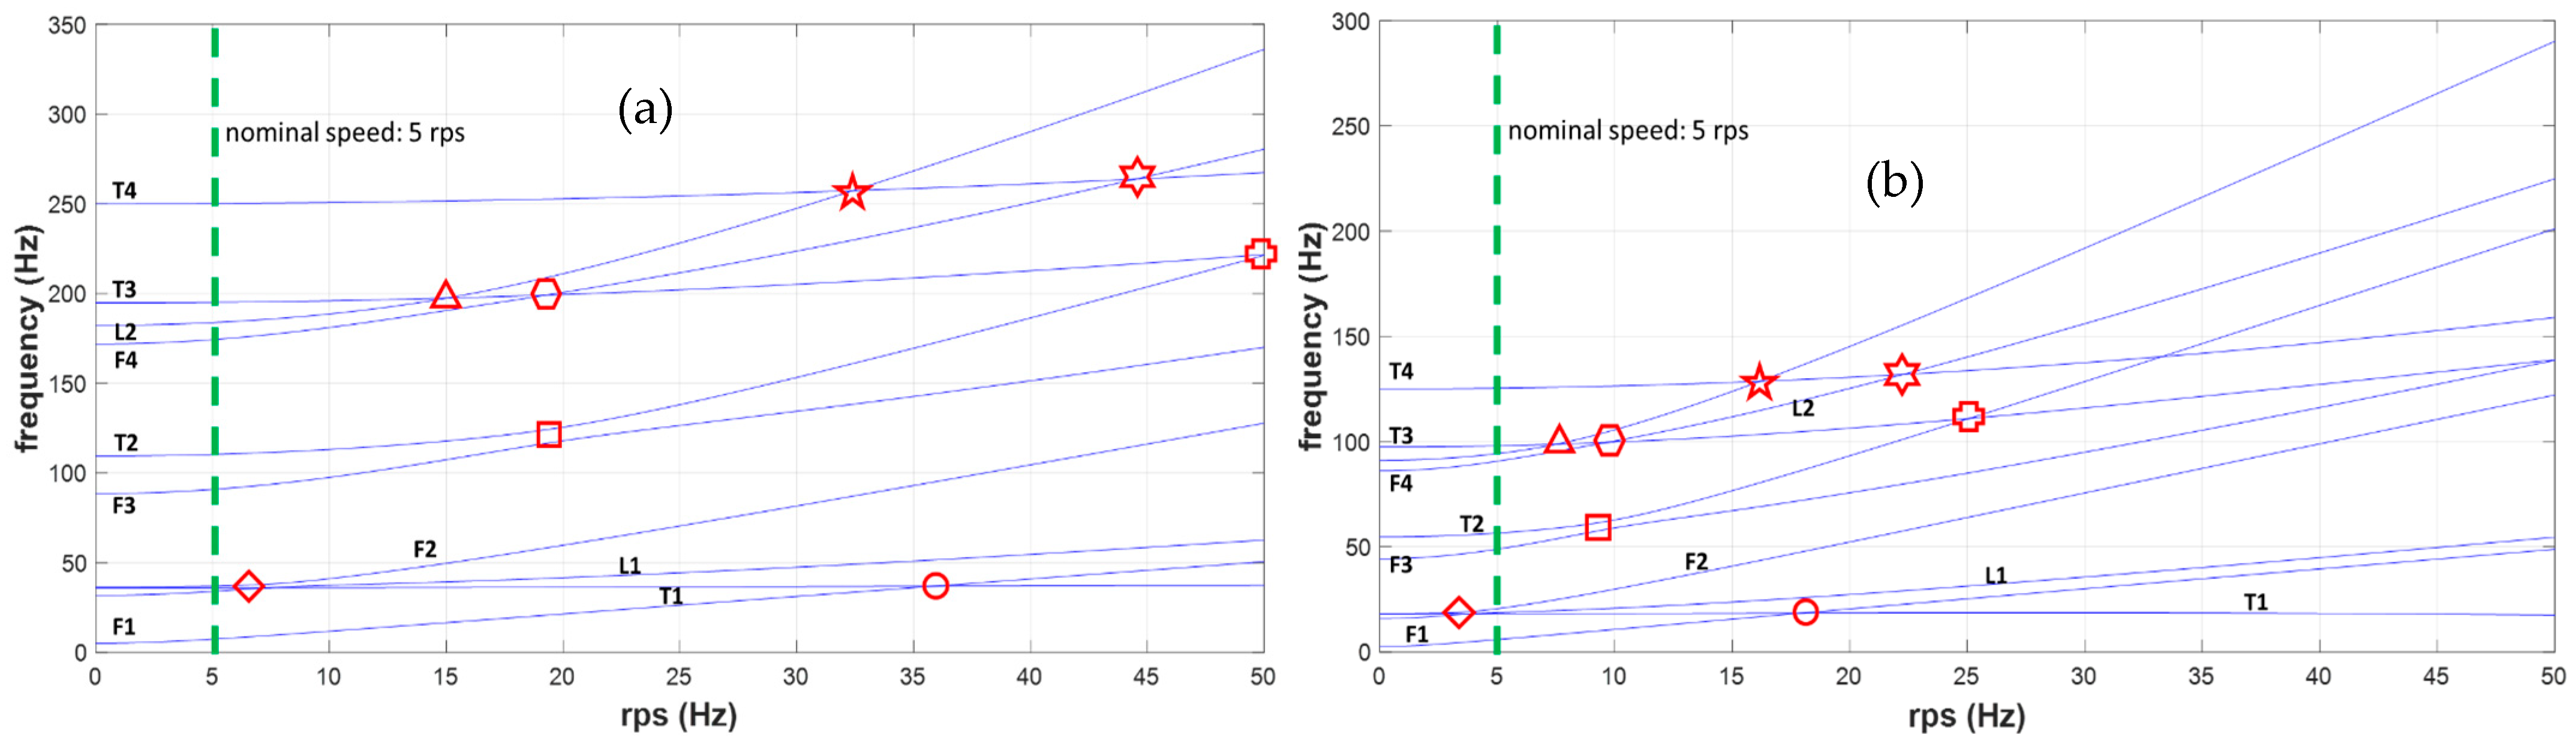
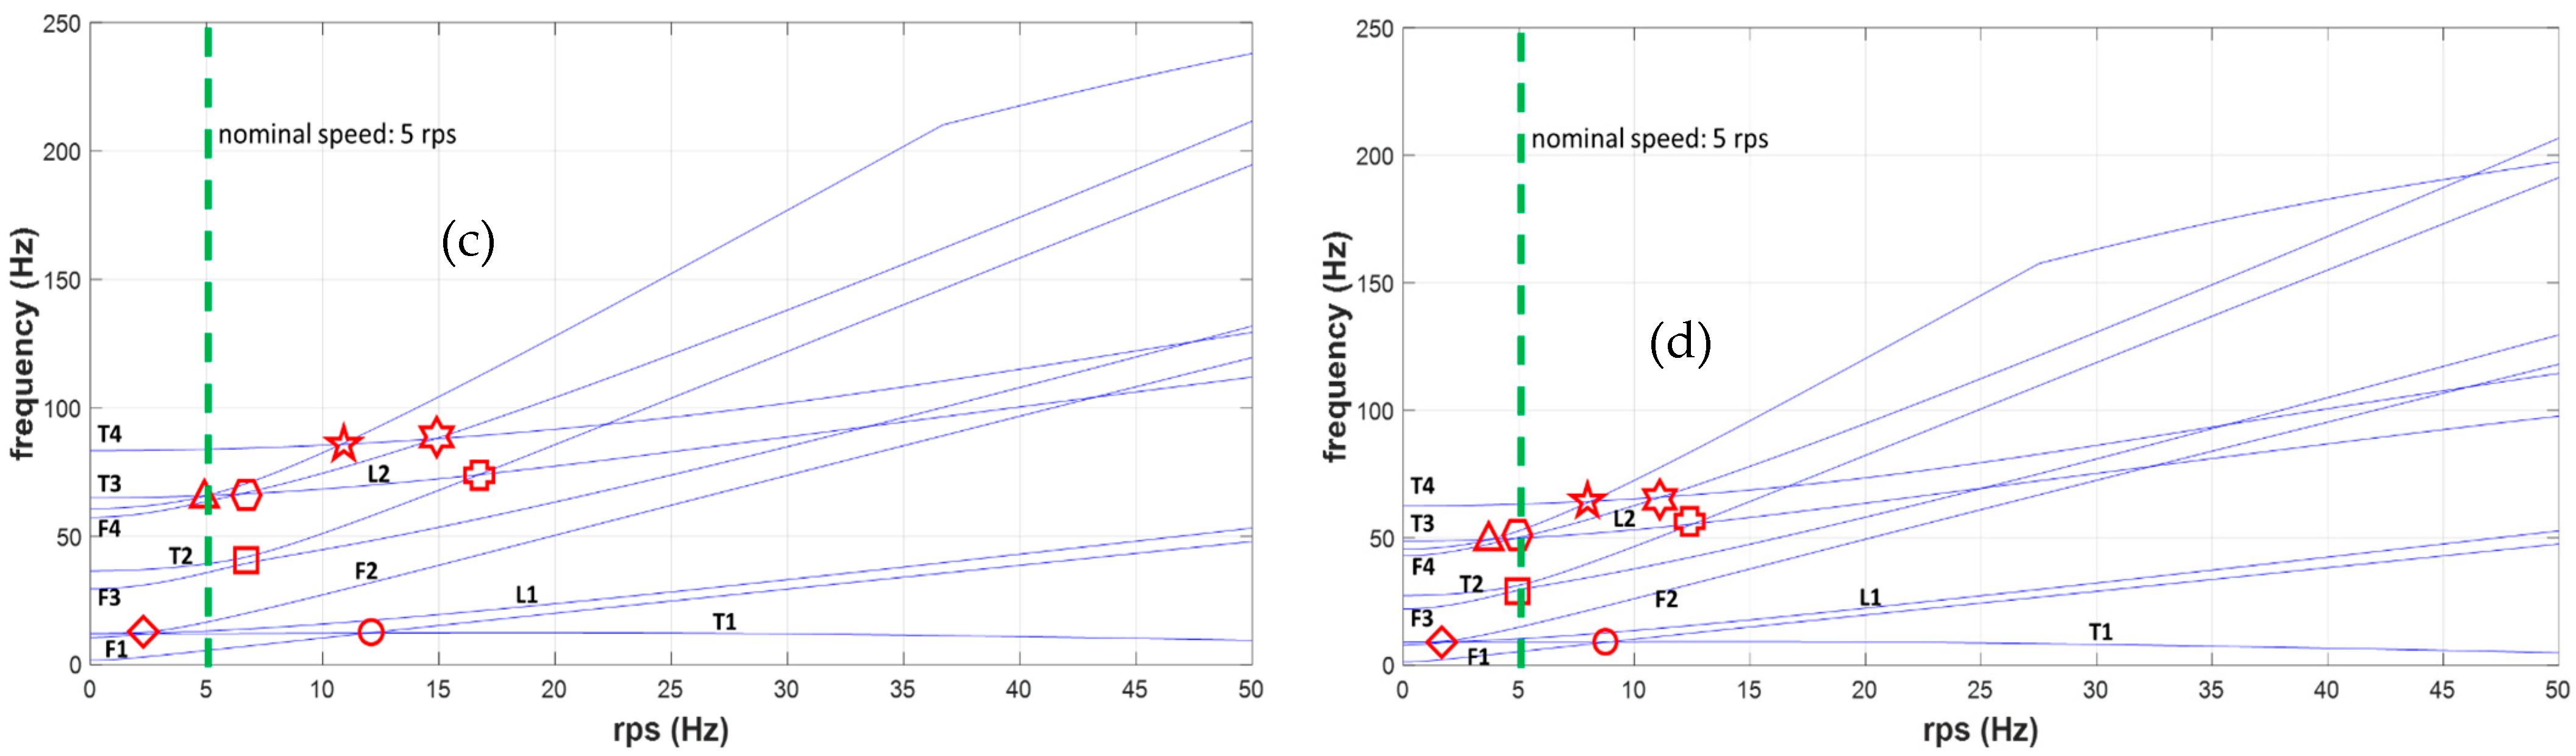
 ) for sc = 1.5; the same situation occurs, for sc = 2, for the pair of curves, respectively representing the third flap bending (F3) and the second torsional (T2) modes (
 ) and the second lag bending (L2) and the third torsional (T3) modes (
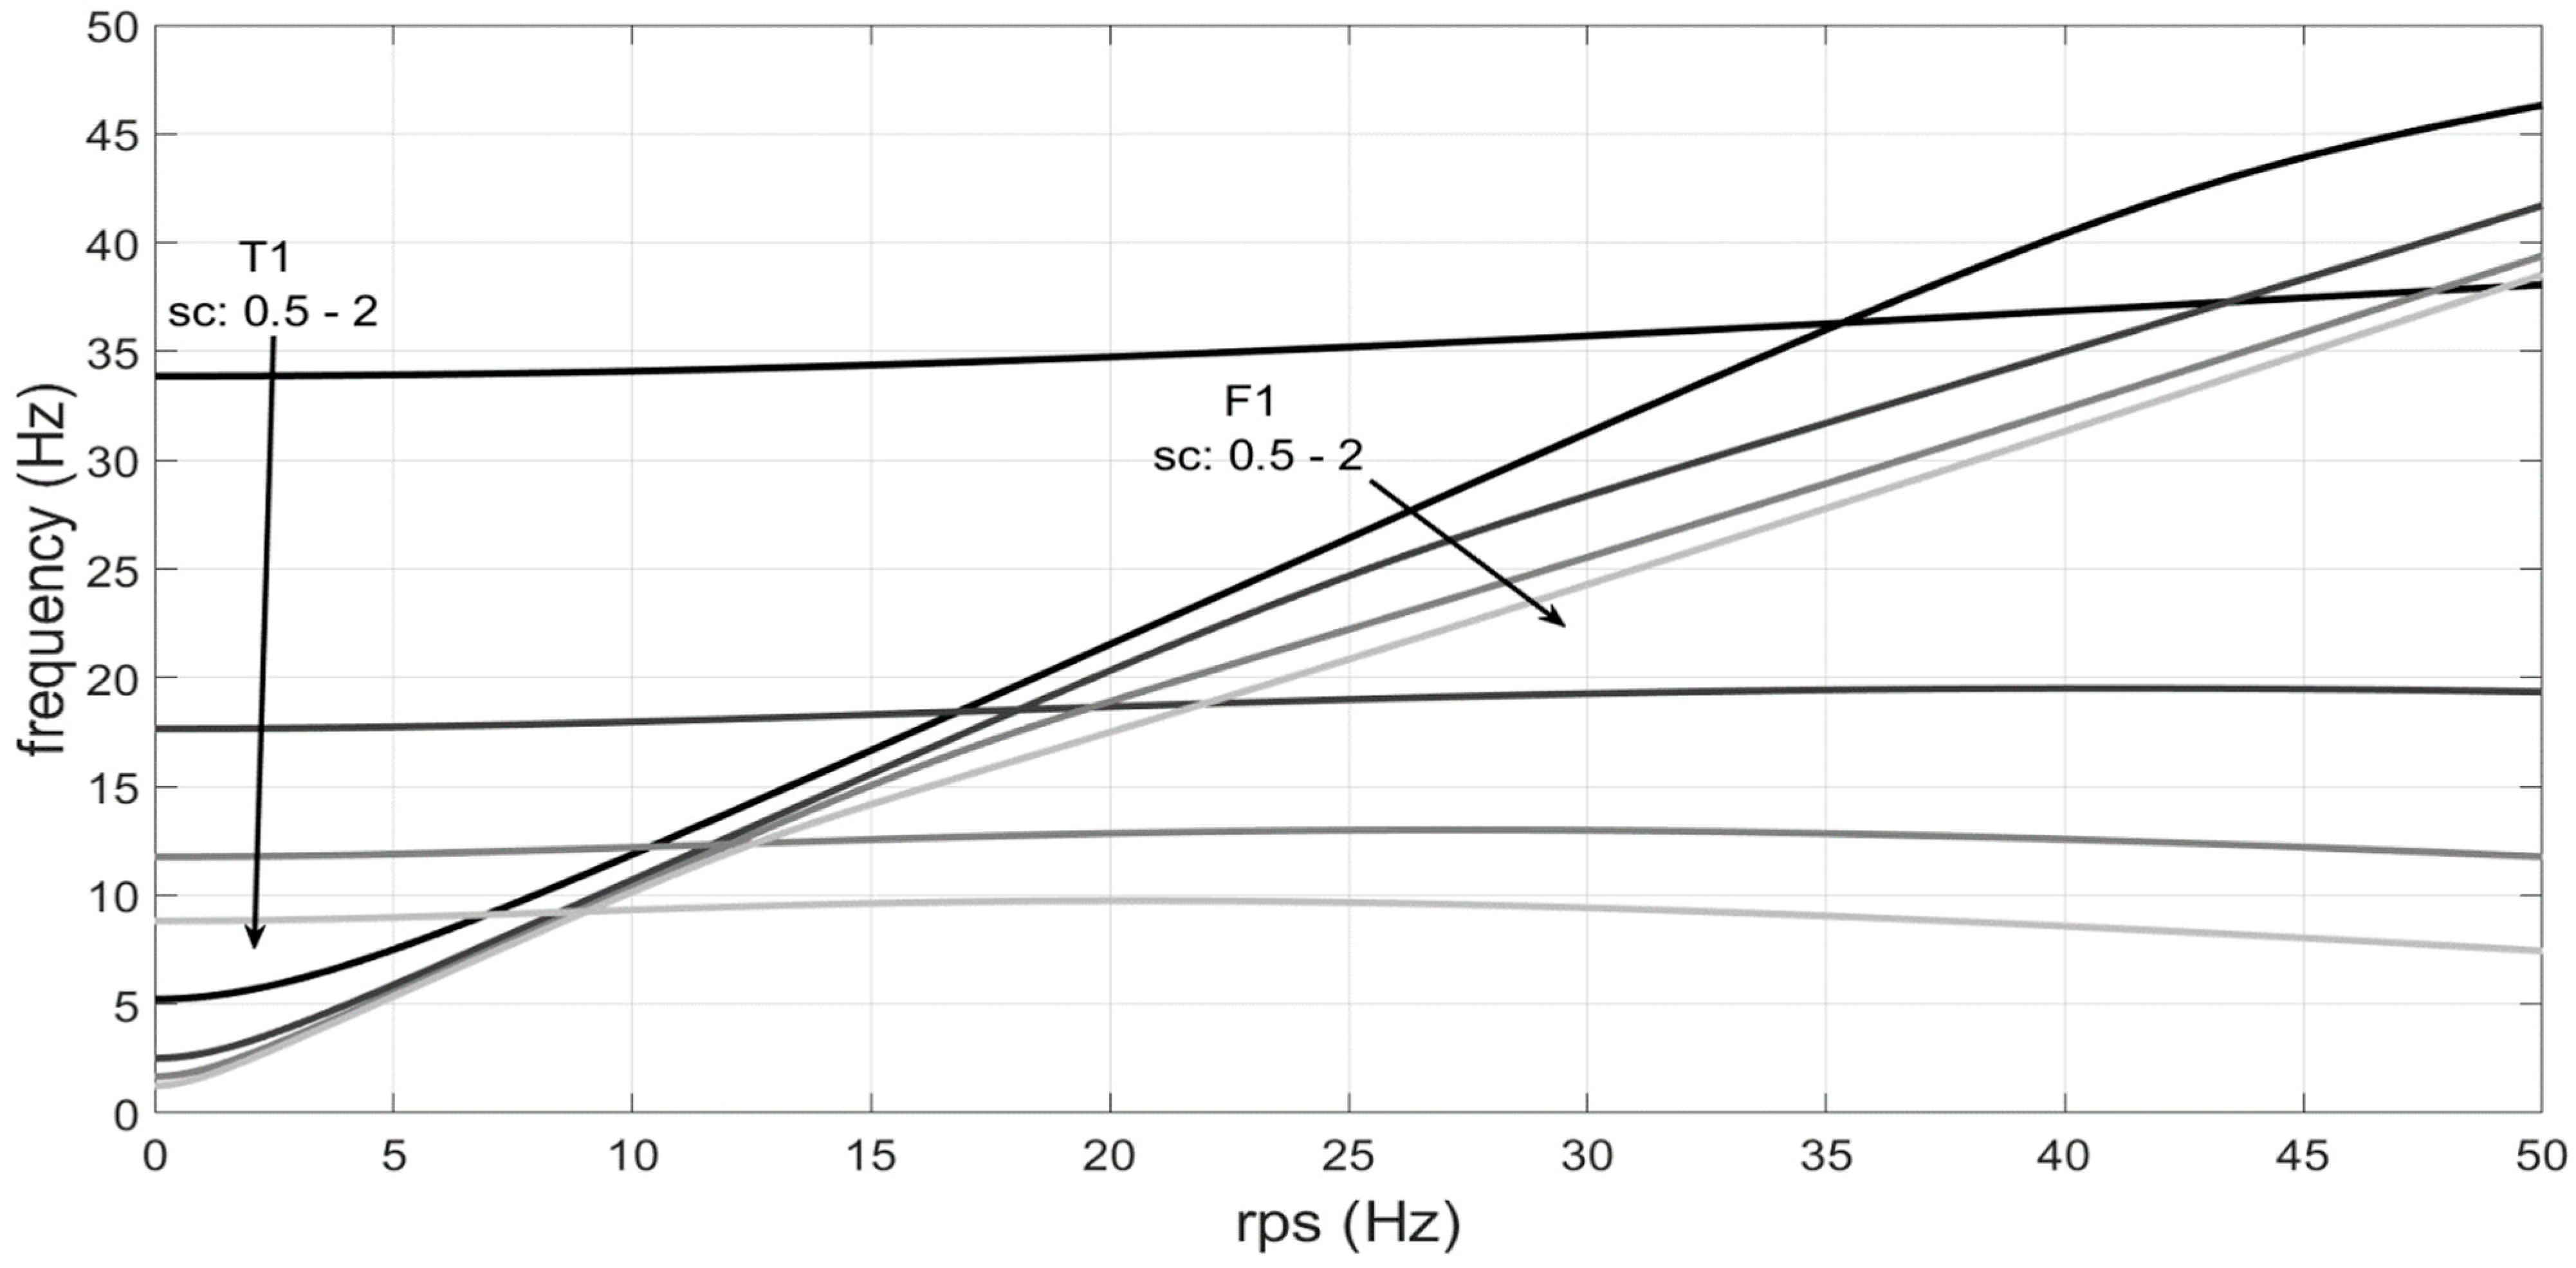
 ). It can be said that, generally, some critical points approach the nominal operation condition as the scale factor increases. This is due to different dependences on the scale factor of the flap bending, lag bending, and torsional rigidities. This happens for the already reported intersections () and (), which dramatically approach the nominal speed as the scale factor increases. A detail concerning the first flapping and torsional modes, F1 and T1, is finally reported in Figure 29.
9. Corrective Actions: A Preliminary Approach
10. Conclusions and Further Steps
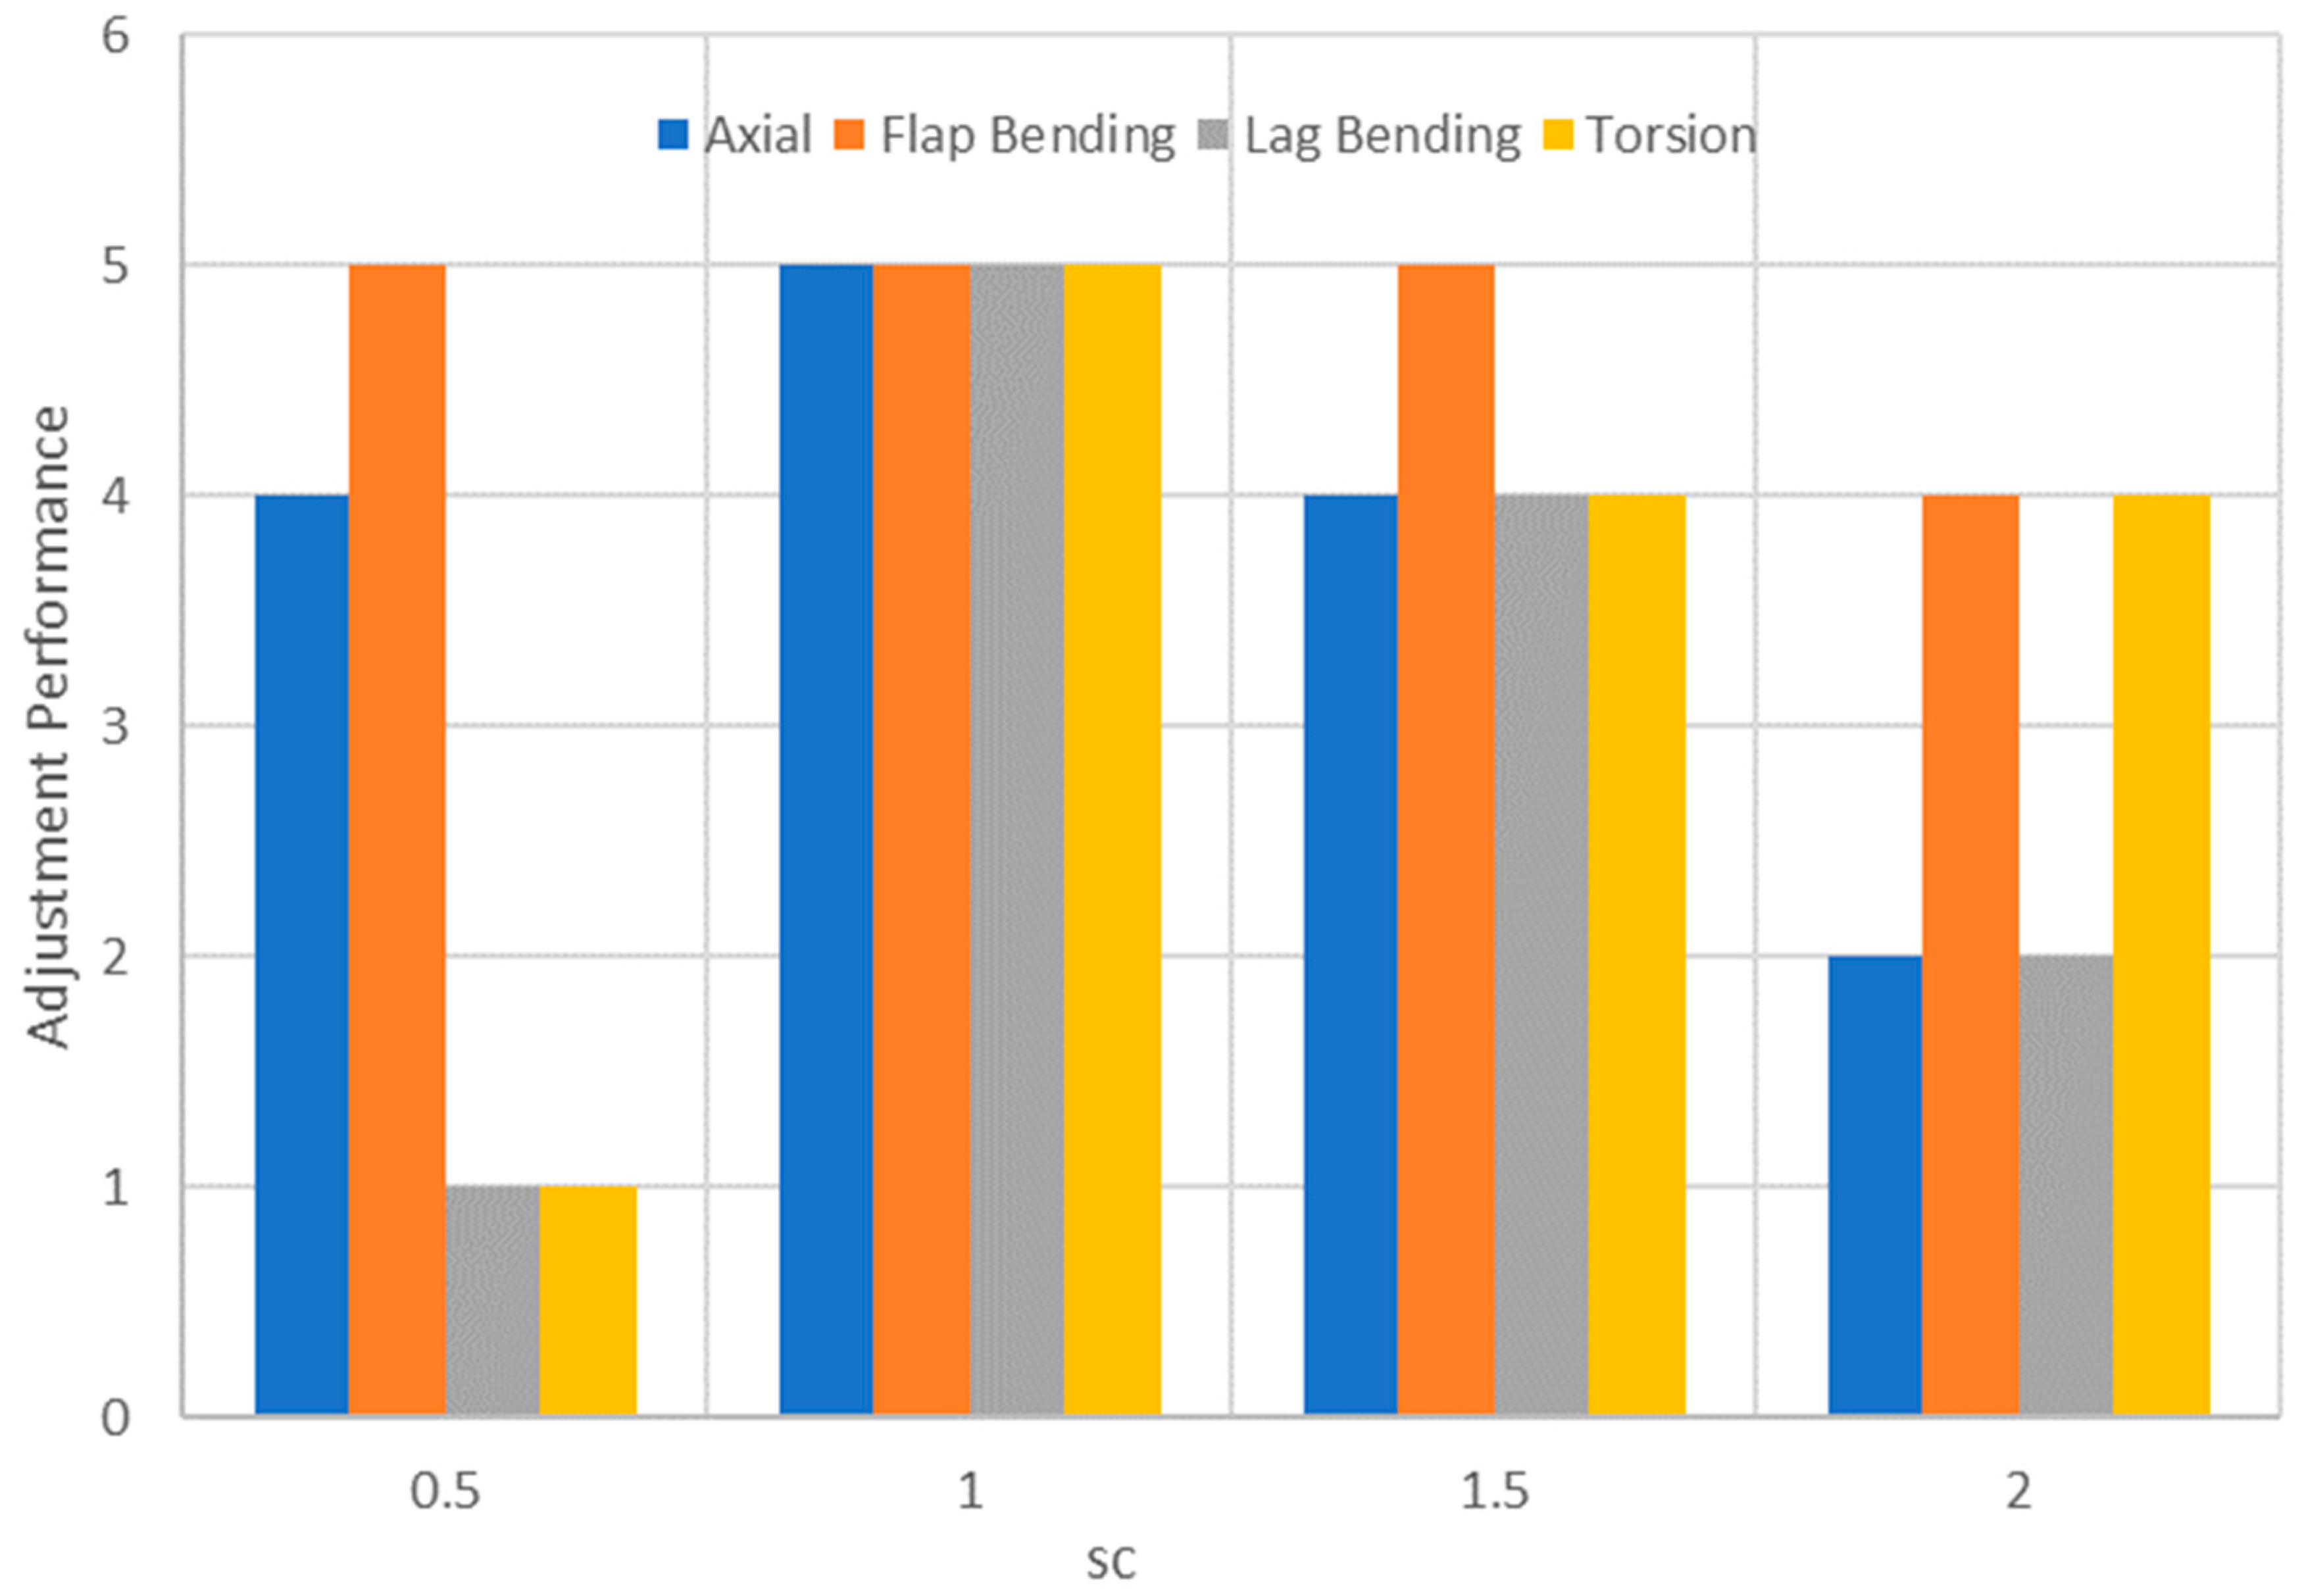
- Inadequate: 1
- Poor: 2
- Sufficient: 3
- Adequate: 4
- Excellent: 5
Author Contributions
Funding
Data Availability Statement
Conflicts of Interest
Acronyms and Symbols
| 0 | subscript for full size parameters |
| A | cross-section |
| A → M | austenite into martensite transformation |
| Af | austenite end of transformation temperature |
| As | austenite start of transformation temperature |
| c | scaled chord |
| γ | shear strain |
| ∆ϑ | twist |
| E | Young modulus |
| Ea | Young modulus in austenite phase |
| Em | Young modulus in martensite phase |
| ϑpt | pre-twist angle |
| F | force applied at the free edge of the beam |
| ϕ | angular coordinate |
| F1,2,3,4 | flap modes 1, 2, 3, 4 |
| Faxial | spanwise concentrated force applied to the model for axial stiffness estimation |
| flap | flap direction, component |
| FEM | finite element model, finite element method |
| G | shear modulus |
| I | inertia moment of the beam cross-section along the flap and lag axis |
| J | polar inertia moment of the beam cross-section |
| Kaxial | spanwise stiffness |
| L | span length |
| L1,2,3,4 | lag modes 1, 2, 3, 4 |
| lag | lag direction, component |
| M | Mach number |
| μ | dynamic viscosity of the air |
| M → A | martensite into austenite transformation |
| Mf | martensite end of transformation temperature |
| MPC | multi-point constraint |
| Ms | martensite start of transformation temperature |
| PVDF | polyvinylidene fluoride |
| r | radial coordinate |
| R2 | coefficient of determination |
| Re | Reynolds number |
| ρ | air density at sea level |
| martensite end of transformation stress | |
| martensite start of transformation stress | |
| austenite end of transformation stress | |
| austenite start of transformation stress | |
| sc | geometric scale factor |
| SMA | shape memory alloy |
| SMR | small–medium range (aircraft) |
| T | torque moment applied at the free edge |
| T1,2,3,4 | torsional modes 1, 2, 3, 4 |
| TRL | technology readiness level |
| uaxial | spanwise displacement |
| UAV | unmanned aerial vehicle |
| w | transversal displacement of the representative elastic beam |
| WhT | whirl tower |
| WT | wind tunnel |
| x | axial coordinate |
References
- Raconteur. Available online: www.raconteur.net/business-innovation/aviation-industry-soaring-into-the-future (accessed on 9 July 2023).
- ICAO. Available online: www.icao.int/sustainability/Pages/Economic-Impacts-of-COVID-19.aspx (accessed on 9 July 2023).
- Green, J.E. Civil aviation and the environmental challenge. Aeronaut. J. 2003, 107, 281–299. [Google Scholar] [CrossRef]
- SNC-Lavalin. Available online: https://www.snclavalin.com/~/media/Files/S/SNC-Lavalin/download-centre/en/whitepaper/aviation-trends-white-paper-digital.pdf (accessed on 9 July 2023).
- Allianz-Trade. Available online: https://www.allianz-trade.com/en_global/news-insights/economic-insights/the-world-is-moving-east-fast.html (accessed on 9 July 2023).
- Concilio, A.; Lecce, L. Historical Background and Current Scenario. In Morphing Wing Technologies: Large Commercial Aircraft and Civil Helicopters; Concilio, A., Dimino, I., Lecce, L., Pecora, R., Eds.; Elsevier: Amsterdam, The Netherlands, 2018; pp. 401–428. [Google Scholar]
- The Conversation. Available online: https://theconversation.com/morphing-is-one-way-to-make-aircraft-more-efficient-23683 (accessed on 9 July 2023).
- Ameduri, S.; Concilio, A.; Dimino, I.; Pecora, R.; Ricci, S. Airgreen2—Clean Sky 2 Programme: Adaptive Wing Technology Maturation, Challenges and Perspectives. In Proceedings of the ASME Conference on Smart Materials, Adaptive Structures and Intelligent Systems, San Antonio, TX, USA, 10–12 September 2018. Paper No. SMASIS2018-8235. [Google Scholar]
- Clean Sky 2 Joint Undertaking. Available online: https://www.clean-aviation.eu/ (accessed on 9 July 2023).
- Cordis. Available online: https://cordis.europa.eu/project/id/284562 (accessed on 9 July 2023).
- TsAGI. Available online: http://tsagi.com/pressroom/news/2192/ (accessed on 9 July 2023).
- Cordis. Available online: https://cordis.europa.eu/project/id/213442/it (accessed on 9 July 2023).
- European Commission. Available online: https://ec.europa.eu/research-and-innovation/en/projects/success-stories?id=/research/star/index_en.cfm?p=s1-sade&calledby=infocentre&item=Infocentre&artid=40597 (accessed on 9 July 2023).
- SABRE. Available online: https://sabreproject.eu/ (accessed on 9 July 2023).
- Cordis. Available online: https://cordis.europa.eu/project/id/502773/reporting (accessed on 9 July 2023).
- NASA. Available online: https://www.nasa.gov/centers/armstrong/news/newsreleases/15-08.html (accessed on 9 July 2023).
- Federal Aviation Administration. Available online: https://www.faa.gov/newsroom/continuous-lower-energy-emissions-and-noise-cleen-program?newsId=22534 (accessed on 9 July 2023).
- Botez, R.M.; Koreanschi, A.; Gabor, O.S.; Tondji, Y.; Guezguez, M.; Kammegne, J.T.; Grigorie, L.T.; Sandu, D.; Mebarki, Y.; Mamou, M.; et al. Numerical and Experimental Transition Results Evaluation for a Morphing Wing and Aileron System. Aeronaut. J. 2018, 122, 747–784. [Google Scholar] [CrossRef]
- Dimino, I.; Ameduri, S.; Concilio, A. Preliminary Failure Analysis and Structural Design of a Morphing Winglet for Green Regional Aircraft. In Proceedings of the ASME 2018 Conference on Smart Materials, Adaptive Structures and Intelligent Systems, San Antonio, TX, USA, 10–12 September 2018. Paper No. SMASIS2018-8236. [Google Scholar]
- Ondra, V.; Dibble, R.; Titurus, B. Towards an Application of an Active Tendon in Rotorcraft: A Numerical and Experimental Study of Coupled Bending-Torsion Vibration of a Beam-Tendon System. In Proceedings of the 28th International Conference on Noise and Vibration engineering (ISMA 2018), Leuven, Belgium, 17–19 September 2018; pp. 3645–3659. [Google Scholar]
- Zhang, J.; Shaw, A.D.; Amoozgar, M.; Friswell, M.I.; Woods, B.K.S. Spiral Pulley Negative Stiffness Mechanism for Morphing Aircraft Actuation. In Proceedings of the ASME 2018 International Design Engineering Technical Conferences and Computers and Information in Engineering Conference, Quebec City, QC, Canada, 26–29 August 2018; Paper No: DETC2018-85640. ASME: New York, NY, USA, 2018; p. 05. [Google Scholar]
- Fournier, S.; Woods, B.K.S. Surrogate Modelling of the Steady Aeroelastic Performance of the Fish Bone Active Camber Concept. In Proceedings of the AIAA Scitech 2019 Forum, San Diego, CA, USA, 7–11 January 2019; AIAA: Reston, VA, USA, 2019. Paper No: AIAA 2019-1859. [Google Scholar] [CrossRef]
- NASA. Available online: https://ntrs.nasa.gov/api/citations/20170005794/downloads/20170005794.pdf?att-achment=true (accessed on 9 July 2023).
- DAU. Available online: https://www.dau.edu/cop/stm/lists/tools/allitems.aspx (accessed on 9 July 2023).
- Cordis. Available online: https://cordis.europa.eu/project/id/323460/reporting (accessed on 9 July 2023).
- Cordis. Available online: https://cordis.europa.eu/project/id/285395 (accessed on 9 July 2023).
- Ajaj, R.M.; Beaverstock, C.S.; Friswell, M.I. Morphing Aircraft: The Need for a New Design Philosophy. Aerosp. Sci. Technol. 2016, 49, 154–166. [Google Scholar] [CrossRef]
- Ameduri, S.; Concilio, A. A Shape Memory Alloy Torsion Actuator for Static Blade Twist. J. Intell. Mater. Syst. Struct. 2019, 30, 2605–2626. [Google Scholar] [CrossRef]
- Ameduri, S.; Concilio, A. Morphing Wings Review: Aims, Challenges, and Current Open Issues of a Technology. Proc. Inst. Mech. Eng. Part C J. Mech. Eng. Sci. 2020, 234, 3571–3595. [Google Scholar] [CrossRef]
- Boyraz, P.; Runge, G.; Raatz, A. An Overview of Novel Actuators for Soft Robotics. Actuators 2018, 7, 48. [Google Scholar] [CrossRef]
- Xia, J.; Durfee, W.K. Analysis of Small-Scale Hydraulic Actuation Systems. J. Mech. Des. 2013, 135, 091001. [Google Scholar] [CrossRef]
- Liu, D.K.-C.; Friend, J.; Yeo, L. A brief review of actuation at the micro-scale using electrostatics, electromagnetics and piezoelectric ultrasonics. Acoust. Sci. Technol. 2010, 31, 115–123. [Google Scholar] [CrossRef]
- Potapov, P.L.; Da Silva, E.P. Time Response of Shape Memory Alloy Actuators. J. Intell. Mater. Syst. Struct. 1999, 10, 47–54. [Google Scholar]
- Funakubo, H. Shape Memory Alloys; Taylor & Francis: London, UK, 1987; ISBN 9782881241369. [Google Scholar]
- Concilio, A.; Antonucci, V.; Auricchio, F.; Lecce, L.; Sacco, E. (Eds.) Shape Memory Alloy Engineering: For Aerospace, Structural, and Biomedical Applications, 2nd ed.; Elsevier: Amsterdam, The Netherlands, 2021; ISBN 9780128192648. [Google Scholar]
- Cordis. Available online: https://cordis.europa.eu/project/id/296617/it (accessed on 25 August 2023).
- Karagiannis, D.; Stamatelos, D.; Kappatos, V.; Spathopoulos, T. An investigation of shape memory alloys as actuating elements in aerospace morphing applications. Mech. Adv. Mater. Struct. 2017, 24, 647–657. [Google Scholar] [CrossRef]
- Cordis. Available online: https://cordis.europa.eu/project/id/267679 (accessed on 25 August 2023).
- Ameduri, S.; Concilio, A.; Pecora, R.; Karagiannis, D. A Single Slotted Morphing Flap Based on SMA Technology. Smart Struct. Syst. 2016, 17, 819–835. [Google Scholar] [CrossRef]
- Walgren, P.; Bertagne, C.; Wescott, M.; Benafan, O.; Erickson, L.; Whitcomb, J.; Hartl, D. Development and Testing of a Shape Memory Alloy-Driven Composite Morphing Radiator. Shape Mem. Superelasticity 2018, 4, 232–241. [Google Scholar] [CrossRef]
- Lienhard, J.; Knippers, J. Considerations on the Scaling of Bending-Active Structures. Int. J. Space Struct. 2013, 28, 137–148. [Google Scholar] [CrossRef]
- Lesieutre, G.A.; Browne, J.A.; Frecker, M.I. Scaling of performance, weight, and actuation of a 2-D compliant cellular frame structure for a morphing wing. Smart Mater. Struct. 2004, 13, 785–795. [Google Scholar]
- Zhang, J.; Andersson, J.A.E.; Friswell, M.I.; Cooper, J.E. Scalability Assessment of Morphing Aerospace Systems. J. Aircr. 2020, 57, 1167–1181. [Google Scholar]
- Krishnan, R.; Zhang, J.; Cooper, J.E.; Friswell, M.I. Morphing Aerospace Systems: A Roadmap to Commercialization. J. Aircr. 2021, 58, 1–16. [Google Scholar] [CrossRef]
- Gerdes, J.W.; Gupta, S.K.; Wilkerson, S.A. A Review of Bird-Inspired Flapping Wing Miniature Air Vehicle Designs. J. Mech. Robot. 2012, 4, 021003. [Google Scholar] [CrossRef]
- Talmale, R.; Bhat, M.N. Energy Attentive and Pre-Fault Recognize Mechanism for Distributed Wireless Sensor Network Using Fuzzy Logic Approach. Wirel. Pers. Commun. 2021, 124, 1263–1280. [Google Scholar] [CrossRef]
- Hameed, M.S.S.; Suganthi, N.; Balakrishnan, S. Cell-Leach Based Wireless Sensor Network for Optimized Energy Consumption. Int. J. Adv. Sci. Technol. 2021, 30, 111–120. [Google Scholar]
- van Gent, P.L.; Michaelis, D.; van Oudheusden, B.W.; Weiss, P.-É.; de Kat, R.; Laskari, A.; Jeon, Y.J.; David, L.; Schanz, D.; Huhn, F.; et al. Comparative assessment of pressure field reconstructions from particle image velocimetry measurements and Lagrangian particle tracking. Exp. Fluids 2017, 58, 33. [Google Scholar] [CrossRef]
- Gritli, W.; Gharsallaoui, H.; Benrejeb, M. A New Methodology for Tuning PID-Type Fuzzy Logic Controllers Scaling Factors Using Genetic Algorithm of a Discrete-Time System. In Modern Fuzzy Control Systems and Its Applications; Ramakrishnan, S., Ed.; In Tech Open: London, UK, 2017. [Google Scholar] [CrossRef]
- Ameduri, S.; Ciminello, M.; Concilio, A.; Dimino, I.; Galasso, B.; Guida, M.; Miceli, M.F.; Riemenschneider, J.; Kalow, S.; Luebker, J.; et al. Whirl Tower Demonstration of an SMA Blade Twist System. Actuators 2022, 11, 141. [Google Scholar] [CrossRef]
- Ameduri, S.; Ciminello, M.; Concilio, A.; Dimino, I.; Galasso, B.; Guida, M.; Riemenschneider, J.; Woods, B.K.S. SMA blade twist system: From the requirements to the demonstration in relevant environment. In Proceedings of the SPIE Conference 12483, Long Beach, CA, USA, 12–16 March 2023; Paper No: 124831D. 2023. [Google Scholar] [CrossRef]
- Pires, O.; Munduate, X.; Boorsma, K.; Ceyhan Yilmaz, O.; Aa Madsen, H.; Timmer, W.A. Experimental Investigation of Surface Roughness Effects and Transition on Wind Turbine Performance. J. Phys. Conf. Ser. 2018, 1037, 052018. [Google Scholar] [CrossRef]
- Abdelmoula, A.; Rauleder, J. Aerodynamic Performance of Morphed Camber Rotor Airfoils. In Proceedings of the AIAA Scitech 2019 Forum, San Diego, CA, USA, 7–11 January 2019; AIAA: Reston, VA, USA, 2019. Paper No: 109650H. [Google Scholar] [CrossRef]
- Academy of Model Aeronautics. Available online: https://www.modelaviation.com/dealingwithcg (accessed on 9 July 2023).
- Hexagon. Available online: https://simcompanion.hexagon.com/customers/s/article/msc-nastran-2014-1--reference-manual-doc11576 (accessed on 9 July 2023).
- Femap. Available online: https://plm.sw.siemens.com/en-US/simcenter/mechanical-simulation/femap/ (accessed on 28 August 2023).
- Ameduri, S.; Concilio, A.; Galasso, B.; Gianvito, A. Development of a Conceptual Demonstrator of a SMA-based Rotorcraft Blade Twist System. In Proceedings of the Bioinspiration, Biomimetics, and Bioreplication IX, Denver, CO, USA, 2–7 March 2019; SPIE: Bellingham, WA, USA, 2019; Volume 10965. Paper No: 109650H. [Google Scholar] [CrossRef]
- MSC Software Corporation. Quick Reference Guide; MSC Software Corporation: Newport Beach, CA, USA, 2015; pp. 2765–2768. [Google Scholar]
- Auricchio, F.; Bonetti, E.; Scalet, G.; Ubertini, F. Theoretical and Numerical Modeling of Shape Memory Alloys Accounting for Multiple Phase Transformations and Martensite Reorientation. Int. J. Plast. 2014, 56, 19–42. [Google Scholar] [CrossRef]
- Wertheimer, T.B.; Harvey, S.; Minaie, R. Recent Advances in Thermal Mechanically Coupled Analysis using MSC. In Proceedings of the Thermal and Fluids Analysis Workshop 2010, League City, TX, USA, 16–20 August 2010. [Google Scholar]
- Mechanicalc Inc. Available online: https://mechanicalc.com/reference/beam-deflection-tables (accessed on 9 July 2023).
- MIT. Available online: https://web.mit.edu/drela/Public/web/xfoil/ (accessed on 9 July 2023).
- Funakubo, H. Shape Memory Alloys; Gordon and Breach Science Publishers: New York, NY, USA, 1987; ISBN 978-2-88124-136-9. [Google Scholar]
- Concilio, A.; Antonucci, V.; Auricchio, F.; Lecce, L.; Sacco, E. (Eds.) Shape Memory Alloy Engineering: For Aerospace, Structural, and Biomedical Applications, 2nd ed.; Butterworth-Heinemann: Oxford, UK, 2021; ISBN 978-0-12-819264-1. [Google Scholar]
- Brinson, L.C. One-Dimensional Constitutive Behavior of Shape Memory Alloys: Thermomechanical Derivation with Non-Constant Material Functions and Redefined Martensite Internal Variable. J. Intell. Mater. Syst. Struct. 1993, 4, 229–242. [Google Scholar] [CrossRef]
- MSC Software. MSC Nastran 2021.3, Aeroelastic Analysis User’s Guide; MSC Software: Newport Beach, CA, USA, 2021; Available online: https://help-be.hexagonmi.com/bundle/MSC_Nastran_2021.3_Aeroelastic_Analysis_User_Guide/raw/ (accessed on 9 September 2023).
- Wikipedia. Galerkin Method. Available online: https://en.wikipedia.org/wiki/Galerkin_method (accessed on 9 September 2023).


| Alloy Type and Composition | NiTiNol | Ni—ca. 55% Ti—Balance Other Elements *—<0.05% * Fe, C, O, Co, Cr, Ni, H, N |
|---|---|---|
| SMA (actuator) (data measured via internal tests) | Austenite Young modulus, Ea, (GPa) | 38.8 |
| Martensite Young modulus, Em, (GPa) | 28.8 | |
| Poisson ratio | 0.33 | |
| Martensite start transformation stress, (MPa) | 186.0 | |
| Martensite finish transformation stress, (MPa) | 348.0 | |
| Austenite start transformation stress, (MPa) | 168.0 | |
| Austenite finish transformation stress, (MPa) | 6.0 | |
| Martensite start transformation temp. Ms, (°C) | 42.0 | |
| Martensite finish transformation temp., Ms, (°C) | 15.0 | |
| Austenite start transformation temp., As, (°C) | 45.0 | |
| Austenite finish transformation temp., Ms, (°C) | 72.0 | |
| Stress/temperature ratio (MPa/°K) | 6.0 | |
| Density (kg/m3) | 6450.0 | |
| Ultimate stress (MPa) | 500.0 | |
| 7075-T6 Aluminium alloy for middle and side flanges | Young modulus (GPa) | 71.0 |
| Poisson ratio | 0.32 | |
| Damping factor (%) | 2.0 | |
| Density (kg/m3) | 2750.0 | |
| Ultimate stress (MPa) | 572.0 | |
| 310 AISI Stainless steel alloy for clamps and connecting beam | Young modulus (GPa) | 210.0 |
| Poisson ratio | 0.32 | |
| Damping factor (%) | 2.0 | |
| Density (kg/m3) | 7900.0 | |
| Ultimate stress (MPa) | 655.0 | |
| PTFE used for the skin and the middle ribs | Young modulus (MPa) | 540.0 |
| Poisson ratio | 0.42 | |
| Damping factor (%) | 22.4 | |
| Density (kg/m3) | 2240.0 | |
| Ultimate stress (MPa) | 25.0 |
| Value of Torque Stiffness vs. sc vs. T (Nm/rad) | ||||
|---|---|---|---|---|
| Scale Factor, sc | ||||
| T (°C) | 0.5 | 1.0 | 1.5 | 2.0 |
| 25 | 0.99 | 3.35 | 8.06 | 63.56 |
| 50 | 2.21 | 7.47 | 17.71 | 141.70 |
| 75 | 3.62 | 12.22 | 28.95 | 231.63 |
| 100 | 4.04 | 13.64 | 32.32 | 255.57 |
| Parameter | Value for sc = 0.5 | Value for sc = 1.0 (Nominal) | Value for sc = 1.5 | Value for sc = 2.0 |
|---|---|---|---|---|
| Scale factor | 0.5 | 1.0 Nominal | 1.5 | 2.0 |
| Material–Model | PTFE | PTFE | LPDE | LPDE |
| Flap bending stiffness correction | ||||
| Additional area (m2) | 8.45 × 10³ | 0 | 3.80 × 10⁻⁴ | 6.76 × 10−04 |
| Distance from the shear centre normal to chord line (m) | 3.59 × 10⁻³ | 0 | 1.90 × 10⁻² | 7.29 × 10⁻³ |
| Material of the additional area | Steel | 0 | PTFE | PTFE |
| Added (+) or removed (−) | + | NA | − | − |
| Lag bending stiffness correction | ||||
| Additional area (m2) | 3.95 × 10⁻⁵ | 0 | 1.22 × 10⁻⁴ | 6.76 × 10⁻⁴ |
| Distance from the shear centre in chord direction (m) | 5.08 × 10⁻³ | 0 | 1.39 × 10⁻² | 2.15 × 10⁻² |
| Material of the additional area | Steel | 0 | PTFE | PTFE |
| Added (+) or removed (−) | + | NA | − | − |
| Scale Factor | ||||
|---|---|---|---|---|
| 0.5 | 1.0 Nominal | 1.50 | 2.0 | |
| mode 1 (Hz) | 22.27 | 2.39 | 1.97 | 5.85 |
| mode 2 (Hz) | 38.21 | 12.61 | 11.79 | 10.21 |
| mode 3 (Hz) | 64.95 | 14.10 | 13.00 | 17.62 |
| mode 4 (Hz) | 83.35 | 17.24 | 13.79 | 24.80 |
| mode 5 (Hz) | 101.75 | 41.90 | 29.11 | 30.91 |
| mode 6 (Hz) | 132.15 | 48.83 | 34.88 | 32.04 |
| flutter (m/s) | no flutter | 36.40 | no flutter | 48.48 |
| Parameter | Dependency on sc | Beam Theory Prediction |
|---|---|---|
| Normal stiffness | Linear, growing | Linear |
| Bending flap stiffness | Linear, growing | Linear |
| Bending lag stiffness | Square root, growing | Linear |
| Torsion | Cubic, growing | Cubic |
| Reaction force, Reynolds | Quadratic, growing | Quadratic |
| Stress Levels, 1/M | Exponential, decreasing | - |
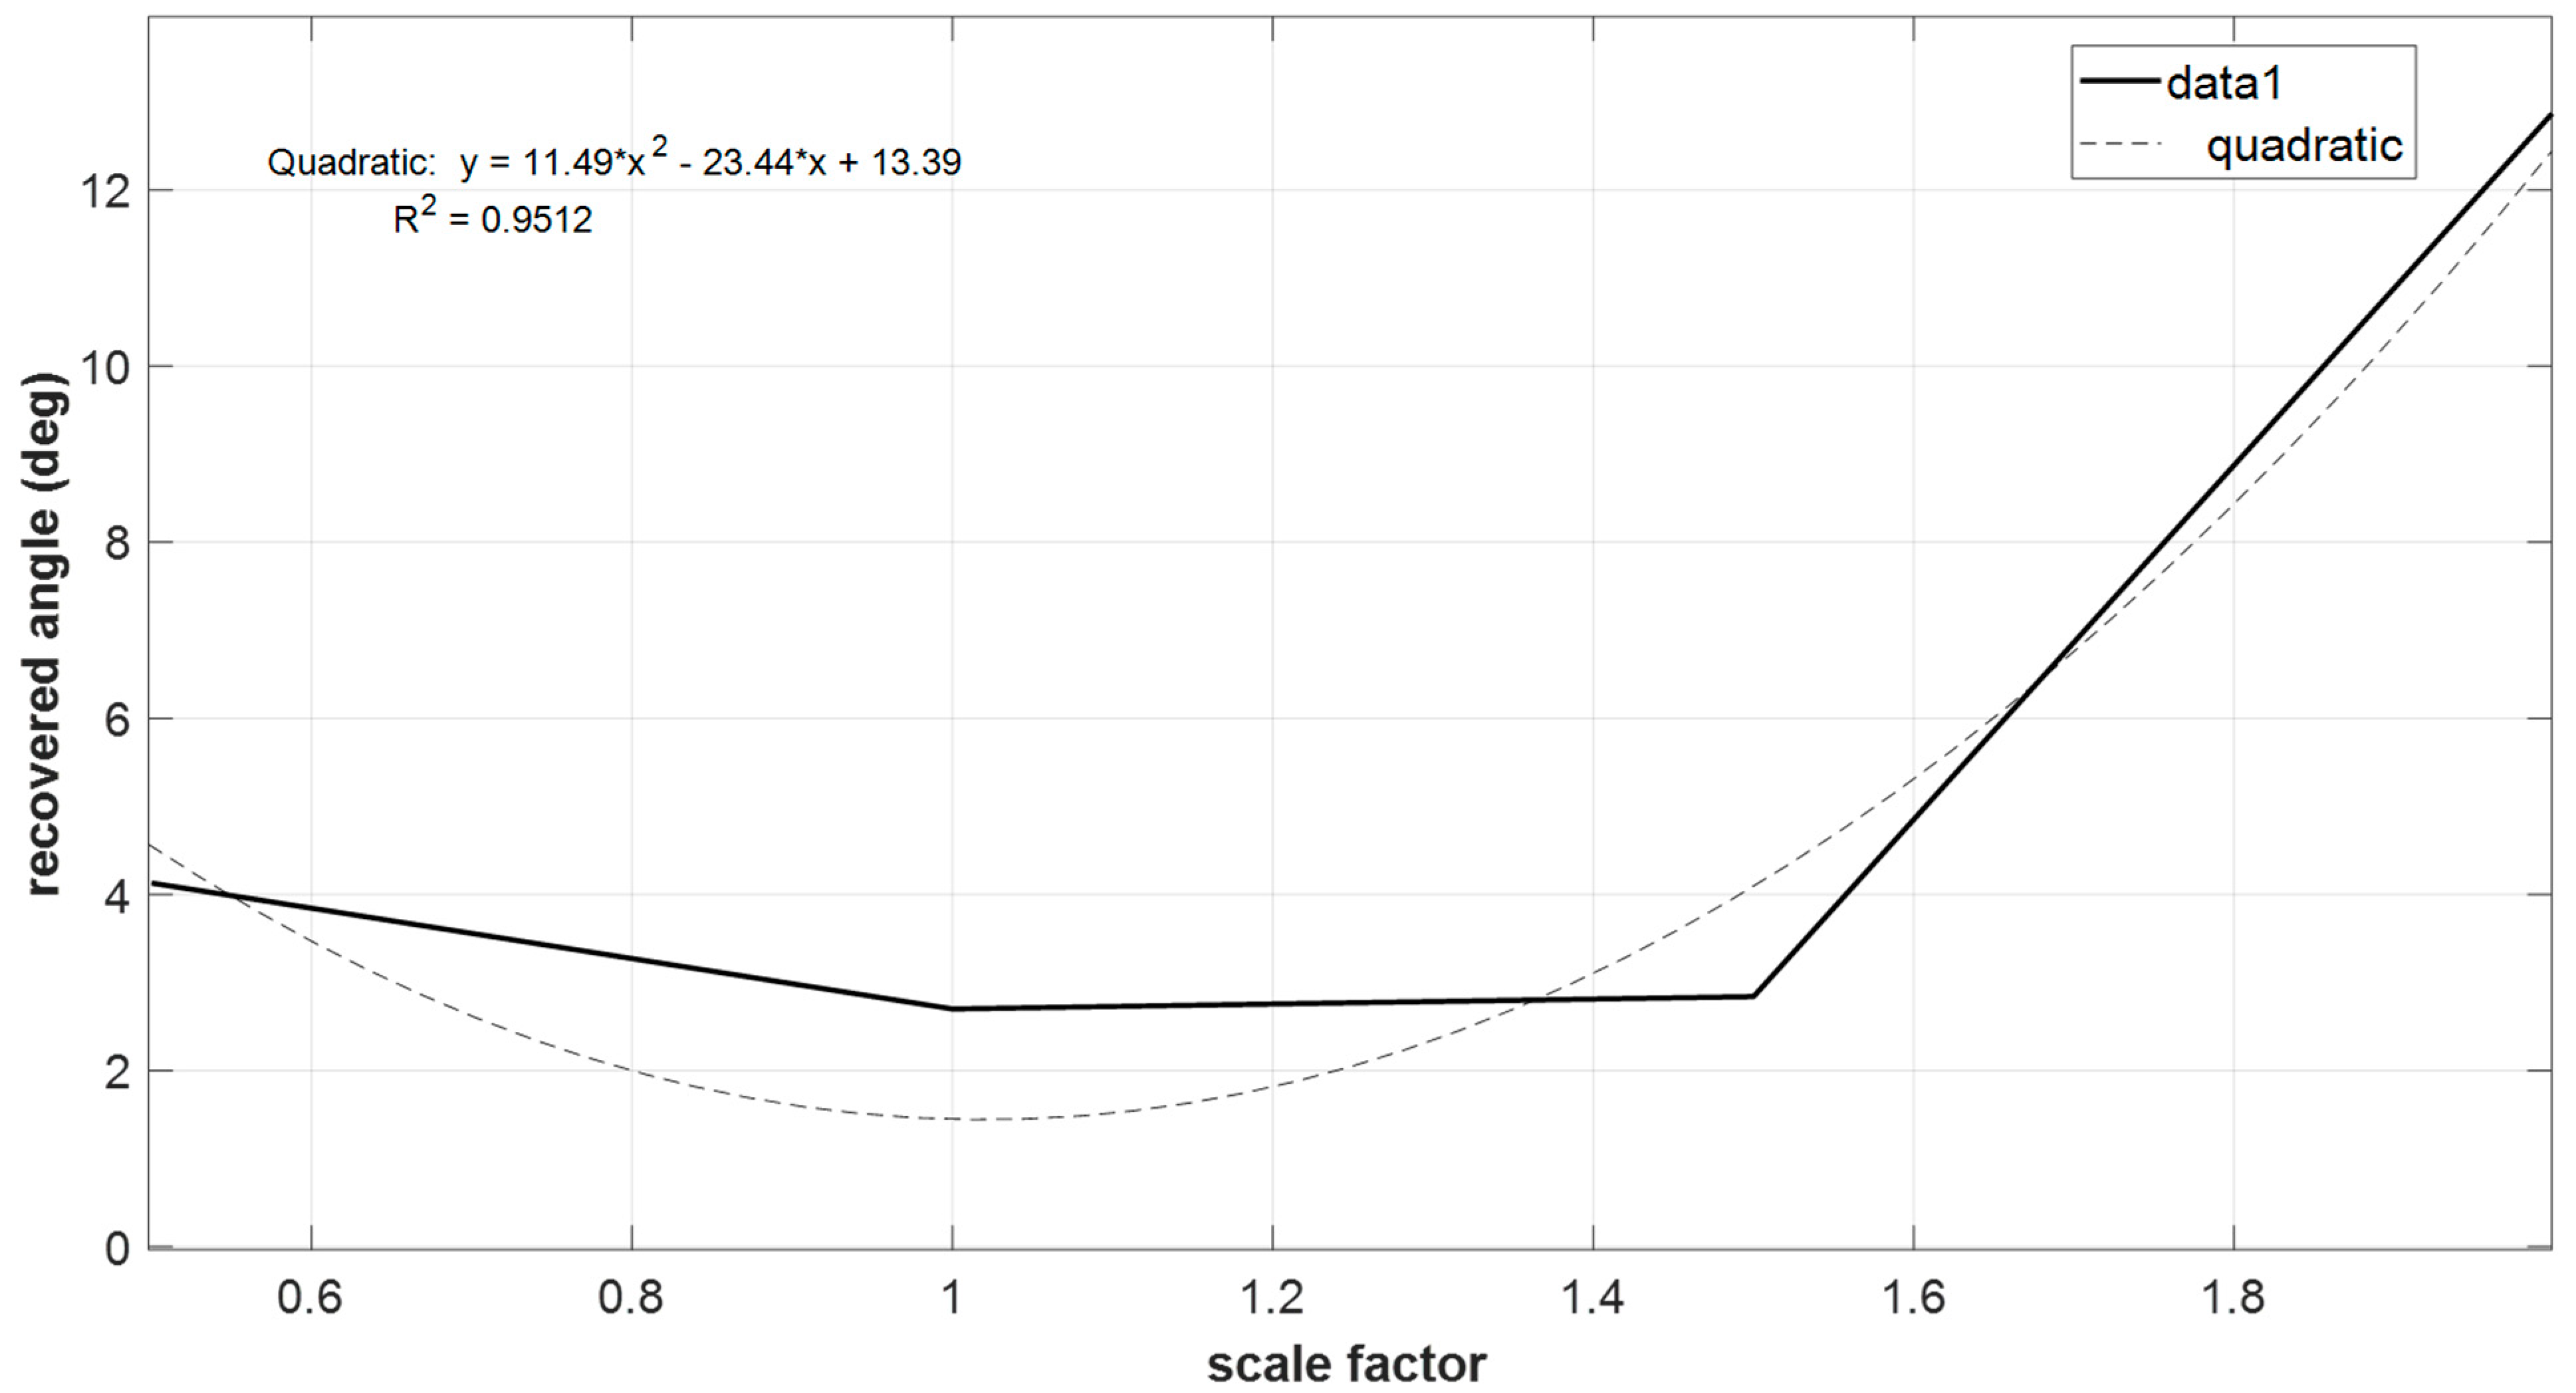
| Recovered twist angle | Quadratic, parabolic | - |
| Actuator torque stiffness | Exponential, growing | - |
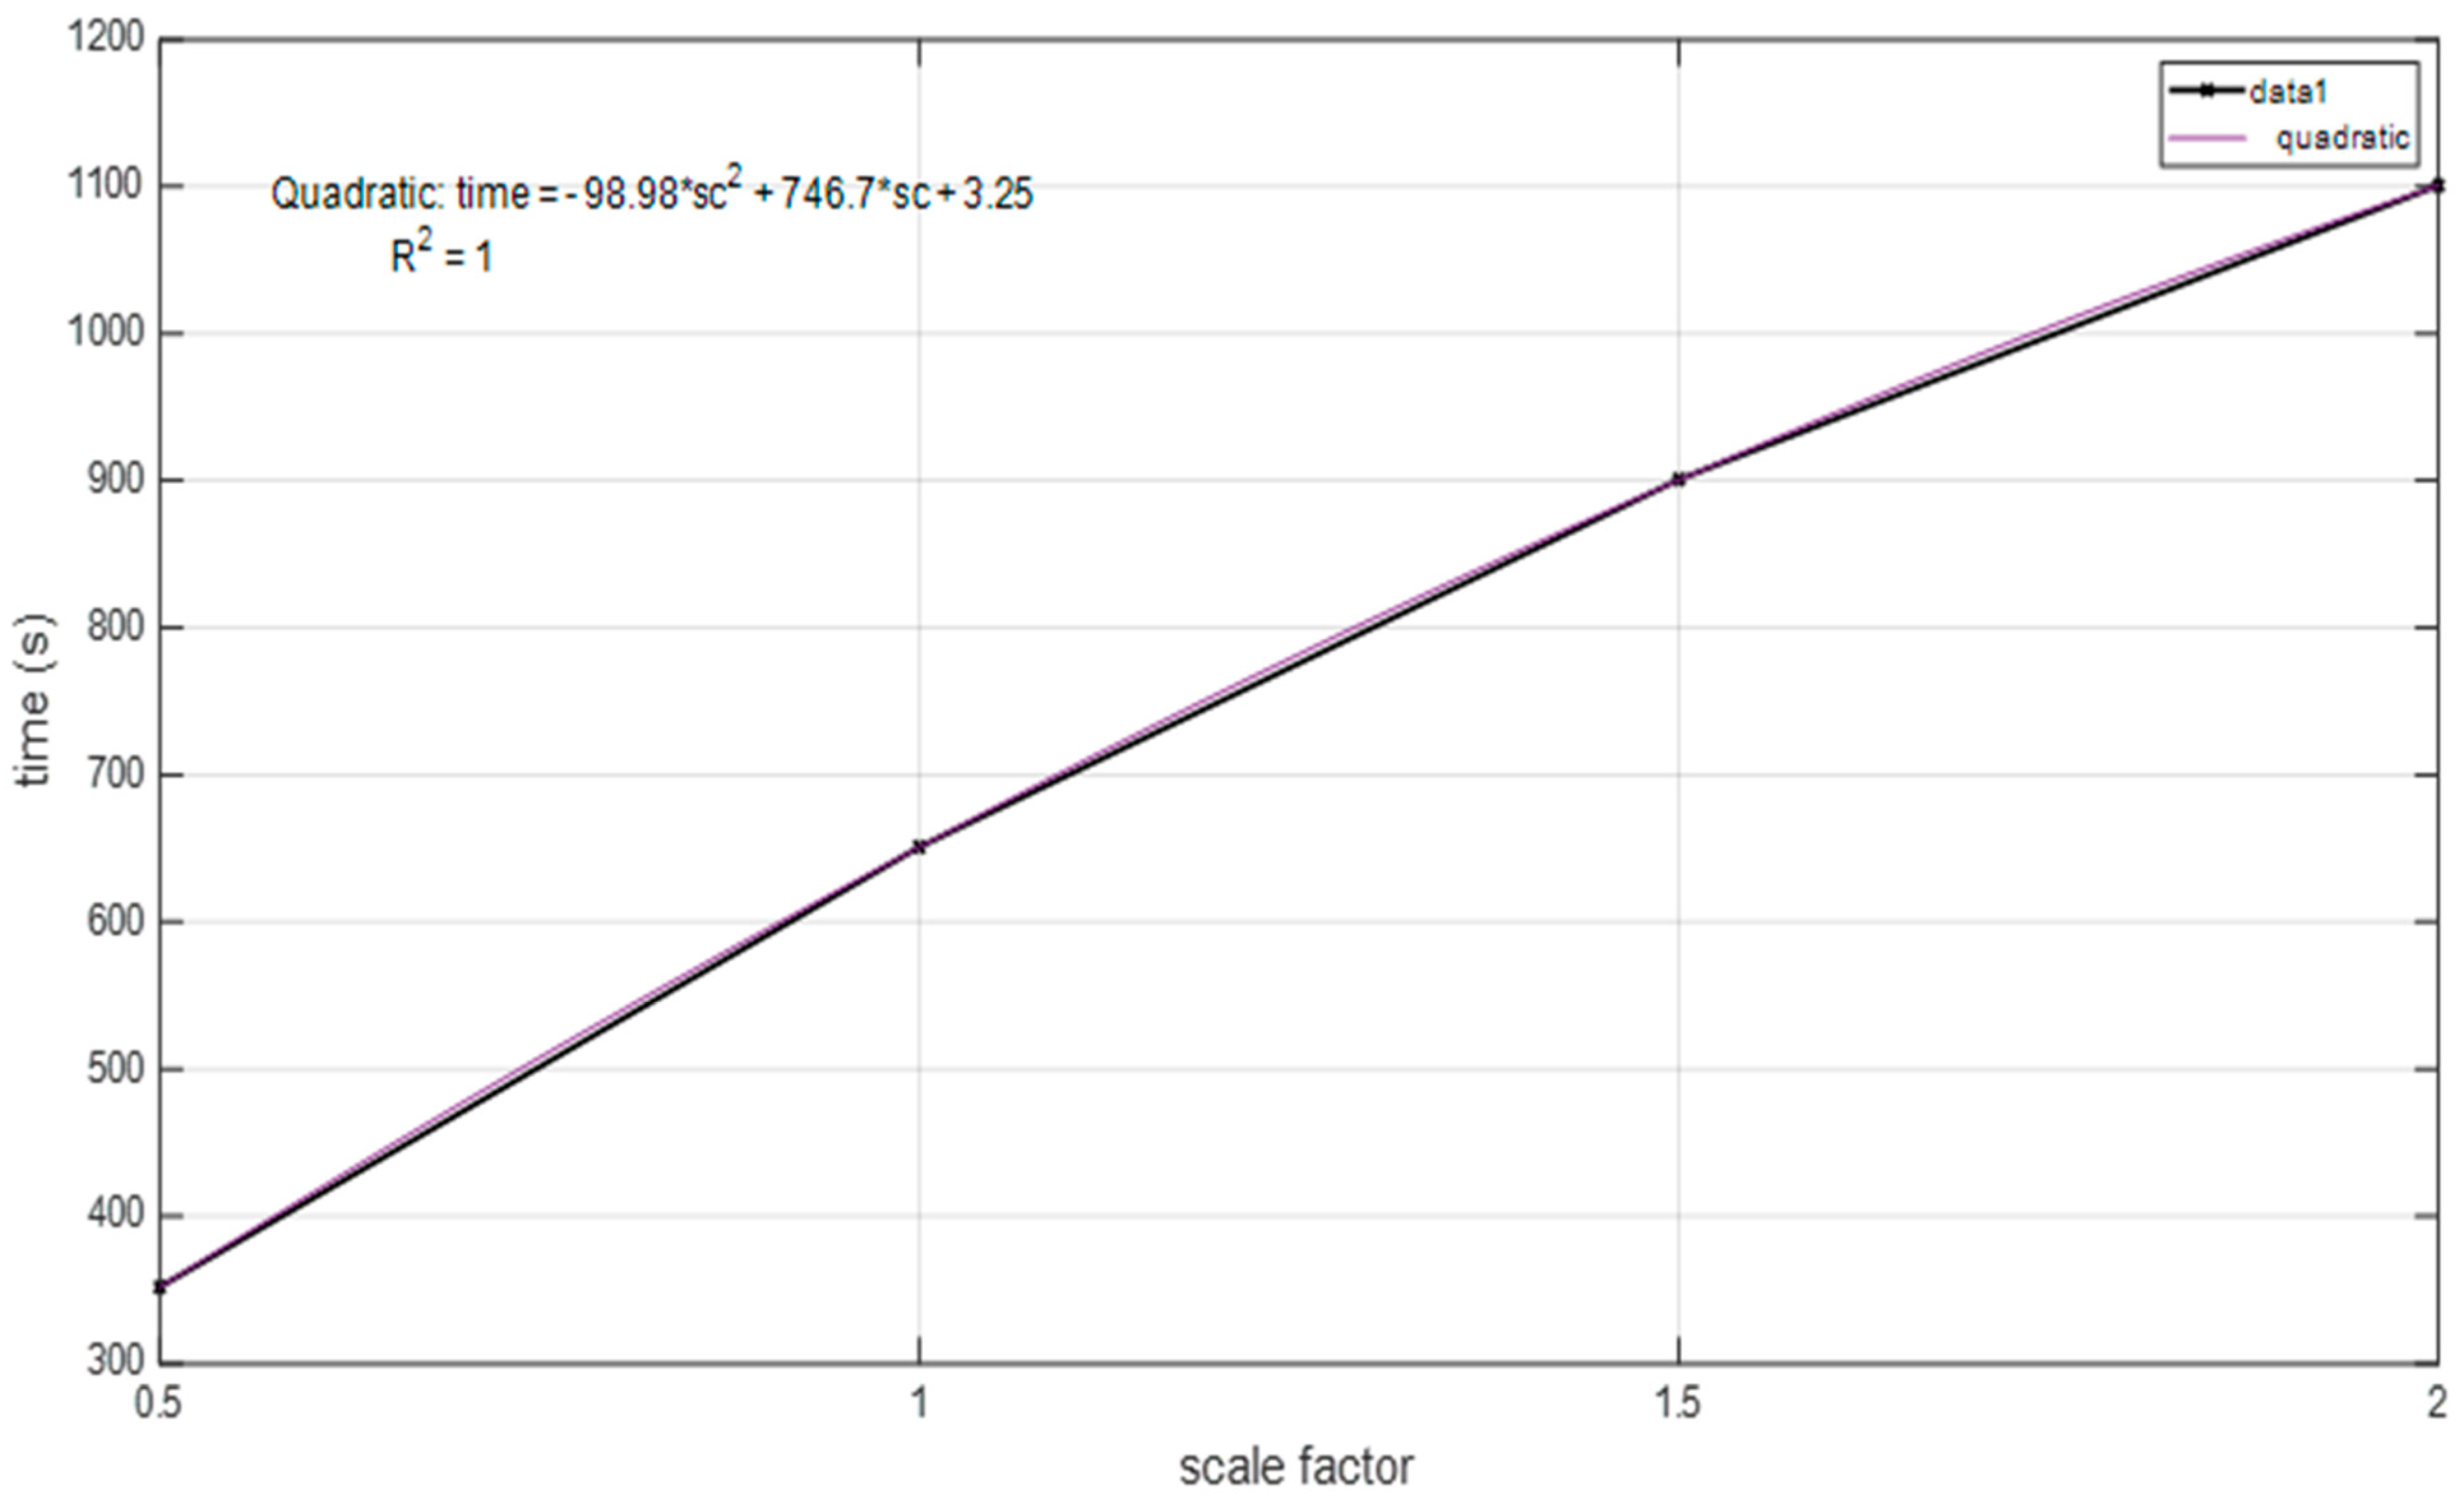
| Activation Time | Square root, growing | - |
| Eigenvalues | Quadratic, decreasing | - |
| Flutter speed | Constant | - |
| Eigenmodes density | Increasing | - |
| sc | Axial | Flap Bending | Lag Bending | Torsion |
|---|---|---|---|---|
| 0.5 | Satisfactory | Excellent | Inadequate | Inadequate |
| 1.0 | - | - | - | - |
| 1.5 | Satisfactory | Excellent | Satisfactory | Satisfactory |
| 2.0 | Poor | Satisfactory | Poor | Satisfactory |
Disclaimer/Publisher’s Note: The statements, opinions and data contained in all publications are solely those of the individual author(s) and contributor(s) and not of MDPI and/or the editor(s). MDPI and/or the editor(s) disclaim responsibility for any injury to people or property resulting from any ideas, methods, instructions or products referred to in the content. |
© 2023 by the authors. Licensee MDPI, Basel, Switzerland. This article is an open access article distributed under the terms and conditions of the Creative Commons Attribution (CC BY) license (https://creativecommons.org/licenses/by/4.0/).
Share and Cite
Concilio, A.; Galasso, B.; Ameduri, S. Scaling Effects on Morphing Structures: Preliminary Guidelines for Managing the Effects on a Case Study. Actuators 2023, 12, 366. https://doi.org/10.3390/act12100366
Concilio A, Galasso B, Ameduri S. Scaling Effects on Morphing Structures: Preliminary Guidelines for Managing the Effects on a Case Study. Actuators. 2023; 12(10):366. https://doi.org/10.3390/act12100366
Chicago/Turabian StyleConcilio, Antonio, Bernardino Galasso, and Salvatore Ameduri. 2023. "Scaling Effects on Morphing Structures: Preliminary Guidelines for Managing the Effects on a Case Study" Actuators 12, no. 10: 366. https://doi.org/10.3390/act12100366