Abstract
This study aims to examine the dynamic response of a polyvinylidene fluoride (PVDF) piezoelectric sensor which is embedded into an aluminum coupon using ultrasonic additive manufacturing (UAM). Traditional manufacturing techniques used to attach smart materials to metals on the surface have drawbacks, including the potential of exposing the sensor to adverse environments or physical degradation during manufacture. UAM can avoid these issues by integrating solid-state metal joining with subtractive processes to enable the fabrication of smart structures. A commercial PVDF sensor is embedded in aluminum with a compression technique to provide frictional coupling between the sensor and the metallic matrix. The PVDF sensor’s frequency bandwidth and impact detection performance are evaluated by conducting cantilever and axial impact tests, as well as harmonic excitation tests with an electrodynamic shaker. Under axial loading, the embedded sensor displays high linearity with a sensitivity of 43.7 mV/N, whereas impact tests in the cantilever configuration exhibit a steady decay rate of 0.13%. Finally, bending tests show good agreement between theoretical and experimental natural frequencies with percentage errors under 6% in two different clamping positions, and correspond to the maximum voltage output obtained from the embedded PVDF sensor at resonance.
1. Introduction
The embedment of sensors in structures can be critical for in situ monitoring and automation, facilitating data collection and process optimization with minimal disruption to the host system. For instance, studies have demonstrated the effectiveness of embedded sensors in gathering data on the internal state of reinforced concrete for the early detection of cracks [1,2]. Embedded sensors have been utilized in healthcare to accumulate system data for diagnosis and in prosthetics for improved sensory output [3,4]. Another example is the integration of real-time data into cyber–physical systems, which allows for smart machines that concurrently analyze their performance and integrity, leading to increased efficiency and system diagnosis with minimal human intervention [5].
Embedding sensors in a parent matrix for diagnostic purposes presents a variety of limitations with conventional manufacturing processes. Hu et al. [6] and Gayakwad [7] investigated the embedding of lead zirconate titanate (PZT) ceramic patches within concrete cylinders for structural health monitoring of civil infrastructures. Wang et al. [8] studied the embedding of a PZT sensor in a polymethyl methacrylate (PMMA) tube filled with epoxy resins for damage quantification in metals. In other studies, embedding piezoelectric sensors in fiber-reinforced and other types of composites has been focused on damage detection in lightweight structures [9,10,11,12]. Grandal et al. [13] analyzed the use of embedded fiber optic sensors in metals, while Hossain [14] studied the effect of embedded piezoceramic sensors in an alumina housing. For the examples mentioned, embedment is performed by either pouring concrete around the sensor where it is to be embedded or using epoxy resin molds. Some use welding to embed optic sensors or alumina housing in cases of the powder bed fusion process.
Traditional methodologies have several limitations as they require high processing temperatures or are based on deposition techniques. Additionally, piezoelectric materials are susceptible to damage due to high processing temperatures and specific mechanical failure modes such as shear (piezoceramics) and puncture (piezo-films). Furthermore, the power and conditioning electronics associated with these sensors require robust housing for damage prevention. Researchers have employed fastening or molding techniques to embed piezoelectric sensors in different materials via adhesives such as epoxy [15,16] or silicone elastomers [17,18], but these methods involve prolonged curing times and can interfere with the response of the sensors due to the bonding medium [19].
Efforts have been made to embed PZT ceramics within metal matrices using sintering and hot-pressing techniques [20,21]. However, these methods present challenges such as high temperature and pressure requirements, which may adversely affect the fragile nature of the ceramics. Incomplete powder densification during sintering and non-uniform heating during hot-pressing can lead to degradation and variations in the porosity of the embedded ceramics. This localized liquid phase flow induces structural recrystallization and allows for anisotropic shrinkage of the metal matrix over time, resulting in undesired stress concentrations in the embedded ceramics and potential fracture [22,23]. The complex nature of these processes, coupled with operational limitations, impedes the performance and long-term effectiveness of these embedded sensors [24]. In addition to high temperature processes, other methodologies target failure modes of sensors where things like high pressure (concrete pouring) can break these ceramics. Therefore, researchers cover the embedded sensors first using resins, a housing, etc. With UAM, we can directly embed sensors in structures without temperature or puncturing concerns. For this purpose, PVDF and other flexible smart materials present a viable option for sensor embedment as they mitigate the challenges associated with these methods, particularly when combined with solid-state additive manufacturing techniques.
Low-temperature manufacturing processes for embedding sensors in metals are scarce. Ramanathan et al. [25] explored the use of ultrasonic additive manufacturing (UAM) for embedding polyvinylidene fluoride (PVDF) sensors in an aluminum structure. UAM is a solid-state process that employs ultrasonic metal welding to additively join metal foils using ultrasonic vibrations in conjunction with normal force. Advanced UAM equipment is integrated with computer numerical control (CNC) machining for automated additive and subtractive operations. This process involves a rolling sonotrode that vibrates ultrasonically, resulting in high plastic flow at the interface between the foil being welded and the substrate, ensuring a solid-state bond between metal foils [26]. This process has been employed for the creation of multi-material structures with embedded active sensors, such as shape memory alloys [27,28,29,30,31], electrical circuitry [32], and fiber optic sensors, for structural health monitoring applications [33,34,35].
Hahnlen and Dapino [36] demonstrated that ultrasonic additive manufacturing can be used to embed sensors in metal matrices without compromising the sensing properties of the piezoelectric material, since the temperature of the welding surface during UAM stays below the Curie temperature of PVDF. Additionally, since UAM is utilized concurrently with CNC machining, it can be used to manufacture the geometry required for successful sensor embedment without the need for high-temperature processes. To this end, Ramanathan et al. [25] used a UAM system to mill a cavity in the baseplate for the sensor and wires necessary for retrieving real-time sensor data, and then ultrasonically welded a layer of foil over the sensor. The compression of the sensor, defined by the pocket depth and the PVDF thickness, effectively strains the PVDF and provides mechanical coupling between the sensor and matrix. While this process showed promising results, further research is required to improve the methodology.
The utilization of PVDF-based sensors in the automotive sector encompasses a diverse range of applications, including, but not limited to, structural health monitoring (SHM); non-destructive testing (NDT); energy harvesting; noise, vibration, and harshness (NVH) analysis; as well as traffic monitoring. The inherent flexibility and convenience of PVDF sensors offer opportunities for their integration to monitor structural parameters, leading to proactive maintenance strategies and data-driven enhancements in component integrity. This capability facilitates addressing service needs in advance, thereby extending the operational lifespan of equipment. Leveraging their high sensitivity, the changes in strain and voltage signal outputs from embedded PVDF sensors enable the observation of load cycles, which are critical for fatigue detection and the prevention of fracture failure [37,38,39]. Incorporating PVDF sensors within structures helps to monitor internal stress concentrations [40] and, therefore, could be used in vehicle chassis as part of a system to mitigate undesirable vibrations stemming from road impacts, thus enhancing passenger comfort during rides. In contrast to traditional surface mounting techniques, the embedment of these sensors ensures better detection of acoustic emissions through continuous real-time monitoring, safeguarded from damage or deterioration due to extreme environmental conditions [41,42]. Deploying sensors within tires or suspension systems not only facilitates energy harvesting but also imparts essential insights into road conditions, which are crucial for optimizing contact parameters and enhancing comfort levels [43]. Furthermore, their integration into road infrastructure serves to capture traffic data, ultimately improving the overall driving experience [44].
Sensing elements such as PZT or fiber optics have been experimented with for embedment purposes in various media such as concrete, epoxy resins, alumina, etc. The techniques used for the purposes of embedment provide limitations such as requiring high temperatures, metal deposition or pressing, etc. Such issues either damage the sensor being embedded or interfere with its response due to the bonding media. Hence, most of the techniques utilize fastening or molding operations. This study addresses these areas for improvement and aims to provide a more comprehensive understanding of the embedded PVDF sensor’s frequency bandwidth and detection performance by subjecting PVDF-embedded aluminum coupons to impact and harmonic excitation tests. We present a methodology to embed sensors directly in a metal matrix which has a variety of applications, especially in NDT and SHM. PVDF sensors, being flexible, allow us to embed them inside structures using UAM technology without compromising sensor effectiveness, while also protecting it from external influences.
2. Manufacturing Embedded Sensor Sample
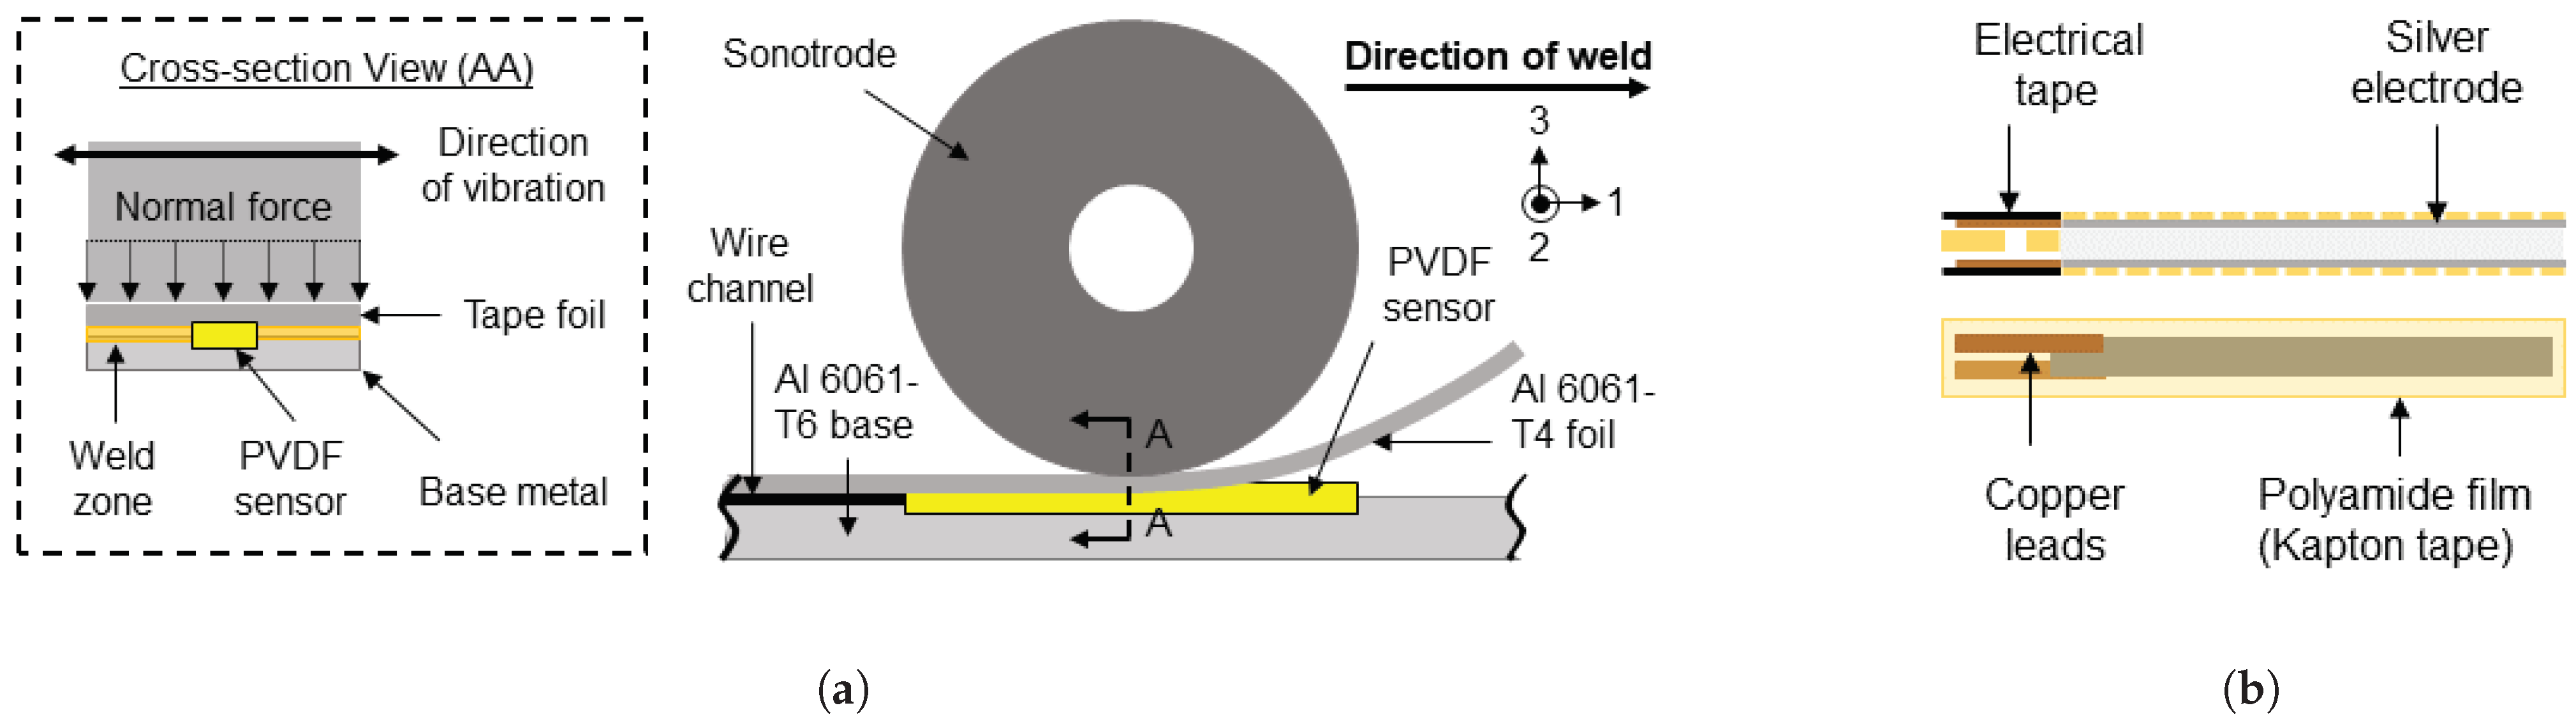
The PVDF sensor is embedded in the metal structure as illustrated in Figure 1. To aid the embedment process, the PVDF film is compressed by welding two aluminum foils on top of it, which enhances its mechanical coupling with the parent substrate. Kapton (polyamide) tapes are layered to laminate the sensor which act as electrical insulators and provide mechanical protection against the scrubbing action of the sonotrode between the foil and metal structure during the UAM process. The polyamide tapes also insulate the sensor electrodes from the metal matrix, ensuring adequate electrical responses. Empirical testing has demonstrated that a 12 μm compression thickness is sufficient [25]. Figure 2 shows the sensor and pocket dimensions as well as the channel depth.
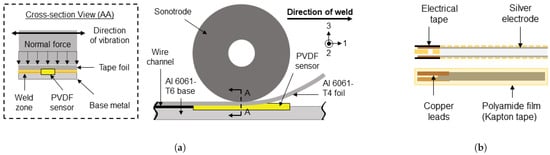
Figure 1.
Process for embedding a polyamide-clad PVDF sensor in a metal matrix through ultrasonic additive manufacturing (UAM). (a) The cross-section shows sensor compression due to the normal force exerted by the sonotrode on the Al-6061-T4 foil being welded. (b) Side and top views of the PVDF sensor.
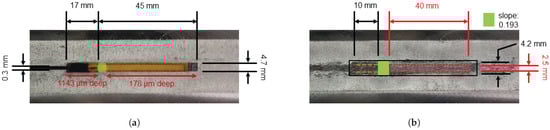
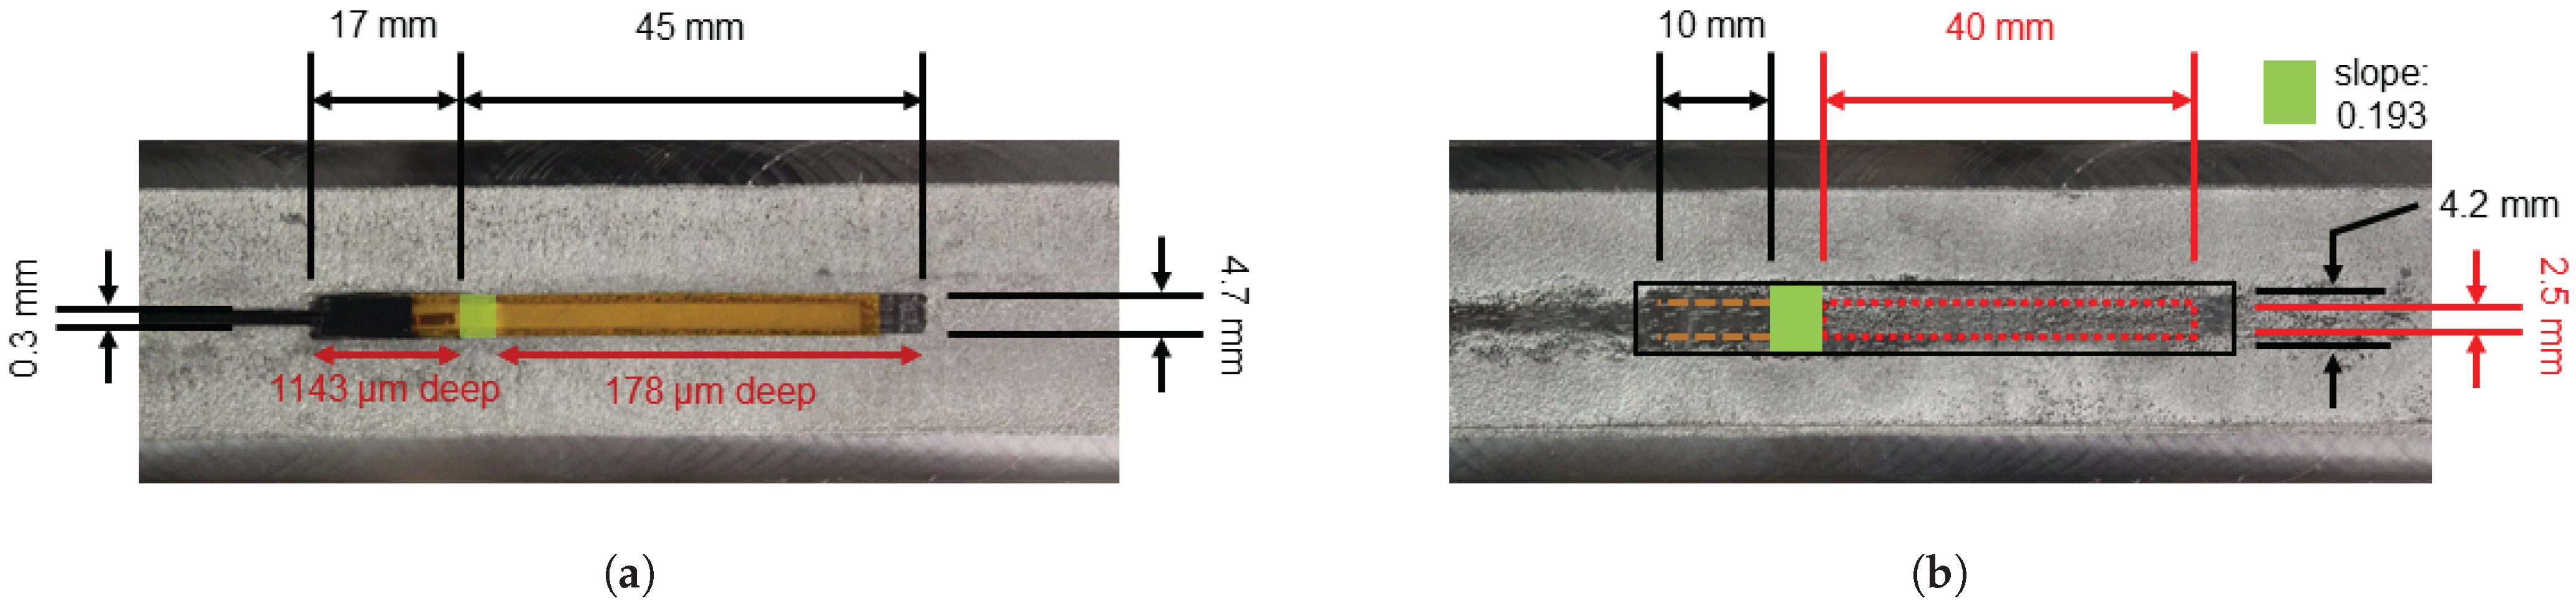
Figure 2.
(a) Machined pocket dimensions in the 6061-T6 baseplate with PVDF sensor sample tacked in place. (b) Embedded sensor active area dimensions with 6061-T4 foils welded on top. The dotted red box represents the location of the PVDF sensor (not to scale).
The process of manufacturing the sensor involves etching the sputtered silver electrodes on both sides of a 40 μm thick sheet to create the sensor structure. The effective sensing area is cut to the specified dimensions using a razor blade, and the excess electrode material around it is removed with acetone. Two 1 mm wide by 10 mm long copper leads are attached to the electrodes, and the resulting sensor is sandwiched between three 50 μm Kapton sheets, one on the bottom and two on top. The exposed copper leads are then soldered with insulated electrical wires, which are wrapped with electrical tape to prevent short circuiting. The active sensing area of the fabricated sensor is 40 mm × 2.5 mm × 190 μm.
In order to prepare the Al 6061-T6 baseplate for welding, the UAM sonotrode is run over the area to texture it. The textured surface is then overlaid with an Al 6061-H18 foil which is welded to the baseplate to create a strong solid-state bond. Pockets are then milled into the baseplate along with a channel for routing the sensor wiring. The depth of the pocket for the wire connections is milled deeper than that of the active sensing area to ensure that the PVDF sensor is compressed without damaging the connections. A sloped transition is introduced between the two channel depths to provide bending stress relief to the electrical connections. It is necessary to mention that the embedment position of the fabricated PVDF sensor in the aluminum baseplate lies above the neutral axis of the parent metal so that it strains completely when bending is applied. Additionally, since the sonotrode has a width of 25.4 mm (same as that of Al 6061-H18/T4 tape foil), it was necessary to choose sensor dimensions such that there is an adequate area around it for the foil to plastically deform and form a strong weld [45]. To hold the PVDF sensor in place during the UAM process, it is tacked inside the milled pockets with a very light layer of spray adhesive, and a depth gauge is used to ensure that the sensor protrudes above the baseplate. Two Al 6061-T4 tape foils are then welded over the sensor area, as illustrated in Figure 1, and compression is visually verified by observing the texture imparted over the sensing area. This texture can only be introduced if an opposing normal force is pushing against the welded tape. Capacitance (0.35 nF) and resistance (order of megaohms) measurements confirm that the sensor is not damaged by the embedment process. In addition, resistance measurements between the sensor and base confirm that the sensor is electrically insulated from the metal matrix. Finally, the specimen encasing the embedded PVDF is milled such that the sensor is positioned at the center of a rectangular beam with standardized ASTM D638 type-1 dimensions of length, width, and thickness. This ensures uniform loading across the sensing area during axial and bending tests and avoids any irregularities arising from non-symmetric sensor placement. The process parameters and sample specifications are presented in Table 1.

Table 1.
Sample properties and UAM process parameters.
3. Experimental Setup and Results
To validate the sensing capabilities of the PVDF specimen embedded in the metal matrix, a series of experiments were performed, including cantilever and axial impact tests and bending tests using a shaker. The aim of these experiments was to investigate the relationship between the sensor voltage output and strain response of the sample under impact loading and shaker acceleration through characterization of the specimen.
3.1. Axial Impact Tests
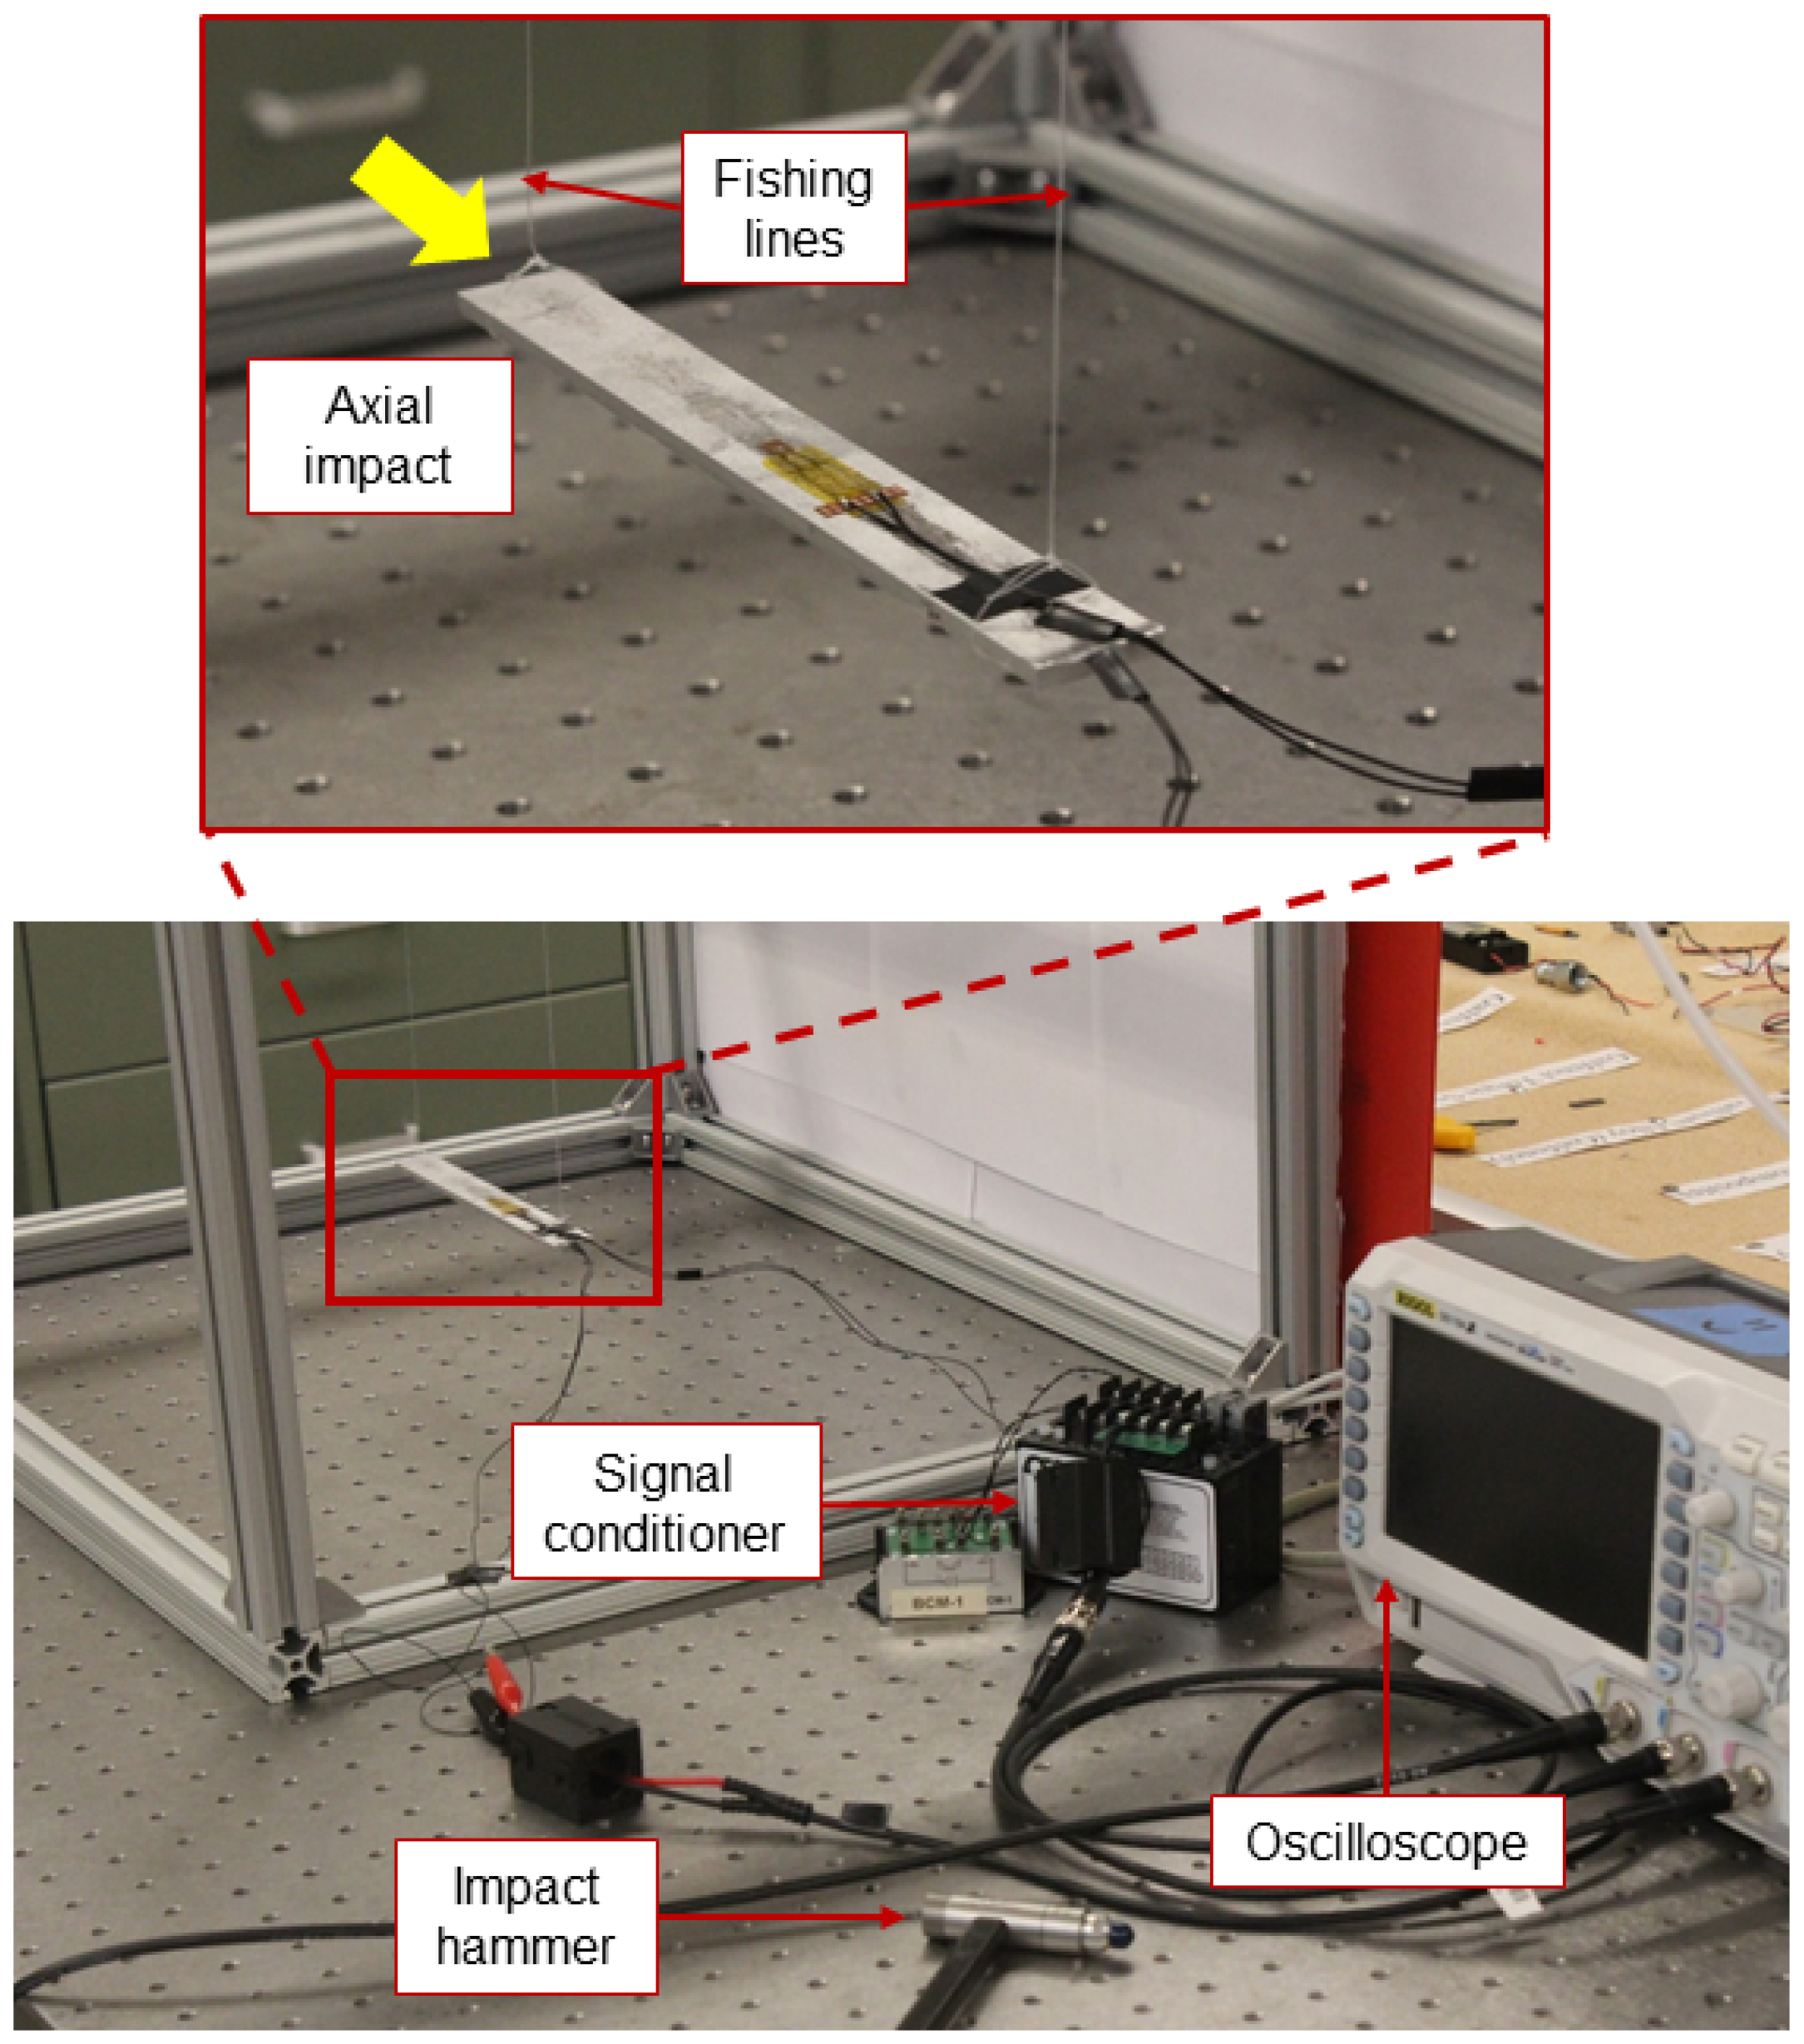
To avoid any influence from bending modes on the axial test results, the specimen was suspended from an aluminum frame ( mode) with lightweight fishing lines, as shown in Figure 3. The fishing lines were tied in loops around the specimen and secured to the bottom using tape to prevent sliding during impact. A strain gauge was affixed at the center of the active sensing region over the embedded sensor and connected to a Rigol MSO5074 oscilloscope through a signal conditioner and Wheatstone bridge to acquire the strain gauge data. A modally tuned impact hammer (PCB 086C02) with a load sensitivity of 11.79 mV/N and a 4.6 mm diameter plastic tip was used to conduct the experiments. The voltage output of the sensor and impact signals were also recorded through the oscilloscope using BNC cable connections. The specimen was impacted manually in the axial direction at the end opposite the wire channel, and the PVDF voltage output and strain were recorded. Additional constructive details are provided in the supplemental file, Figure S1.

Figure 3.
Experimental setup for axial impact testing hung from an aluminum frame by fishing lines.
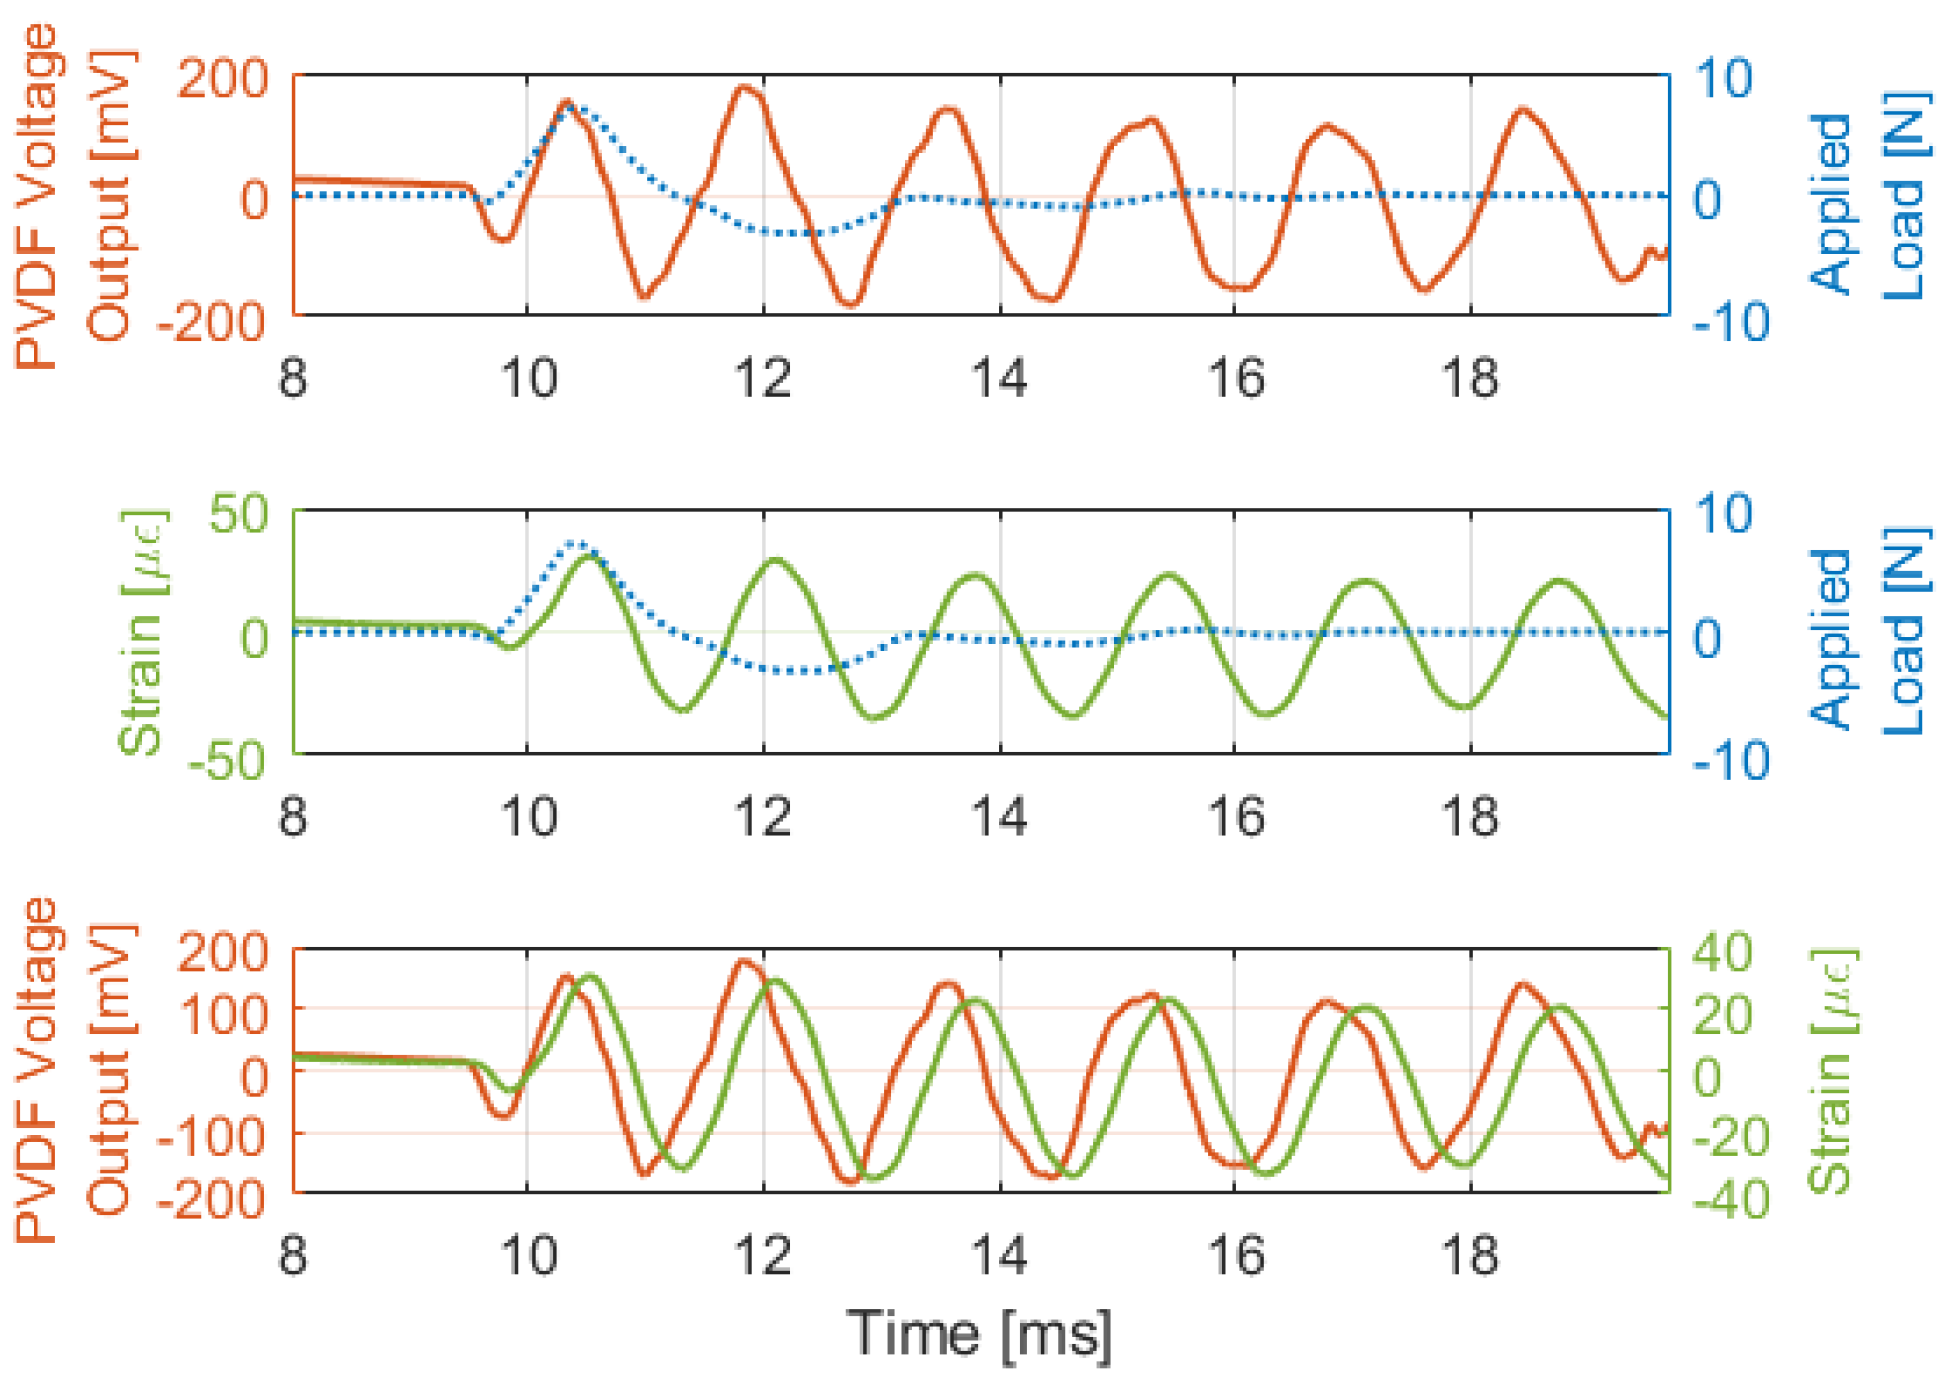
To ensure the repeatability of the embedded PVDF sensor, six axial tests were performed by applying various magnitudes of impact signals to the sample and monitoring the voltage outputs from the sensor. The voltage output of one of the tests is displayed in Figure 4. Prior to the impact, the voltage output remains negligible and increases proportionally immediately after the impact is made. A slight delay between this signal and voltage detection is observed, which can be attributed to the travel time of the stress waves from the start of the sample to the leading edge of the PVDF [46]. Furthermore, the small delay between the PVDF voltage output and strain measurement is due to the placement of the strain gauge at the center of the sensing area. Because the PVDF sensor is longer than the strain gauge, the PVDF begins producing a voltage output via its leading edge before the stress wave reaches the strain gauge.
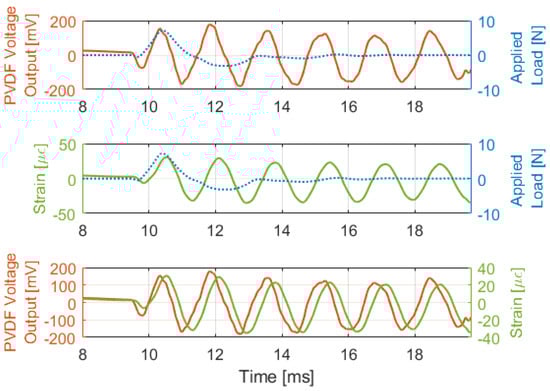
Figure 4.
Voltage and strain response of the embedded PVDF corresponding to impact loading [47].
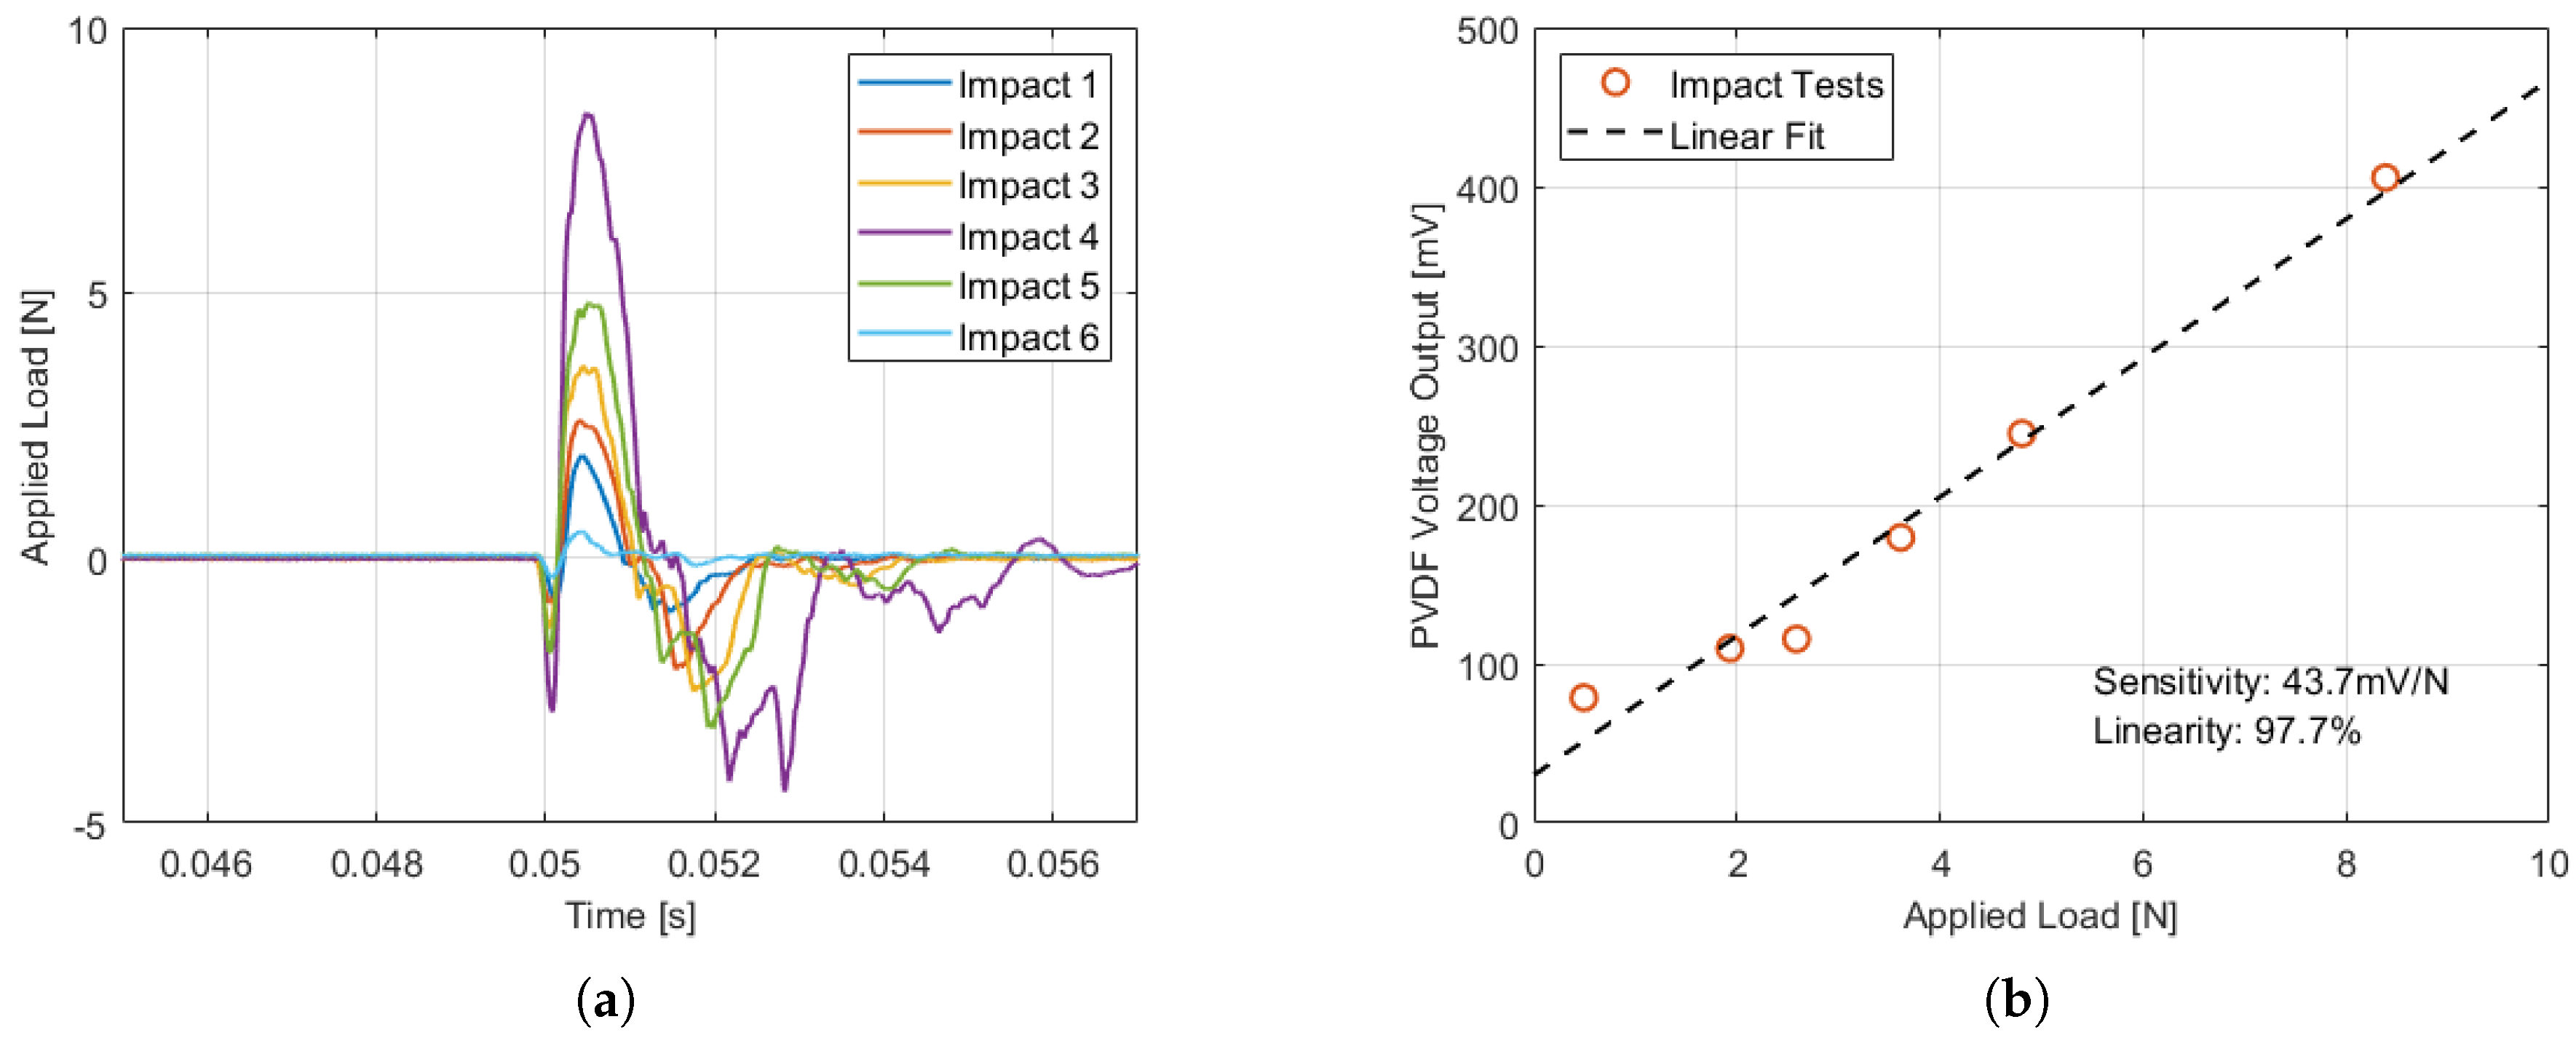
Figure 5 shows the maximum voltage output by the sensor plotted against the maximum impulse detected, and a curve fit is applied to determine the sensor sensitivity. The linearity of the fit is confirmed by a coefficient of determination () of 97.7%. This indicates that the voltage output is proportional to the impact magnitude. Furthermore, the sensor’s sensitivity is calculated to be 43.7 mV/N, which is the ratio of voltage output to the amplitude of impact. A greater sensitivity is a reflection of the sensor’s enhanced ability to detect minor changes in input [48]. Ramanathan et al. [25] conducted impulse tests in the mode to obtain sensor sensitivity with a linear fit of 98%. However, for complete characterization, results from loading in other modes and far from the embedment region were needed. Therefore, these axial impact tests portray a complete picture of the embedded sensor response and its sensitivity to localized contact forces.
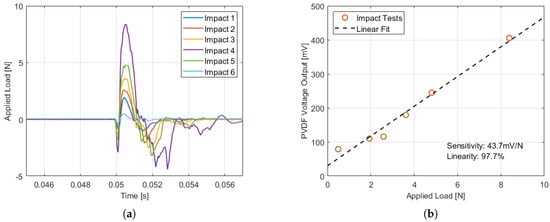
Figure 5.
(a) Impact loads for the six axial impact tests conducted [47]. (b) Measured impulse force amplitude vs. the amplitude of PVDF voltage response. The dashed black line represents the linear fit model of the measurement [47].
3.2. Cantilever Impact Tests
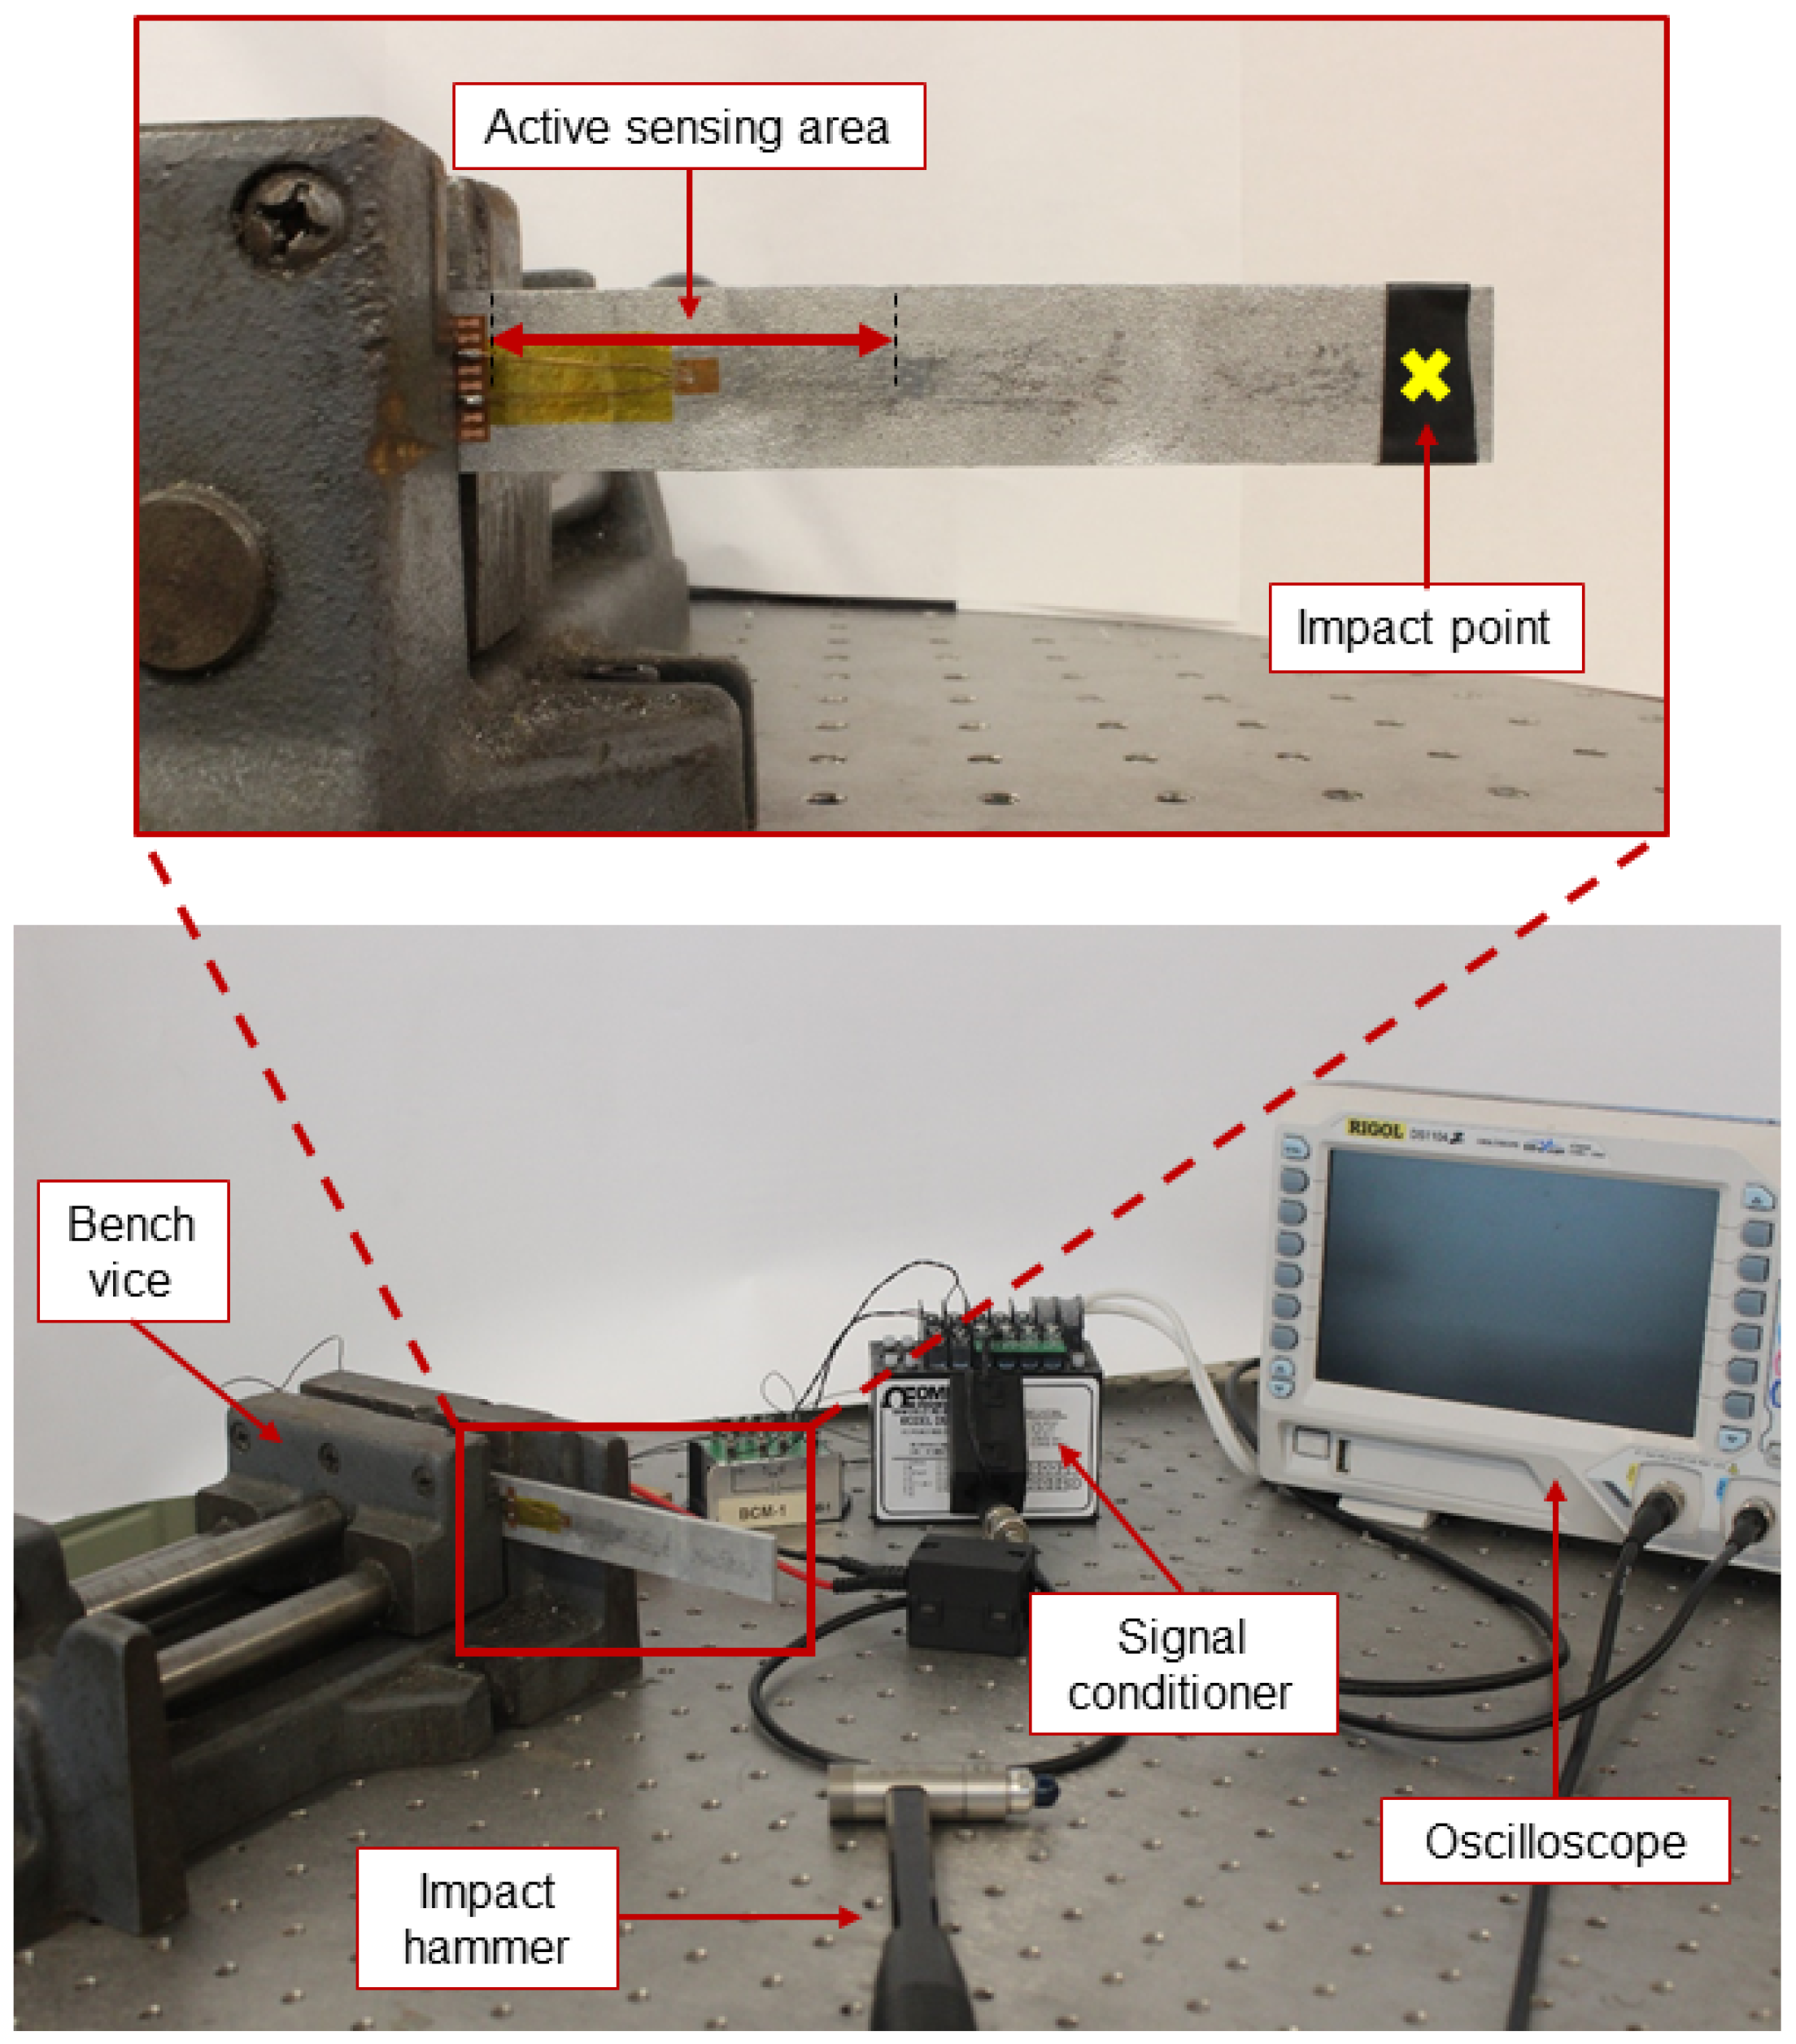
To test the impact detection and sensing performance of the sample, it was clamped in the mode and subjected to impact loading at the tip. The same connections were made for the strain gauge, sensor, and impact hammer, as mentioned earlier, to ensure the accuracy of the acquired data. The sample was secured in the vice and held at the base of the sensing area to ensure maximum strain during impact, as shown in Figure 6. The impact was applied at the tip of the sample, which was 60 mm away from the end of the sensing area.

Figure 6.
Experimental setup for cantilever impact testing of the sample clamped in a bench vice and connected to a data acquisition system.
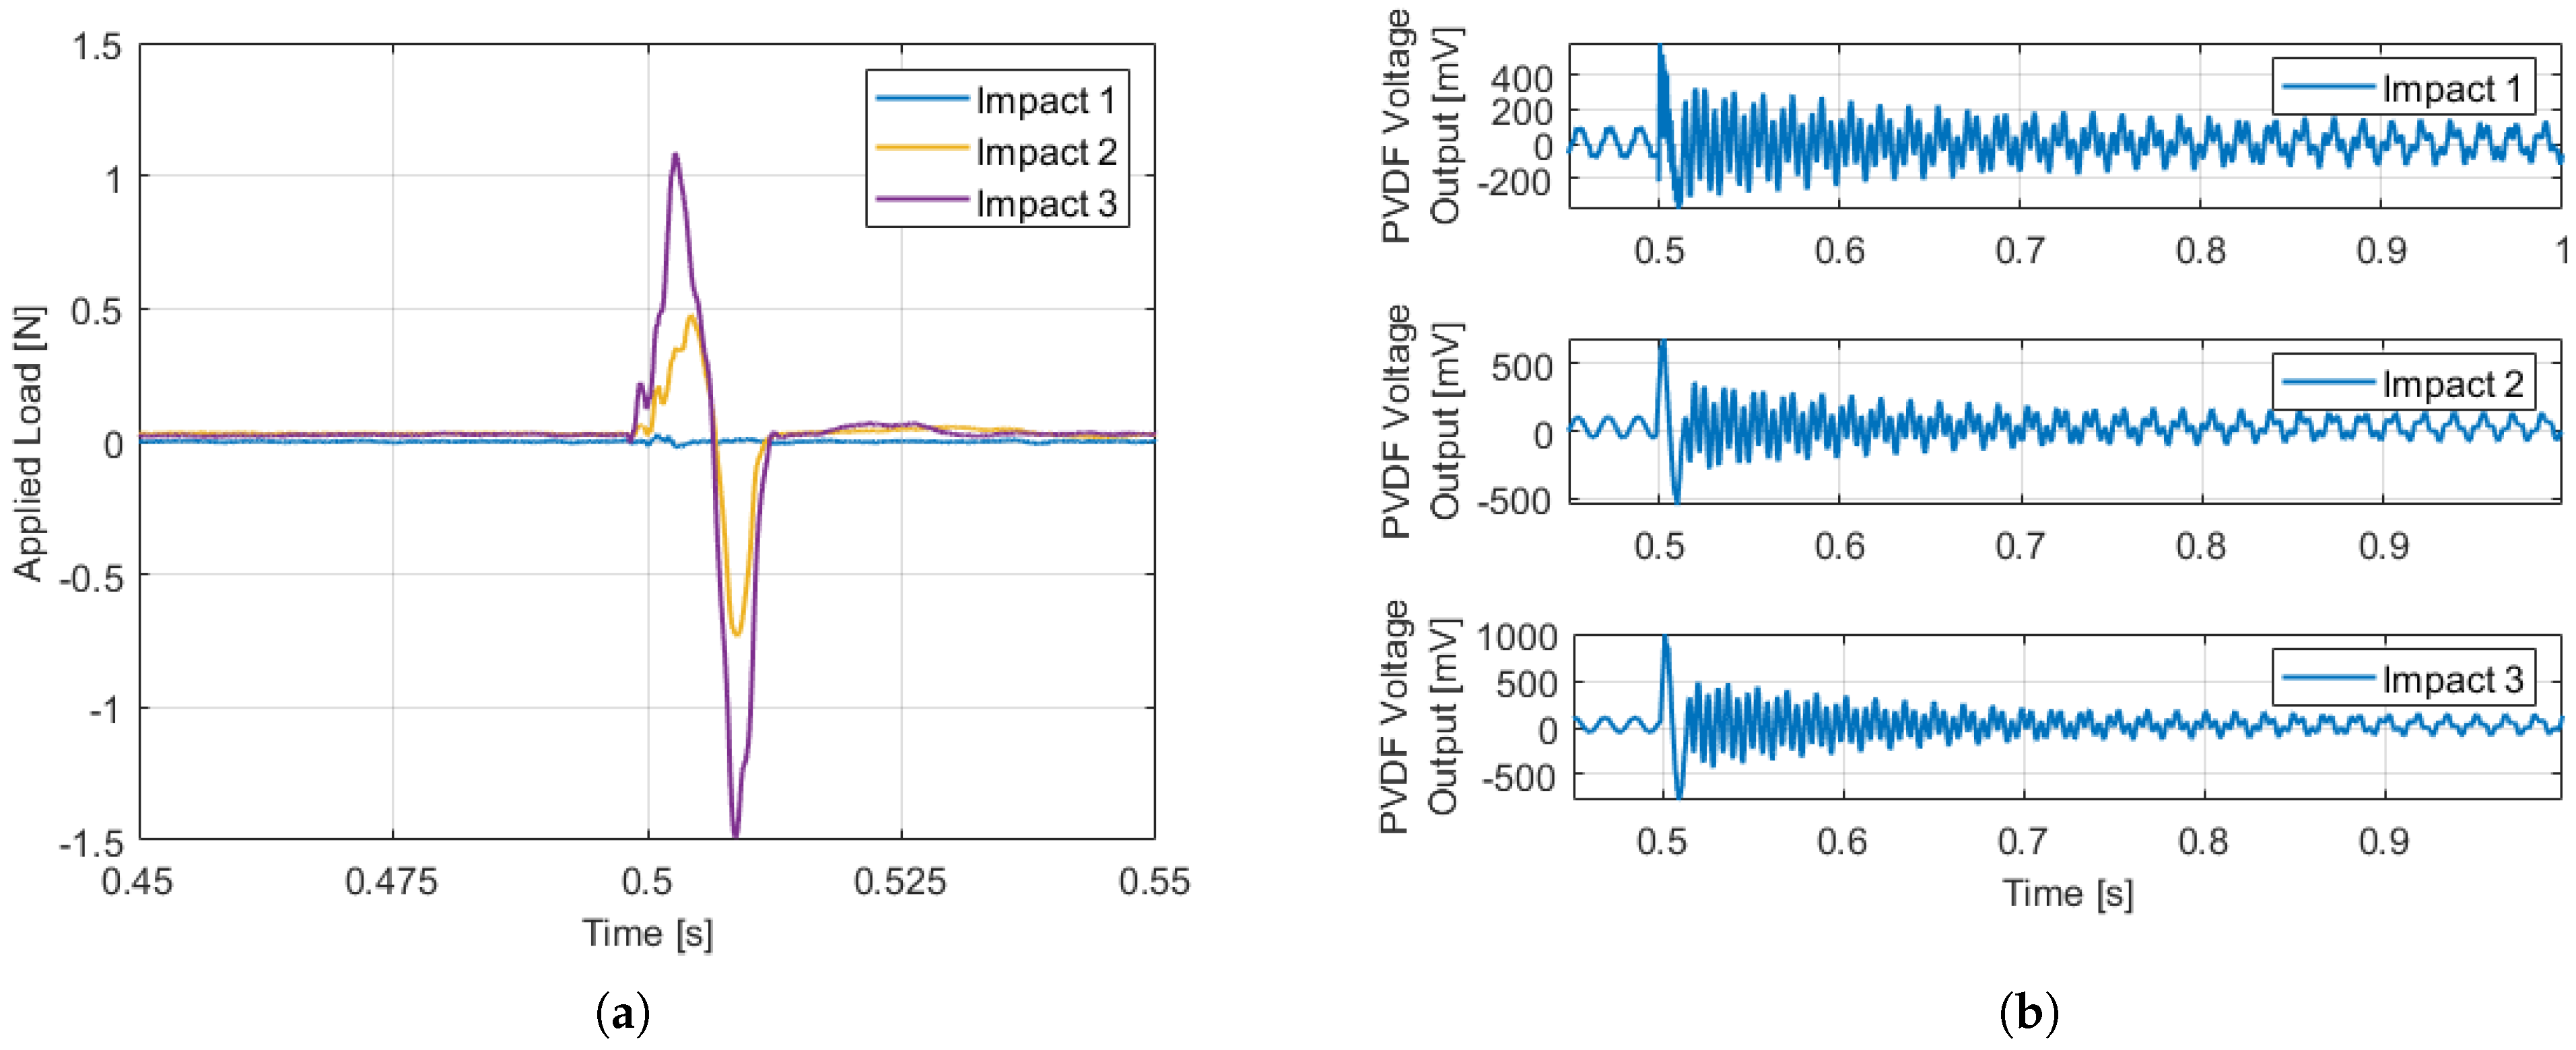
In order to evaluate the detection capability and repeatability of the embedded PVDF, three tests were conducted with varying load intensities. The amplitude of the impacts, which were approximately 0.3 N, 0.5 N, and 1 N (Figure 7a), were recorded and corresponding voltage outputs from the PVDF were obtained. Time series plots of the voltage outputs, shown in Figure 7b, align nicely with the impact loads. It is observed that the output voltage increases with the increase in load amplitude, thereby verifying the sensor’s sensing performance under different loading conditions.
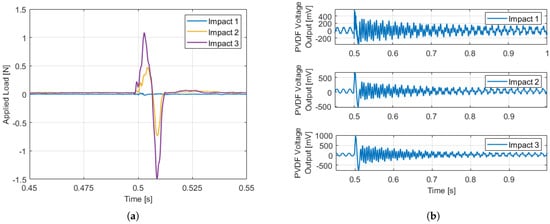
Figure 7.
(a) Amplitude of impact loads versus time for the three cantilever impact tests [47]. (b) Voltage output response of the embedded PVDF corresponding to impact forces [47].
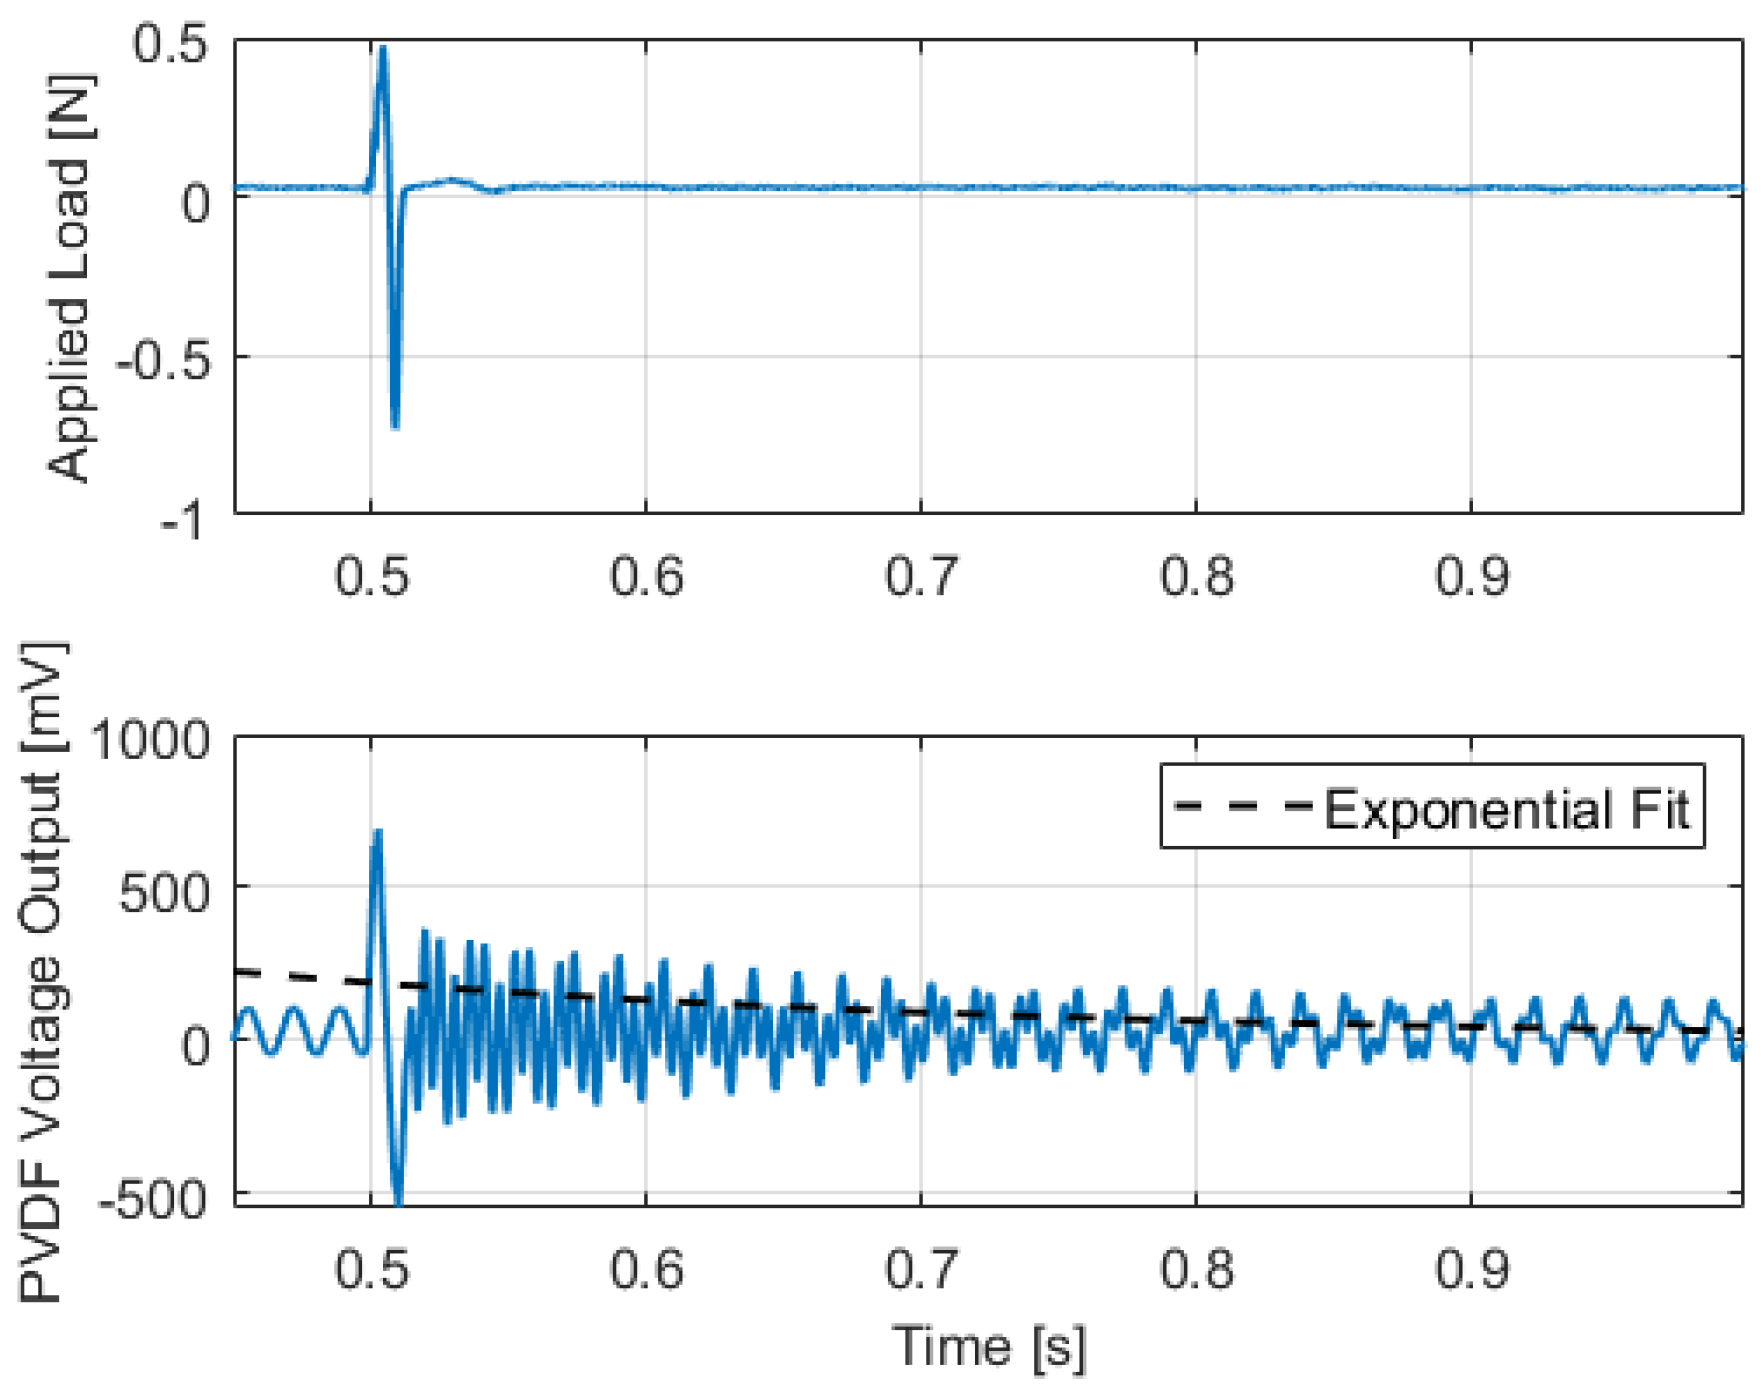
The voltage output of the embedded PVDF against the maximum impact force is shown in Figure 8. The decay in the signal confirms its localization performance, and an exponential fit was carried out using Equation (1), where represents the damping coefficient and fd represents the damped natural frequency. When is small, fd can be assumed to be equal to its natural frequency (fn = 533.3 Hz). The decay rate obtained was 0.13%, which indicates that the sensor can accurately detect impacts and localize their source.
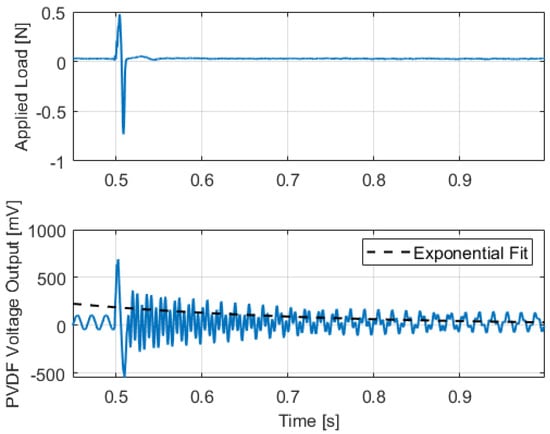
Figure 8.
Maximum PVDF voltage output against the second applied load exponentially fitted to obtain the decay rate [47].
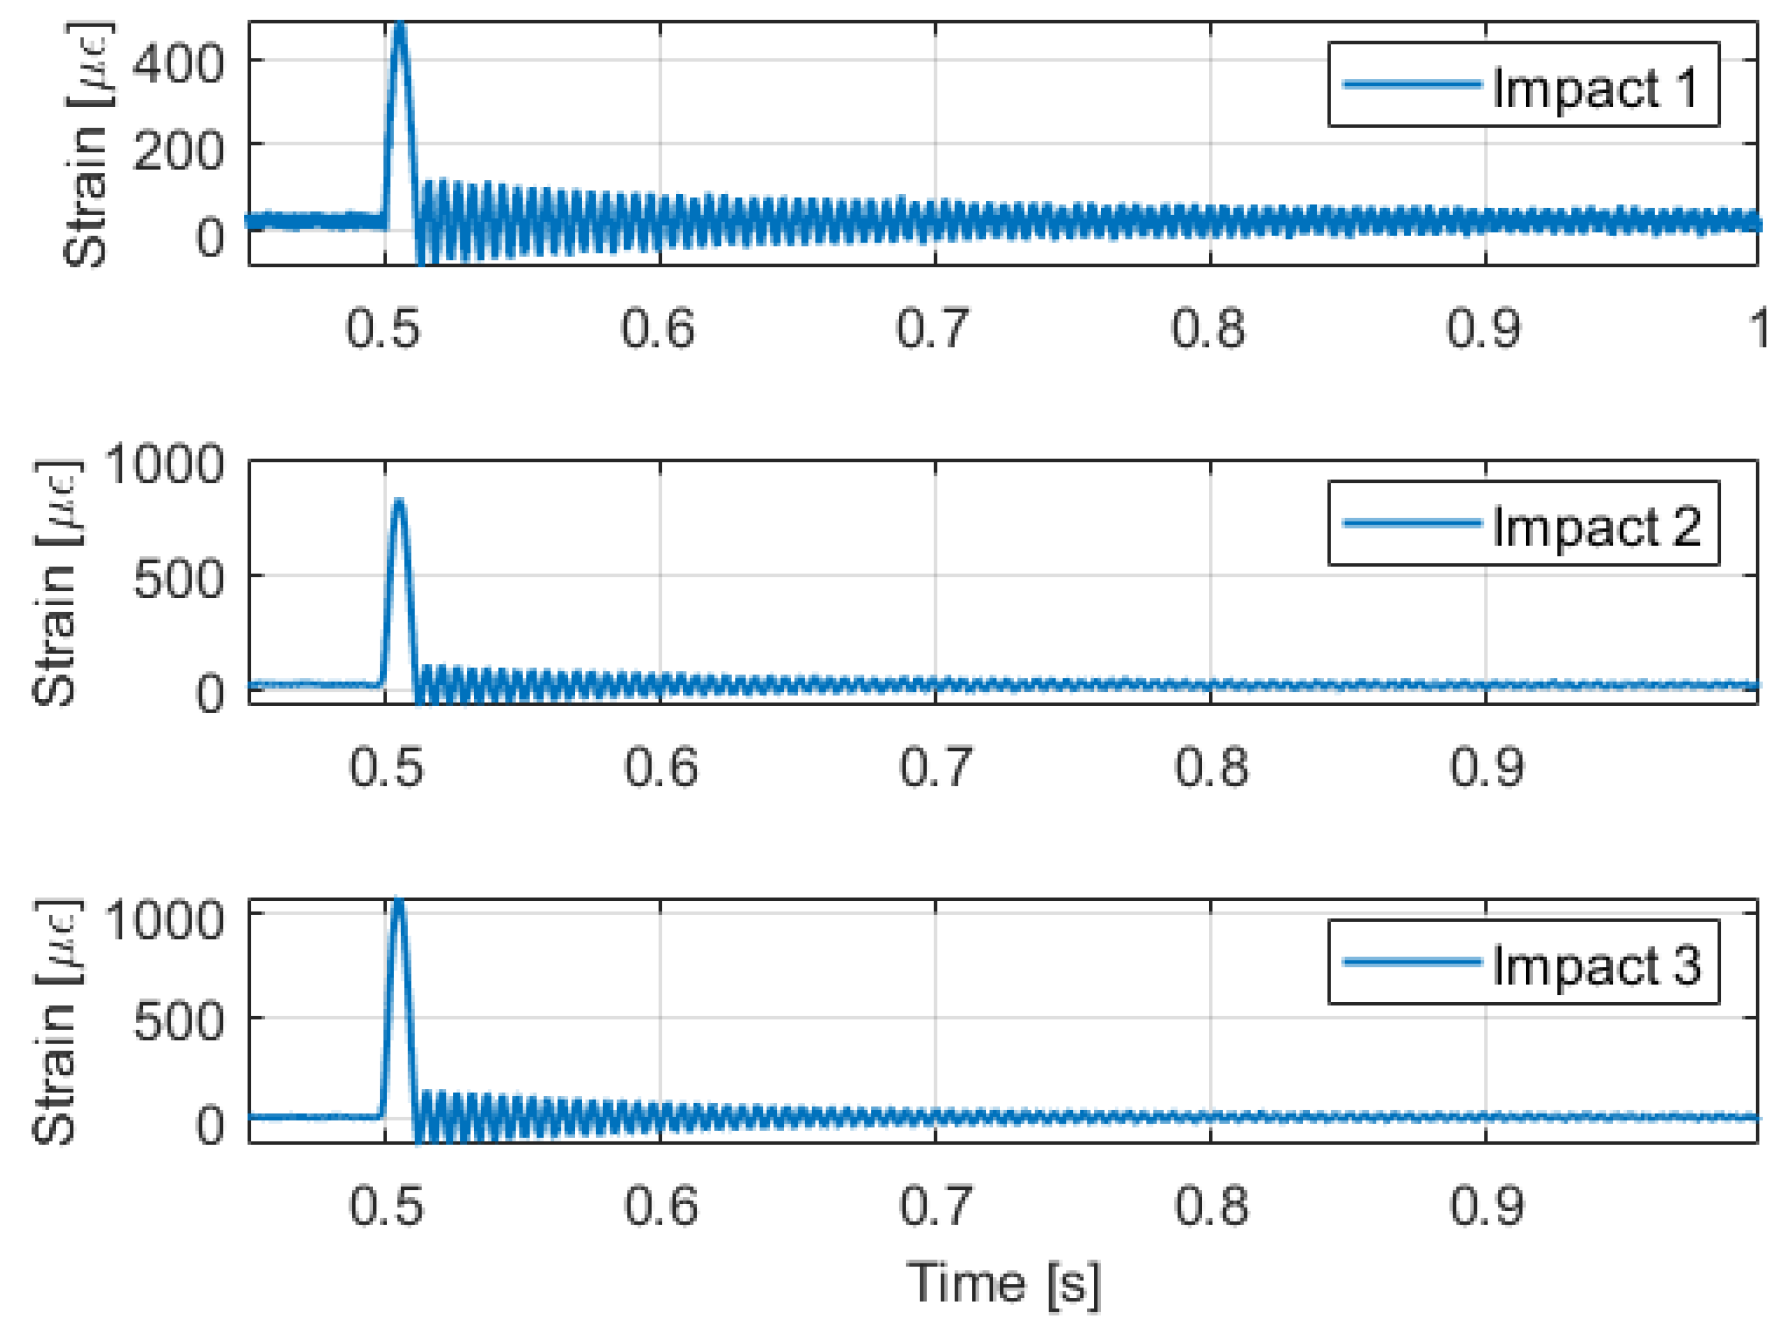
Furthermore, Figure 9 shows that the strain gauge output is consistent with the voltage data. As soon as the hammer strikes the specimen, a change in strain is detected. A small delay in the strain gauge signal is visible in comparison with the impact detected by the PVDF sensor, which is due to the size of the gauge. The strain gauge and PVDF sensor are both placed along the sample’s center, but the gauge is shorter. As a result, the leading edge of the PVDF senses the impact first, causing the delay.
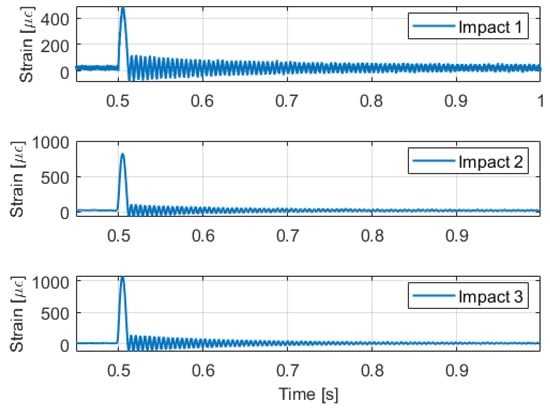
Figure 9.
Strain gauge output for the three cantilever impact tests [47].
3.3. Bending (Shaker) Tests
A Labworks shaker (ET 126-1 25 lbf) was employed to generate excitation in the specimen which was suspended using fishing lines from a support frame at the wire channel end. To avoid creating any moments in the horizontally aligned shaker, a 150 mm long 6061 aluminum rod with a 6-32 thread was used as a stinger. A clamp was fabricated using an Ultimaker S5 and PLA material to hold the sample in place. The clamp was carefully designed with a snug fit to ensure a tight grip and prevent slipping of the sample during shaker excitation. The connections were made as explained previously and an oscilloscope was used to record data.
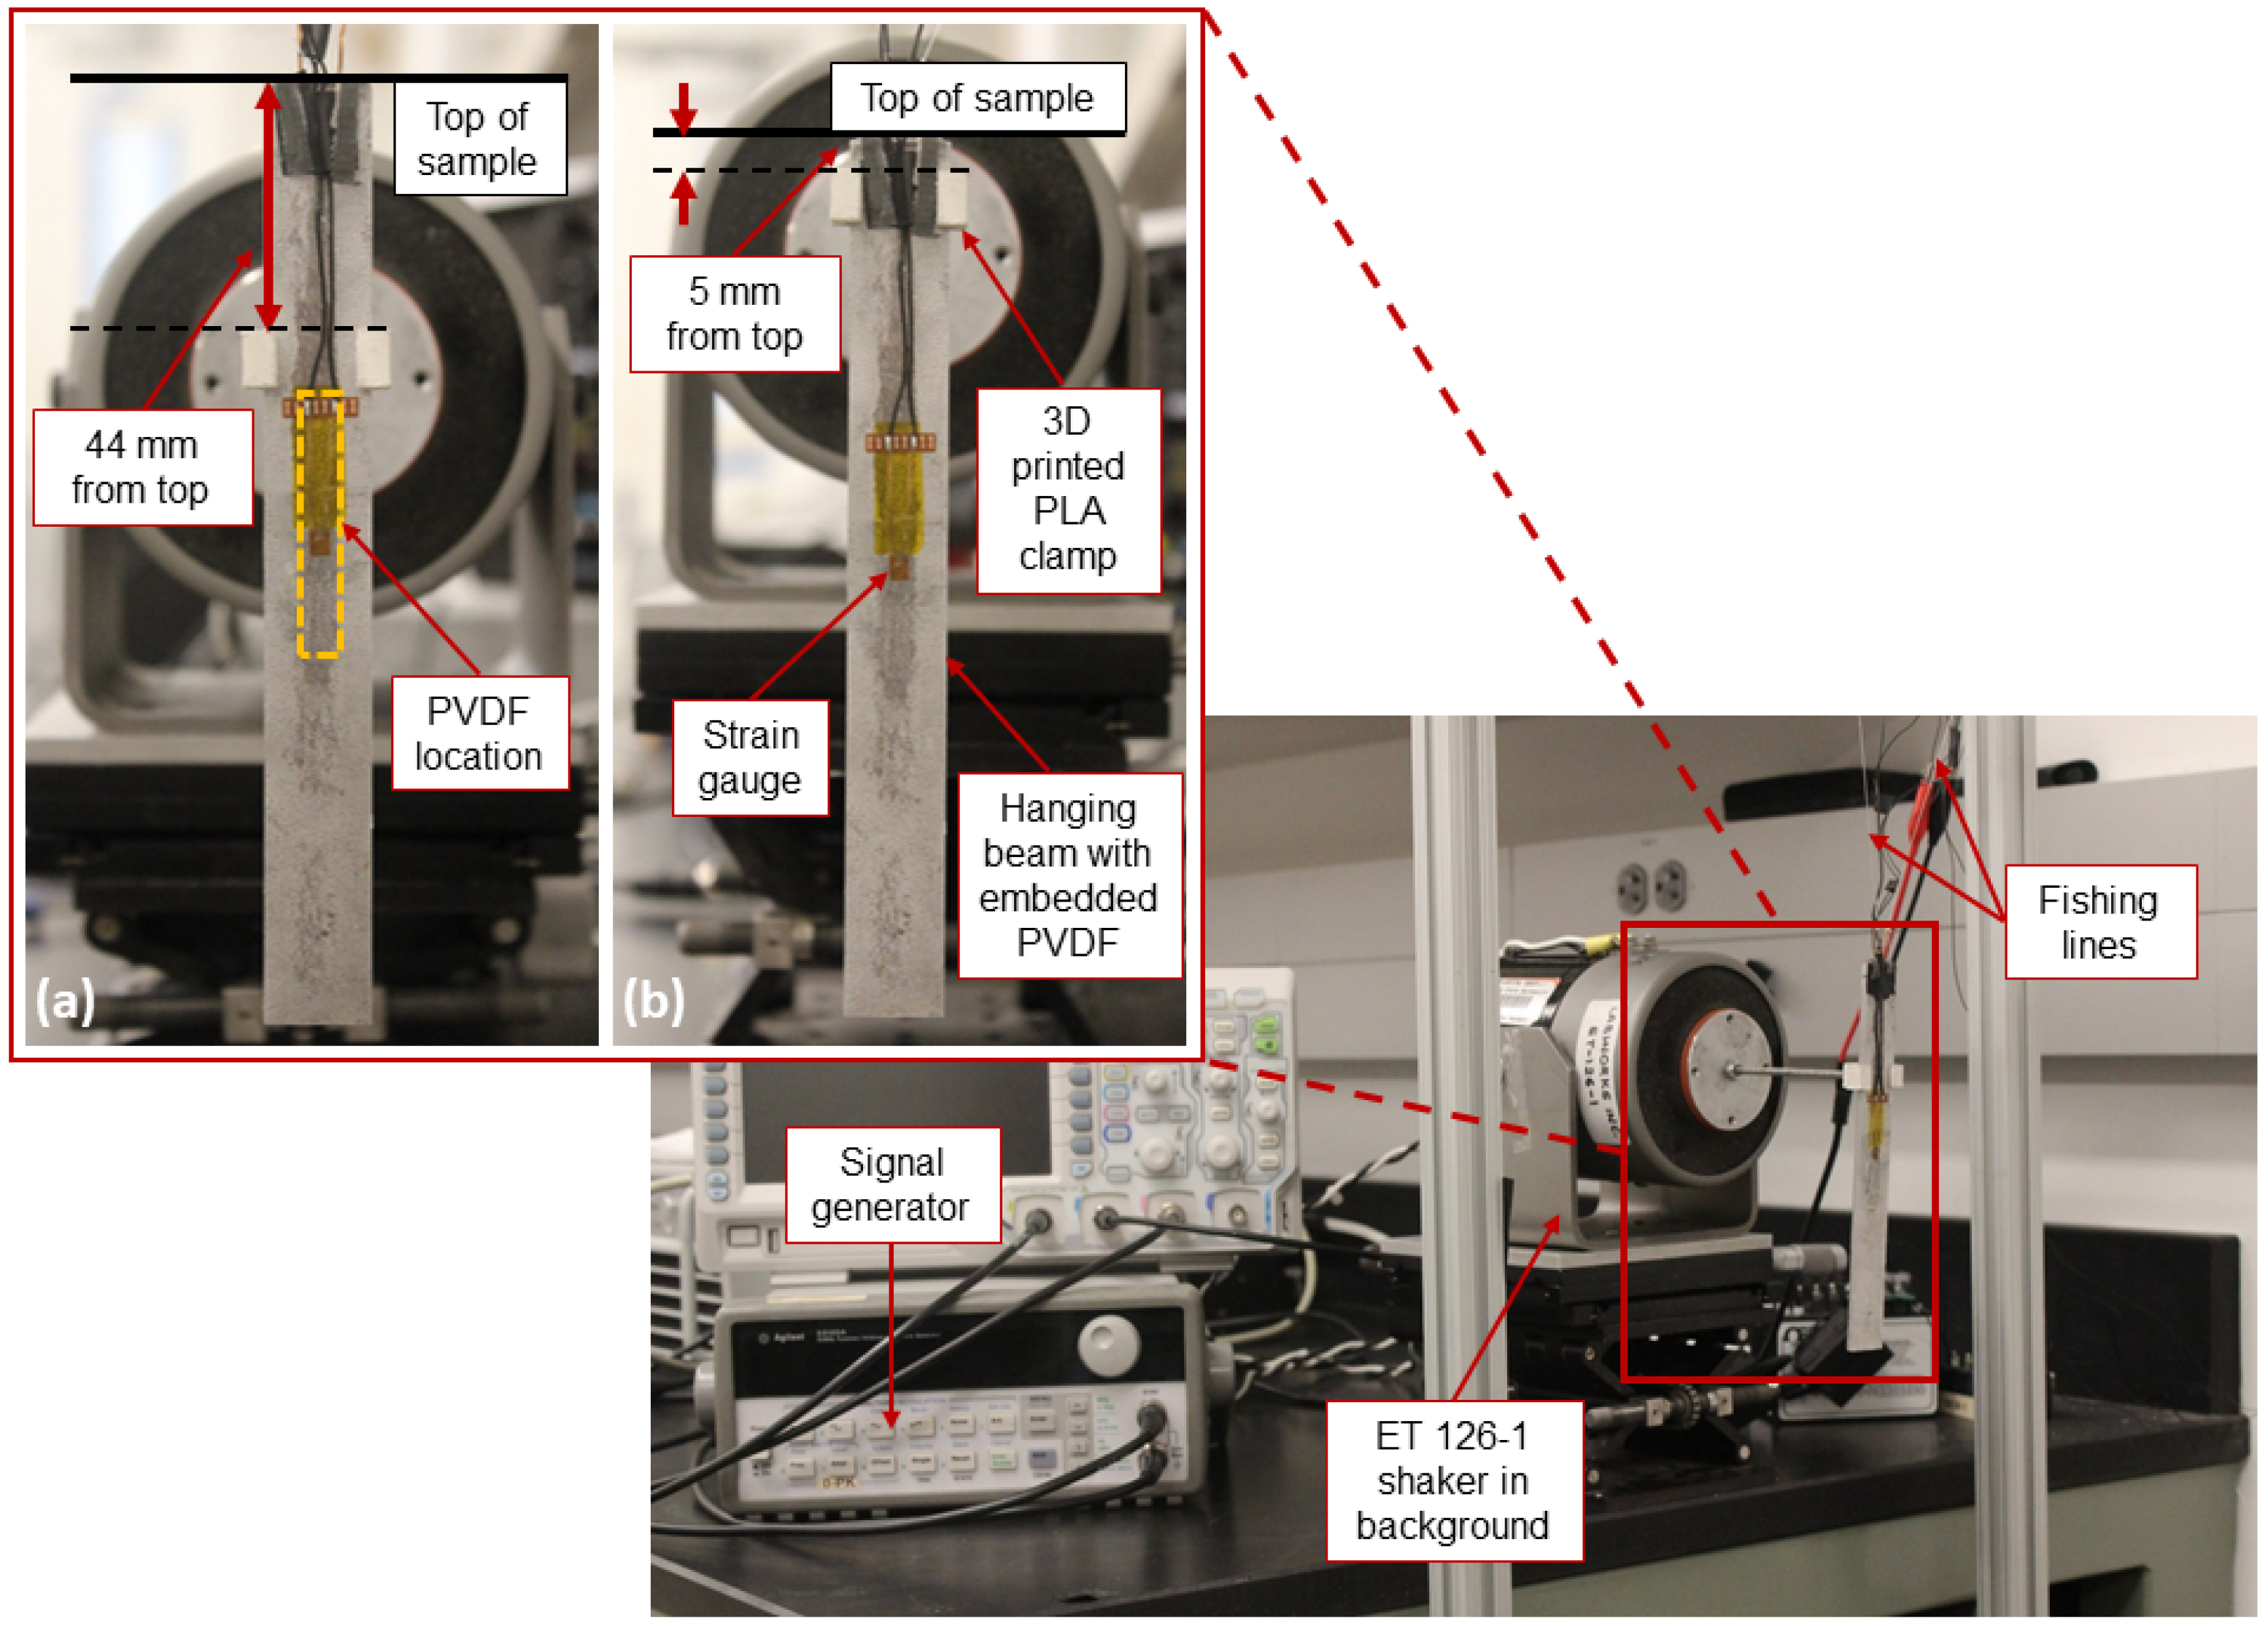
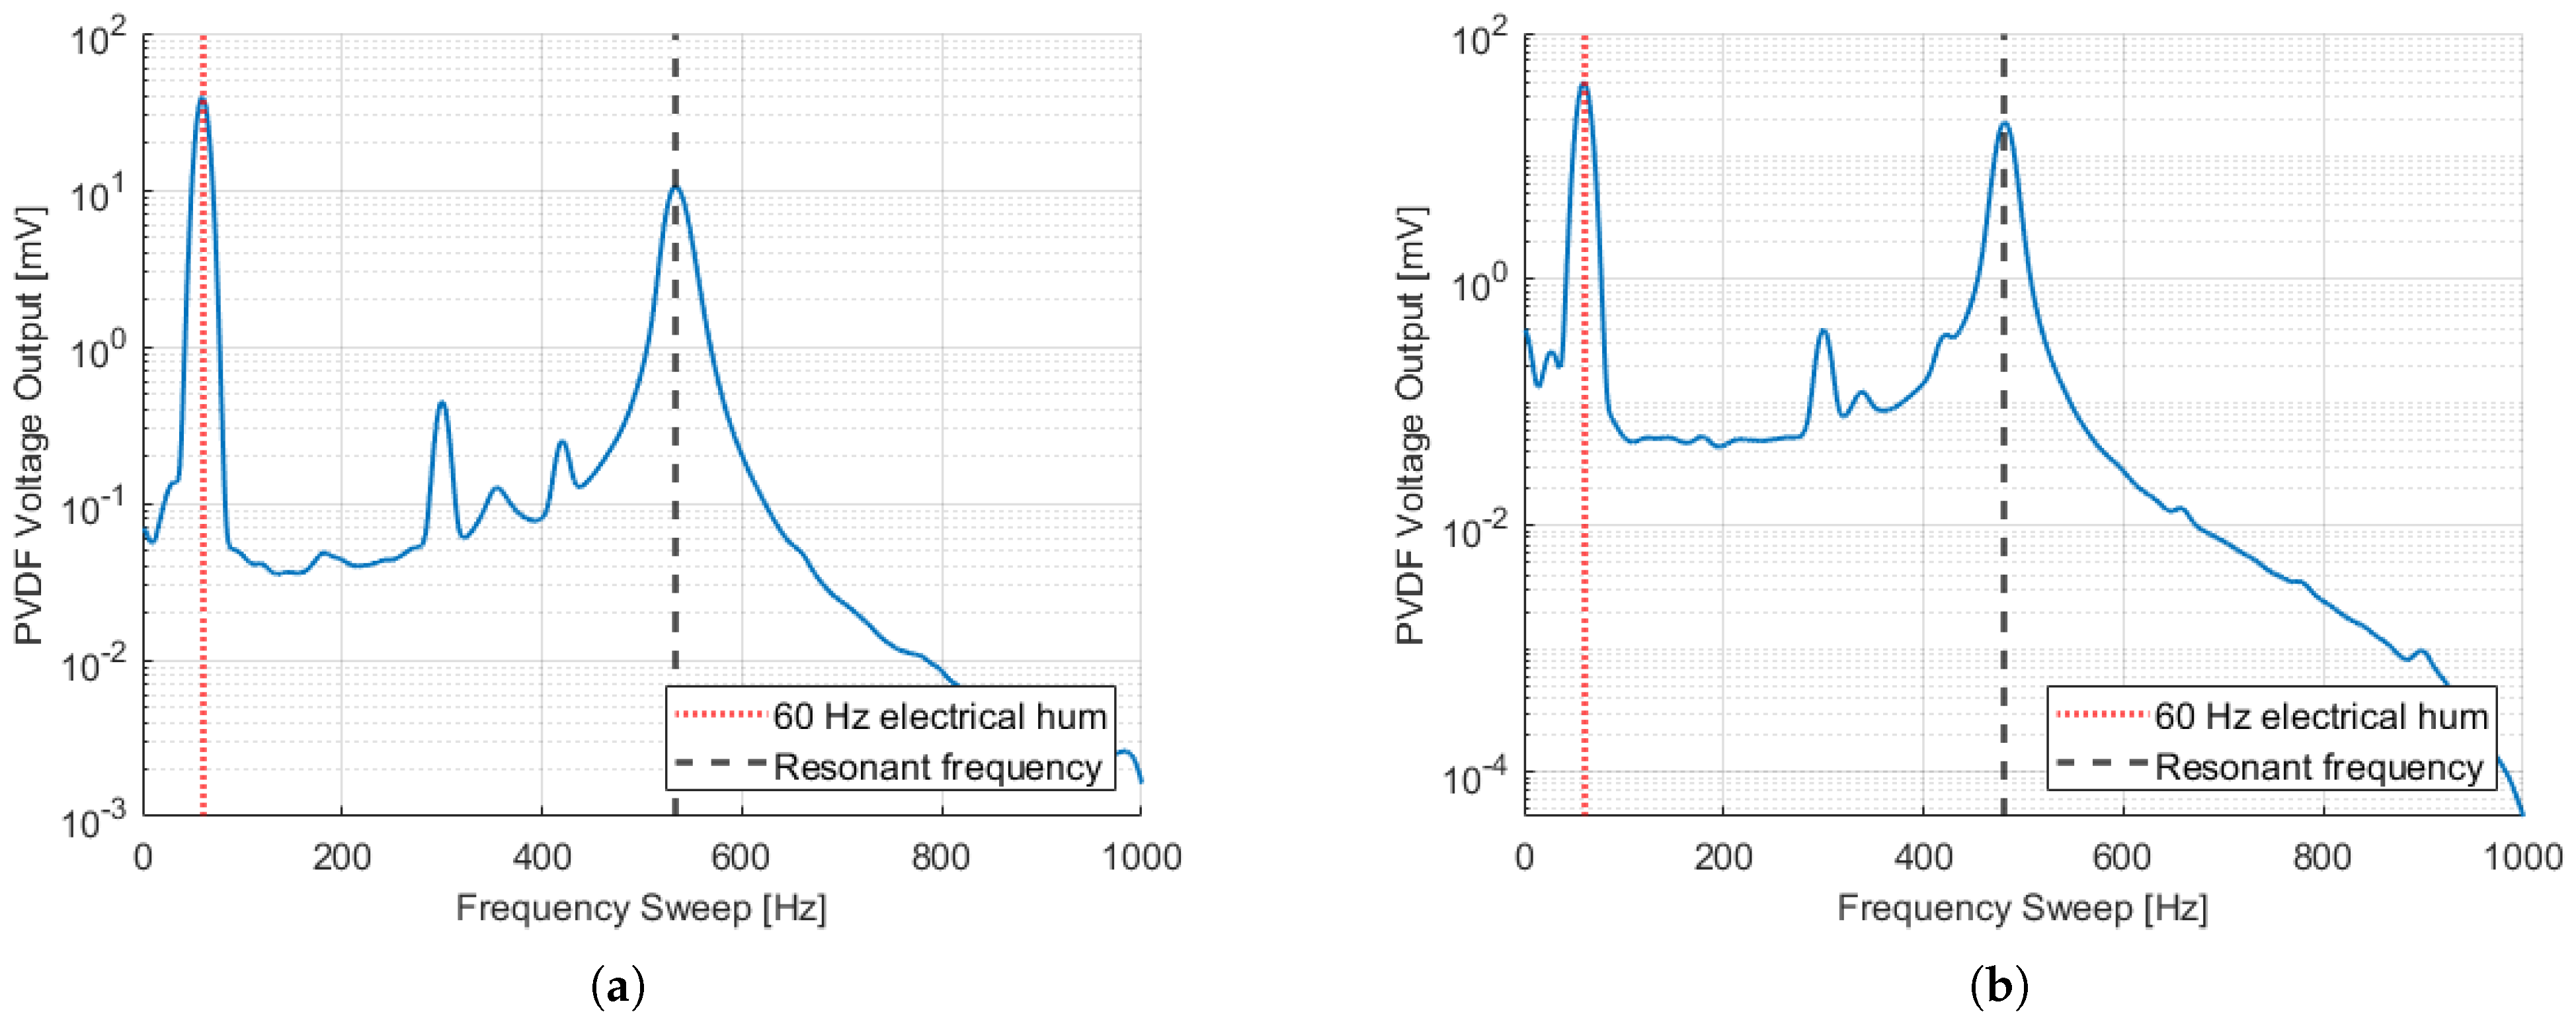
In order to investigate the sensor’s voltage output under bending conditions, the clamp on the sample was positioned at two different locations, 44 mm and 5 mm from the top, as illustrated in Figure 10. A frequency sweep was carried out from 1 Hz to 1 kHz with an applied input of 10 V, and the voltage output from the sensor was recorded. The power spectrum of the voltage output data is presented in Figure 11 and the resonance frequencies were found to be 533.33 Hz and 481.35 Hz for clamp positions 1 (Figure 11a) and 2 (Figure 11b), respectively. Both plots exhibit a peak at 60 Hz which was identified as electrical noise in the data. The results from both positions were similar, with only a decrease in resonance frequency from position 1 to position 2, attributable to the increase in the effective length of the vibrating beam.
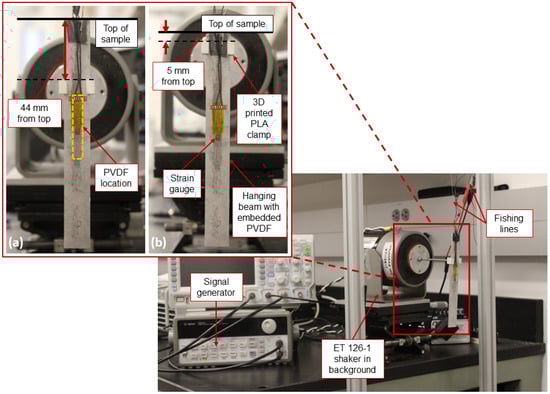
Figure 10.
Bending (shaker) test setup: (a) beam gripped 44 mm from the top, (b) beam gripped 5 mm from the top.
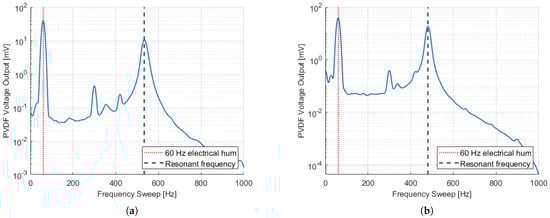
Figure 11.
Voltage output for frequency sweep from 1 Hz to 1 kHz: (a) beam gripped 44 mm from the top, (b) beam gripped 5 mm from the top [47].
To validate the beam’s resonant frequencies, a simplified Euler–Bernoulli two-span beam model with free-pinned-free support was used to calculate the natural frequency of the beam for both clamping positions. The model was based on several assumptions, including the assumption that the beam was linear, uniform, homogeneous, and isotropic elastic, and was isolated from the setup; the stinger rod’s mass was considered negligible and thus did not affect the calculations; the clamp attaching the stinger to the beam was assumed to be a pinned support at that position without affecting the beam’s overall behavior; the beam’s properties were assumed to be Al 6061-T6, without considering any differences due to 6061-H18 and 6061-T4 foils; the machined pocket for PVDF embedment was considered a regular rectangular-shaped slot, and the area moment of inertia was calculated using the depth of the deepest pocket. Finally, the stiffnesses of the PVDF sensor and surface strain sensor were assumed to be very low compared with the beam and did not significantly contribute to the overall natural frequency.
Thus, the natural frequency was calculated using the formula presented by Blevins [49] where E = elastic modulus of Al 6061-T6, I = second area moment of inertia, = density of Al 6061-T6, A = area of beam cross-section, L = characteristic length of the beam, and is a dimensionless parameter (eigenvalue) which is a function of the boundary conditions ( corresponds to the first vibrational mode based on the length ratio of both spans given by Blevins [49]).
By applying the parameters given in Table 2 and replacing them in Equation (2), the calculated natural frequencies are = 558.7 Hz and = 509.1 Hz for clamp positions 1 and 2, respectively.
Table 2.
Beam parameters for natural frequency calculation.
Mode shapes of the two-span beams can be calculated using [49]:
where a = location of the pinned joint on the beam, and
The percentage errors of 4.76% and 5.77% relative to the experimental measurements for clamp positions 1 and 2, respectively, can be attributed to several assumptions made during the calculation process, such as ignoring the embedded sensor and internal features of the beam, the wires for the PVDF sensor extending from the sample, and the non-pin joint attachment of the stinger to the beam.
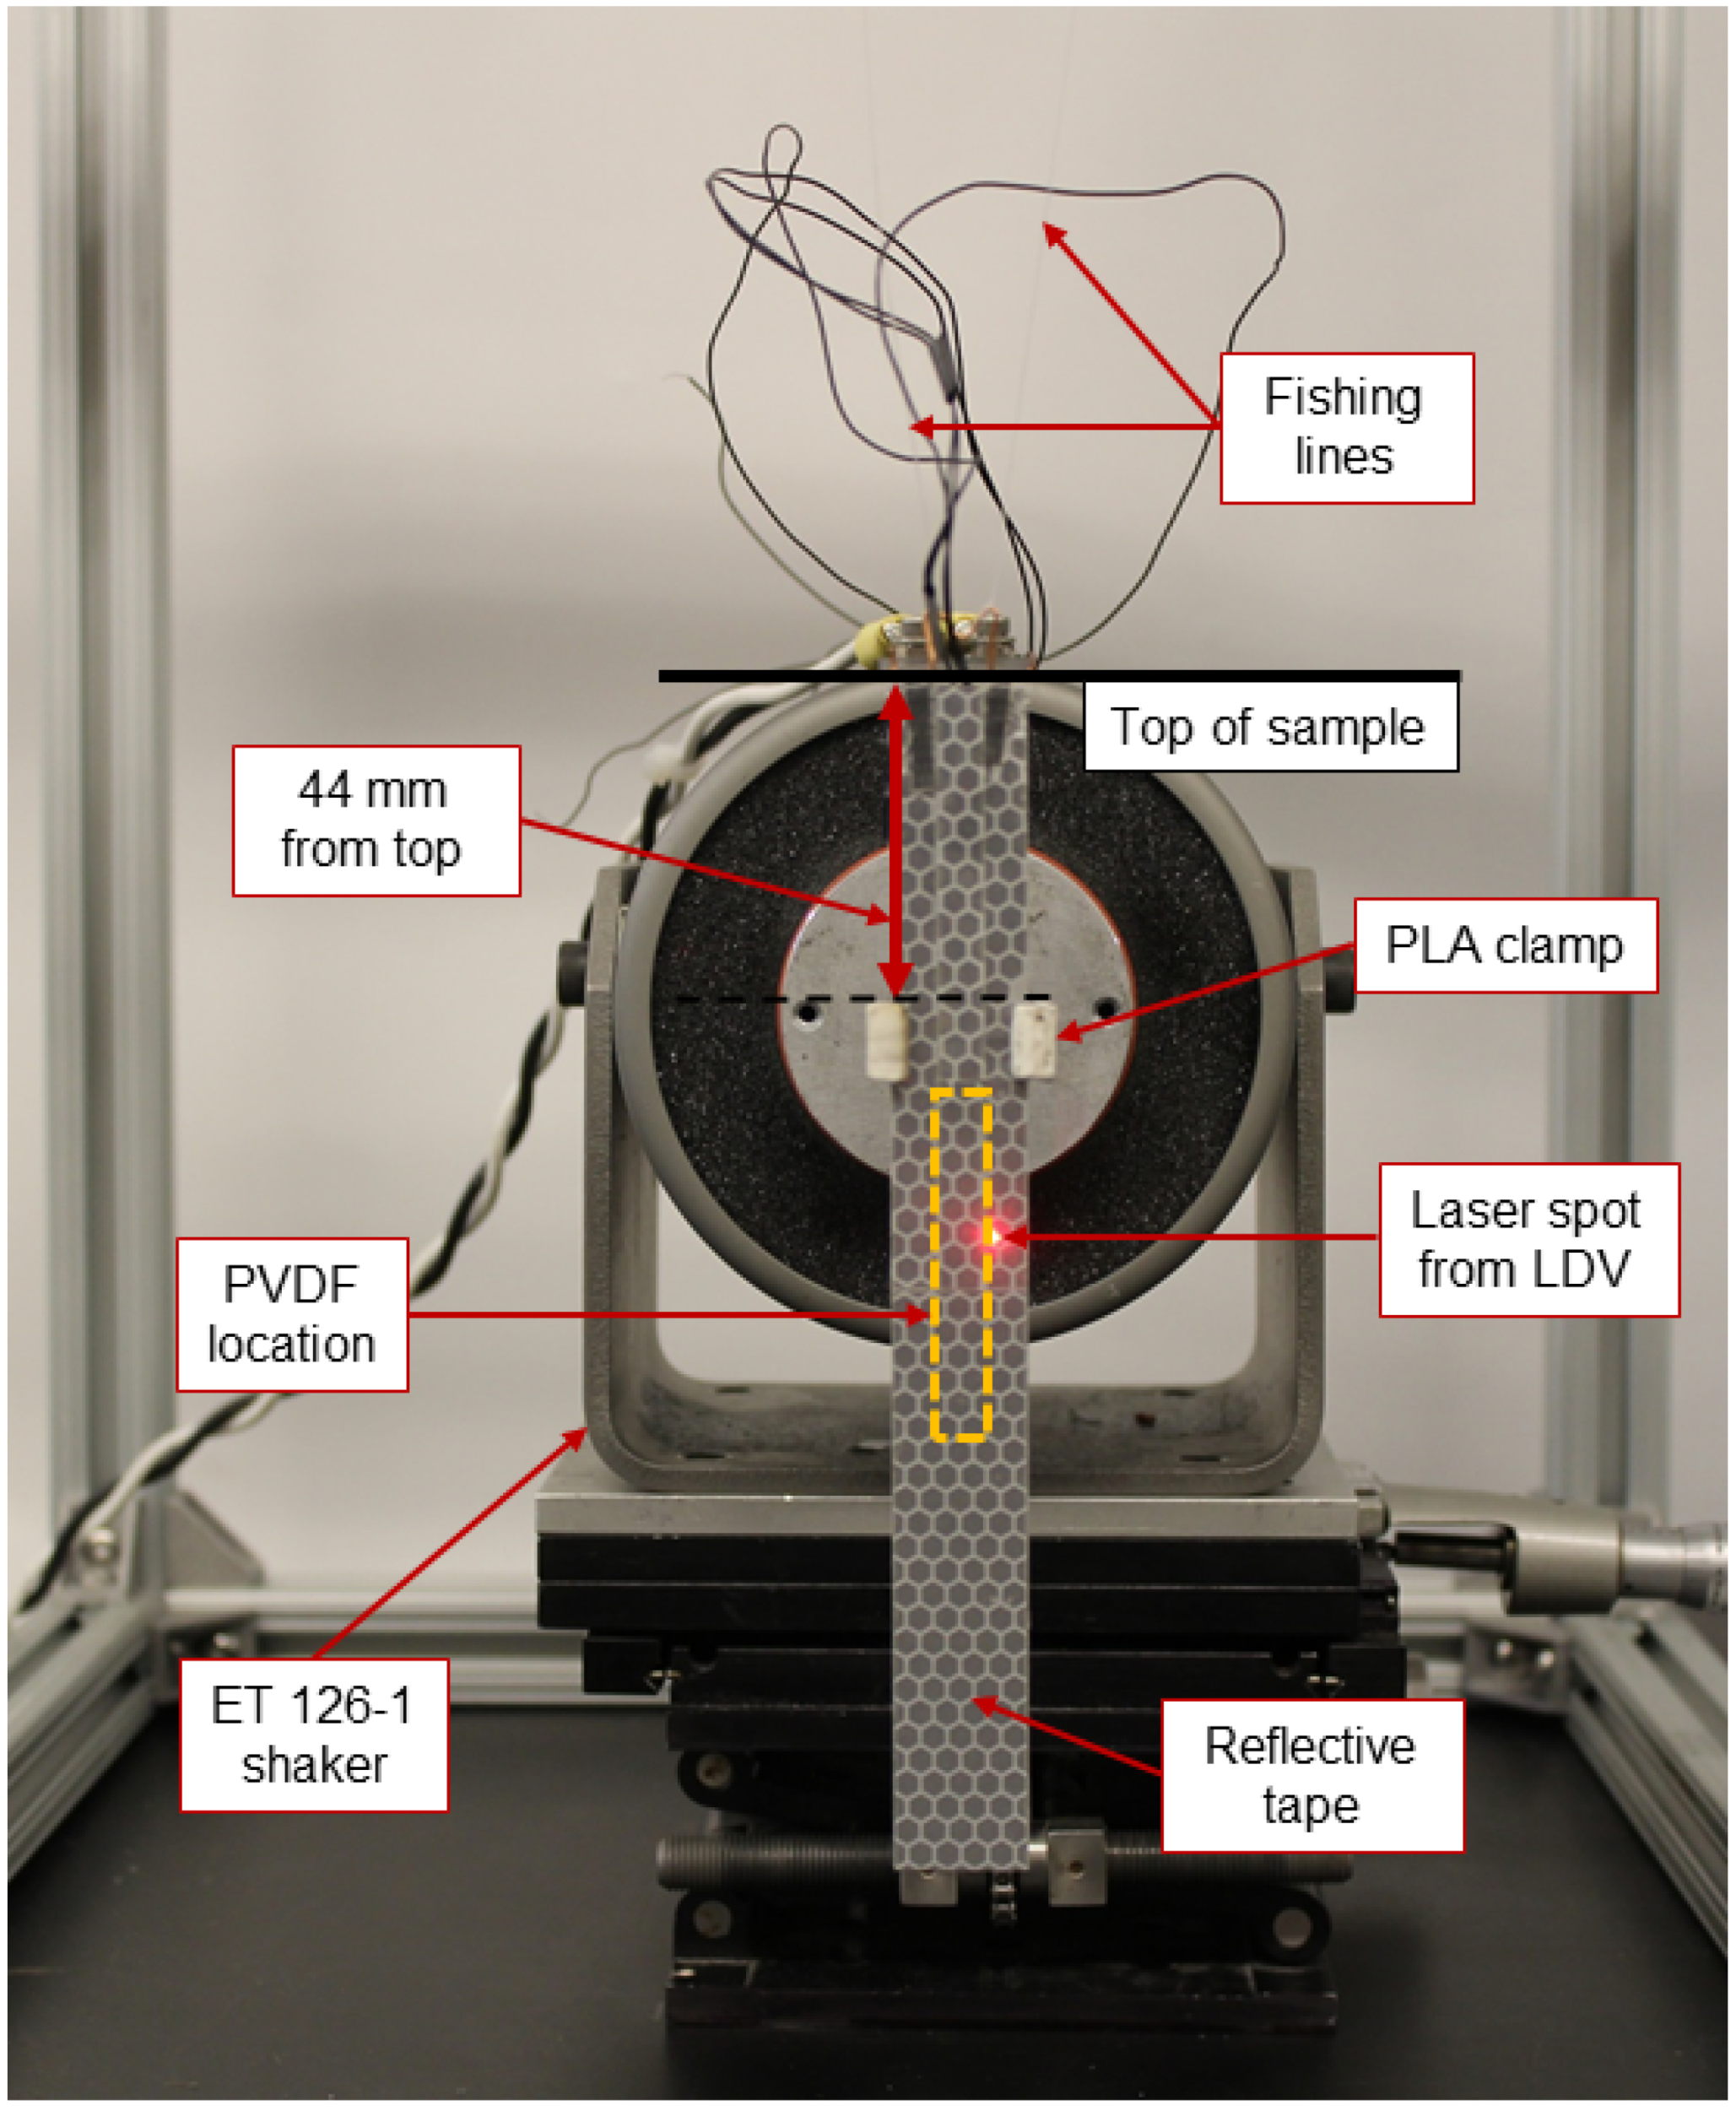
Further validation for the resonant frequencies was performed using a laser doppler vibrometer (LDV). A pure aluminum beam without any cavity was used as a reference to calibrate the equipment’s measurement capability. A reflective tape was used over the beam for precise measurements in both 44 mm and 5 mm positions. Figure 12 shows this setup and Table 3 summarizes the frequencies obtained in each case.
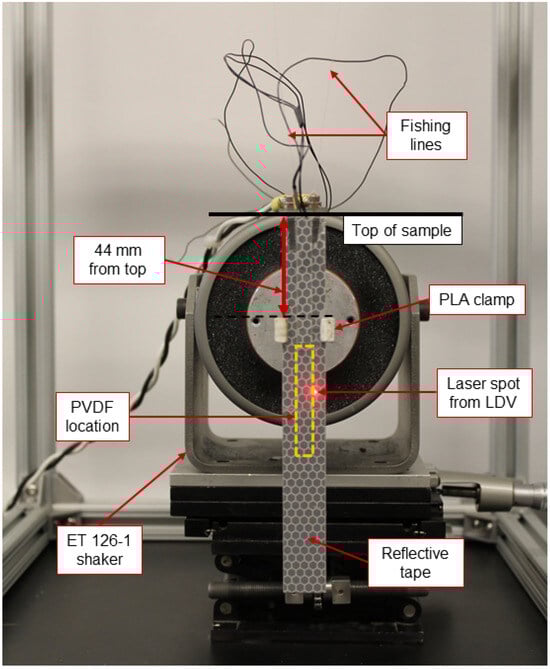
Figure 12.
Bending shaker test performed using laser doppler vibrometer (LDV). Sample is covered with reflective tape. Only the 44 mm position case is shown here.
Table 3.
Summary of resonant frequencies obtained via various methodologies for both embedded PVDF and pure aluminum beams.
As can be seen in Table 3, the frequencies obtained from the LDV are in good agreement with the other calculated frequencies. The percentage error of the LDV reported frequencies relative to the experimental measurements is less in comparison to the error in Blevin’s reported frequencies by 2.45% and 0.59% for clamp positions 1 and 2, respectively. This slight error is due to the experimental imperfections in setting up the equipment and acquiring measurements.
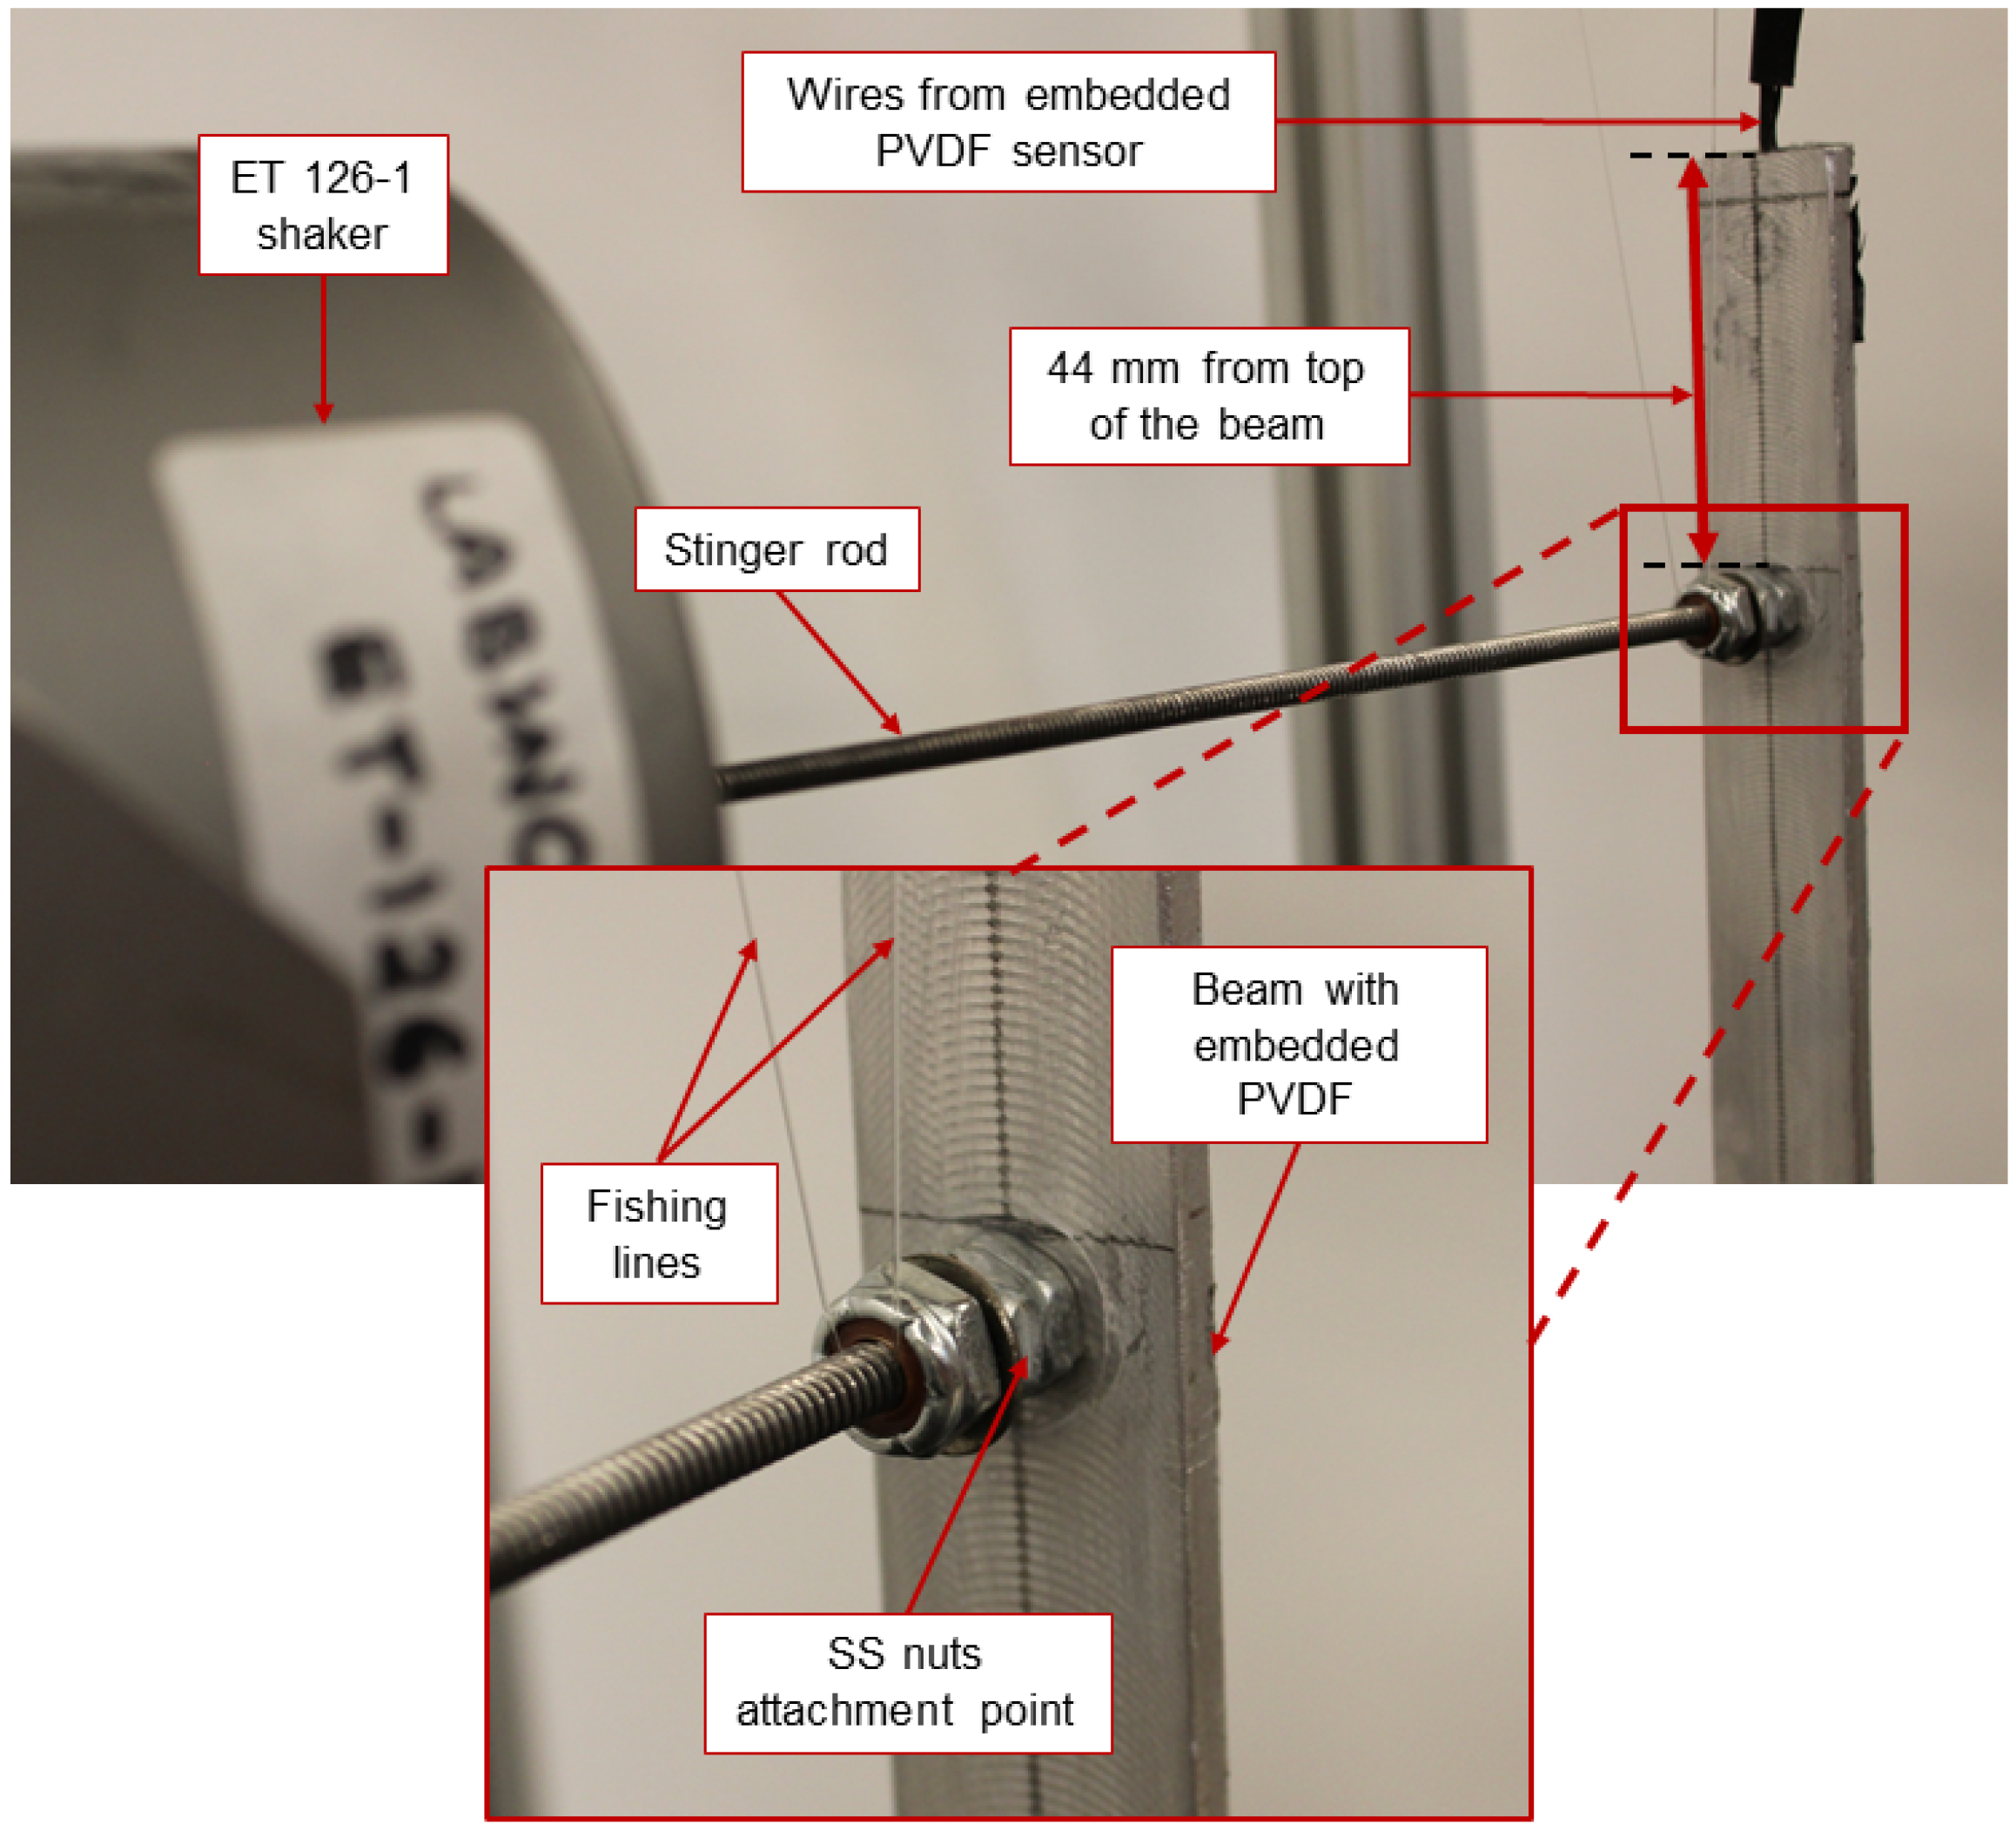
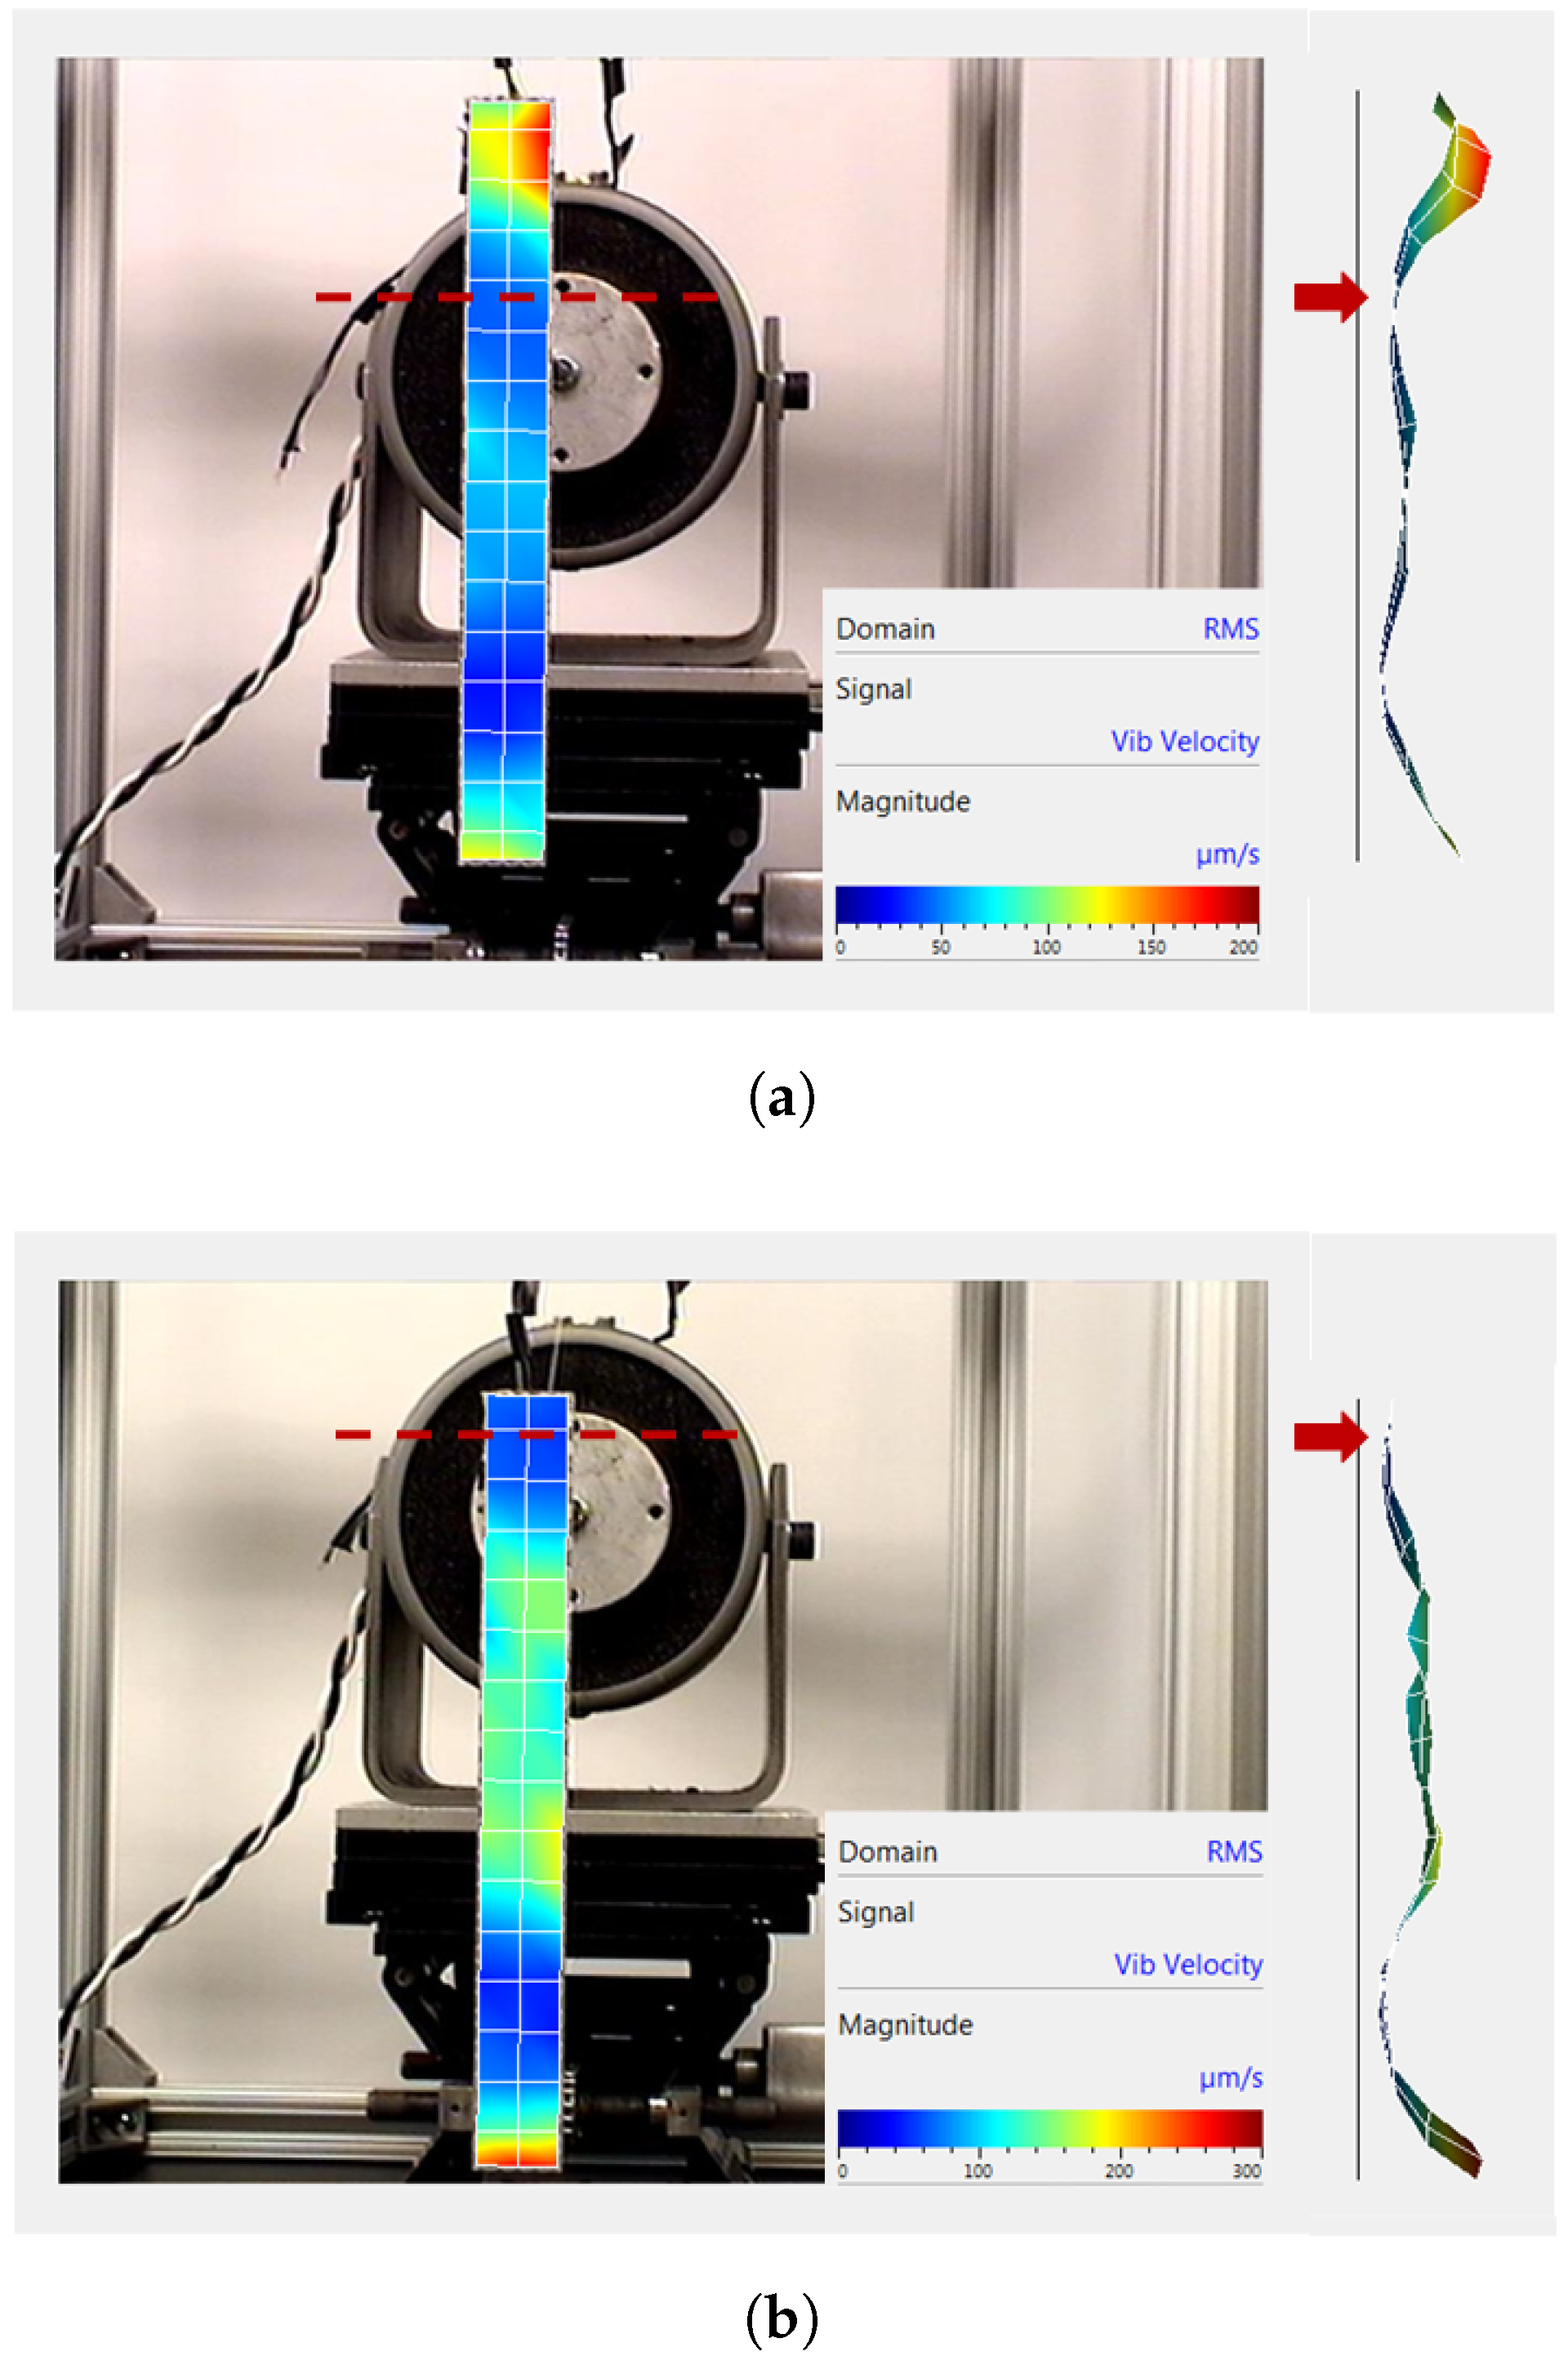
To validate the resonant frequency results and obtain mode shapes for the sample using the LDV, we used a pure aluminum beam of the same dimensions without the sensor cavity. Since the clamp was 3D-printed and manufactured from a compliant material (PLA), repeated experiments caused distortion in its shape. To avoid inconsistencies arising from this connection, the clamp was replaced with two stainless steel (SS) nuts bonded to the beam to make it more rigid and minimize any torsional modes due to compliance (Figure 13). The beam was suspended from the stinger rod in this configuration and looped around the stinger rod, right where the nuts were bonded to negate any moments due to the weight of the beam. Correspondingly, mode shapes were obtained for both the positions, and can be seen in Figure 14a,b. It can be observed that between the positions, there is more bend across the embedded sensor region in the 5 mm clamped position. This means that the 5 mm clamping point from the top of the beam is more beneficial in comparison with the 44 mm clamping point since more bend leads to more strain in the embedded PVDF sensor, which corresponds to more power output. This can also be verified from Figure 11, where the amplitude of power output in Figure 11b is more (18.85 mV) than that in Figure 11a (10.49 mV), in logarithmic scale.

Figure 13.
SS nuts bonded to the back of the beam, replacing the PLA clamp.
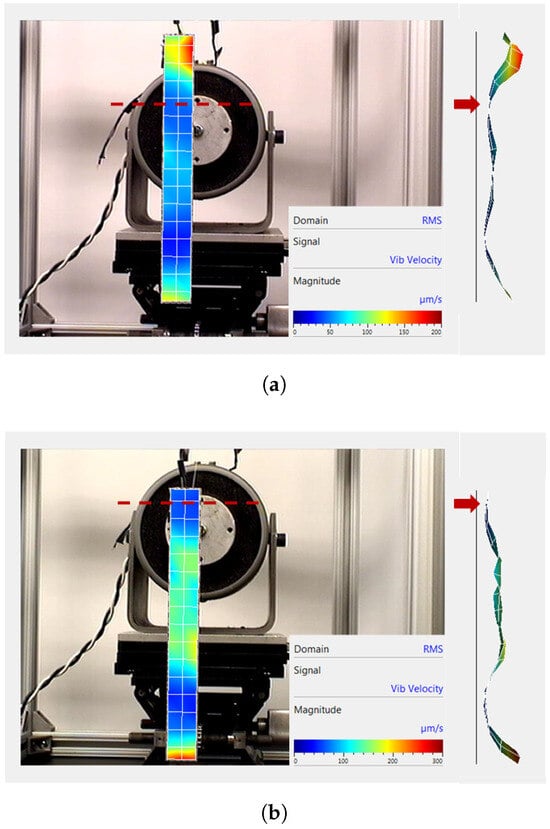
Figure 14.
Mode shapes obtained from the LDV. The dotted line and arrow indicate the stinger attachment point referenced from the top of the beam, and color indicates the measured vibration velocity at an amplitude of 0.5 V. (a) Front and side views for the 44 mm pinned location. (b) Front and side views for the 5 mm pinned location.
Figure 14 shows the mode shapes at the fundamental frequencies of = 565.31 Hz and = 508.13 Hz for pinned positions 1 and 2, respectively, which agree with what was obtained from Blevin’s Equation (2) for the two-span free-pinned-free beam model. It can be seen from the side view that there was some twisting around the vertical axis due to physical imperfections, which contributes to the slight discrepancies in frequencies obtained from theoretical models and experiments.
Nonetheless, the natural frequencies are in good agreement with the experimental resonances and the maximum voltage output of the embedded PVDF [50], thereby validating the sensing capability of the embedded sensor for dynamic bending cases. Therefore, these results demonstrate the potential for using UAM-embedded PVDF sensors in practical applications including impact detection, vibration sensing for active vibration control systems, and non-destructive evaluation for structural health monitoring purposes.
4. Concluding Remarks
This paper presents an investigation into the sensing capabilities of an embedded PVDF sensor through experimental characterization to outline its functional performance. A process for embedding the piezoelectric sensor in an aluminum structure using ultrasonic additive manufacturing (UAM) is described. The sensor is placed in a machined pocket and aluminum foils are welded over the top, compressing the sensor to enhance its mechanical coupling with the metal matrix. The fabricated sample is subjected to impact and bending tests, and the performance of the embedded sensor is analyzed. The sensor exhibits a sensitivity of 43.7 mV/N under axial impact loading ( mode) with high linearity. Furthermore, the mode of the cantilever configuration shows a steady decay rate of 0.13% upon impact. Bending tests using a shaker exhibit a maximum voltage output from the PVDF under resonance of the beam, demonstrating the sensor’s effectiveness in structural vibration monitoring. Additionally, the experimental and theoretical natural frequencies show good agreement with less than 6% error for both the 44 mm and 5 mm clamping positions referenced from the top of the sample. The fabrication methodology for embedding active materials has potential for applications in tactile sensing and structural health monitoring, and provides opportunities for future work in intelligent adaptive systems. This study helps to characterize and validate the efficacy of embedded PVDF sensors in metals and allows for broader applications in a variety of industries such as the automotive industry, the aerospace industry, etc., where they can be utilized within structures for damage detection, fatigue monitoring, vibration mitigation, controlling stress concentration, and other applications.
Supplementary Materials
The following supporting information can be downloaded at: https://www.mdpi.com/article/10.3390/act12110428/s1, Figure S1: Schematic top view of the axial impact test.
Author Contributions
Methodology, L.M.H. and M.J.D.; Formal analysis, M.M.K., L.M.H. and M.J.D.; Investigation, M.M.K. and L.M.H.; Writing—original draft, M.M.K.; Writing—review and editing, L.M.H. and M.J.D.; Supervision, L.M.H. and M.J.D.; Funding acquisition, M.J.D. All authors have read and agreed to the published version of the manuscript.
Funding
We wish to acknowledge the member organizations of the Smart Vehicle Concepts Center, a Phase III National Science Foundation Industry-University Cooperative Research Center under grant NSF IIP 1738723 (http://www.SmartVehicleCenter.org, accessed on 1 September 2023). Any opinions, findings, conclusions, or recommendations expressed in this material are those of the authors and do not necessarily reflect the views of the National Science Foundation.
Data Availability Statement
Data are contained within the article.
Conflicts of Interest
The authors declare no conflict of interest.
References
- Chakraborty, J.; Katunin, A.; Klikowicz, P.; Salamak, M. Early crack detection of reinforced concrete structure using embedded sensors. Sensors 2019, 19, 3879. [Google Scholar] [CrossRef] [PubMed]
- Gkantou, M.; Muradov, M.; Kamaris, G.S.; Hashim, K.; Atherton, W.; Kot, P. Novel electromagnetic sensors embedded in reinforced concrete beams for crack detection. Sensors 2019, 19, 5175. [Google Scholar] [CrossRef]
- Issa, M.E.; Helmi, A.M.; Al-Qaness, M.A.A.; Dahou, A.; Abd Elaziz, M.; Damaševičius, R. Human activity recognition based on embedded sensor data fusion for the internet of healthcare things. Healthcare 2022, 10, 1084. [Google Scholar] [CrossRef] [PubMed]
- Weiner, P.; Neef, C.; Shibata, Y.; Nakamura, Y.; Asfour, T. An embedded, multi-modal sensor system for scalable robotic and prosthetic hand fingers. Sensors 2020, 20, 101. [Google Scholar] [CrossRef]
- Javaid, M.; Haleem, A.; Singh, R.P.; Rab, S.; Suman, R. Significance of sensors for industry 4.0: Roles, capabilities, and applications. Sensors Int. 2021, 2, 100110. [Google Scholar] [CrossRef]
- Hu, B.; Kundu, T.; Grill, W.; Liu, B.; Toufigh, V. Embedded piezoelectric sensors for health monitoring of concrete structures. ACI Mater. J. 2013, 110, 149–158. [Google Scholar]
- Gayakwad, H.; Thiyagarajan, J.S. Structural damage detection through EMI and wave propagation techniques using embedded PZT smart sensing units. Sensors 2022, 22, 2296. [Google Scholar] [CrossRef]
- Wang, Z.; Wei, L.; Cao, M. Damage quantification with embedded piezoelectric aggregates based on wavelet packet energy analysis. Sensors 2019, 19, 425. [Google Scholar] [CrossRef]
- Paradies, R.; Ruge, M. In situ fabrication of active fibre reinforced structures with integrated piezoelectric actuators. Smart Mater. Struct. 2000, 9, 220. [Google Scholar] [CrossRef]
- Schulze, R.; Streit, P.; Fischer, T.; Tsapkolenko, A.; Heinrich, M.; Sborikas, M.; Kroll, L.; Gessner, T.; Wegener, M. Fiber-reinforced composite structures with embedded piezoelectric sensors. In Proceedings of the IEEE Sensors, Valencia, Spain, 2–5 November 2014; pp. 1563–1566. [Google Scholar] [CrossRef]
- Hornig, A.; Frohberg, R.; Bätzel, T.; Gude, M.; Modler, N. Embedded sensing and actuating in CFRP composite structures—concept and technology demonstration for tailored embeddable sensor-actuator layers (TEmSAL). Smart Mater. Struct. 2022, 31, 095007. [Google Scholar] [CrossRef]
- Ghasemi-Nejhad, M.N.; Russ, R.; Pourjalali, S. Manufacturing and testing of active composite panels with embedded piezoelectric sensors and actuators. J. Intell. Mater. Syst. Struct. 2005, 16, 319–333. [Google Scholar] [CrossRef]
- Grandal, T.; Zornoza, A.; Lopez, A.; Fraga, S.; Sun, T.; Grattan, K.T.V. Analysis of fiber optic sensor embedded in metals by automatic and manual TIG welding. IEEE Sens. J. 2019, 19, 7425–7433. [Google Scholar] [CrossRef]
- Hossain, M.S.; Gonzalez, J.A.; Hernandez, R.M.; Shuvo, M.A.I.; Mireles, J.; Choudhuri, A.; Lin, Y.; Wicker, R.B. Fabrication of smart parts using powder bed fusion additive manufacturing technology. Addit. Manuf. 2016, 10, 58–66. [Google Scholar] [CrossRef]
- Britto, J.J.J.; Vasanthanathan, A. Smart piezo-bonded carbon fibre/epoxy composite structure: Experiments and finite element simulation. Mater. Res. Express 2022, 9, 045702. [Google Scholar] [CrossRef]
- Karayannis, C.G.; Golias, E.; Naoum, M.C.; Chalioris, C.E. Efficacy and damage diagnosis of reinforced concrete columns and joints strengthened with FRP ropes using piezoelectric transducers. Sensors 2022, 22, 8294. [Google Scholar] [CrossRef] [PubMed]
- Shen, Z.; Zhang, Z.; Zhang, N.; Li, J.; Zhou, P.; Hu, F.; Rong, Y.; Lu, B.; Gu, G. High-stretchability, ultralow-hysteresis conducting polymer hydrogel strain sensors for soft machines. Adv. Mater. 2022, 34, 2203650. [Google Scholar] [CrossRef]
- Madhavan, R. Network crack-based high performance stretchable strain sensors for human activity and healthcare monitoring. New J. Chem. 2022, 46, 17596–17609. [Google Scholar] [CrossRef]
- Han, L.; Wang, X.; Sun, Y. The effect of bonding layer properties on the dynamic behaviour of surface-bonded piezoelectric sensors. Int. J. Solids Struct. 2008, 45, 5599–5612. [Google Scholar] [CrossRef]
- Yanaseko, T.; Sato, H.; Kuboki, I.; Mossi, K.; Asanuma, H. Vibration viscosity sensor for engine oil monitoring using metal matrix piezoelectric composite. Materials 2019, 12, 3415. [Google Scholar] [CrossRef]
- Yanaseko, T.; Asanuma, H.; Sato, H. Detection of impact location by using anisotropy of output voltage of metal-core piezoelectric fiber/aluminum composites. Int. J. Mater. Sci. Appl. 2015, 4, 256–260. [Google Scholar] [CrossRef]
- Nguyen Van, C.; Bezold, A.; Broeckmann, C. Anisotropic shrinkage of hot isostatically pressed components. In Proceedings of the 11th International Conference on Hot Isostatic Pressing (HIP’14), Stockholm, Sweden, 9–13 June 2014; pp. 369–382. Available online: https://www.researchgate.net/publication/264971023_ANISOTROPIC_SHRINKAGE_OF_HOT_ISOSTATICALLY_PRESSED_COMPONENTS (accessed on 1 September 2023).
- Chen, Y.; Wang, N.; Ola, O.; Xia, Y.; Zhu, Y. Porous ceramics: Light in weight but heavy in energy and environment technologies. Mater. Sci. Eng. R Rep. 2021, 143, 100589. [Google Scholar] [CrossRef]
- Horikiri, K.; Yanaseko, T.; Kuboki, I.; Sato, H.; Asanuma, H. Development of surface oxidized metal fiber/piezoelectric ceramics/aluminum composite. Mech. Eng. J. 2019, 6, 18–00556. [Google Scholar] [CrossRef]
- Ramanathan, A.K.; Gingerich, M.B.; Headings, L.M.; Dapino, M.J. Metal structures embedded with piezoelectric PVDF sensors using ultrasonic additive manufacturing. Manuf. Lett. 2022, 31, 96–100. [Google Scholar] [CrossRef]
- Friel, R.; Harris, R. Ultrasonic additive manufacturing—A hybrid production process for novel functional products. Procedia CIRP 2013, 6, 35–40. [Google Scholar] [CrossRef]
- Dapino, M.J. Smart structure integration through ultrasonic additive manufacturing. In Smart Materials, Adaptive Structures and Intelligent Systems; American Society of Mechanical Engineers: Newport, RI, USA, 2014; Volume 2. [Google Scholar] [CrossRef]
- Kong, C.; Soar, R.; Dickens, P. Ultrasonic consolidation for embedding SMA fibres within aluminium matrices. Compos. Struct. 2004, 66, 421–427. [Google Scholar] [CrossRef]
- Hahnlen, R.; Morris, J.L.; Dapino, M.J. Ultrasonic additive manufacturing of metal-matrix shape memory composites. In Encyclopedia of Materials: Metals and Alloys; Elsevier Inc.: Amsterdam, The Netherlands, 2022. [Google Scholar] [CrossRef]
- Hehr, A.; Dapino, M.J. Interfacial shear strength estimates of NiTi–Al matrix composites fabricated via ultrasonic additive manufacturing. Compos. Part B Eng. 2015, 77, 199–208. [Google Scholar] [CrossRef]
- Chen, X.; Hehr, A.; Dapino, M.J.; Anderson, P.M. Deformation mechanisms in NiTi-Al composites fabricated by ultrasonic additive manufacturing. Shape Mem. Superelasticity 2015, 1, 32. [Google Scholar] [CrossRef]
- Li, J.; Monaghan, T.; Nguyen, T.; Kay, R.; Friel, R.; Harris, R. Multifunctional metal matrix composites with embedded printed electrical materials fabricated by ultrasonic additive manufacturing. Compos. Part B Eng. 2017, 113, 342–354. [Google Scholar] [CrossRef]
- Hyer, H.C.; Sweeney, D.C.; Petrie, C.M. Functional fiber-optic sensors embedded in stainless steel components using ultrasonic additive manufacturing for distributed temperature and strain measurements. Addit. Manuf. 2022, 52, 102681. [Google Scholar] [CrossRef]
- Chilelli, S.K.; Schomer, J.J.; Dapino, M.J. Detection of crack initiation and growth using fiber bragg grating sensors embedded into metal structures through ultrasonic additive manufacturing. Sensors 2019, 19, 4917. [Google Scholar] [CrossRef]
- Hehr, A.; Norfolk, M.; Wenning, J.; Sheridan, J.; Leser, P.; Leser, P.; Newman, J. Integrating fiber optic strain sensors into metal using ultrasonic additive manufacturing. JOM 2017, 70, 315–320. [Google Scholar] [CrossRef] [PubMed]
- Hahnlen, R.; Dapino, M. Active metal-matrix composites with embedded smart materials by ultrasonic additive manufacturing. Proc. SPIE Int. Soc. Opt. Eng. 2010, 7645, 159–170. [Google Scholar] [CrossRef]
- Ferreira, P.M.; Machado, M.A.; Carvalho, M.S.; Vidal, C. Embedded sensors for structural health monitoring: Methodologies and applications review. Sensors 2022, 22, 8320. [Google Scholar] [CrossRef] [PubMed]
- Fotouhi, S.; Akrami, R.; Ferreira-Green, K.; Naser, G.A.M.; Fotouhi, M.; Fragassa, C. Piezoelectric PVDF sensor as a reliable device for strain/load monitoring of engineering structures. IOP Conf. Ser. Mater. Sci. Eng. 2019, 659, 012085. [Google Scholar] [CrossRef]
- Cui, H.; Zhao, F. Damage identification for a beam structure based on a PVDF piezoelectric film combined sensor. Meas. Sci. Technol. 2021, 32, 115105. [Google Scholar] [CrossRef]
- Du, G.; Li, Z.; Song, G. A PVDF-based sensor for internal stress monitoring of a concrete-filled steel tubular (CFST) column subject to impact loads. Sensors 2018, 18, 1682. [Google Scholar] [CrossRef] [PubMed]
- Jain, A.; Minajagi, S.; Dange, E.; Bhover, S.U.; Dharanendra, Y. Impact and acoustic emission performance of polyvinylidene fluoride sensor embedded in glass fiber-reinforced polymer composite structure. Polym. Polym. Compos. 2021, 29, 354–361. [Google Scholar] [CrossRef]
- De Rosa, I.M.; Sarasini, F. Use of PVDF as acoustic emission sensor for in situ monitoring of mechanical behaviour of glass/epoxy laminates. Polym. Test. 2010, 29, 749–758. [Google Scholar] [CrossRef]
- Nguyen, K.; Bryant, M.; Song, I.H.; You, B.H.; Khaleghian, S. The application of PVDF-based piezoelectric patches in energy harvesting from tire deformation. Sensors 2022, 22, 9995. [Google Scholar] [CrossRef]
- Azimi, S.; Abolhasani, A.; Moosavi, S.; Vanaei, F.; Jafari, A.; Samimi, E.; Rayati, M.; Noori, E.; Rafiee, E.; Javadi, A.; et al. Development of a vehicle passage sensor based on a PVDF nanogenerator. ACS Appl. Electron. Mater. 2021, 3, 4689–4698. [Google Scholar] [CrossRef]
- Venkatraman, G.; Shah, U.; Liu, X.; Dapino, M.J. In-situ IR imaging for modeling energy transfer and its relationship to shear strength of the weld interface in ultrasonic additive manufacturing. CIRP J. Manuf. Sci. Technol. 2023, 43, 181–192. [Google Scholar] [CrossRef]
- Headings, L.; Kotian, K.; Dapino, M. Speed of sound measurement in solids using polyvinylidene fluoride (PVDF). Sensors 2013, 56031, V001T04A012. [Google Scholar] [CrossRef]
- Khattak, M.M.; Headings, L.M.; Dapino, M.J. Characterization of a PVDF sensor embedded in a metal structure using ultrasonic additive manufacturing. Proc. SPIE Int. Soc. Opt. Eng. 2023, 12489, 77–87. [Google Scholar] [CrossRef]
- Vig, J.; Walls, F. A review of sensor sensitivity and stability. In Proceedings of the 2000 IEEE/EIA International Frequency Control Symposium and Exhibition (Cat. No.00CH37052), Kansas City, MO, USA, 9 June 2000; pp. 30–33. [Google Scholar] [CrossRef]
- Blevins, R.D. Formulas for Natural Frequency and Mode Shape; Van Nostrand Reinhold Co.: New York, NY, USA, 1979; pp. 134–136. [Google Scholar]
- Khattak, M.M.; Sugino, C.; Erturk, A. Concurrent vibration attenuation and low-power electricity generation in a locally resonant metastructure. J. Intell. Mater. Syst. Struct. 2022, 33, 1990–1999. [Google Scholar] [CrossRef]
Disclaimer/Publisher’s Note: The statements, opinions and data contained in all publications are solely those of the individual author(s) and contributor(s) and not of MDPI and/or the editor(s). MDPI and/or the editor(s) disclaim responsibility for any injury to people or property resulting from any ideas, methods, instructions or products referred to in the content. |
© 2023 by the authors. Licensee MDPI, Basel, Switzerland. This article is an open access article distributed under the terms and conditions of the Creative Commons Attribution (CC BY) license (https://creativecommons.org/licenses/by/4.0/).