Article

A Numerical Study on the Transient Injection Characteristics of Gas Fuel Injection Devices for Direct-Injection Engines

School of Automotive and Traffic Engineering, Jiangsu University of Technology, Changzhou 213001, China
*
Author to whom correspondence should be addressed.
Actuators 2023, 12(3), 102; https://doi.org/10.3390/act12030102
Submission received: 7 December 2022 / Revised: 16 February 2023 / Accepted: 22 February 2023 / Published: 25 February 2023
(This article belongs to the Special Issue Linear Motors and Direct-Drive Technology)

Abstract

:
Natural gas has emerged as one of the preferred alternative fuels for vehicles owing to its advantages of abundant reserves, cleaner combustion and lower cost. At present, the gas supply methods for natural-gas engines are mainly port fuel injection (PFI) and direct injection (DI). The transient injection characteristics of a gas fuel injection device, as the terminal executive component of the PFI or DI mode, will directly affect the key performance of a gas fuel engine. Therefore, gas fuel injection devices have been selected as the research object of this paper, with a focus on the transient injection process. To explore the impacts of valve vibration amplitude, period, frequency and velocity on transient injection characteristics, one transient computational fluid dynamics (CFD) model for gas fuel injection devices was established. The findings thereof demonstrated that there is a linear relationship between the instantaneous mass flow rate and instantaneous lift during the vibration process. However, this relationship is somewhat impacted when the valve speed is high enough. A shorter valve vibration period tends to preclude a shorter period of flow-hysteresis fluctuation. The near-field pressure fluctuation at the throat of an injection device, caused by valve vibration, initiates flow fluctuation.

1. Introduction

The need for alternative fuels for conventional internal combustion engines (ICEs) has grown as a result of depletion of crude oil reserves, global warming and more rigorous emission regulations. Natural gas (NG), generally containing more than 90% methane, is considered one of the most promising alternative fuels owing to its advantages of abundant reserves, cleaner combustion and lower cost [1]. According to the International Energy Agency, the importance of NG can be compared with that of gasoline in terms of power generation, transportation, etc. [2]. Driven by current sustainability development policies, over one-quarter of global power generation is provided by NG [3]. In terms of road transport, NG has replaced other alternative fuels as the preferred choice for vehicles [4].
In recent years, natural-gas vehicles (NGVs) have been vigorously developed and employed around the world [5]. Until 2019, there were more than 28.5 million NGVs worldwide (including all land-based motor vehicles, from two-wheeled to off-road). Asian countries led the world in this respect with 20.5 million NGVs, followed by Latin American countries with 5.4 million NGVs [6]. In particular, NG is the main alternative fuel for long-haul and heavy trucks, such as long-distance transport vehicles and fleets that require centralized refueling [4].
The fuel supply system plays an important role in the performance of NG-fueled engines. Based on the supply mode, fuel supply systems can be classified as out-cylinder premixed method, port fuel injection (PFI) and direct injection (DI). The premixed method, which is the oldest NG supply method, works through the incorporation of a Venturi tube [7]. NG is premixed with air in the Venturi tube, and then the mixture is drawn into the cylinder because of the in-cylinder subatmospheric pressure during intake. This method leads to great power reduction, although it has the best mixing uniformity. The PFI mode can be divided into single-point injection (SPI) and multipoint injection (MPI). For the former mode, NG is injected near the intake manifold near the gas injector, while for the latter, NG is injected into the intake port of each cylinder, closer to the cylinder than in SPI. At present, the PFI mode is the most common fuel supply system for compressed natural gas (CNG) spark-ignition engines. However, it will lead to torque cutting due to reductions in volume efficiency. In contrast, for the DI mode, this problem can be avoided via injecting gaseous fuel after the intake-valve closing time (IVC).
The transient injection characteristics of a gas fuel injection device, as the terminal executive component of the PFI or DI mode, will affect the key performance of an NG engine directly. One outward-opening NG injector, driven with a piezo actuator, was developed by Siemens under support from the New Integrated Combustion System for Future Passenger Car Engines project (during the period of 2004 to 2012) [8,9]. Considering that the piezo actuator’s stroke was rather small, a hydraulic stroke amplifier unit was designed to achieve the desired needle lift (about 200 μm) and mass flow rate. Based on this injector, Baratta et al. [10] used planar laser-induced fluorescence (PLIF) and the computational fluid dynamics (CFD) method to investigate the differences of transient NG jet patterns between different engine cycles. The NG jets were identified as having “cloud-like” and “umbrella-like” shapes.
In recent years, research of NG injectors (or NG injection devices) mainly focused on electromagnetic characteristics, structural design and structural optimization based on steady internal-flow characteristics [11,12,13,14]. A novel cascade control algorithm was used by Tan et al. to achieve multiobjective optimization of control parameters for electromagnetic linear actuators [11]. One new sensorless electronic closed-loop antibounce solution was proposed by Glasmachers et al. to effectively reduce bouncing and provide robust, soft landing for fuel injectors [12]. Single-shot X-ray radiography was used by Swantek et al. to investigate the steady-state behavior of an outward-opening gas injector [13]. Several CFD simulations of steady-state gas flow through various poppet-valve geometries were performed by Kim et al. to suggest design improvements for obtaining more efficient poppet valves with reduced stagnation pressure loss [14].
The transient injection characteristics of the gas fuel injector have, however, received little attention. The transient gas flow development of one outward-opening injector was studied by Deshmukh et al. [15,16] with the large eddy simulation (LES) method. The research results showed that an NG jet’s features (such as axial penetration length, maximum jet width and volume) and subsequent mixture-formation process would be seriously affected by the transient motion process of an injector. In addition, there would be about a 30% disparity between the data of an LES simulation and the corresponding experiment if the motion process of an NG injector was ignored. One high-pressure NG injector was developed by Rogers et al. [17], based on BOSCH’s gasoline injector, and the transient injection process of this NG injector was studied with the particle image velocimetry method. It was found that the injector would have a large degree of seating bounce when its valve was seated at the valve seat or the upper stop position because of the undesirable force characteristics of a traditional solenoid. A solenoid is generally characterized with greater force at both ends of the stroke, and it is difficult to achieve accurate displacement control with it. The maximum bouncing lift was almost 80% larger than the expected stable lift. In addition, the duration of the seating bounce was about 16% of the whole injection-pulse width of the NG injector [17]. It is obvious that these on/off transition processes of NG injectors will play a vital role in the process of gas fuel injection and subsequent in-cylinder mixture formation.
However, this research of the effects of transient valve motion on gas jet patterns is not comprehensive enough because the effects of key factors (such as injector-valve vibration magnitude, period and vibration time) have not been analyzed. As had been discussed in the literature cited above [11,12,13,14], researchers were accustomed to trying to reduce the seating impact of the nozzle valve in order to improve the control accuracy of the fuel supply of the gas fuel engine. Problems such as how much impact the valve-seating-bounce process has on the transient injection mass flow rate and which factor among vibration magnitude, period and vibration time has the greatest impact on jet pattern have not been discussed. In this paper, the affecting laws of these factors will be given focus. In order to explore the effects of injector-valve transient vibration on transient injection characteristics, one transient CFD model of an NG fuel injection device of the DI mode is proposed. Factors such as valve vibration amplitude, period, frequency and velocity are discussed. Finally, the CFD model is validated in both the aspects of transient gas fuel jet pattern and cumulative mass flow rate. The research results of this paper will provide guidance for future research on seating control of gas fuel injection devices.

2. CFD Model and Validation

2.1. Cases and CFD Model

At present, most gas fuel (mainly hydrogen, NG) injectors are driven with solenoids [11,12,13,14,15,16,17], resulting in valve seating problems, even if a piezo actuator is used [8,9,10]. One new type of NG injector [18] was designed by authors in previous studies to solve the seating problem of traditional gas fuel injectors. A moving-coil electromagnetic linear actuator (MCELA) was used as the driving aspect. It has a longer stroke, higher power density and better controllability than does a solenoid. Therefore, in theory, this new NG injector could achieve less rebound during seating process.
However, a softer seating advantage is usually achieved through closed-loop control, and the control signal is usually given via a displacement sensor. The scheme (working with a displacement sensor) may not be suitable for the DI supply mode because the installation volume limitation for injectors with the DI mode is very strict. Therefore, open-loop control was still used for the NG injector with the DI mode, but without the displacement sensor. In addition, a new sensorless soft-landing control strategy for improving the dynamic performance and fatigue life of NG injectors was proposed [19], as shown in Figure 1a. It was found that there was still a certain seating vibration even with the soft-landing control strategy.
On the other hand, the typical needle (or valve) lift curve of a conventional solenoid-driven injector, given by Bosch GmbH, is shown in Figure 1b [20]. In addition, the gas mass flow rate of this injector was calculated using the equation from Saint-Venant.
In this study, the effects of injector-valve lift-vibration amplitude, period and cycle time on the transient outflow rate and jet pattern are presented using three-dimensional CFD simulation software Fluent, based on the structure of the new NG injector proposed in our previous study [21]. The main dimensions of the NG injector and the applicable large-bore NG engine operating conditions are listed in Table 1 and Table 2, respectively. Vibration amplitude is defined as the maximum vibration lift, the vibration period is the time in which the valve experiences one vibration cycle after seating or reaching the maximum lift and vibration-cycle time is the number of vibrations experienced before the valve stabilizes. Considering the measured lift data of an injector driven with an MCELA and an injector driven with a solenoid, case 2 was taken as the base case when the vibration lift was half of the maximum valve lift (1.4 mm), the vibration period was 0.4 ms and the vibration-cycle time was 1. In order to discuss the effect of vibration amplitude, amplitudes were taken as 25%, 50%, 75% and 100% of the maximum lift, respectively. In addition, in order to discuss the effect of the vibration period, periods were taken as 0.2 ms, 0.4 ms, 0.6 ms and 0.8 ms, respectively. Finally, based on case 2, the cycle times were set as 1, 2, 3 and 4, respectively, to discuss the effect of vibration-cycle time, as shown in Table 3 and Figure 2. The on/off process of the NG injector needed transition time, which was set at 1 ms for every case.
The transient CFD model of the NG injector is shown in Figure 3. The inlet and outlet boundaries of the model were both set as pressure boundary conditions. The injection pressure was set as 1.0 MPa to reduce the manufacturing-accuracy requirement of the injector and to make full use of the gas fuel in the tank [21]. A value of 1.0 MPa was determined according to the stagnation state formula and the in-cylinder pressure calculated from the engine model built in the authors’ preliminary study, and this pressure could ensure that the injection flow rate was independent from the in-cylinder pressure (back pressure) [21]. The outlet pressure was set as the standard atmospheric pressure. The natural gas used in this article was assumed to be 100% ideal methane for simplicity. Considering the characteristics of a supersonic jet and the great pressure/velocity gradient near the injector’s throat position, the near-field meshes were refined. The minimum mesh size was 0.05 mm. In addition, considering the CFD calculation cost, the mesh size was gradually increased at the position farthest from the throat. In addition, the maximum mesh size was about 1 mm. The whole domain was assumed to be initially quiescent. The RNG k–ε turbulence model and the nonequilibrium wall function were used in this study. The turbulent Schmidt number took the fixed default value of 0.7. The coefficient C, used in the ε equation, took the value of 1.42; coefficient C took the value of 1.68; and coefficient Cμ took the value of 0.0845. This program was based on the pressure-correction method and used the PISO algorithm. The first-order upwind differencing scheme was used for the momentum, energy and turbulence equations.

2.2. Transient CFD Model Verification

2.2.1. Verification with Cumulative Flow Rate

In order to test the steady volumetric flow rate of an NG injection device, one steady flow measurement bench, as shown in Figure 4, had been established previously by the authors of this paper [18]. In addition, the simulation accuracy of the steady CFD model of an NG injection device was verified based on this bench. However, its measuring pressure range was just 0.02–0.05 MPa, which is much lower than the injection pressure of the injector for the DI mode (gas fuel supply pressure is usually higher than 1 MPa). In order to meet the need for higher pressure, the spring of the pressure relief valve in the bench was replaced with a stronger spring, and the measured pressure range was expanded to 0.1–0.28 MPa. The measurement accuracy of the vortex flowmeter was ±1.0% of the measurement range. What is more, it was impossible to directly measure the cumulative flow rate of a single working cycle (from opening time to closing time) because the installation position of the flowmeter was far from the NG injection device. Therefore, the converted measured cumulative flow rate of a single cycle was taken to compare to the simulated results of a transient CFD injection model. This converted value comes from the measured cumulative flow rate during several injection cycles (for example, 5 min). To eliminate the effects of the selected number of injection cycles, both the 5 min and 12 h cases were discussed. For the sake of safety and convenience, compressed air rather than NG was used as the fluid. The gas supply pressure of the bench was adjusted to 0.1, 0.12, 0.14, 0.16 and 0.2 MPa respectively. The flow measurement was carried out at about 293 K, and the compressed air could be guaranteed to be gaseous under pressures lower than 0.2 MPa. The working-cycle durations of 40 ms, 60 ms and 120 ms were taken into consideration, corresponding to the engine speeds of 3000 RPM, 2000 RPM and 1000 RPM, respectively. The injection duration time was set as one quarter of the working-cycle duration.
The simulated single-cycle flow rate was compared with the converted experimental one, as shown in Figure 5. It was easily found that the difference between the long-term (12 h) converted experimental flow rate and the simulation results was less than that between the short-term (5 min) rate and the simulated one. The authors’ expectation was that the difference (caused by some random factors, such as upstream pressure fluctuation and data acquisition errors) between the converted experimental flow rate and the simulation results would be reduced as the cumulative injection time was extended. There was no obvious rule in the relationship between calculation errors and the upstream pressure of the injector. The maximum error, which was about 6.1%, appeared at an engine speed of 1000 RPM and an inlet pressure of 1.0 bar. In summary, the flow rate characteristics of the transient injection CFD model of the NG injector were verified from the perspective of cumulative single-cycle flow.

2.2.2. Verification with Gas Jet Pattern

For the CFD simulation of the NG injector’s transient injection process, it was most important to verify the calculation accuracy of the gas jet development process downstream of the injector’s throat, although the accuracy of the jet flow rate was also rather important. To verify the ability to calculate the gas jet pattern downstream, the gas jet imaging results from Yosri et al. [22] were compared with the results of the corresponding transient CFD model in this paper, as shown in Figure 6. An NG injector prototype provided by the Continental company was used in the literature. The simulation results were postprocessed with the density gradient method. The valve lift curve took the measured valve lift when the pressure of the constant volume cavity (CVC) was 0.1 MPa [22]. The injector valve’s vibration amplitude was about 25% of the maximum lift (0.4 mm) at the maximum lift position. In addition, the vibration amplitude was about 10% at the zero-lift position. The inlet pressure of the injector was set to 2.0 MPa, and the inlet temperature was 298 K. Methane (a surrogate for NG) was injected into the CVC with quiescent, nonreacting nitrogen. The CVC had an initial pressure of 0.1 MPa and an initial temperature of 298 K. Considering that accurate calculation of the jet development process requires the arrangement of 10–15 layers of grids on the cross-section of the throat [12], the mesh size was as small as 0.03 mm near the valve throat and up to 1 mm in other areas. It was found that the simulation results were rather consistent with the experimental gas jet imaging results both during the lifting process (222 μs after start of injection (ASOI)) and during the landing process (370 μs ASOI and 481 μs ASOI).

3. Results and Discussion

The flow fluctuation after the end of the valve lift vibration (called delayed flow fluctuation (DFF), as shown in Figure 7a) is the most important focus of this study. DFF caused by lift vibration would have a serious impact on the calibration quantity of gas fuel under certain engine working conditions because DFF is usually uncontrollable. In order to facilitate a comparison, the ending times of the valve vibration processes for all discussed cases (as shown in Table 3 and Figure 2) were normalized to the ending times (1.4 ms) of the valve vibrations for cases 1–4. Only the DFF near the maximum valve lift will be discussed in this study, because there was no DFF near the zero-lift position.
Firstly, the effect of vibration amplitude was discussed as cases 1–4 were compared, and the NG flow-rate fluctuation processes through the injection device’s throat in these four cases are presented in Figure 7. It was found that there was an almost linear correlation between the transient flow rate and instantaneous lift vibration during the lift-vibration process (from 1.0 ms to 1.4 ms), as shown in Figure 7a. Case 4 had the strongest DFF, and the strengths of the DFFs for case 3, case 2 and case 1 showed a gradual downward trend, as shown in Figure 7b. The cycle periods of the DFF for cases 1–4 were all the same. For a more comprehensive comparison, a case with no valve lift vibration (called no vibration in figure) was also taken into consideration. It was easily found that the case with no vibration had the weakest DFF and the shortest cycle period when compared with cases 1–4. It is obvious that higher vibration amplitude brings stronger DFF.
Secondly, the effect of the vibration period was discussed as cases 2 and 5–7 were compared, and the NG flow-rate fluctuation processes of these four cases are presented in Figure 8. The raw data during the lift-vibration process (for example, case 7: from 0.6 ms to 1.4 ms (normalized)) were almost the same as those when the vibration-amplitude factor was concerned. The linear relationships between the transient flow rate and instantaneous lift vibration still existed for case 6 and case 7. However, for case 5, which had the shortest vibration period, this linear relationship was somewhat broken, as shown in Figure 8a. It is obvious that the transient developing process of the supersonic gas jet was influenced by the faster velocity of valve vibration in case 5, and the transient mass flow rate was affected in turn.
When the vibration-period factor was considered, case 5 (period: 0.2 ms) had the strongest DFF, and the strengths of the DFFs for case 2 (period: 0.4 ms), case 7 (period: 0.8 ms) and case 6 (period: 0.6 ms) showed a gradual downward trend, as shown in Figure 8b. Case 5 had the longest DFF period, case 2 took the second place, case 7 took the third place and case 6 had the shortest value, as shown in Figure 8c. There seems to be some correlation among them: cases 2 and 5–7, which had shorter lift-vibration periods, had stronger DFFs and longer DFF periods. This rule is not applicable to case 6 or case 7, however. Actually, case 6, case 7 and the case with no vibration had some crossing areas when the case with no vibration was taken into consideration, as shown in Figure 8c. Their DFF strengths and periods were almost the same. Therefore, it can be concluded that the effect of valve vibration period on DFF will be rather little if the vibration period is long enough (the boundary was about 0.6 ms (case 6) in the example presented in this paper).
At last, the effect of vibration-cycle time was discussed as cases 2 and 8–10 were compared, as shown in Figure 9. It was found that the DFF of case 2 (cycle time: 1) was the strongest, and the DFFs of cases 8–10 were almost the same. What is more important is that the DFF strengths of the last three cases were slightly weaker (about 1.2‰ at the peak point of the flow rate) than that of case 2, as shown in Figure 9b. It can be concluded that more vibration time tends to bring weaker DFF, although the influence is quite little.
By now, the influences of injector-valve lift-vibration amplitude, period and cycle time on transient gas jet have been discussed in cases 1–10, above. It was interesting to find that case 4 had the same valve vibration speed (slope of valve lift-vibration curve) as case 5, as shown in Figure 2. This situation also existed for case 1 and case 7. Therefore, it is necessary to discuss these two cases further. Their valve lifts and corresponding mass flow rates are presented in Figure 10 and Figure 11, respectively. It can be seen that case 5, which had a smaller lift-vibration amplitude, shows a stronger DFF than case 4, and that case 1, which had a smaller lift-vibration amplitude, shows a weaker DFF than case 7. These seem to lead to quite different conclusions. However, it is worth noting that the DFF strengths of case 1 and case 7 are actually almost the same as each other. The biggest difference between case 1 and case 7 is smaller than 4‰, and these two cases’ DFFs were almost the same as that of the case with no vibration, as shown in Figure 7 and Figure 8, because their lift-vibration speeds were rather slow (that is: their vibration periods were long enough). Shorter vibration tends to cause greater DFF when the vibration speed is the same.
According to the mass-flow-rate formula of one-dimensional isentropic flow [
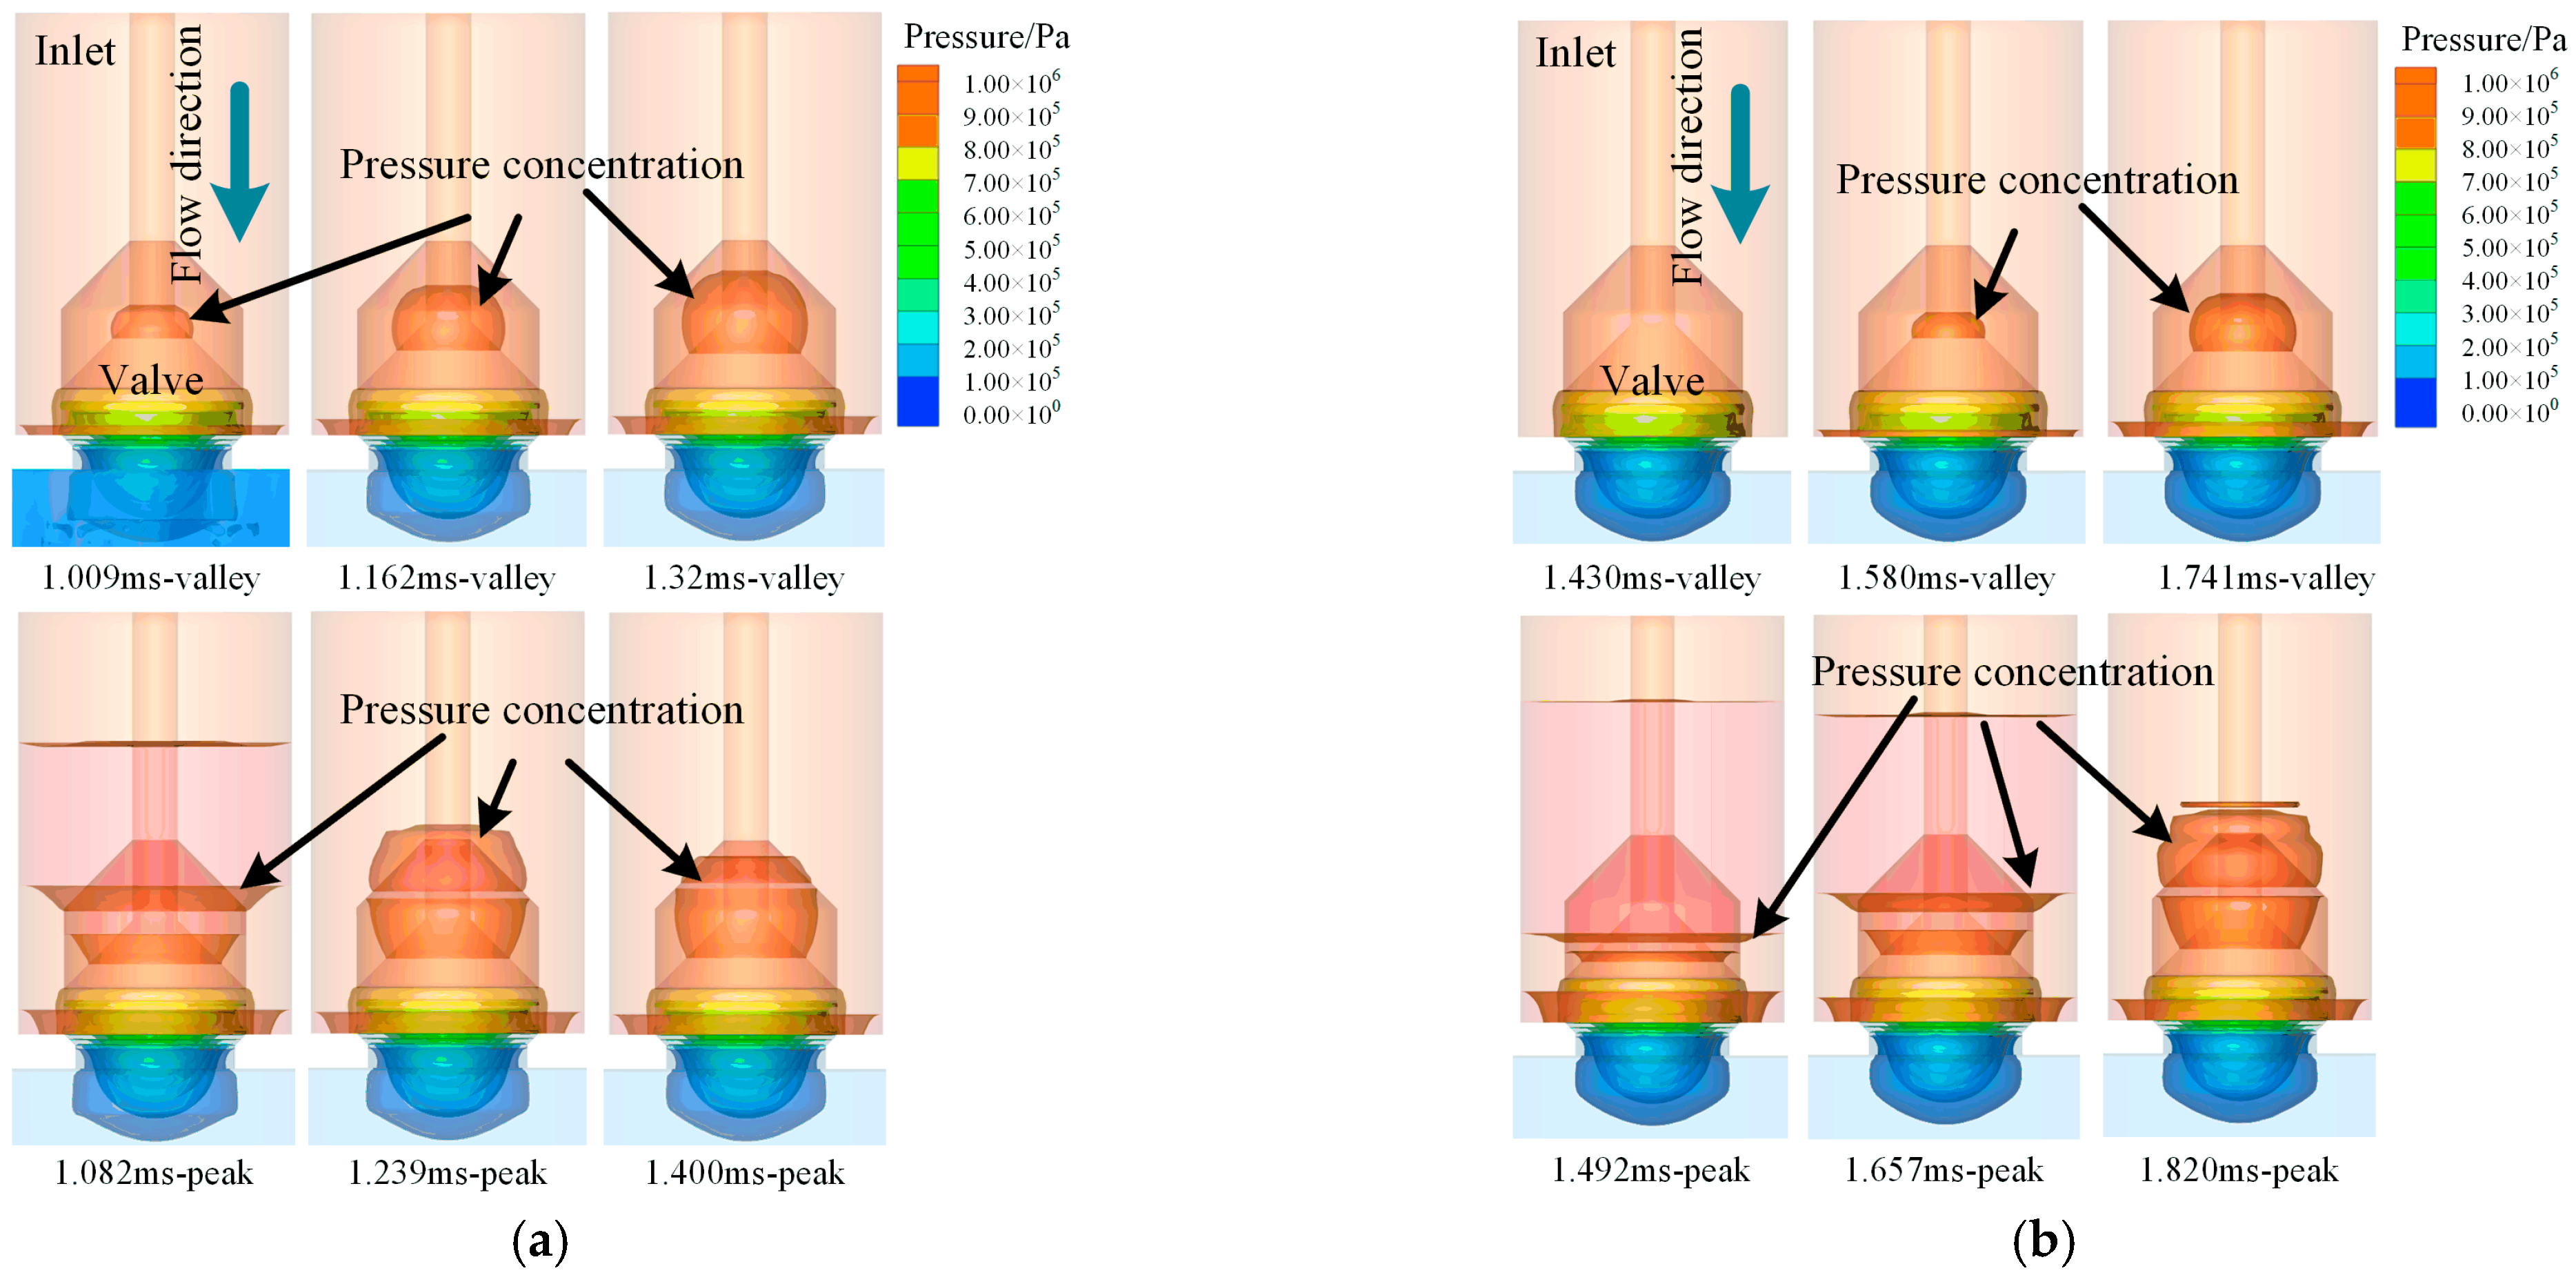
17], the flow fluctuation of a jet nozzle generally results from pressure-ratio (ratio of pressure downstream of the nozzle throat and pressure upstream of the nozzle throat) fluctuation. Therefore, in order to reveal the reason for DFF in this paper, the pressure fluctuation situations downstream and upstream of the NG injection device’s throat are presented in Figure 12. Based on the mass flow-rate fluctuation curves (Figure 7, Figure 8 and Figure 9) after the end the of valve lift vibration, three peak points and three valley points of each fluctuation curve were selected as the inner pressure analyzing points. Firstly, the throat near-field pressure of the case with no vibration was presented because the DFF of this case could not come from valve lift vibration. The analyzing points were 1.009 ms, 1.082 ms, 1.162 ms, 1.239 ms, 1.320 ms and 1.400 ms. Secondly, as discussed above, case 2 was used as a base case for comparison, and its near-field pressure needed to be presented. The analyzing points were 1.430 ms, 1.492 ms, 1.580 ms, 1.657 ms, 1.741 ms and 1.820 ms.
It could be intuitively obtained from the near-field pressure distribution that a smaller pressure-concentration zone is formed on the back face of an injector’s valve for the valley point (for example: case with no vibration, 1.162 ms-valley) when compared with that for the nearby peak points (for example: case with no vibration, 1.082 ms-peak and 1.239 ms-peak). In addition, the volume of the pressure concentration area tends to increase as injection time goes by. On the other hand, for the peak point (for example: case 2, 1.657 ms-peak), a larger-pressure concentration area is formed when compared with that for nearby valley points (for example: case 2, 1.580 ms-valley and 1.741 ms-valley), and the volume tends to decrease. In addition, the differences of pressure distribution between nearby valley and peak points tend to be gradually smaller. For example, the difference between the 1.320 ms point and the 1.400 ms point was much smaller than that between the 1.162 ms point and the 1.239 ms point. This rule existed for both the case with no vibration and case 2. This gradually decreased pressure difference leads to a smaller amplitude of DFF, and so the gas jet would finally be stabilized. It was also found that the difference between the nearby valley and peak points of the case with no vibration was smaller than that of case 2, resulting in a lower amplitude of DFF in the former case, as shown in Figure 7b.

4. Conclusions

The transient CFD model of a DI NG injector’s transient injection process was established in this paper. Based on this CFD model, the influences of injector valve vibration amplitude, period, cycle time and velocity on transient injection characteristics were investigated. Flow fluctuation after the end of valve lift vibration was a focus. The main conclusions are as follows:
There is an almost linear correlation between the transient flow rate and instantaneous lift vibration during the lift-vibration process (from 1.0 ms to 1.4 ms for cases 1–4), and this linear correlation will be somewhat broken if the valve’s vibration velocity is high enough or the vibration period is short enough.
A higher value of vibration amplitude tends to bring stronger DFF. In studying the seating control of gas fuel injectors, efforts should be made to reduce valve lift-vibration amplitude because it has a significant impact on flow during and after the injection period.
Under the condition of the same amplitude, a shorter valve vibration period means stronger DFF and a longer period of DFF. In addition, the effect of the valve vibration period on DFF is rather little if the vibration period is long enough (the boundary was about 0.6 ms in the example presented in this paper).
The influence of vibration-cycle time on DFF is quite little. More vibration time tends to bring weaker DFF. When studying the seating control of gas fuel injectors, we should try to avoid too-fast valve lift-vibration speed. However, vibration-cycle time does not need too much attention when only DFF is considered.
The throat near-field pressure fluctuation caused by valve lift vibration results in DFF.

Author Contributions

Methodology and software, T.W. and Y.Z.; verification, H.W. and L.Z.; resources, L.Z. and J.C.; writing—original draft preparation, W.G., L.L. and H.W. All authors have read and agreed to the published version of the manuscript.

Funding

This work was supported by the National Natural Science Foundation of China (Grants No. 52105260 and. 11802108), the Changzhou Sci & Tech Program (Grant No. CE20225049), the Natural Science Research Project of Higher Education Institutions in Jiangsu Province (Grants No. 21KJB460008 and 22KJA580002) and the Qinglan Engineering Project of Jiangsu Universities. The APC was funded by the National Natural Science Foundation of China, the Changzhou Sci & Tech Program and the Natural Science Research Project of Higher Education Institutions in Jiangsu Province (Grant No. 21KJB460008).

Data Availability Statement

Not applicable.

Conflicts of Interest

The authors declare no conflict of interest.

Nomenclature

ASOIAfter start of injection
CFDComputational fluid dynamics
CNGCompressed natural gas
CVCConstant volume cavity
DFFDelayed flow fluctuation
DIDirect injection
ICEInternal combustion engine
IVCIntake-valve closing time
LESLarge eddy simulation
MCELAMoving-coil electromagnetic linear actuator
NGNatural gas
NGVNatural-gas vehicle
PFIPort fuel injection
PLIFPlanar laser-induced fluorescence

References

  1. Moon, S. Potential of direct-injection for the improvement of homogeneous-charge combustion in spark-ignition natural gas engines. Therm. Eng. 2018, 136, 41–48. [Google Scholar] [CrossRef]
  2. IEA. The Contribution of Natural Gas Vehicles to Sustainable Transport. Available online: https://www.iea.org/reports/the-contribution-of-natural-gas-vehicles-to-sustainable-transport (accessed on 14 August 2022).
  3. IEA. Gas. Available online: https://www.iea.org/fuels-and-technologies/gas (accessed on 14 August 2022).
  4. Fadiran, G.; Sharma, T.; Rogan, F. Exploring a case transition to low carbon fuel: Scenarios for natural gas vehicles in Irish road freight. SSRN Electron. J. 2021, 33. [Google Scholar] [CrossRef]
  5. Honda. North American Environmental Report. 2015. Available online: https://csr.honda.com/environment/na-environmental-report/ (accessed on 14 August 2022).
  6. Teoh, L.E.; Khoo, H.L. Analysis of natural gas vehicle acceptance behavior for Klang Valley, Malaysia. Int. J. Sustain. Transp. 2020, 15, 11–29. [Google Scholar] [CrossRef]
  7. Bircann, R.; Kazour, Y.; Dauer, K.; Fujita, M. Cold Performance Challenges with CNG PFI Injectors; SAE Technical Paper 2013-01-0863; SAE: Warrendale, PA, USA, August 2013. [Google Scholar]
  8. NICE Report Summary. Available online: http://cordis.europa.eu/publication/rcn/12052_en.html. (accessed on 31 August 2016).
  9. Sankesh, D.; Lappas, P. Natural-Gas Direct-Injection for Spark-Ignition Engines—A Review on Late-Injection Studies; SAE Technical Paper 2017-26-0067; SAE: Warrendale, PA, USA, October 2017. [Google Scholar]
  10. Baratta, M.; Andrea, E.; Pesce, F.C. Multidimensional modelling of natural gas jet and mixture formation in direct injection spark ignition engines—Development and validation of a virtual injector model. J. Fluids Eng. 2011, 133, 041304. [Google Scholar] [CrossRef]
  11. Tan, C.; Ren, H.; Li, B.; Lu, J.; Li, D.; Tao, W. Design and analysis of a novel cascade control algorithm for braking-by-wire system based on electromagnetic direct-drive valves. J. Franklin Inst. 2022, 359, 8497–8521. [Google Scholar] [CrossRef]
  12. Glasmachers, H.; Joachim, M.; Koch, A. Sensorless Movement Control of Solenoid Fuel Injectors; SAE Technical Paper 2006-01-0407; SAE: Warrendale, PA, USA, March 2006. [Google Scholar]
  13. Swantek, A.B.; Duke, D.J. An experimental investigation of gas fuel injection with X-ray radiography. Exp Therm. Fluid Sci. 2017, 87, 15–29. [Google Scholar] [CrossRef]
  14. Kim, G.H.; Allan, K.; Michell, C. Improvement of Poppet Valve Injection Performance in Large-Bore Natural Gas Engines. In Proceedings of the ASME 2004 Internal Combustion Engine Division Fall Technical Conference, Long Beach, CA, USA, 24–27 October 2004; Volume 37467. [Google Scholar]
  15. Deshmukh, A.Y.; Bode, M. Simulation and Modeling of Direct Gas Injection through Poppet-type Outwardly opening Injectors in Internal Combustion Engines. In Natural Gas Engines; Srinivasan, K.K., Agarwal, A.K., Krishnan, S.R., Mulone, V., Eds.; Springer: Berlin/Heidelberg, Germany, 2019; pp. 65–115. [Google Scholar]
  16. Deshmukh, A.Y.; Vishwanathan, G. Characterization of hollow cone gas jets in the context of direct gas injection in internal combustion engines. SAE Int. J. Fuels Lubr. 2018, 11, 353–377. [Google Scholar] [CrossRef]
  17. Rogers, T.; Petersen, P. Flow Characteristics of Compressed Natural Gas Delivery for Direct Injection Spark Ignition Engines; SAE Technical Papers 2015-01-0002; SAE: Warrendale, PA, USA, March 2015. [Google Scholar]
  18. Wang, T.B.; Zhang, L.C.; Chen, Q. Effect of Valve Opening Manner and Sealing Method on the Steady Injection Characteristic of Gas Fuel Injector. Energies 2020, 13, 1479. [Google Scholar] [CrossRef] [Green Version]
  19. Tan, C.; Ge, W.; Li, B. A Novel Large-flow-rate Gas Fuel Injection Device with Sensorless Control. Eng. Lett. 2019, 27, 20. [Google Scholar]
  20. Chiodi, M.; Berner, H.J. Investigation on different Injection Strategies in a Direct-Injected Turbocharged CNG-Engine; SAE Technical Paper 2006-01-3000; SAE: Warrendale, PA, USA, September 2006. [Google Scholar]
  21. Wang, T.B.; Zhang, L.C.; Bei, S. Influence of injection valve opening manner and injection timing on mixing effect of direct injection compressed natural gas–fueled engine. Int. J. Engine Res. 2020, 22, 2244–2253. [Google Scholar] [CrossRef]
  22. Yosri, M.R.; Ho, J.Z. Large-eddy simulation of methane direct injection using the full injector geometry. Fuel 2021, 290, 120019. [Google Scholar] [CrossRef]
Figure 1. (a) Seating vibration of an injector driven with an MCELA (under the sensorless soft-landing control strategy). (b) Seating vibration of an injector driven with a solenoid [20].
Actuators 12 00102 g001
Figure 2. Lift curve of each case.
Actuators 12 00102 g002
Figure 3. CFD calculation domain and mesh.
Actuators 12 00102 g003
Figure 4. Flow measurement bench of the injector.
Actuators 12 00102 g004
Figure 5. Comparison of single conversion and single-cycle transient volume flow.
Actuators 12 00102 g005
Figure 6. Instantaneous injection flow features during the injection, shown with Schlieren imaging [22] (first row) and simulation results using the density gradient method (second row).
Actuators 12 00102 g006
Figure 7. Effect of valve lift-vibration amplitude on the mass flow rate of the NG injector ((b) is the partial enlargement of (a)).
Actuators 12 00102 g007
Figure 8. Effect of the valve lift-vibration period on the mass flow rate of the NG injector ((b,c) are the partial enlargements of (a)).
Actuators 12 00102 g008
Figure 9. Effect of cycle time of valve lift vibration on the mass flow rate of the NG injector ((b) is the partial enlargement of (a)).
Actuators 12 00102 g009
Figure 10. Valve lift vibrations and mass flow rates of case 4 and case 5 (they had the same valve vibration speed).
Actuators 12 00102 g010
Figure 11. Valve lift vibrations and mass flow rates of case 1 and case 7 (they had the same valve vibration speed).
Actuators 12 00102 g011
Figure 12. (a) Throat near-field pressure distribution of the case with no vibration (left). (b) Throat near-field pressure distribution of cases with vibration (case 2, for example; right).
Actuators 12 00102 g012
Table 1. Specifications of NG injector.
Injector ParameterValue
Outlet Diameter (mm)7
Valve Lift (mm)1.5
Injection Pressure (MPa)1.0
Injection Duration (CA)54.5°CA (at 255 kW and 1900 rpm) [21]
Table 2. Specifications of engine.
ParameterValue
Bore (mm) × Stroke (mm)131 × 155
Displacement Volume (L)12.53
Compression Ratio11.5
Rated Power (kW)/Speed (rpm)255/1900
IVO/IVC(CA)30°BTDC/46°ABDC
EVO/EVC(CA)78°BBDC/30°ATDC
Table 3. Parameters of each case.
Vibration AmplitudeVibration PeriodVibration Cycle
Case 125%0.4 ms1
Case 250%0.4 ms1
Case 375%0.4 ms1
Case 4100%0.4 ms1
Case 550%0.2 ms1
Case 650%0.6 ms1
Case 750%0.8 ms1
Case 850%0.4 ms2
Case 950%0.4 ms3
Case 1050%0.4 ms4
Disclaimer/Publisher’s Note: The statements, opinions and data contained in all publications are solely those of the individual author(s) and contributor(s) and not of MDPI and/or the editor(s). MDPI and/or the editor(s) disclaim responsibility for any injury to people or property resulting from any ideas, methods, instructions or products referred to in the content.

