Article

Vibration Performance of Traction Gearbox of a High-Speed Train: Theoretical Analysis and Experiments

1
School of Mechanical Engineering, Dalian University of Technology, Dalian 116024, China
2
Taiyuan Heavy Industry Rail Transit Equipment Co., Ltd., Taiyuan 300082, China
3
State Key Laboratory of Mechanical Transmission, Chongqing University, Chongqing 400044, China
*
Author to whom correspondence should be addressed.
Actuators 2023, 12(3), 103; https://doi.org/10.3390/act12030103
Submission received: 30 December 2022 / Revised: 14 February 2023 / Accepted: 21 February 2023 / Published: 25 February 2023
(This article belongs to the Section Actuators for Land Transport)

Abstract

:
The gearbox is the key component of the traction drive system of a high-speed train. At the same time, the traction gearbox can easily experience a box housing failure due to bearing internal excitation from gear meshing and external excitation from motor torque fluctuation, the wheel polygon, and so on. In order to analyze the vibration and noise of the gearbox, a dynamic model of a high-speed train gear transmission system was established under the conditions of time-varying meshing stiffness and time-varying meshing error. A frequency spectrum analysis of the vibration at the key nodes of the model that changed with the speed was carried out. A test rig for a traction gearbox of a high-speed train was built, and a testing method for the vibration and noise of a high-speed train traction gearbox was put forward. The testing of and research on the traction gearbox under various working conditions were carried out, and the dynamic evaluation indexes of acceleration, vibration intensity, and air noise at different measuring points of the high-speed train traction gearbox were obtained. The study provided a test reference and a basis for the dynamic performance optimization design and fault diagnosis of a high-speed railway traction gearbox system.

1. Introduction

Since the end of the 1950s, China’s railway traction gear technology research has reached a certain level after nearly 60 years of development. The high reliability and long service life of traction gear are required because of the heavy load and high-speed characteristics of trains. In addition to a light weight and small structure volume, the traction gearbox of high-speed trains should also follow the strict noise limit value in order to improve passenger comfort.
In recent years, China’s railway train traction gear technology has been greatly improved. However, faults such as oil leakage, high oil temperature, and foreign matter in the gearbox of high-speed EMUs often occur, but the most important failure is the cracking of the gearbox housing [1]. In order to improve the dynamic performance of the traction gearbox and reduce vibration and noise, gear modification is usually adopted [2,3]. However, gear modification may increase sensitivity to shaft deformation and installation error. On the basis of considering the influence of tooth tip trimming, Wei et al. [2,3,4] established a dynamic model of a helical gear rotor system with 12 degrees of freedom, applied the obtained time-varying meshing stiffness to the system dynamics model, and studied the influence rule of different trimming amount on the vibration response of a helical gear transmission. Huang [5] used the numerical integration method to simulate the dynamic response of a high-speed train gear transmission system under internal and external dynamic excitation and came to the conclusion that the high-frequency vibration of the gear transmission system could be obtained by considering the gear meshing. Wang et al. [6] used the stress–strength interference theory to establish the reliability model of a gearbox’s equivalent stress fatigue strength interference and analyzed and studied the relationship between the vibration fatigue strength and the service history of the gearbox housing of a high-speed train. Wu [7] used the finite element model of the corresponding gearbox box. Based on the modal test data, the finite element model of the gearbox box was modified using the Crow Search Algorithm with Levy Flight (LFCSA). Xia [8] analyzed a case of gear failure and found that the frequency domain of its vibration signal would appear as a modulated sideband with the meshing frequency as the center and the rotation frequency of the shaft where the fault gear was located as the interval. The basic structure and vibration mechanism of the gearbox bearing of a high-speed train were described. Li et al. [9] established a rigid–flexible coupling refined dynamic model of a high-speed train using SIMPACK software by combining finite element polycondensation with rail vehicle dynamics. While considering the flexibility of gear box, gear pair and wheel set, the authors studied the change rule of the dynamic response of the gear box with different curve passing parameters.
This is the most direct way to study the vibration and noise performance of the system to carry out field testing and verification of a traction gearbox by means of testing due to the complex structure of high-speed train traction gearboxes, frequent changes in operating conditions, severe external environment interference, and various internal excitation forms [10,11,12]. Hu et al. [13] carried out a systematic fracture analysis, a finite element analysis, and field test research on the gearbox of a high-speed train under actual stress and acceleration conditions, which showed that the wheel rail impact excited the resonance mode of the gearbox housing. Huang et al. [14] established a dynamic model of the traction system while considering the complex internal excitation such as the time-varying stiffness of the meshing gear pair and the gear transmission error and conducted a field test on a high-speed railway line. The results showed that the main vibration frequencies of the gearbox were the meshing frequency and the harmonic frequency when the train was running at high speed. Li [15] studied the dynamic characteristics and fatigue reliability of a gearbox housing of high-speed train based on measured data and analyzed the influence law of different output torques of the motor on the fatigue strength of a gearbox housing. Wang et al. [16,17] established a multi-body dynamic model of a high-speed train with a gear transmission system in which gear meshing, elastic deformation of the gearbox housing, and polygonal wear of the wheels were considered. The results of the dynamic model were compared with the results of a field test to verify the dynamic performance of the whole system. Wu et al. [18] established a three-dimensional multi-body system (MBS) railway vehicle model that took into account the flexible and nonlinear wheel–rail contact of the gearbox and wheelset, carried out a finite element analysis and a multi-body dynamic analysis, and carried out field measurement of wheel wear. The results showed that the deformation of the wheelset had a significant effect on the stress distribution of the gearbox housing. Yang et al. [19] conducted a line test on a gearbox in the Wuhan Guangzhou passenger dedicated line and analyzed the characteristic response through vibration analysis methods such as acceleration amplitude spectrum and equivalent acceleration amplitude, which provided a reference for ensuring the safety of high-speed train transmission systems and the design of new structures of the box. Zhai [20] conducted field tests on a 350 km/h high-speed train and showed that wheel–rail excitation had a great impact on the vibration of the car body’s parts. Zhang [21] used Romax Designer to establish a helical gear transmission model. Under the given working conditions, the driving gear (pinion) was micro-geometrically modified based on the transmission error curve, the load distribution on the tooth surface, and the maximum contact stress distribution on the tooth surface. Zhang [22] proposed to consider the influence of track irregularity excitation on the dynamic characteristics of an electromechanical coupling system and took the time-varying meshing stiffness of gears under different health conditions as the internal excitation of the system to study the dynamic characteristics of an electromechanical coupling model under constant load conditions and track irregularity excitation conditions.
In this paper, a gear transmission system dynamic model of a high-speed train will be established first, and then the dynamic response results of some important nodes in the transmission system will be given. The fourth part describes the testing method of the test rig. The Section 5 analyzes the vibration acceleration, vibration velocity, and air noise of the gearbox as measured by the test. The last section summarizes the whole paper.

2. Dynamic Model of Traction Gear Transmission System

The dynamic model was the basis of studying the dynamic characteristics and vibration response of the high-speed railway traction gearbox. Based on the finite element method, the Euler–Bernoulli beam was used to establish the dynamic model of the high-speed railway traction gear transmission system. Firstly, the system was divided into four types of units, namely the shaft segment unit, gear meshing unit, bearing unit, and motor unit. Then, the dynamic models of the above four types of units were established and finally assembled into the system dynamics model.

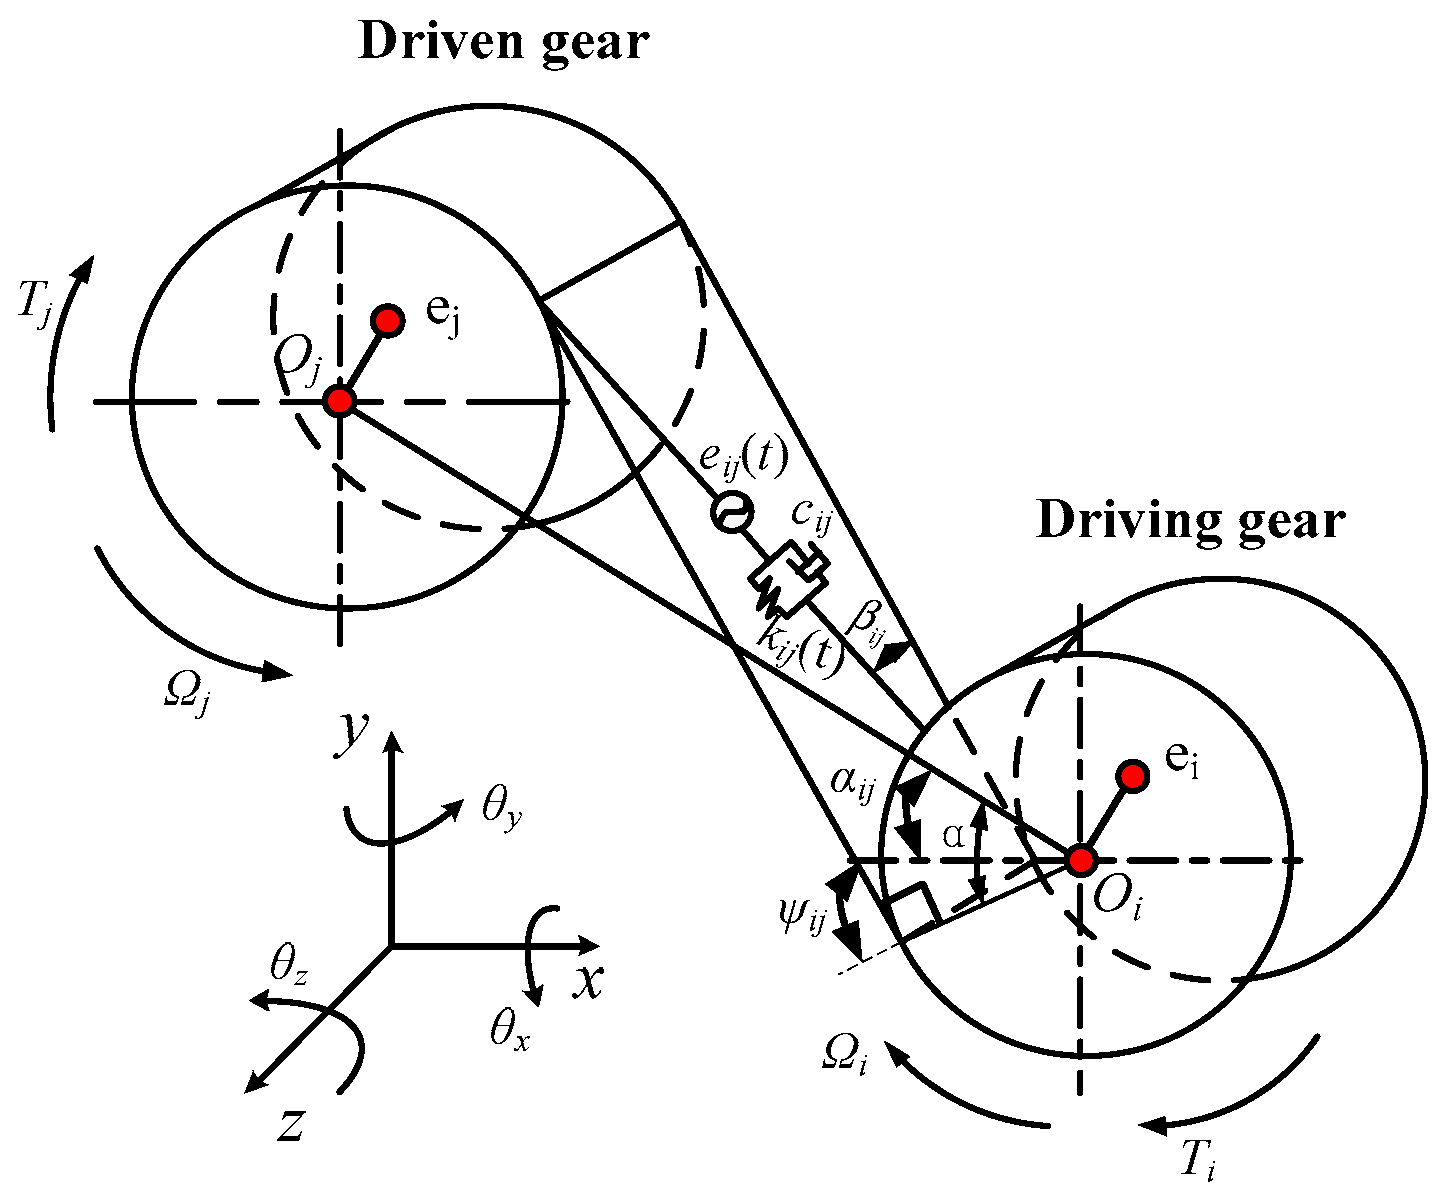
2.1. Gear Meshing Unit Model

Gear meshing is the main source of internal excitation of a traction gearbox, and the main causes of vibration are the gear meshing stiffness and gear meshing error.
Figure 1 shows the meshing element model of a helical gear pair: kij(t) represents the time-varying meshing stiffness; βij is the spiral angle; eij(t) is the dynamic transmission error; αij represents the orientation angle of the gear, which is the angle between the gear center line and the X-axis positive direction; and ψij is the direction angle from the Y-axis positive direction to the meshing surface.

2.1.1. Parameters of Gear Pair

High-speed trains have both forward and backward operation, and there are also two ways to operate the gear pair: a clockwise rotation and an anticlockwise rotation of the input shaft when viewed from the input shaft side direction. Under the rated load condition, the operating power of the traction gearbox of the high-speed train was 560 kW, and the maximum operating power was 670 kW.
The output shaft of the high-speed motor rotated at 4100 rpm, and the output torque was 1300 Nm. At the output side of the wheel shaft, the speed was 1688 rpm and the torque was 3160 Nm. When the gearbox worked at the rated speed of 4100 rpm, the input shaft rotation frequency was 68.3 Hz (fZ1), the output shaft rotation frequency was 28.0 Hz (fZ2), and the meshing frequency was 2391.7 Hz (fN). The basic design parameters of the traction gearbox gear pair of the high-speed train are shown in Table 1.

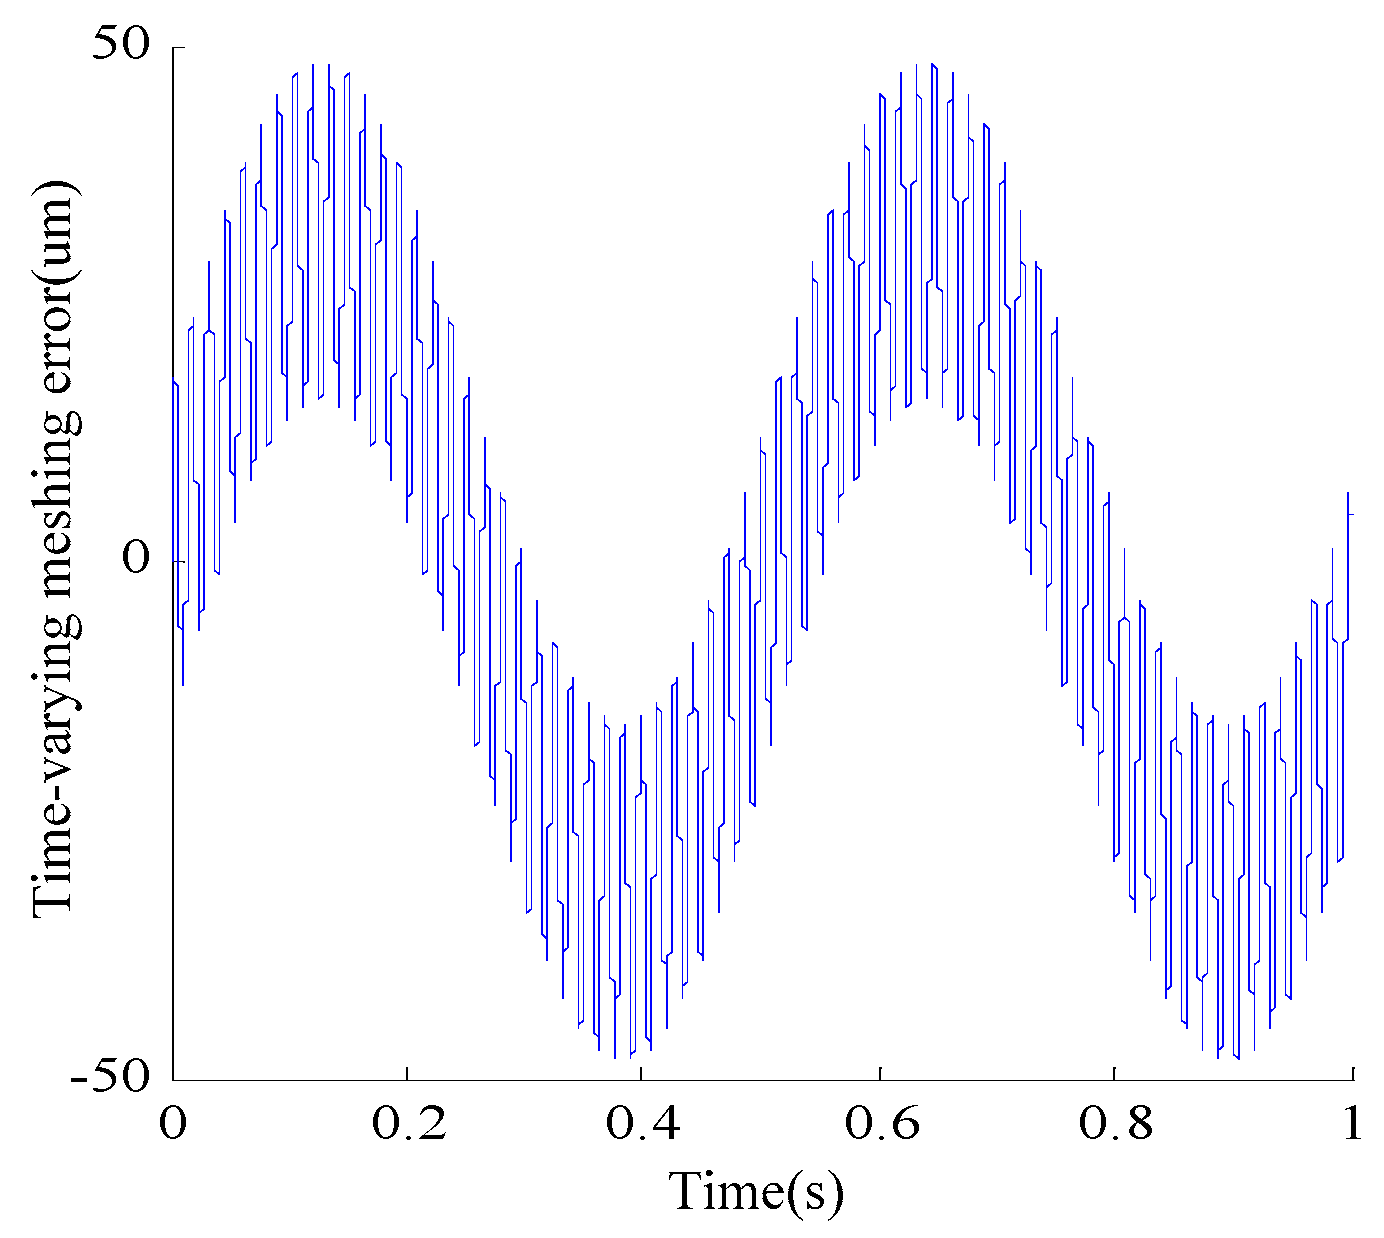
2.1.2. Time-Varying Meshing Stiffness and Time-Varying Meshing Error

The meshing curve of the helical gear transmission was not only relatively smooth but also had no step change. The meshing stiffness of the helical gear was expanded into the form of a Fourier series, and the mean term and first-order harmonic component term of the meshing stiffness were retained.
k = k m + k ˜ m sin 2 π ω m t
where k m represents mean meshing stiffness, k ˜ m is the amplitude of the meshing stiffness, and ω m is gear meshing frequency.
We calculated the mean value of the meshing stiffness according to the ISO standard in the Mechanical Design Manual.
k m = ( 0.75 ε a + 0.25 ) C M C R C B cos β / q q = 0.04723 + 0.15551 z v 1 + 0.25791 z v 2 0.00635 x n 1 0.11654 x n 1 z v 1 0.00193 x n 2 0.24188 x n 2 z v 2 + 0.00529 x 1 2 + 0.00182 x 2 2 C M = 0.8 C R = 1 C B = [ 1 + 0.5 ( 1.2 h f p / m n ) ] × [ 1 0.02 ( 20 α n ) ]
The time-varying meshing stiffness curve was determined at the rated operating conditions as shown in Figure 2.
The gears of the high-speed rail traction gear transmission system reached five levels of accuracy, and the tangential comprehensive total tolerance was taken as the meshing error of the gear teeth.
F i = F p + f i F p = 0.3 m n + 1.25 d + 7 f i = K ( 9 + 0.3 m n + 3.2 m n + 0.34 d )
where K = 0.2 · (εr+4)/εr · (εr < 4), K = 0.4 · (εr ≥ 4), Fi′ is the gear tangential comprehensive total tolerance, Fp is the tolerance of the cumulative total deviation in the tooth pitch, fi′ is the one-tooth tangential comprehensive tolerance, mn is the normal modulus, d is the diameter of the dividing circle, and εr is the total coincidence.
The gear time-varying meshing error was shown in Figure 3. The time-varying meshing error can be approximated as the superposition of the harmonic function of the shaft frequency and the meshing frequency:
e t = 0.5 F p sin 2 π ω f t + ψ f + 0.5 f i sin 2 π ω m t + φ m
where e(t) is the meshing error; ωf and ωm are the shaft frequency and meshing frequency, respectively; and ψf and φm are the corresponding initial phases.

2.1.3. Mathematical Model of Helical Gear Pair Meshing

When the gear was running, the direction of dynamic loading determined the direction of the meshing surface:
ψ i j = α ± α i j
The direction of the action surface was defined by the direction of the torque T i acting on the driving gear:
β i j β j k > 0     The   driven   gear   is   left - handed < 0     The   driven   gear   is   right - handed
The gear pair had 12 DOFs, and each gear contained x, y, and z DOFs of movement and three DOFs of rotation (θx, θy, and θz). According to Newton’s second law, the motion equation is:
m i x ¨ i + k ij p ij ( t ) cos β ij sin ψ ij = 0 m i y ¨ i + k ij p ij ( t ) cos β ij cos ψ ij = 0 m i z ¨ i k ij p ij ( t ) sin β ij = 0 I i θ ¨ xi + r i k ij p ij ( t ) sin β ij sin ψ ij = 0 I i θ ¨ yi + r i k ij p ij ( t ) sin β ij cos ψ ij = 0 J i θ ¨ zi + r i k ij p ij ( t ) cos β ij = T i m j x ¨ j k ij p ij ( t ) cos β ij sin ψ ij = 0 m j y ¨ j k ij p ij ( t ) cos β ij cos ψ ij = 0 m j z ¨ j + k ij p ij ( t ) sin β ij = 0 I j θ ¨ x j + r j k ij p ij ( t ) sin β ij sin ψ ij = 0 I j θ ¨ y j + r j k ij p ij ( t ) sin β ij cos ψ ij = 0 J j θ ¨ z j + r j k ij p ij ( t ) cos β ij = T i
where P i j t represents the relative position of the gear meshing normal to the contact surface as shown in Equation (8).
p i j ( t ) = x i sin ψ ij x j sin ψ ij + y i cos ψ ij y j cos ψ ij + r i θ z i     + r j θ z j + z i + z j + r i θ x i sin ψ ij + r j θ x j sin ψ ij     + r i θ y i cos ψ ij + r j θ y j cos ψ ij e i j ( t )
The generalized displacement matrix of the system is defined as:
x i j = [ x i y i z i θ x i θ y i θ z i x j y j z j θ x j θ y j θ z j ] T
Put Equation (6) into matrix form as:
M i j x ¨ i j + C i j x ˙ i j + K i j x i j = F i j
where Mij is the mass matrix of the gear pair, which is as follows:
M i j = d i a g ( m i m i m i I i x I i y I i z m j m j m j I j x I j y I j z )
where m i represents the mass of the driving gear; I i x , I i y , and I i z respectively represent the rotational inertia of the driving gear around the X-axis, Y-axis, and Z-axis. Other symbols indicate the corresponding parameters of the driven gear.
F i i + 1 is the external force vector of the gear pair as shown in Equation (12):
F ( i ) ( i + 1 ) = [ ( f 1 ) ( i ) ( i + 1 ) ( f 2 ) ( i ) ( i + 1 ) ] T     ( i = 1 , 3 , , ( 2 N 3 ) )
In Formula (11), f1~f12 are as follows (13):
f 1 = k ij cos β ij sin ψ i j p ij ( t ) f 2 = k ij cos β ij cos ψ i j p ij ( t ) f 3 = k ij sin β ij p ij ( t ) f 4 = r i k ij sin β ij sin ψ i j p ij ( t ) f 5 = r i k ij sin β ij cos ψ i j p ij ( t ) f 6 = r i k ij cos β ij p ij ( t ) + T i f 7 = k ij cos β ij sin ψ i j p ij ( t ) + k j k cos β j k sin ψ j k p j k ( t ) f 8 = k ij cos β ij cos ψ i j p ij ( t ) k j k cos β j k cos ψ j k p j k ( t ) f 9 = k ij sin β ij p ij ( t ) k j k sin β j k p j k ( t ) f 10 = r i k ij sin β ij sin ψ i j p ij ( t ) + r k k j k sin β j k sin ψ j k p j k ( t ) f 11 = r i k ij sin β ij cos ψ i j p ij ( t ) + r k k j k sin β j k cos ψ j k p j k ( t ) f 12 = r j k ij cos β ij p ij ( t ) + r j k j k cos β j k p j k ( t ) + T j
Kij is the gear meshing stiffness matrix as shown in Equations (14) and (15):
K i j = k i j a ij T a i j
[ a i j ] = [ sin ψ i j cos β i j cos ψ i j cos β i j sin β i j r i sin ψ i j sin β i j r i cos ψ i j sin β i j r i cos β i j sin ψ i j cos β i j cos ψ i j cos β i j sin β i j r i sin ψ i j sin β i j r i cos ψ i j sin β i j r i cos β i j ]
Cij is the meshing damping matrix of the gear as shown in Equations (16) and (17):
C i j = c i j a i j T a i j
c i j = 2 ξ k ij / 1 / m e q i + 1 / m e q j
where ξ represents the meshing damping ratio, which generally ranges from 0.03 to 0.17; kij is the meshing stiffness of the gear; m e q , ( i , j ) = I z ( i , j ) / r ( i , j ) is the equivalent mass of the gear; and r(i,j) is the radius of the gear-dividing circle.

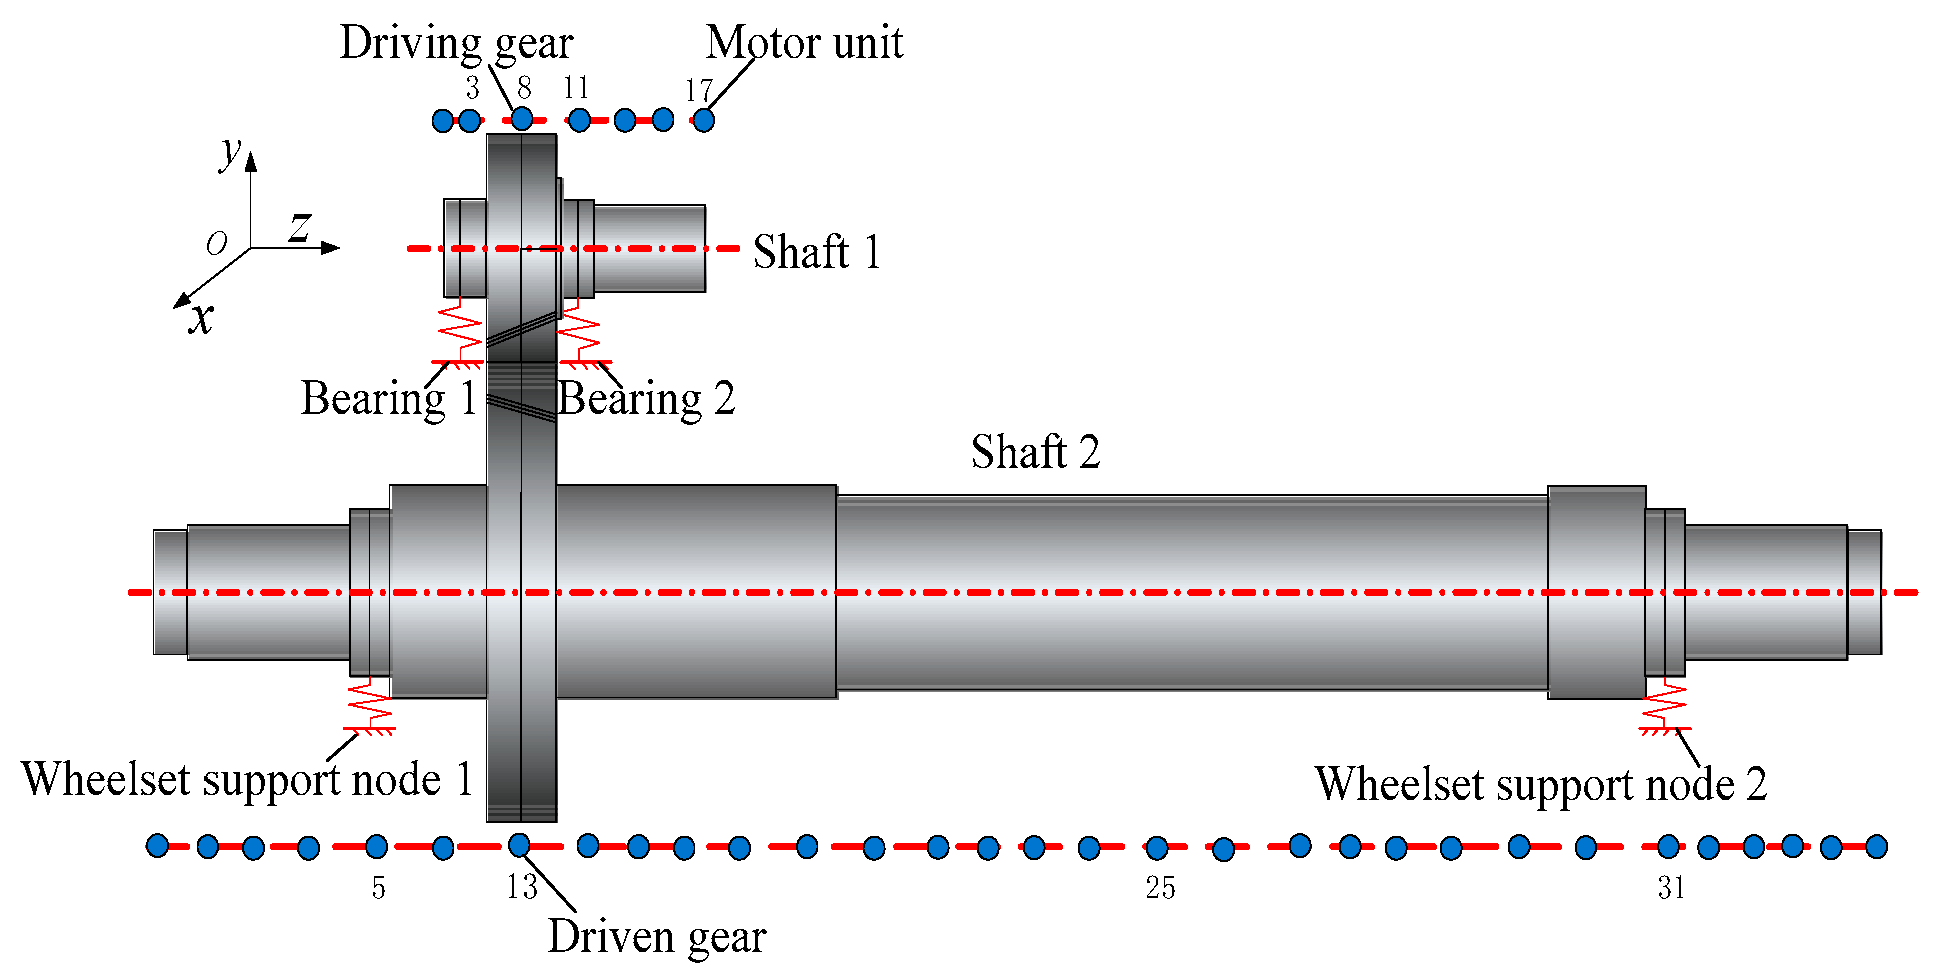
2.2. Transmission System Dynamics Model

According to the finite element theory and the improved Euler–Bernoulli beam theory, the shaft element of the transmission system can obtain the mass matrix, stiffness matrix, and gyroscopic matrix of the element. Due to the high rigidity of the high-speed rail traction gearbox, a universal bearing stiffness matrix was used to establish the bearing unit model. Through the concentrated mass method, only the motor mass and rotational inertia were considered to obtain the motor unit model.
The overall finite element model of the high-speed rail traction gear transmission system was established as shown in Figure 4. Among the components, shaft 1 was divided into 17 units, bearing 1 was located at node 3, the driving wheel was located at node 8, bearing 2 was located at node 11, and the motor was located at node 17. Shaft 2 was divided into 35 units, wheel 1 was located at node 5, the driven wheel was located at node 13, and wheel 2 was located at node 31.

3. Dynamic Response of Traction Gear Transmission System

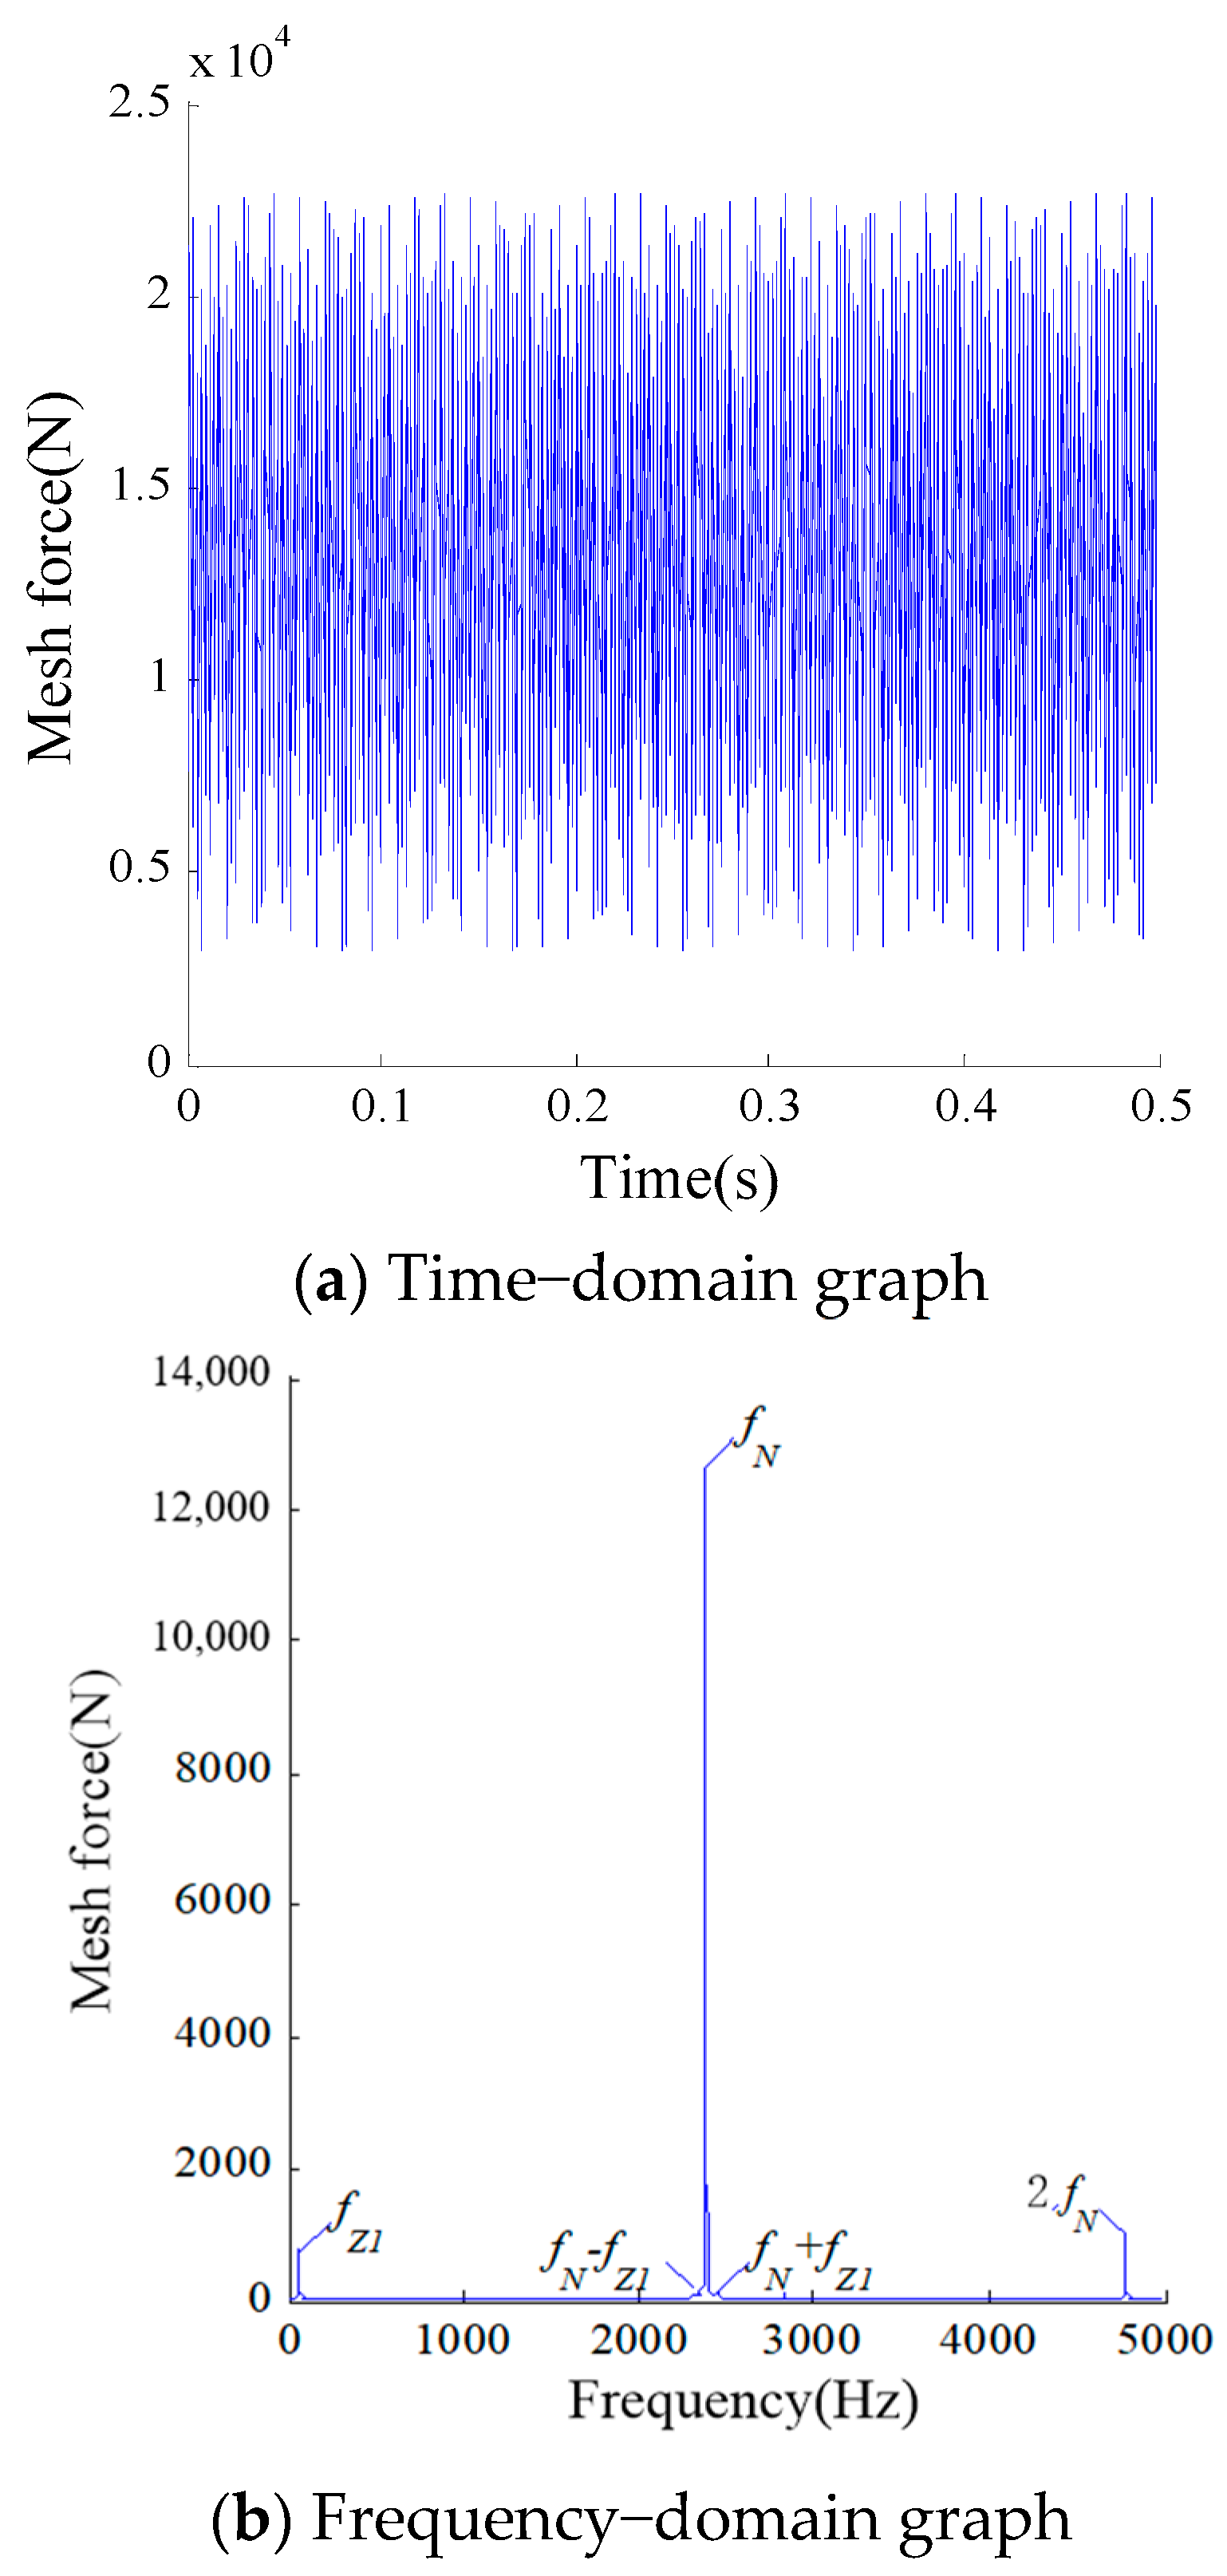
3.1. Gear Meshing Force

The time-domain and frequency-domain graphs of the dynamic meshing forces of the gears with time-varying meshing errors and time-varying meshing stiffness were obtained through calculation and are shown in Figure 5.
It can be seen in Figure 5 that the dynamic meshing force of the system had a maximum resonance peak at fN. The amplitude of the formant at fZ1 was far less than the amplitude of the formant at fN and close to the amplitude of the formant at 2fN. Due to the modulation phenomenon, small resonance peaks also appeared at fNfZ1 and fN + fZ1 on both sides of fN.

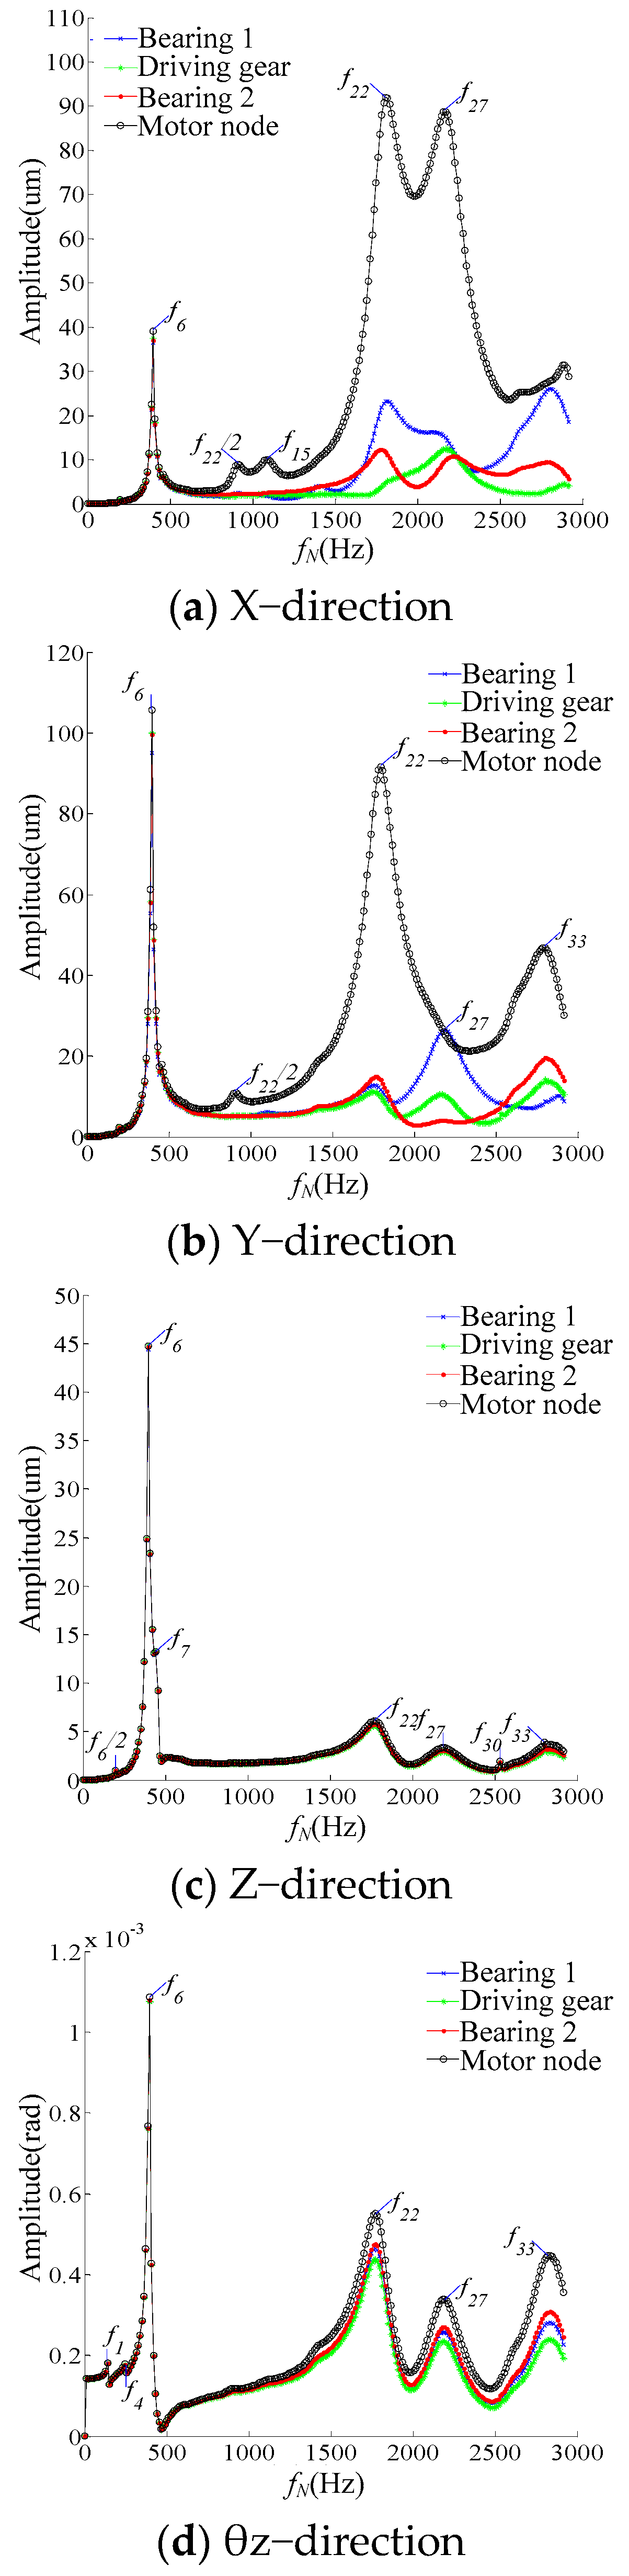
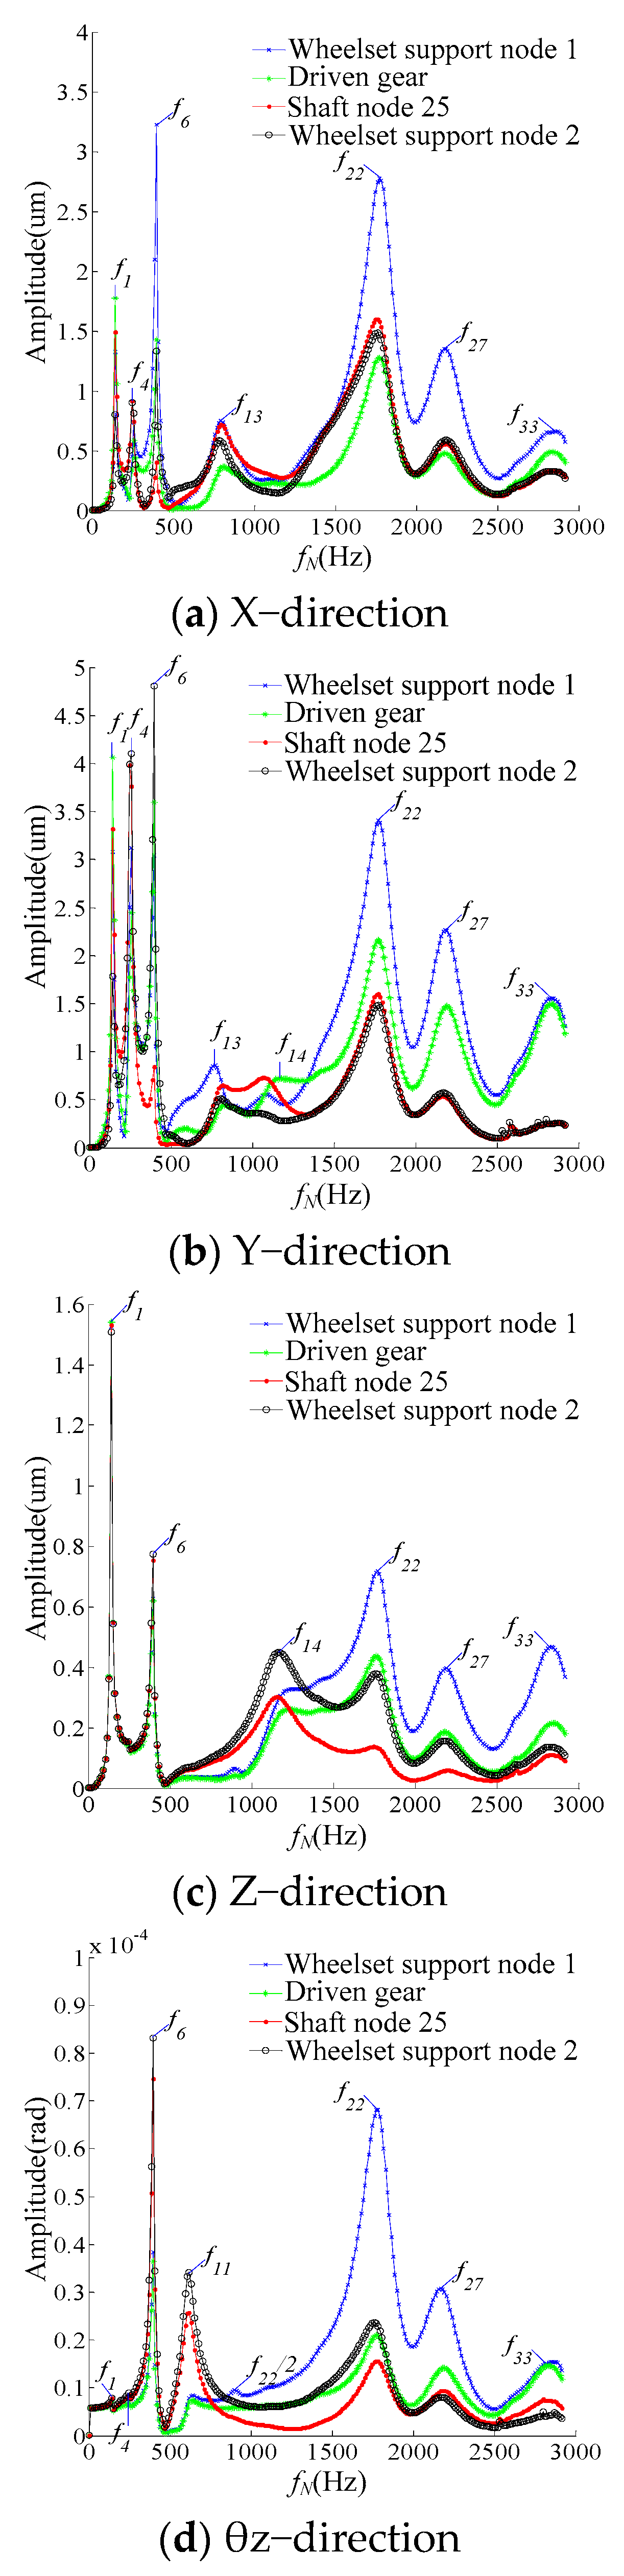
3.2. Vibration Response of the System Varying with the Rotational Speed

While considering the time-varying meshing stiffness and the time-varying meshing error excitation, the vibration response of the gear transmission system with the change in speed was obtained. When the speed was 0 rpm to 5000 rpm, the corresponding meshing frequency was 0 Hz to 2917 Hz. In the special positions of the shaft such as the gear, bearing, and motor, the vibration response was special and representative. Therefore, the amplitude frequency responses of these positions in the respective directions were counted as shown in Figure 6 and Figure 7.
As shown in Figure 6, when fN was equal to the system’s natural frequencies of f6, f15, f22, and f27, a resonance peak appeared in shaft 1. This phenomenon also occurred in other directions, which was just a different order of the system’s natural frequency.
As shown in Figure 7, when fN was equal to the system’s natural frequencies of f1, f4, f6, f13, etc., a resonance peak appeared in shaft 2. This phenomenon also occurred in other directions except that the order corresponding to the system natural frequencies was different. The maximum displacement amplitude of the amplitude–frequency response in all directions in the middle and high frequency bands appeared at the wheelset support node.
As a whole, the amplitude–frequency response displacement in shaft 1 was much larger than that in shaft 2.

4. Test Methods for Vibration and Noise
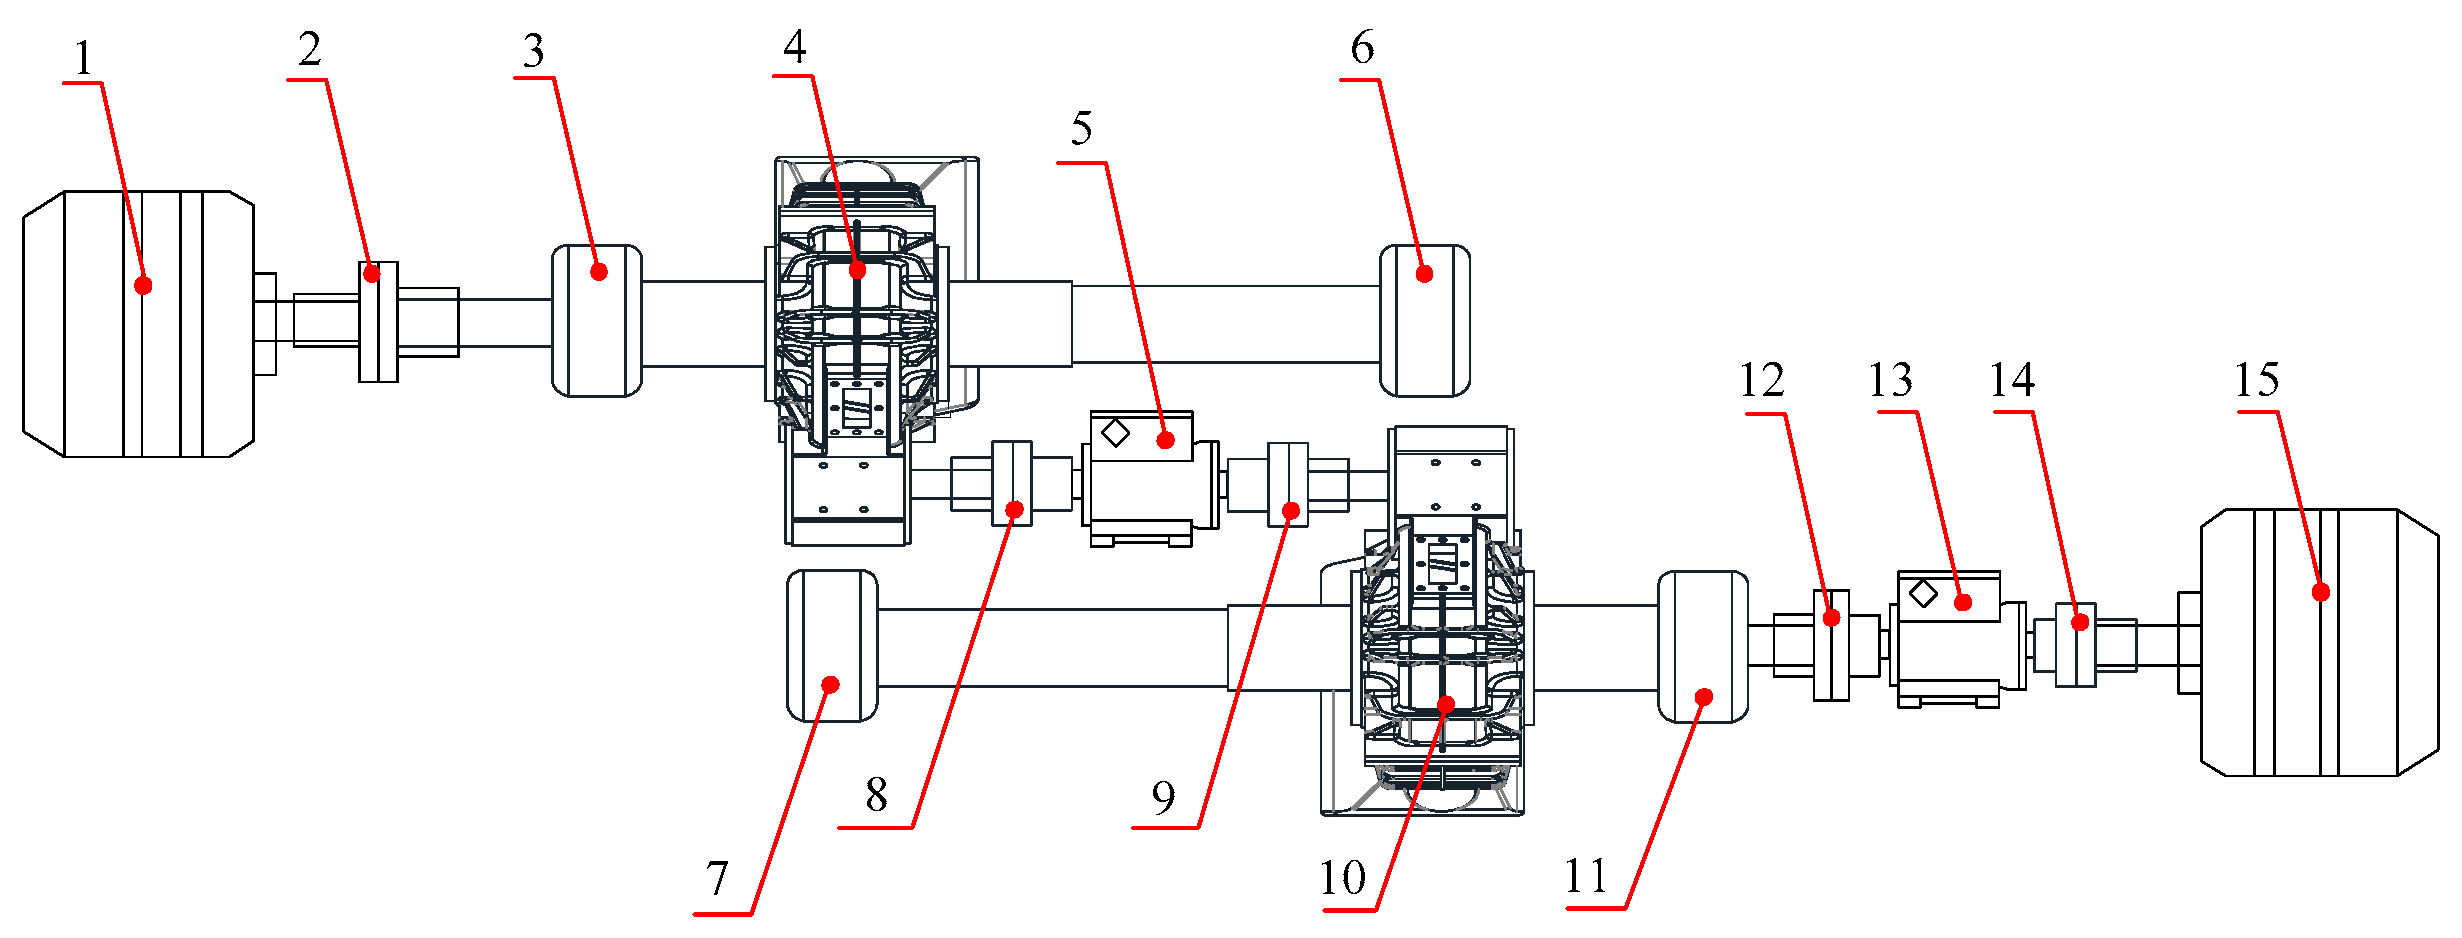
4.1. Test Equipment

Based on the principle of closed AC electric power, a high-speed train traction gearbox test rig was built. The two traction gearboxes were connected back-to-back. The speed-increasing gearbox increased the motor speed to the test speed of the test gearbox. The energy was returned to the system through the load generator to achieve the purpose of loading and saving energy. The layout of the test rig is shown in Figure 8.
The entire test system consisted of the following: drive motor, load generator, couplings, support bases, speed-increasing gearbox, test gearbox, torque sensors, eddy current displacement sensors, acceleration sensors, stress and strain gauges, steady current power supply, charge amplifiers, data collector, and computer. Because the rated speed of the test gearbox was slightly high, a speed-increasing gearbox was used as a speed increaser in the experiment. The load generator was used to simulate the output load torque. The signal collected by the sensors passed through the charge amplifier and entered the data collector, which then entered the computer for data processing and analysis. The gearbox test rig is shown in Figure 9 (support base, coupling, speed-increasing gearbox, and test gearbox).
During the test, 5 vibration acceleration measuring points were arranged at the bearing pedestal, and the vibration acceleration was tested in the X (transverse), Y (axial), and Z (vertical) directions of the 5 measuring points and assigned the numbers 1X, 1Y, 1Z, 2X, 2Y, 2Z, 3X, 3Y, 3Z, 4X, 4Y, 4Z, 5X, 5Y, and 5Z, respectively. The measuring points of the gearbox were arranged as shown in Figure 10. The names and models of the main testing equipment used in the test are shown in Table 2.

4.2. Test Method

(a).
Vibration acceleration test method
The vibration acceleration test method was carried out in accordance with TB/T 3134-2013 (“Drive Gearbox for High-Speed Train”) [23]. We calibrated all acceleration sensors, amplifiers, and automatic data-acquisition and processing systems before testing. We also polished and marked all measuring points specified on the gearbox and placed the magnetic base of the sensor on each measuring point. During the test, the acceleration and vibration signals measured by the BK4384 acceleration sensor under various operating conditions were amplified by the DLF-8 charge voltage filter integration amplifier and then entered into the INV 306U-5260 intelligent signal acquisition and processing analyzer for acquisition, recording, and analysis. Finally, the frequency-domain graph of the vibration acceleration for each measuring point was obtained.
(b).
Vibration intensity test method
The vibration intensity test method was carried out according to ISO 8579-2:1993 [24]. During the test, the acceleration vibration signal measured by the BK 4384 acceleration sensor at various operating conditions was amplified and integrated into the speed vibration signal by the DLF-8 charge voltage filter integration amplifier and then entered into the INV 306U-5260 intelligent signal collector. The processing analyzer collected, recorded, and analyzed using the DASPV10 signal processing system to obtain the effective value of the vibration speed of each measuring point at 10 Hz to 1 k Hz, and the vibration speed of the gearbox could be calculated.
(c).
Air noise test method
The air noise test method was carried out in accordance with TB/T 3134-2013 (“Drive Gearbox for High-Speed Train”). We used a sound-level meter to measure the A-weighted sound pressure level and 1/1 octave sound pressure level at each measurement point at the rated speed and rated load torque operation test conditions. The distance between each measuring point and the measuring surface was 1.0 m. Before the test, we used a standard noise source to calibrate the sound level meter, amplifier, and automatic data-acquisition and processing system. The sound pressure signal measured by the NL-42 sound level meter was collected and then recorded and analyzed by the INV 306U-5260 intelligent signal acquisition and processing analyzer, and the 1/1 octave band analysis was performed to obtain the 1/1 octave of each measurement point. Then, the logarithmic average was calculated for the air noise value of the sound pressure level of all measuring points to obtain the mean value of the air noise of the gear box 1/1 octave-A as well as the frequency-domain graph of air noise of sound pressure level.
According to the test requirements, 5 measuring points were arranged at a distance of 1.0 m from the gearbox (the measuring point numbers were 1~5), and the air noise at the 5 measuring points was tested. The sound pressure level frequency-domain graph (reference value: 2 × 10⁻⁵ Pa) was measured at the 1/1 octave center frequency in the range of 31.5 Hz~16 kHz at each measurement point. The layout of the measuring points is shown in Figure 11.

4.3. Test Conditions

The ambient temperature was 19.5 °C and the humidity was 37%. The experiment was divided into two conditions: anticlockwise rotation and clockwise rotation of the input shaft. The main purpose of the steady-state operating condition test under each condition was to collect the vibration response signal under the stable operating condition and obtain the dynamic characteristics of the operating condition. The steady-state operating condition could be divided into two operating conditions: the rated speed (variable torque) and the rated torque (variable speed). At the rated speed (4100 rpm), the input power was 139 kW, 279 kW, 419 kW, 560 kW, and 670 kW, respectively. At the rated load torque; that is, an input torque of the driving motor of 1300 Nm, the speeds were loaded according to the requirements in Table 3.

5. Test Results and Discussion

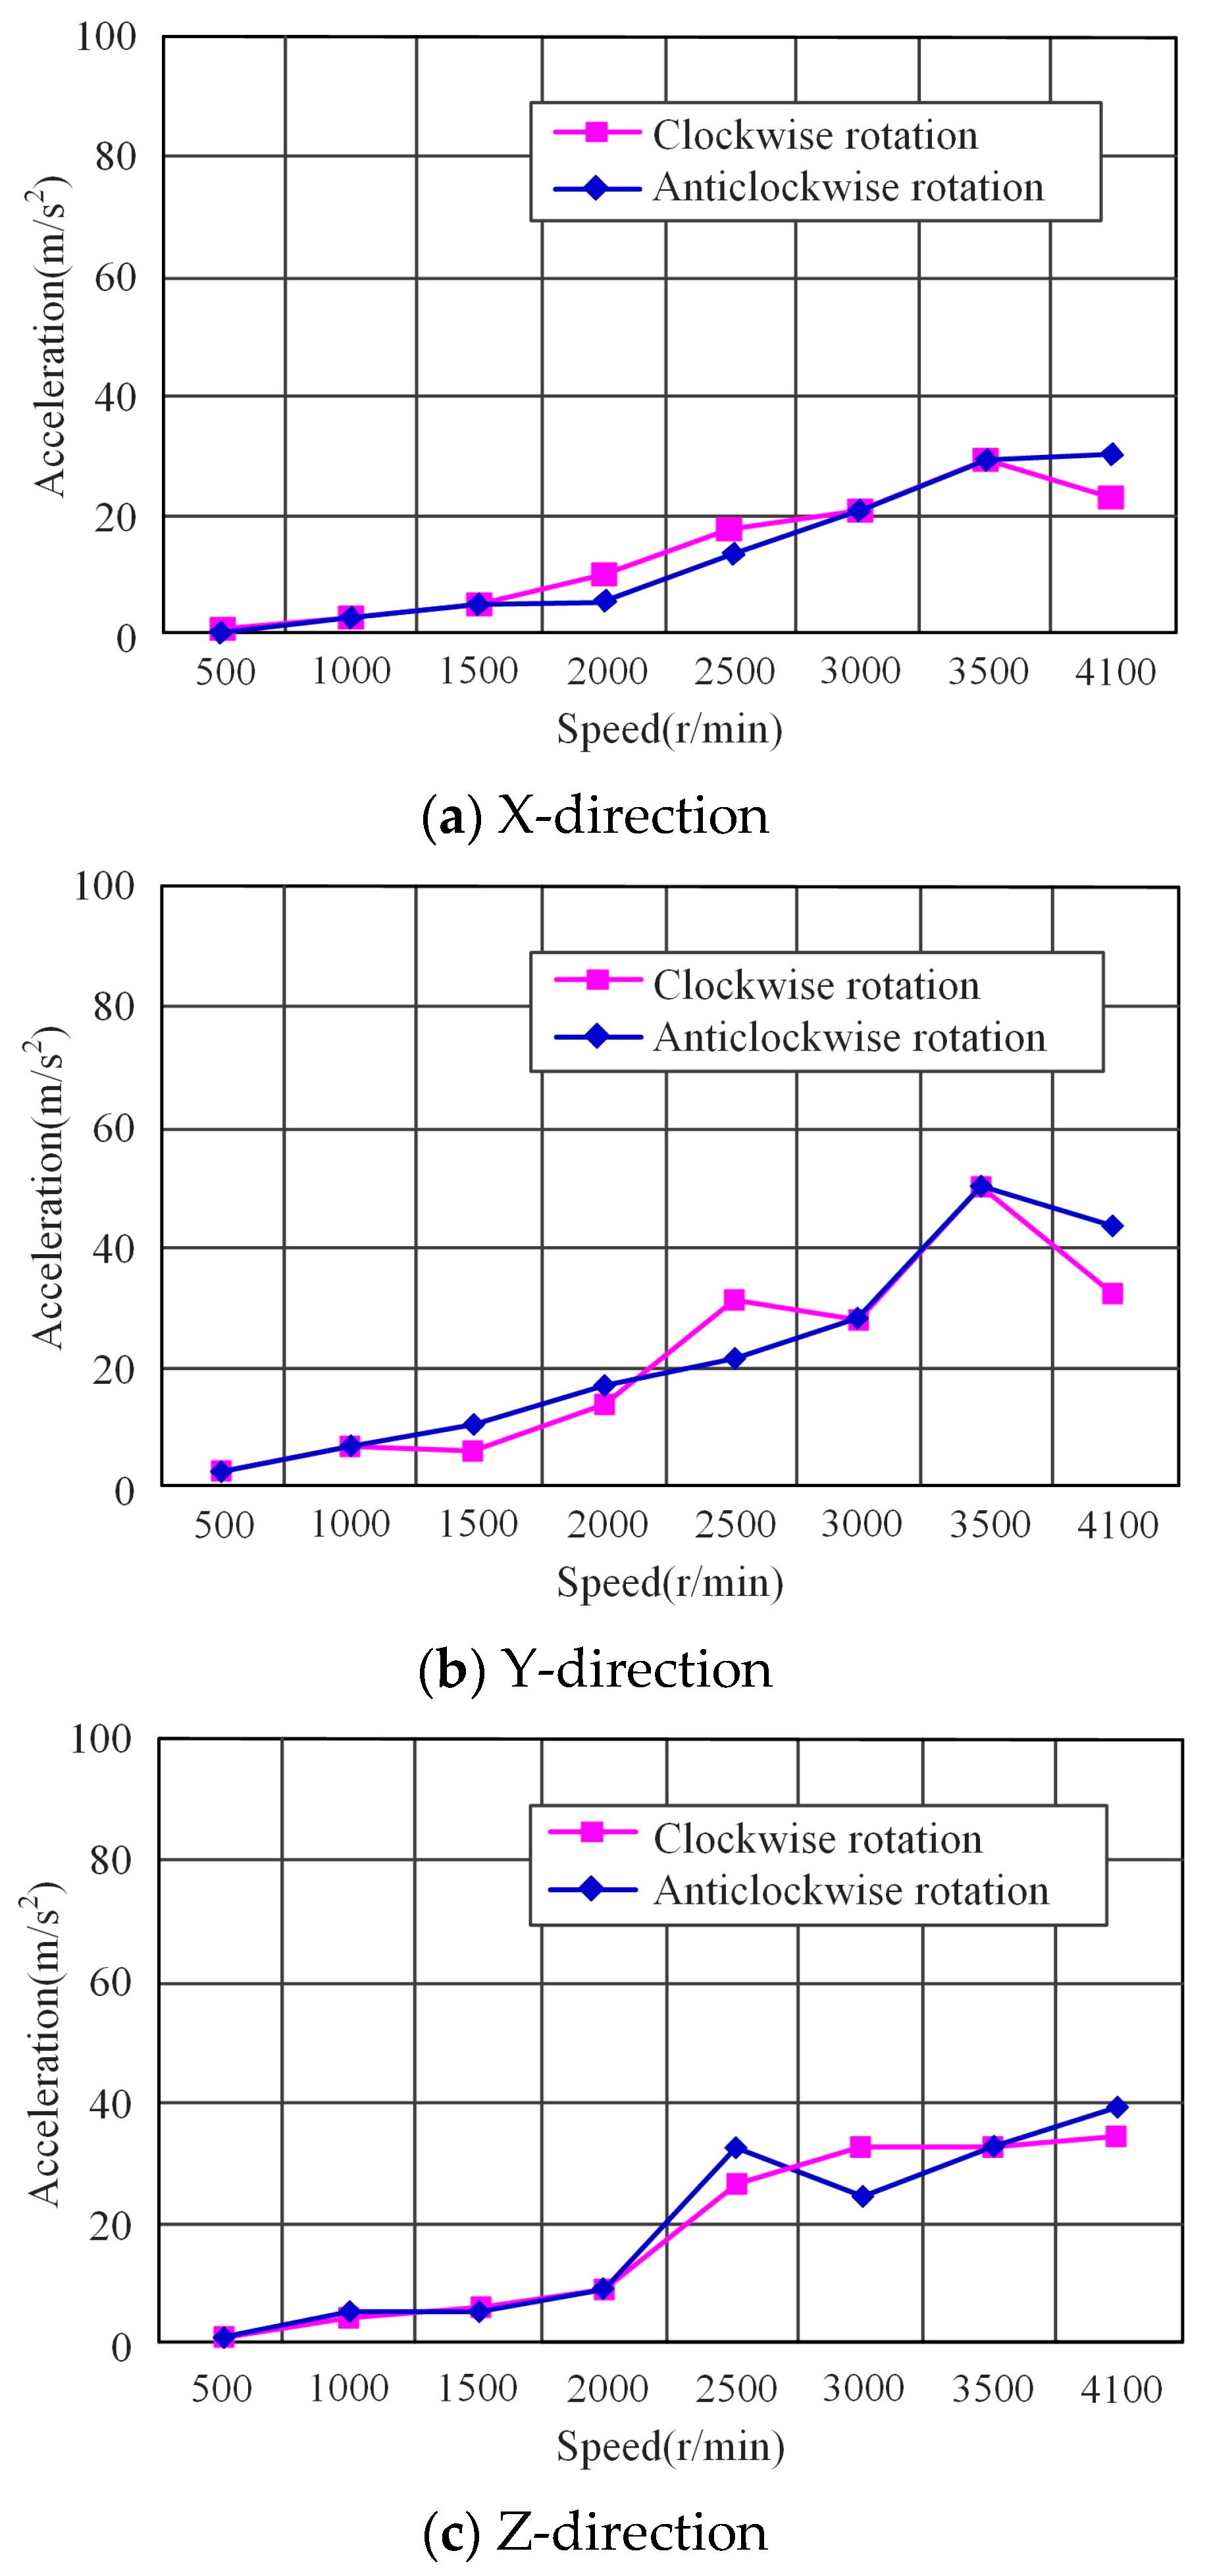
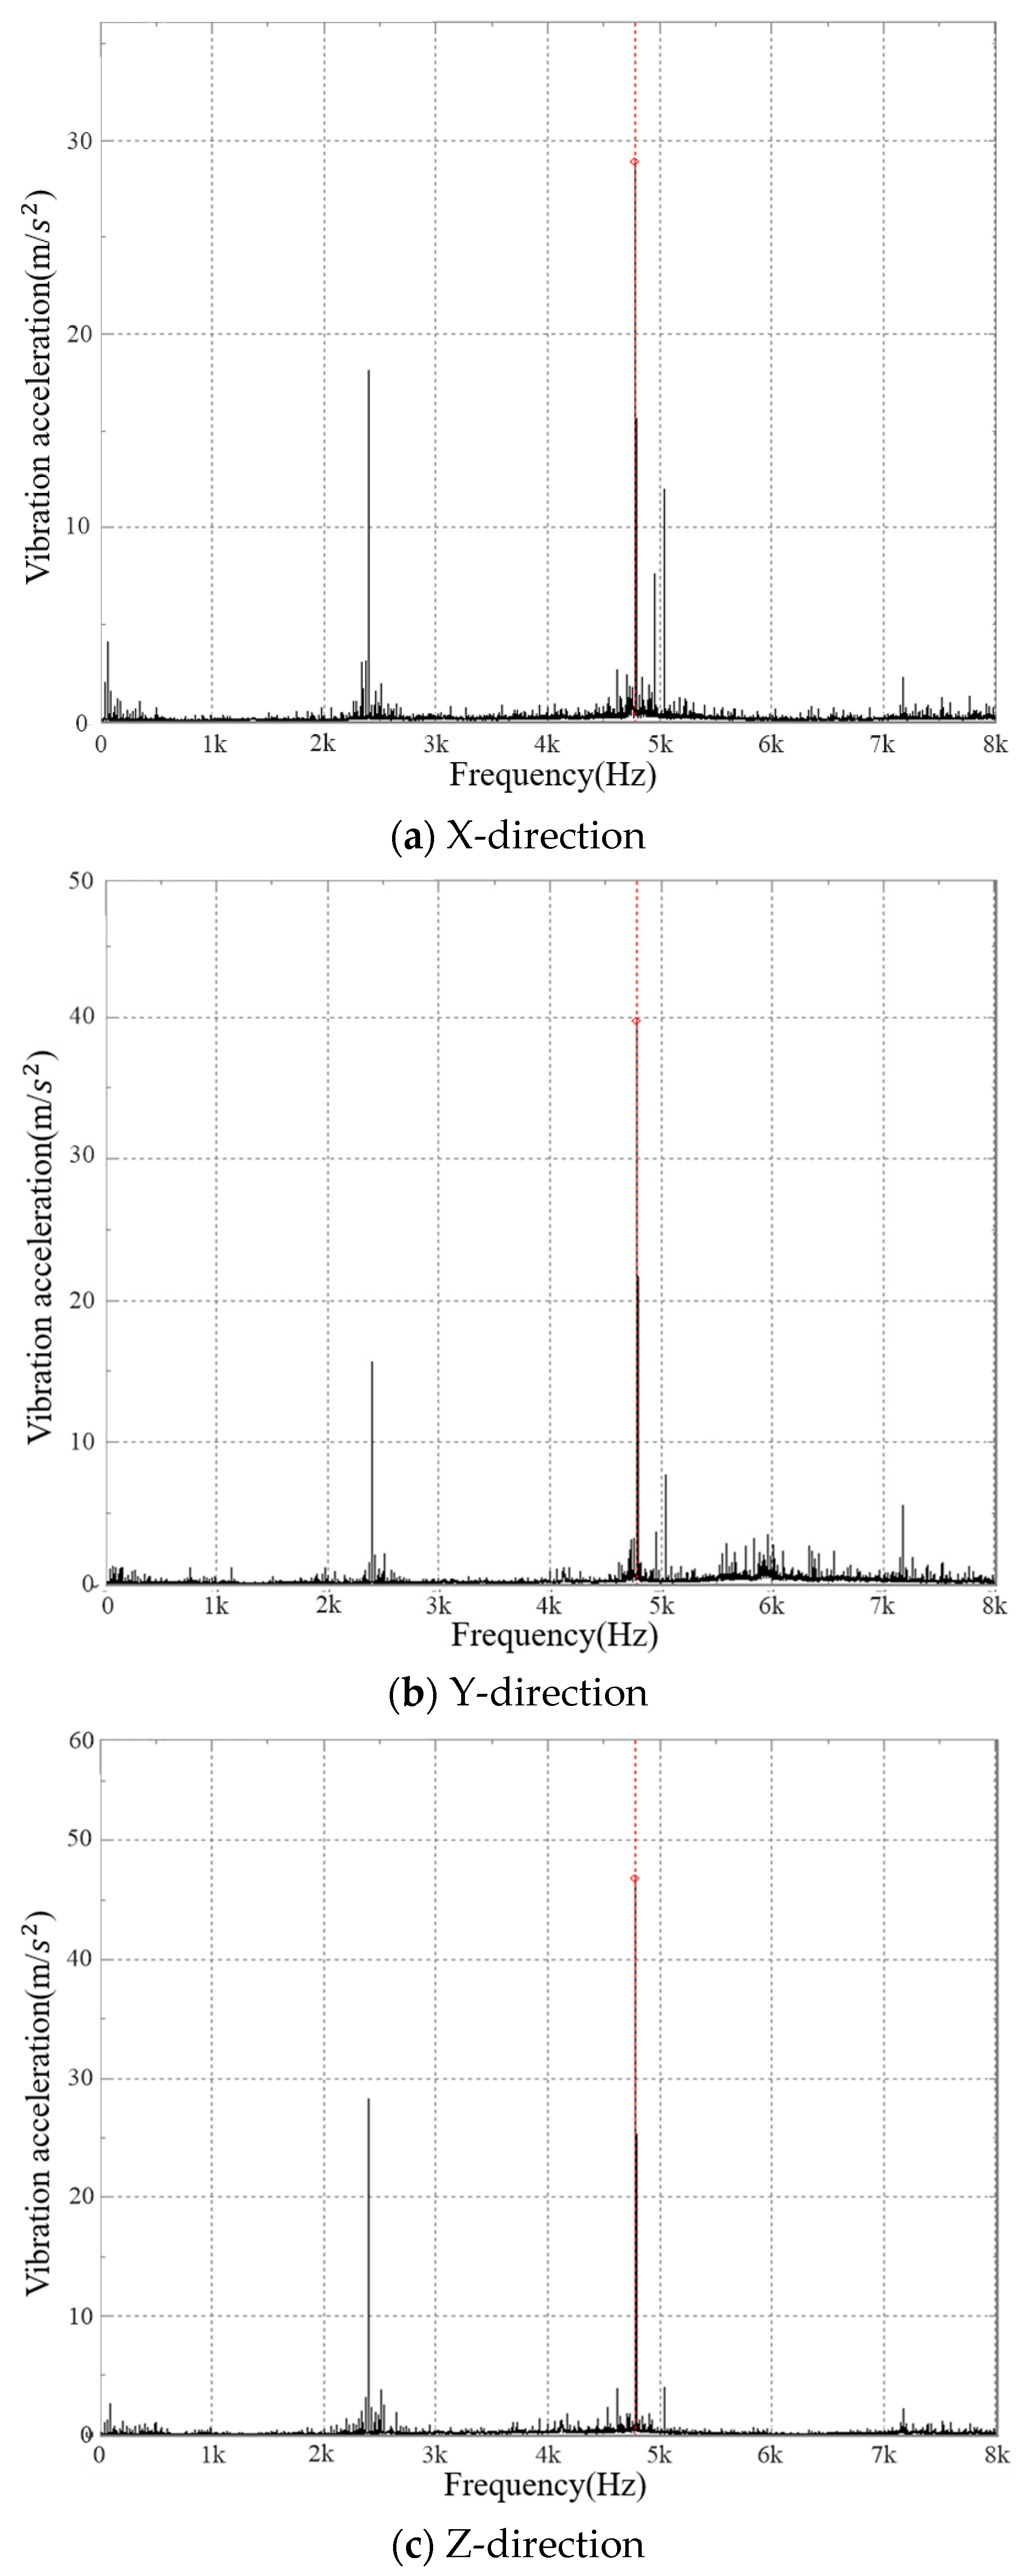
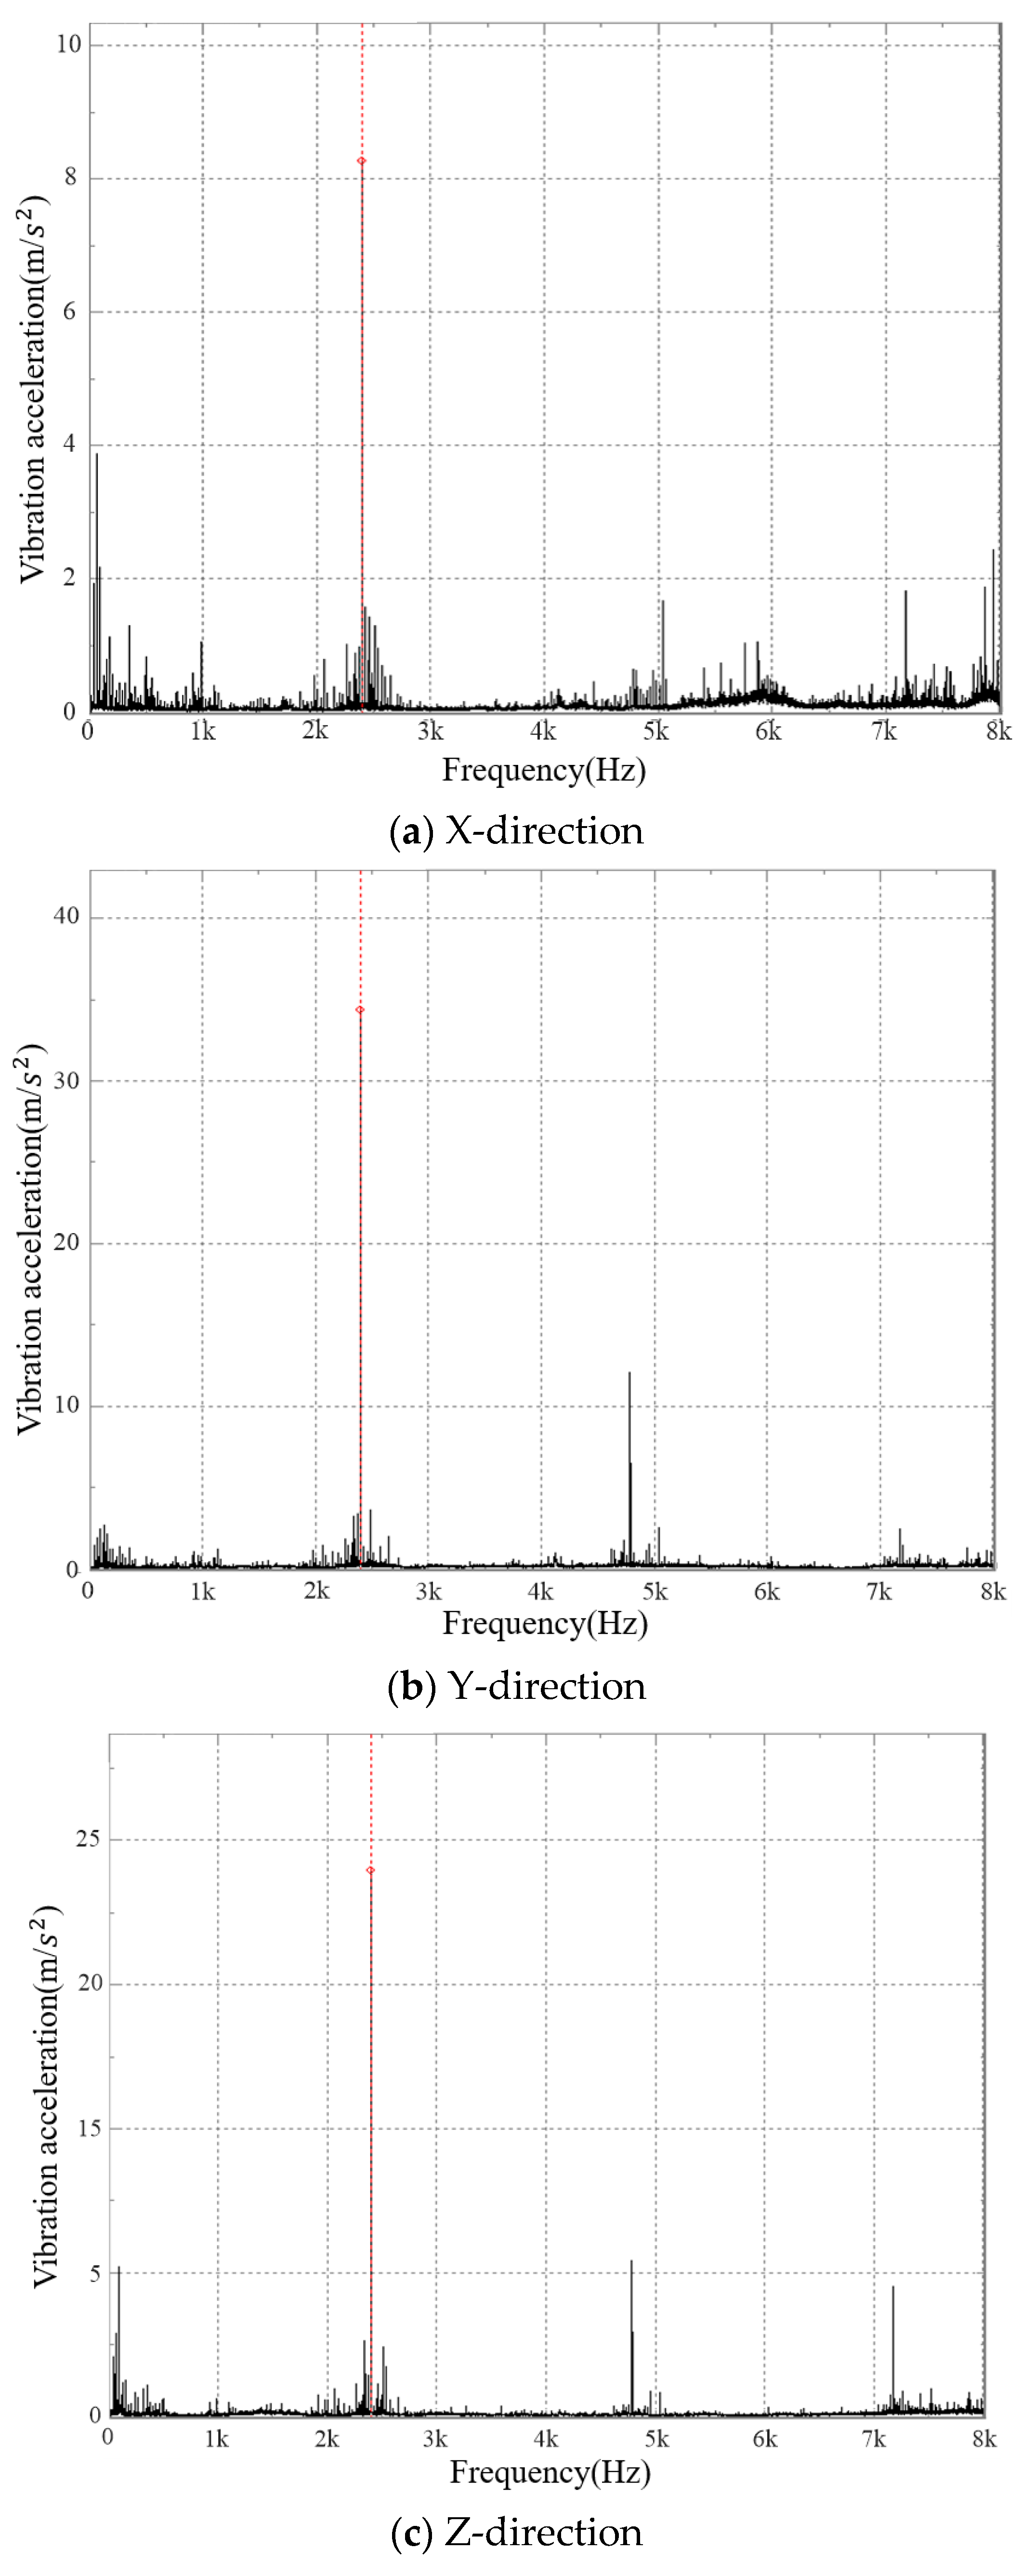
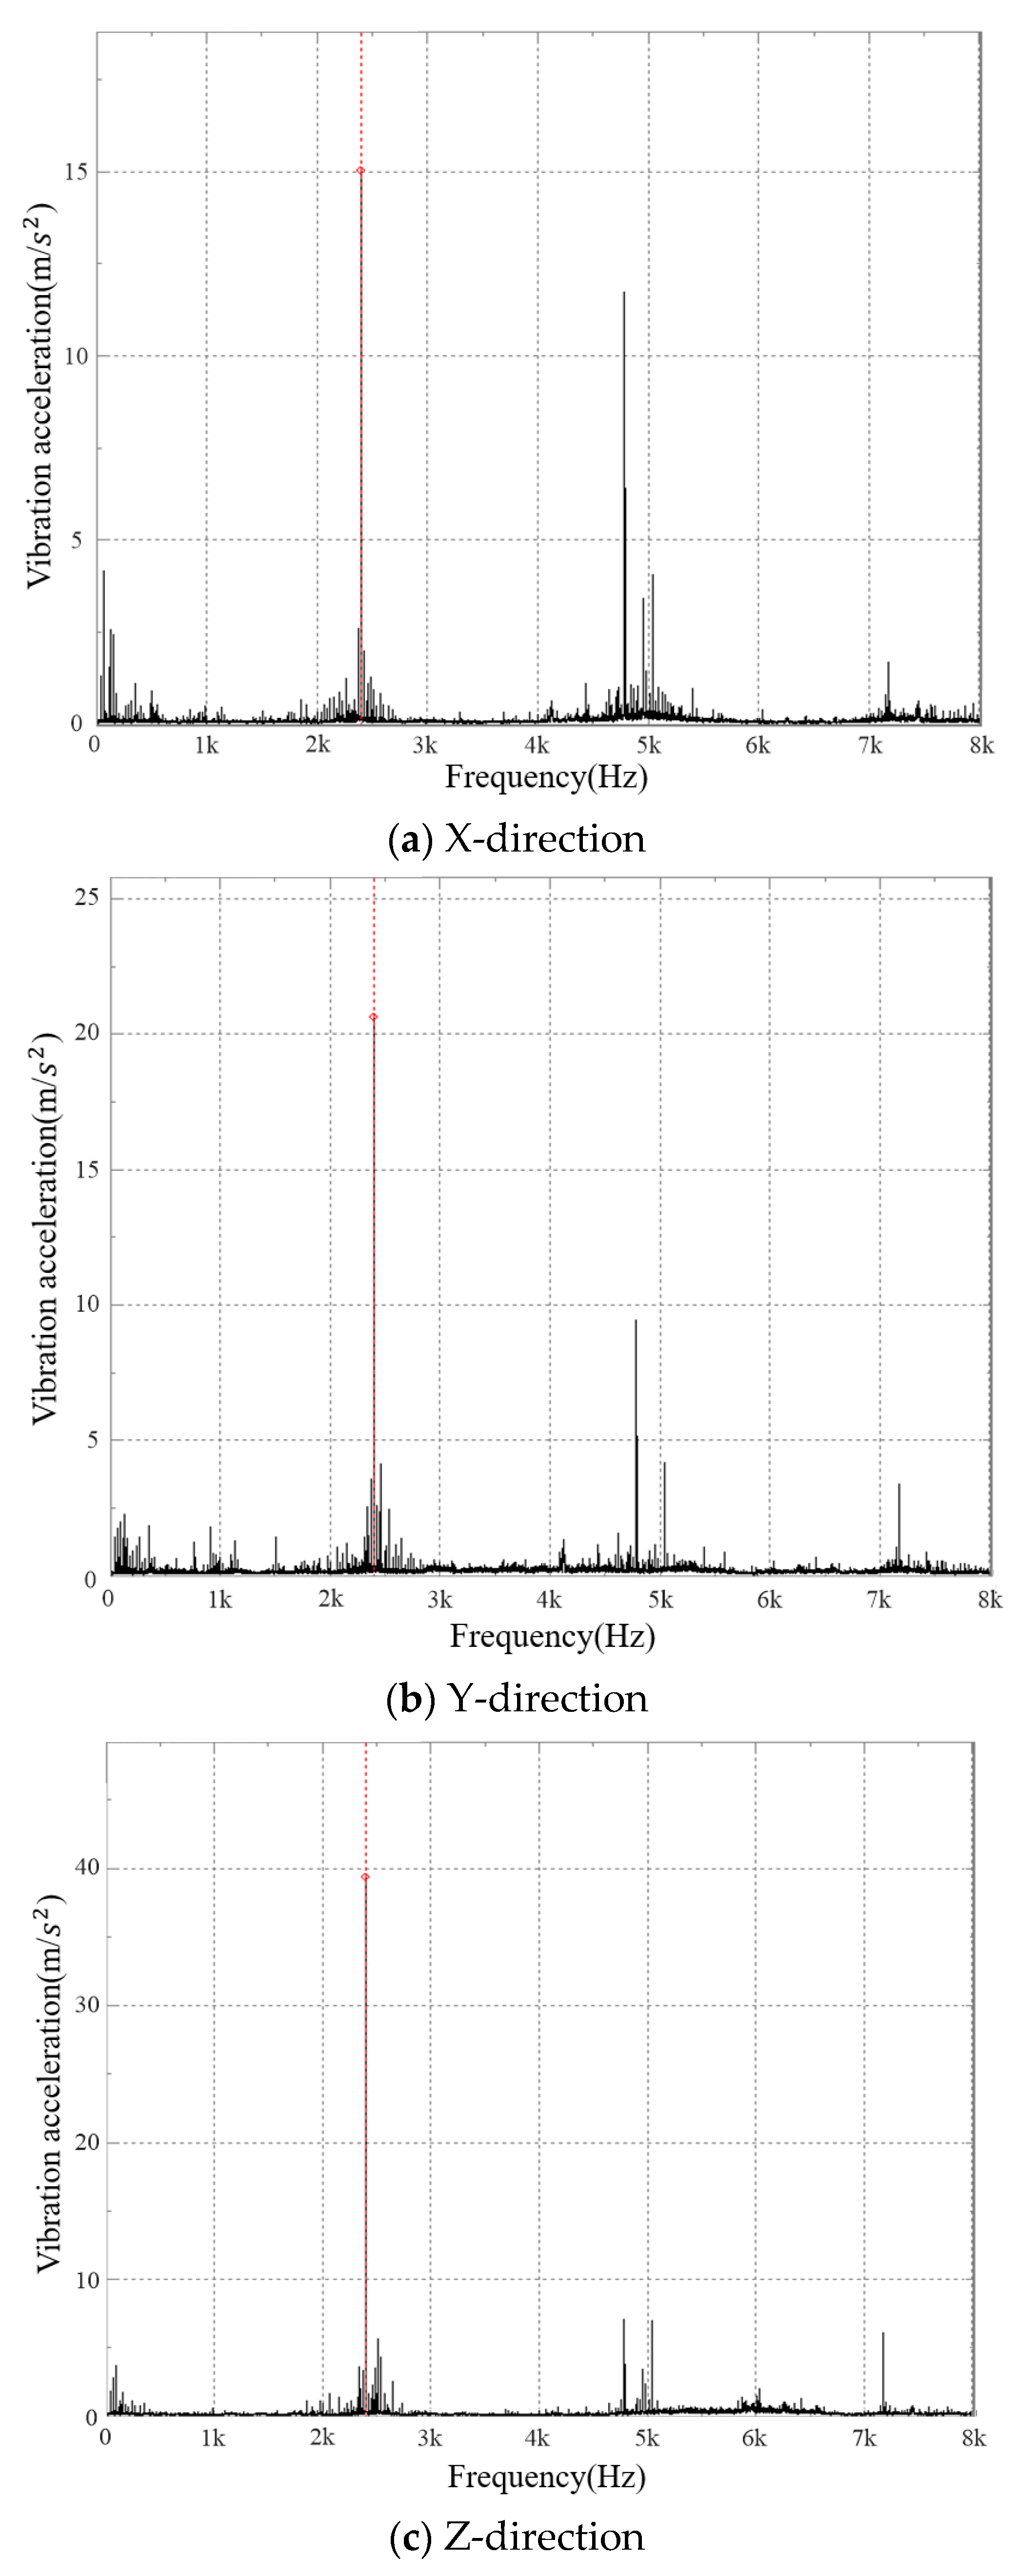
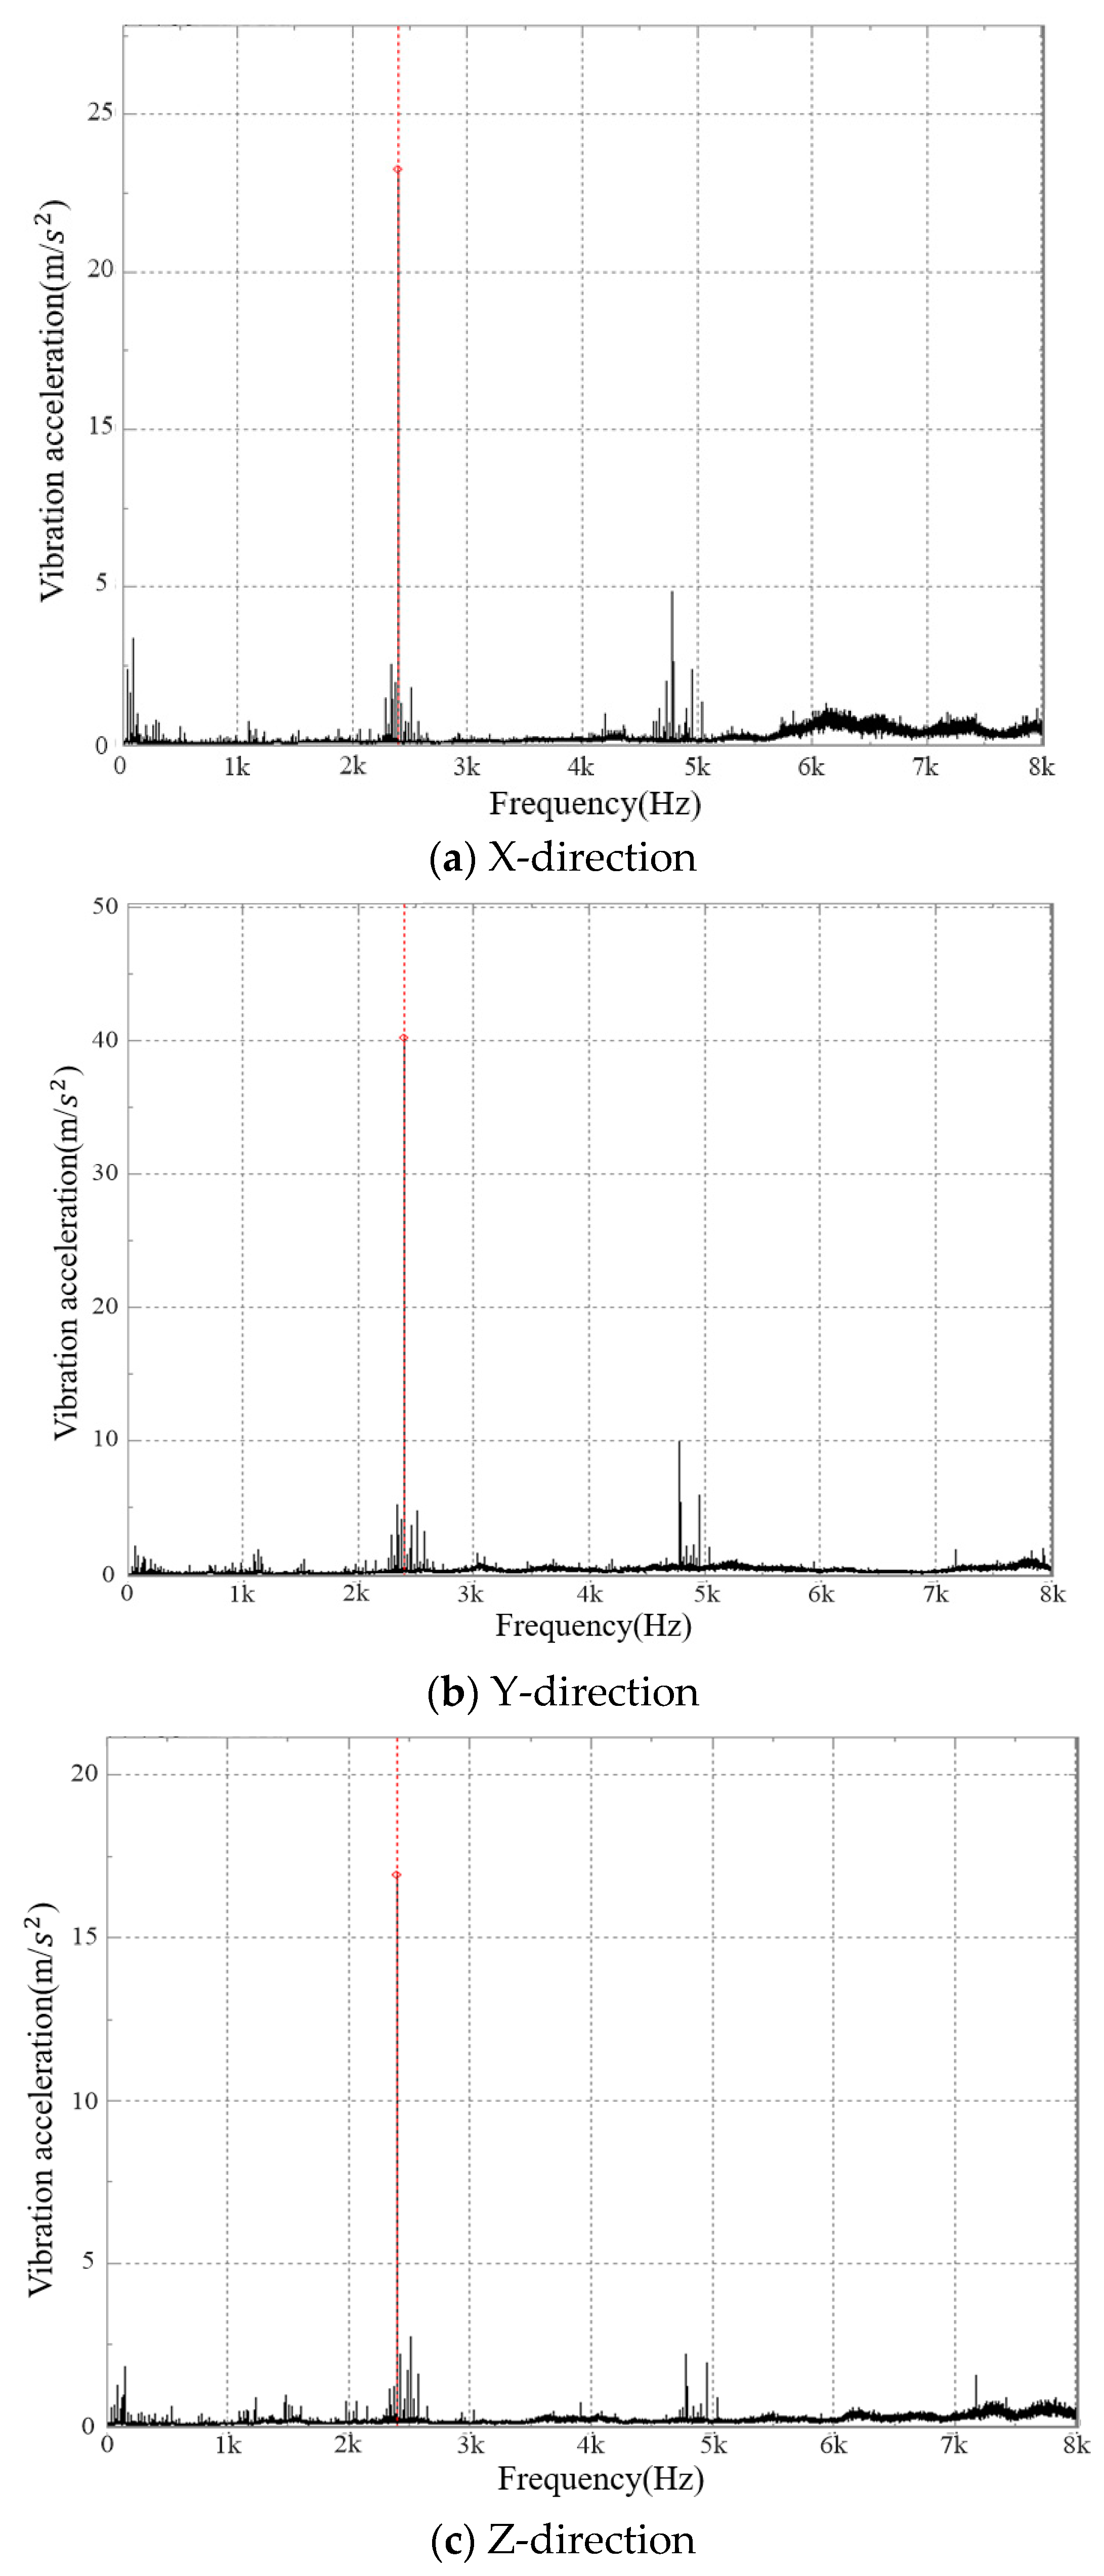
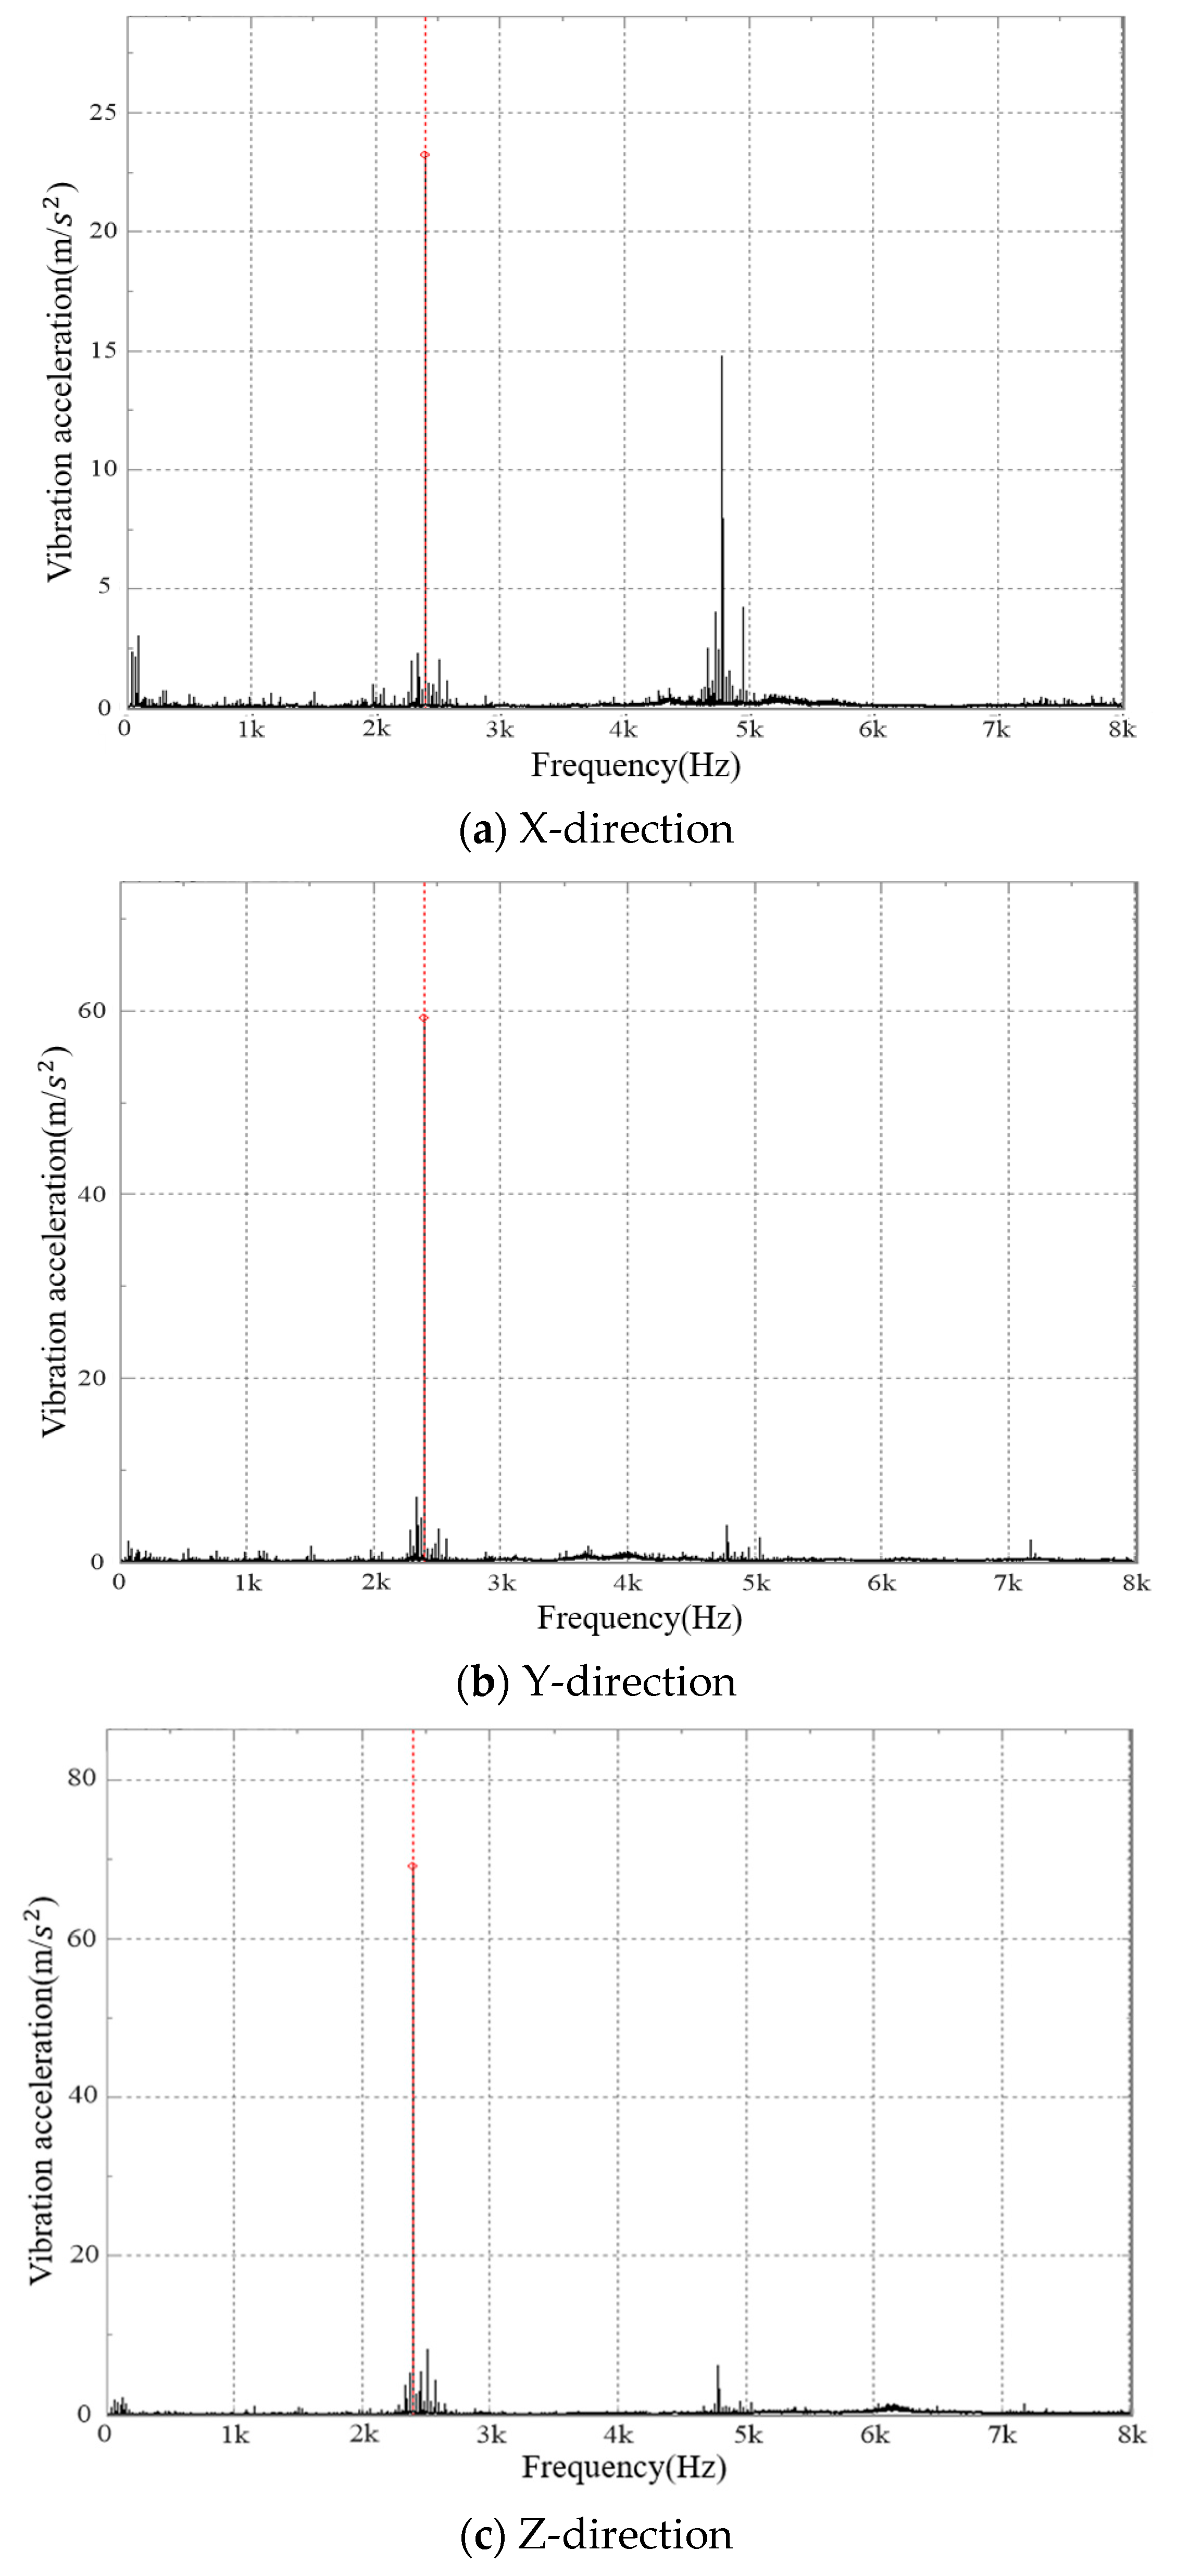
5.1. Vibration Acceleration Test Results and Analysis

The vibration acceleration curves measured at the rated speed (4100 rpm) and the rated load torque are shown in Figure 12 and Figure 13, respectively. Figure 12 shows that under the condition of the input shaft at 4100 rpm, the smaller the input power, the larger the effective value of the vibration acceleration in each direction of the measurement point. With an increase in load torque, the vibration acceleration decreased gradually. At the rated load power of 560 kW, the vibration acceleration decreased to about 40 m/s2. At the same time, the vibration acceleration of the anticlockwise rotation condition was greater than that of the clockwise rotation condition at the same power. Figure 13 shows that when the input torque (1300 Nm) and the load torque were constant, as the speed increased, the vibration acceleration at each measuring point also increased.
Figure 14, Figure 15 and Figure 16 respectively show the frequency-domain graphs of vibration acceleration in the three directions when the input shaft rotated clockwise at 4100 rpm and the power was 560 kW. It can be seen that the peak frequency of vibration acceleration mainly occurred near fN and 2fN. The maximum peak frequency of measuring point 1 was at 2fN, while the maximum peak frequency of measuring point 2 and point 3 was at 2fN. At the same time, the peak value also appeared near fZ1 and fZ2 and their frequency doublings as well as 3fN, but their amplitudes were small. In addition, fN and 2fN had a side frequency band; the side frequency interval was fZ1 and fZ2, but their amplitudes were also very small.
Figure 17, Figure 18 and Figure 19 show that the results were similar to those of the vibration acceleration of the input shaft in the condition of clockwise rotation. Only the maximum peak frequency of measuring point 1 to 3 appeared at fN.

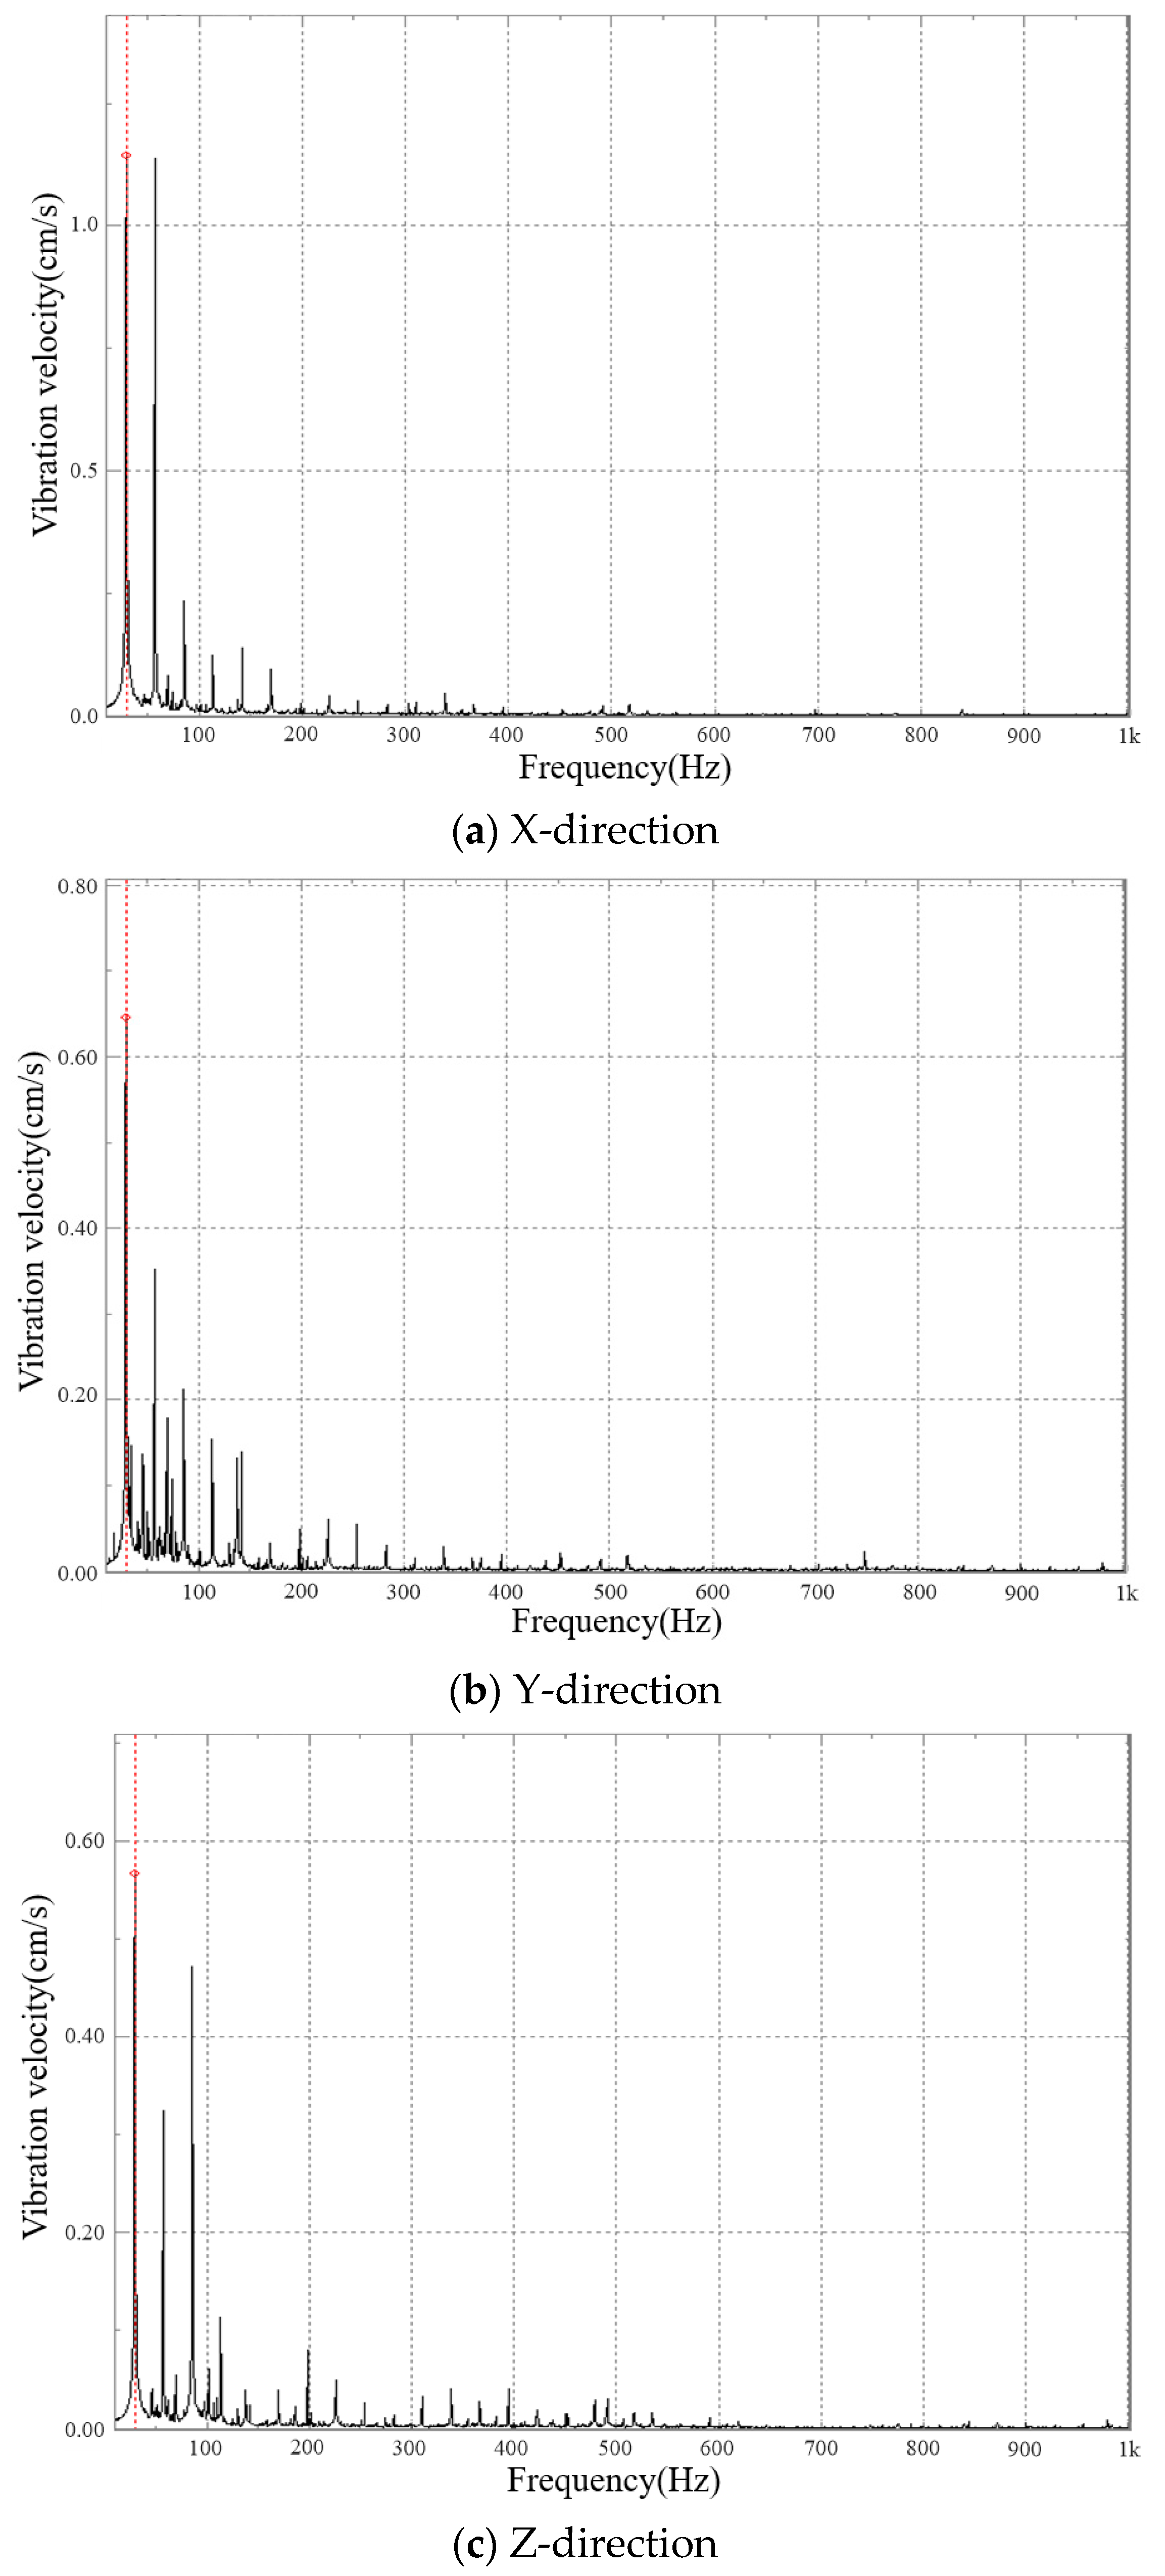
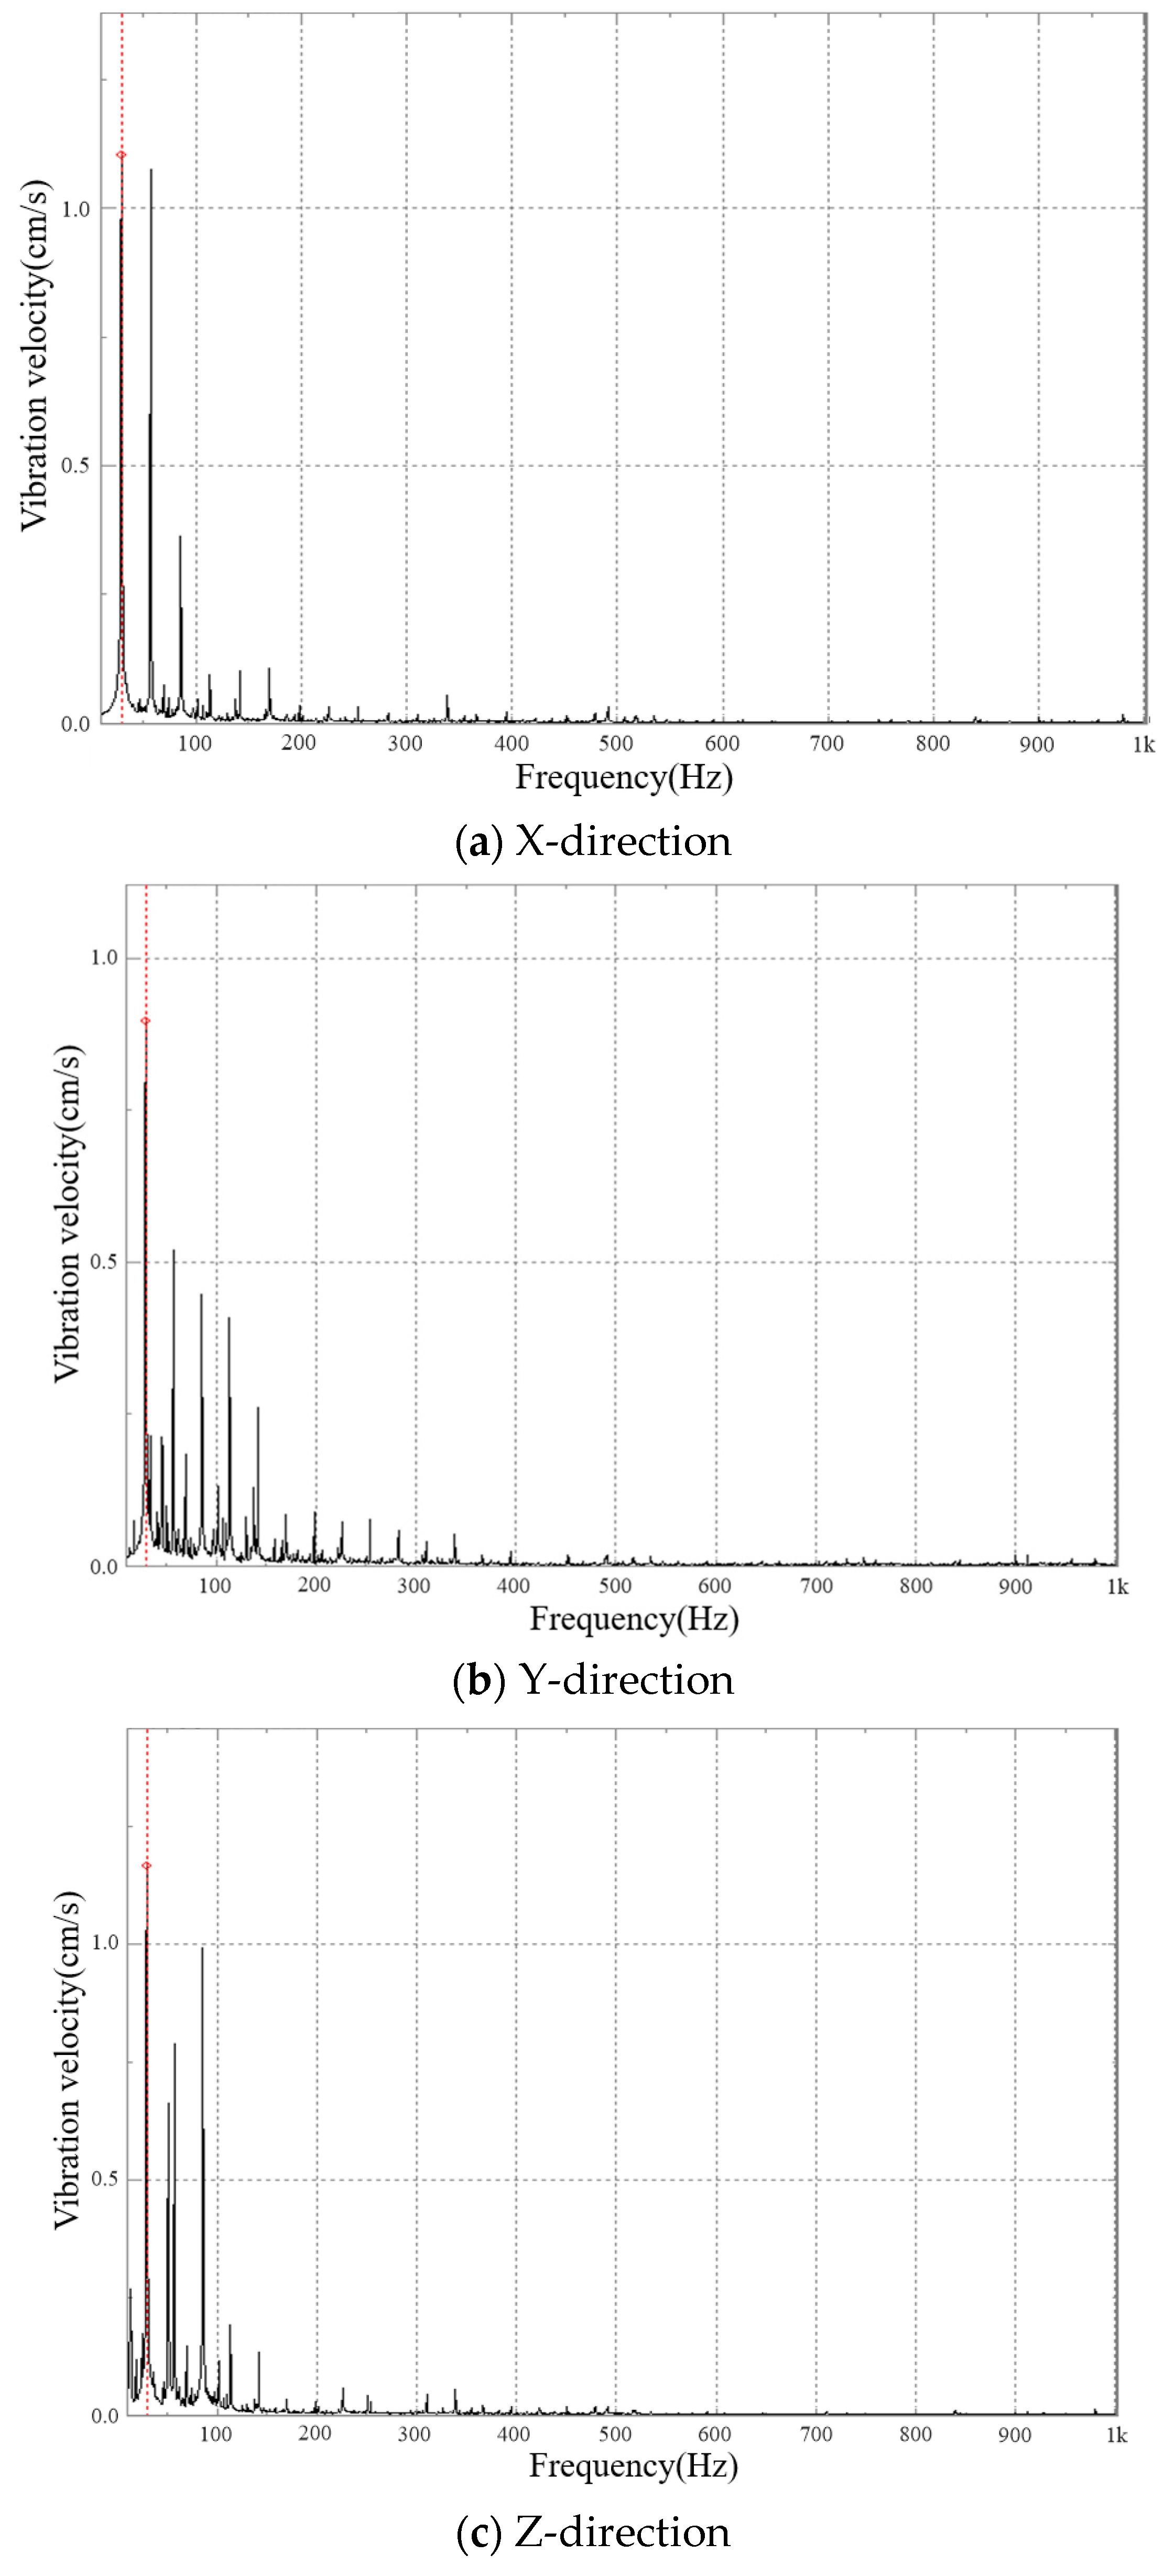
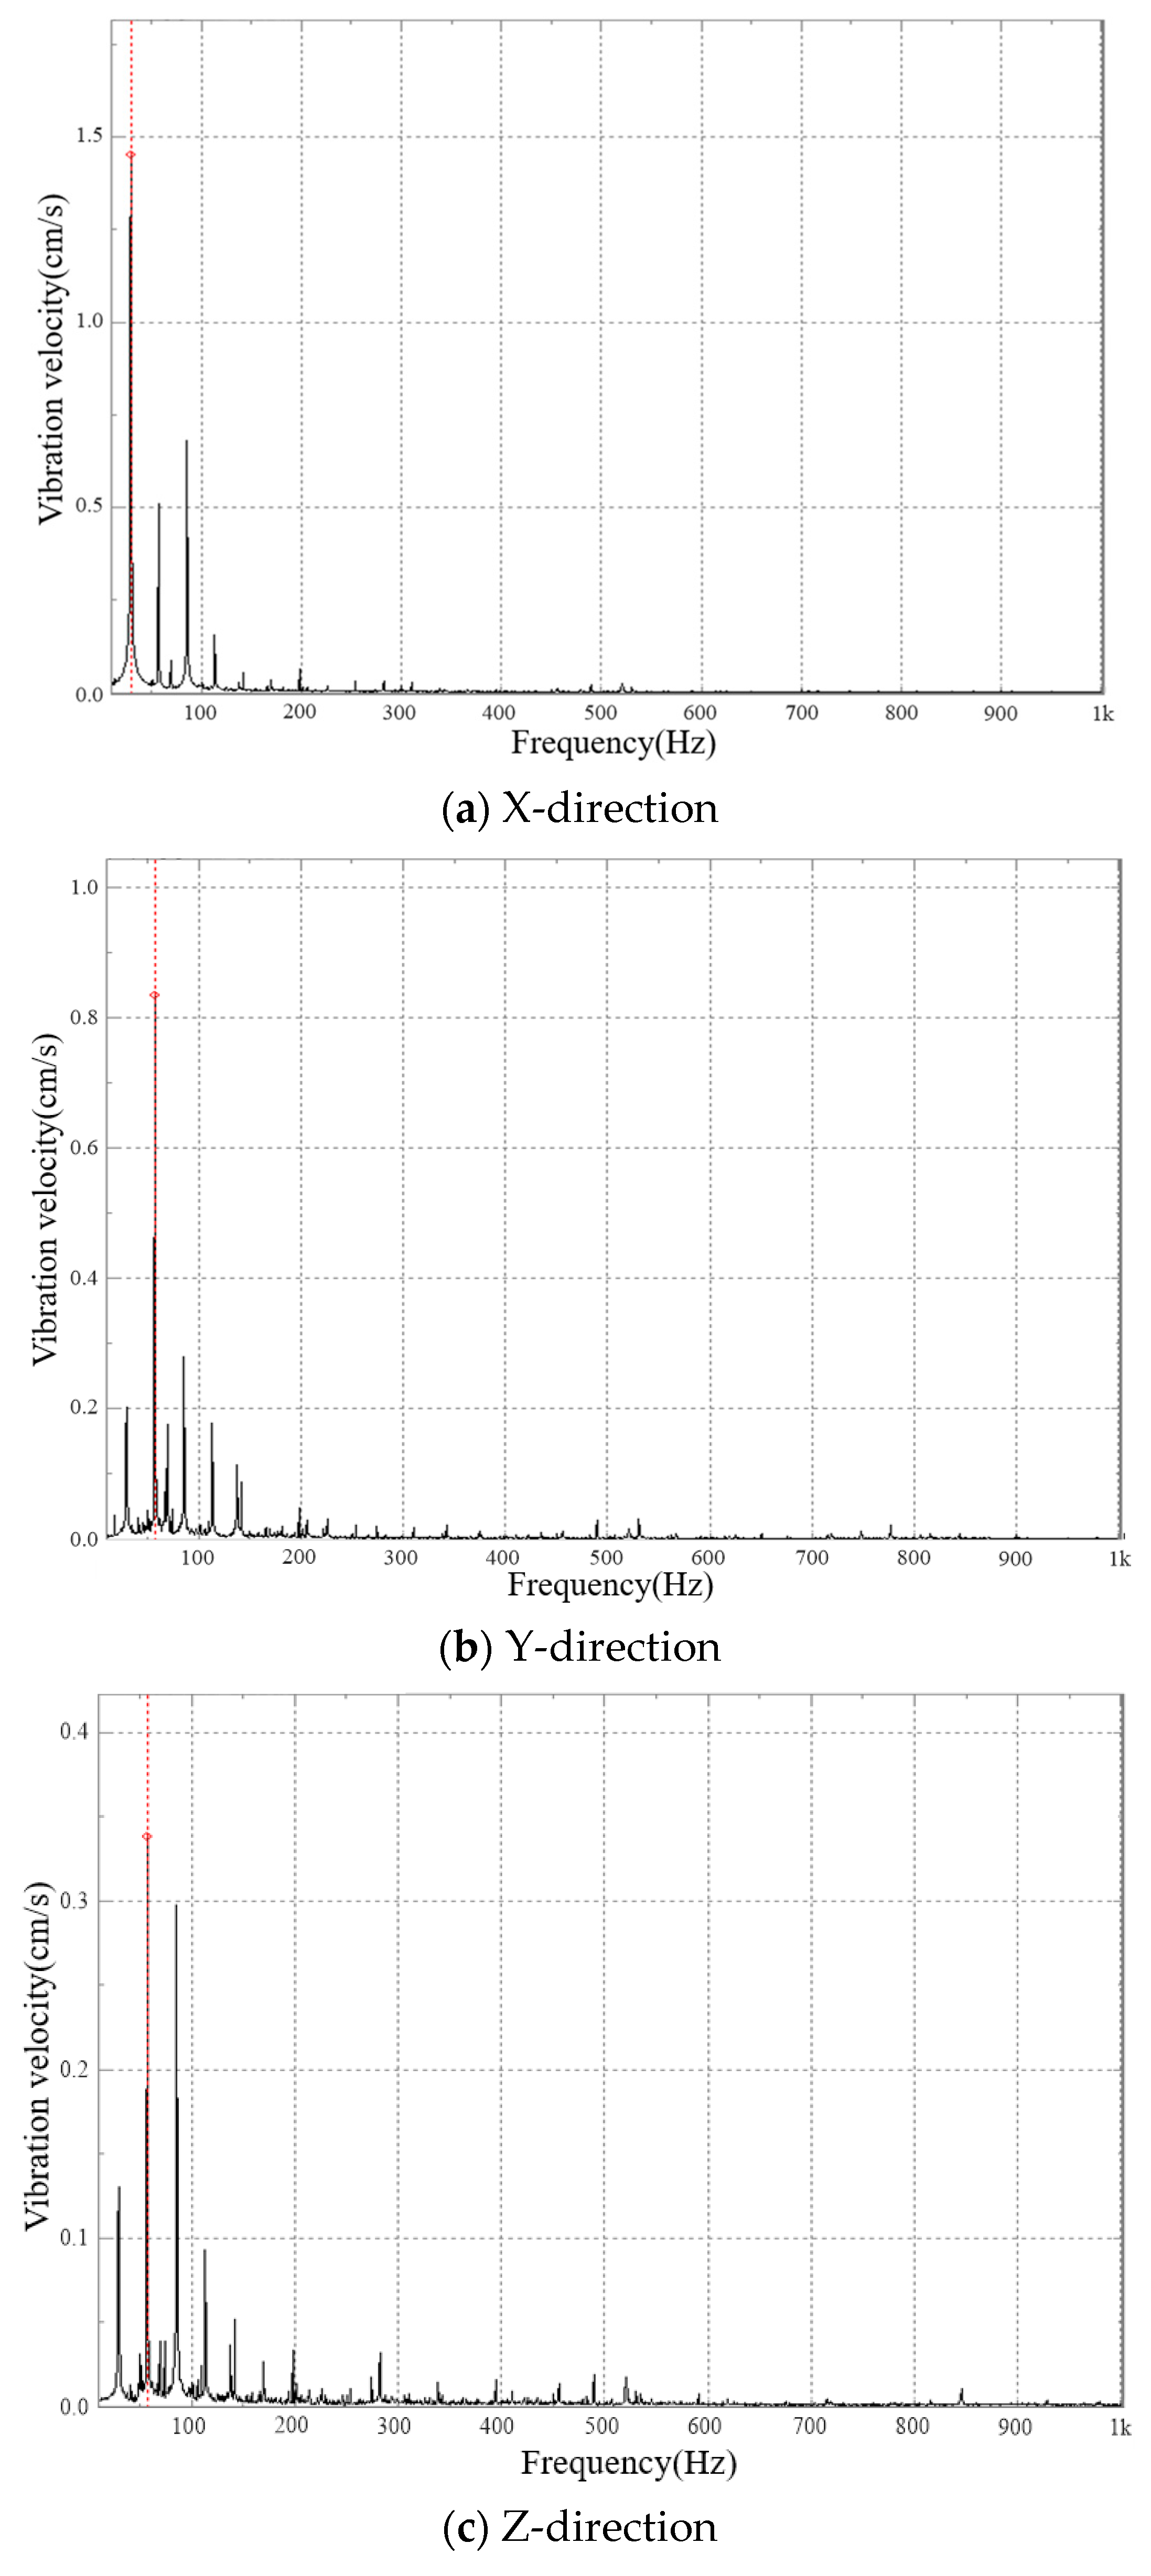
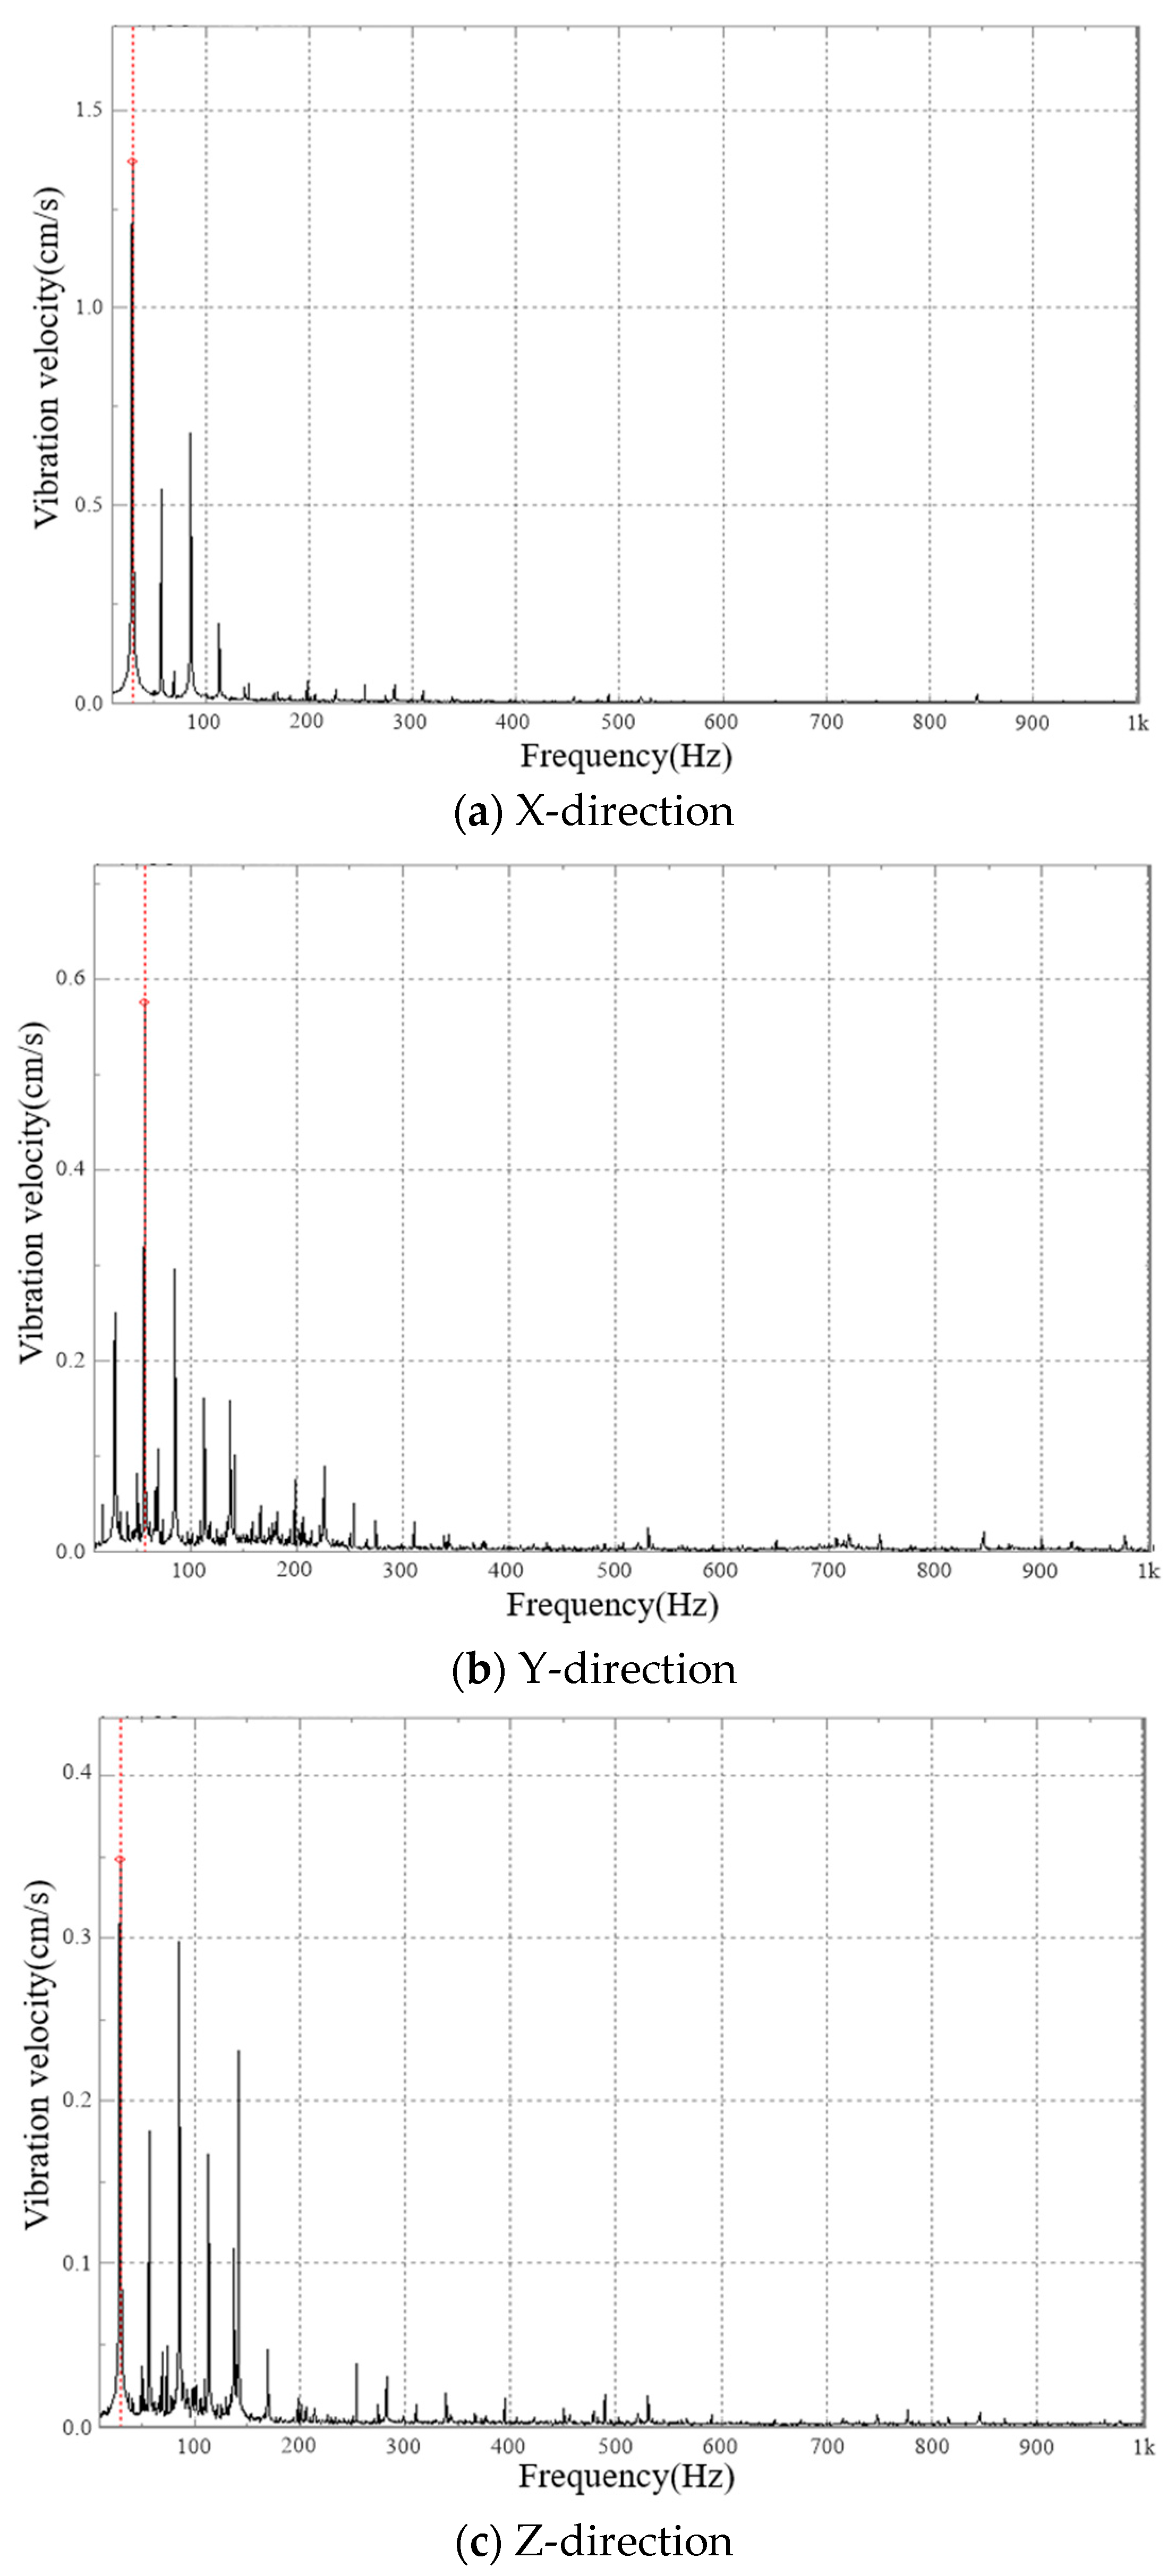
5.2. Vibration Velocity Test Results and Analysis

Vibration intensity is the measurement of the strength of vibration. According to ISO 2372 [25], the vibration intensity is characterized by the composite value of the effective value of the vibration velocity at the specified measuring point. The mathematical definition formula of vibration intensity is:
V S = V X N X 2 + V Y N Y 2 + V Z N Z 2
where V S represents the required vibration intensity in mm/s; V X , V Y , and V Z represent the vibration velocity effective values in three mutually perpendicular directions in mm/s; and N X , N Y , and N Z represent the number of measuring points in three mutually perpendicular directions.
The test results showed that when the input shaft of the traction gearbox rotated clockwise at 4100 rpm and the input power was 419 kW, the Y-direction vibration velocity’s maximum effective value for measuring point 5 was 29.96 mm/s (as shown in Figure 20b). When the load torque was constant, as the speed increased, the vibration speed and vibration intensity of each measuring point of the gearbox increased (as shown in Figure 21). According to Figure 20, at the rated speed, the situation of the vibration speed and vibration intensity changing with the load torque was more complicated: when the power equaled 279 kW and the input shaft rotated clockwise, the X-direction vibration speed was greater than that of the Y-direction; However, when the power equaled 419 kW and the input shaft rotated clockwise, the X-direction speed was smaller than that of the Y-direction. The gearbox had a maximum vibration intensity of 30.77 mm/s when the input shaft rotated clockwise at 4100 rpm and the power was 139 kW. According to ISO 10,816 [26], this vibration intensity was in an unacceptable range, so the structural parameters should be modified appropriately to carry out structural dynamic correction. However, the vibration intensity of the gearbox was 21.317 mm/s at rated conditions and a clockwise rotation, while the vibration intensity was 18.352 mm/s at rated speed conditions and an anticlockwise rotation. According to ISO 10816, this vibration intensity was in the allowable range.
Due to space limitations, in this paper only the vibration speed frequency-domain graph of measuring point 1 and measuring point 2 in three directions are given under the two conditions with the input shaft at 4100 rpm, 560 kW, and clockwise and anticlockwise rotation (as shown in Figure 22, Figure 23, Figure 24 and Figure 25). Unlike the vibration acceleration, the peak value of the vibration speed frequency-domain graph mainly appeared near fZ2 and its frequency doubling, and the major peak value mainly appeared at fZ2, 2fZ2, 3fZ2; the peak attenuation after 3fZ2 was drastic. The maximum peak frequency basically appeared at fZ2 when the input shaft rotated clockwise, and the maximum peak frequency basically appeared at 2fZ2 when the input shaft rotated anticlockwise.

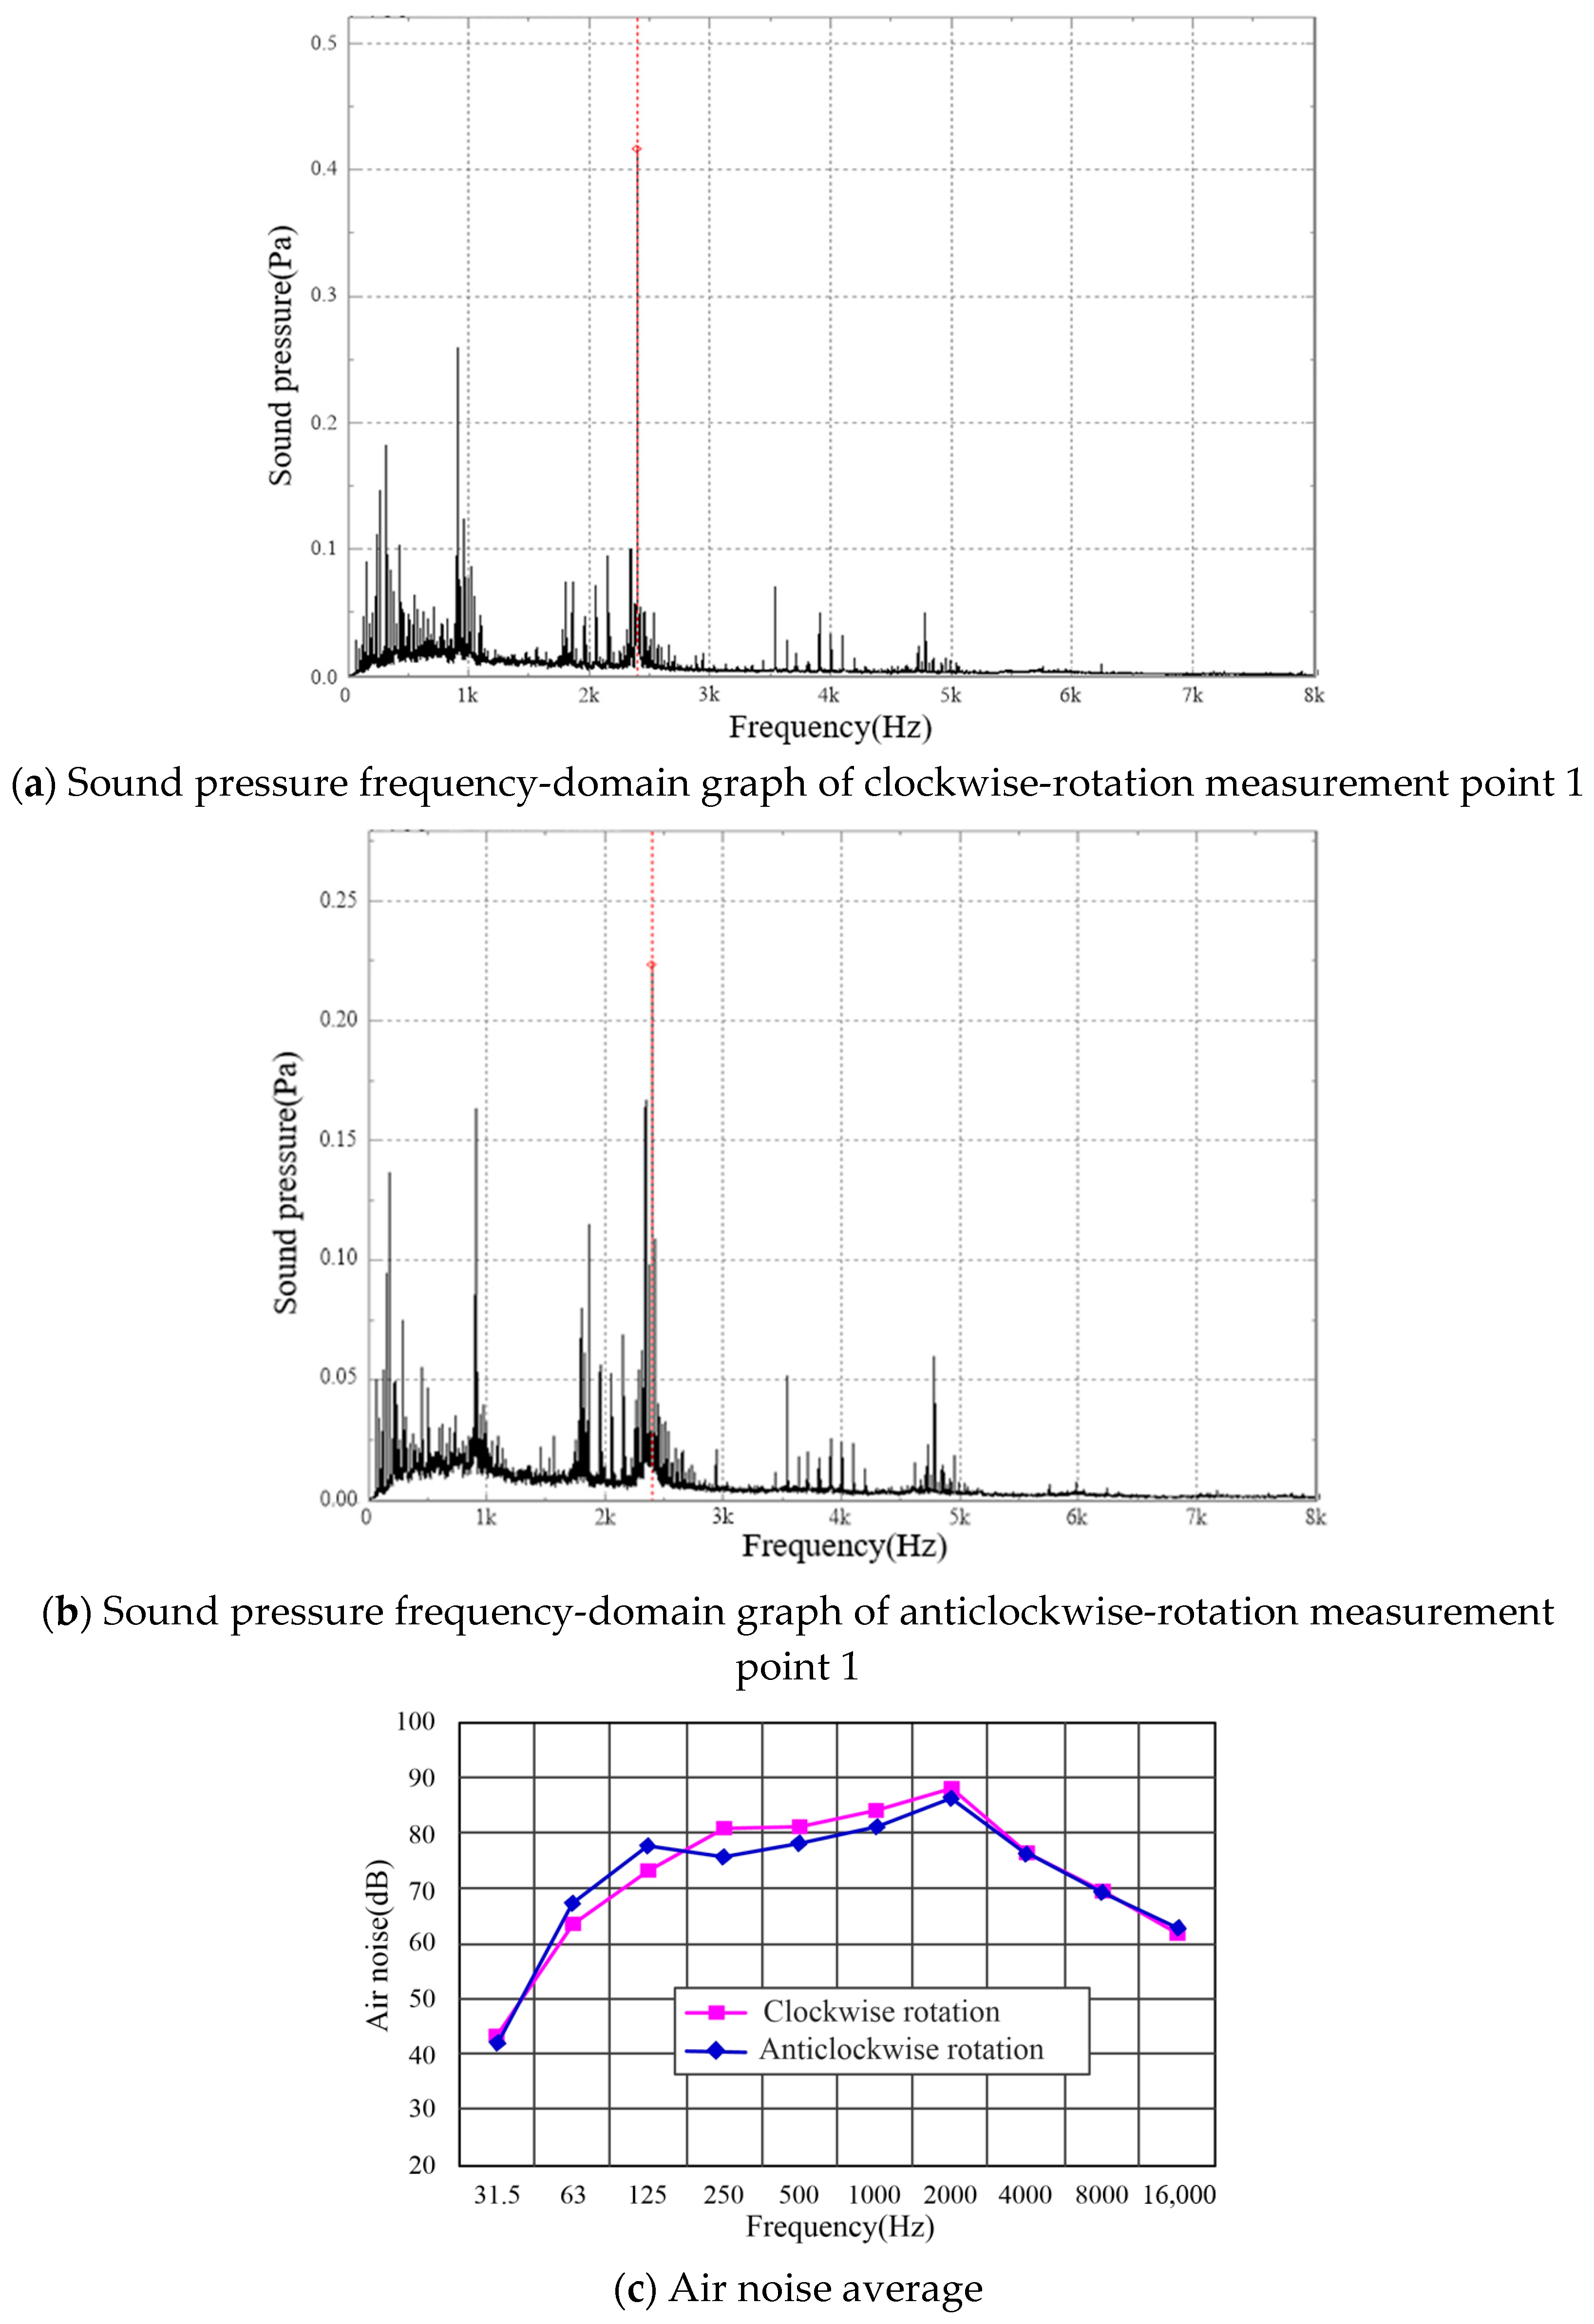
5.3. Air Noise Test Results and Analysis

Since the test gearbox was only one part of the entire test system, in addition to the gear device, the sound system also included background noise sources such as the motor, fan, speed-increasing gearbox, load generator, and other adjacent equipment in the workshop, which would affect the noise measurement results of the tested gearbox. According to ISO 3744-2010, background correction is required if the difference between the measured value and the background value is less than 15 dB. The test results showed that the difference between the measured air noise value and the background value was within the range. Therefore, background correction had to be made to the noise value after the test. The background correction was calculated using the following formula:
K 1 = 10 lg ( 1 10 0.1 Δ L )
where Δ L = L P L ¯ P ; L ¯ P represents the average surface sound pressure level of the test gearbox in dB; and L ¯ p represents the average background noise sound pressure level of the measurement surface in dB.
Since the test was conducted in the workshop, the walls, roof, and floor of the room were strong noise reflection surfaces, so the environmental impact had to be corrected. According to ISO 3744-2010 [27] and ISO 20283-2:2008 [28], the environmental correction amount is determined according to the room sound absorption method, the total surface area of the test room boundary surface (SV = 9800 m2), the equivalent sound absorption area of the test room (A = 1470 m2), and the measurement surface area (S = 26 m2), so the environmental correction K2 = 10lg [1 + 4(S/A)] = 0.3 dB.
According to the measured 1/1 octave sound pressure level at each measuring point, we logarithmically averaged it and then modified it according to Formula (20) to obtain the actual 1/1 octave sound pressure level air noise value.
N F = N A K 1 K 2
where NF represents the actual noise, and NA is the average noise.
After the A-weighted sound pressure level was measured at each measuring point, the actual A-weighted sound pressure level actual air noise value N ¯ M calculation formula for each corrected measuring point was:
N ¯ M = N M K 1 K 2
where NF is the measurement noise value.
After the correction, the curve of the average value of the 1/1 octave A level air noise measurement point of each operating condition with power and speed was drawn shown in Figure 26. Due to space limitations, the frequency-domain graph of the 1/1 octave band A sound level air noise of measuring point 1 at the rated speed of 4100 rpm and power of 560 kW under the condition of clockwise/anticlockwise rotation of input shaft is shown in Figure 27a,b, and the average value of air noise is shown in Figure 27c. At the rated load condition, when the input shaft rotated clockwise, the average air noise of the traction gear box after the correction was greater than that of the air noise during the input shaft when it rotated anticlockwise. Its maximum value was 91.99 dB (A), which was in a good range according to ISO 10816.

6. Conclusions

In this paper, the dynamic response of a high-speed train traction gearbox system was analyzed based on the finite element theory method. While taking traction gearbox dynamic response as a reference, a corresponding vibration test rig was constructed, and then vibration acceleration and air noise tests in various operating conditions were carried out. The conclusions were as follows:
(1)
Theoretical analysis results showed that when fN was equal to some order of the natural frequencies of the system, shaft 1 and shaft 2 would resonate. The vibration amplitude of shaft 1 was greater than that of shaft 2.
(2)
The test results showed that the peak value of the vibration acceleration frequency-domain graph mainly appeared near fN and 2fN, and the maximum peak frequency was at fN. At the same time, the acceleration frequency domain graph peak value also appeared near fZ1 and fZ2 and their frequency doubling as well as 3fN, but their amplitudes were small. There were side bands next to fN and its frequency doubling. The side frequency interval was fZ1 and fZ2, but the amplitude was also very small.
(3)
The peak of the vibration speed frequency-domain graph of the traction gearbox mainly appeared near fZ2 and its frequency doubling, the larger main peak value mainly appeared at the first third-order frequency doubling, and the major peak value mainly appeared at fZ2, 2fZ2, and 3fZ2; the peak attenuation after 3fZ2 was drastic. The maximum peak frequency basically appeared at fZ2 when the input shaft rotated clockwise, and the maximum peak frequency basically appeared at 2fZ2 when the input shaft rotated anticlockwise.
(4)
At the rated load condition, when the input shaft rotated clockwise, the average air noise of the traction gear box after the correction was greater than that of the air noise when the input shaft rotated anticlockwise. Its maximum value was 91.99 dB (A), which was in a good range according to ISO 10816.

Author Contributions

Conceptualization, W.Z. and J.W.; methodology, W.Z.; software, W.Z. and H.L.; validation, W.Z. and H.L.; formal analysis, W.Z.; investigation, W.Z.; resources, W.S.; data curation, H.L.; writing—original draft preparation, W.Z.; writing—review and editing, H.L.; visualization, W.Z.; supervision, J.W.; project administration, W.S.; funding acquisition, J.W. All authors have read and agreed to the published version of the manuscript.

Funding

This research was funded by the National Natural Science Foundation of China (grant number U192402) and the Major Science and Technology Projects of Shanxi Province (grant number 20181102007).

Data Availability Statement

Data sharing not applicable.

Conflicts of Interest

The authors declare no conflict of interest.

Nomenclature

kijTime-varying meshing stiffness
βijSpiral angle
eij(t)Dynamic transmission error
αijOrientation angle of the gear
ψijDirection angle from the Y-axis positive direction to the meshing surface
k m Mean meshing stiffness
k ˜ m Amplitude of meshing stiffness
ω m Gear meshing frequency
FiGear tangential comprehensive total tolerance
FpTolerance of cumulative total deviation of tooth pitch
fiOne-tooth tangential comprehensive tolerance
mnNormal modulus
DDiameter of the dividing circle
εrTotal coincidence
EMeshing error
ωfShaft frequency
ωmMeshing frequency
φmCorresponding initial phases
k m Corresponding initial phases
P i t Relative position of the gear meshing normal to the contact surface
MijMass matrix of the gear pair
FExternal force vector of the gear pair
KijGear meshing stiffness matrix
CijMeshing damping matrix of the gear
ξMeshing damping ratio
kijMeshing stiffness of the gear
r(i,j)Radius of the gear dividing circle
VX, VY, VZVibration velocity effective values in three mutually perpendicular directions
NX, NY, NZNumber of measuring points in three mutually perpendicular directions
L ¯ P Average surface sound pressure level of the test gearbox
L ¯ p Average background noise sound pressure level of the measurement surface
NFActual noise
NAAverage noise
NMMeasurement noise value

References

  1. Zhu, H.; You, X.; Zhang, Y.; Wu, P.; Zeng, J. Research progress on vibration Characteristics of Gear Boxes for high-speed Trains. Mod. Manuf. Eng. 2018, 11, 149–154. [Google Scholar]
  2. Yang, Y.; Wei, J.; Lai, Y.; Zhang, A. Vibration response analysis of helical gear transmission with tooth tip trimming. J. Chongqing Univ. 2017, 40, 30–40. [Google Scholar]
  3. Wei, J.; Wang, G.; Qin, D.; Lai, Y.; Ru, X. Nonlinear excitation modeling and dynamic characteristics of helical gears with modification. J. Vib. Eng. 2018, 31, 561–572. [Google Scholar]
  4. Wei, J.; Zhang, A.; Wang, G.; Qin, D.; Lim, T.C.; Wang, Y.; Lin, T. A study of nonlinear excitation modeling of helical gears with modification: Theoretical analysis and experiments. Mech. Mach. Theory 2018, 128, 314–335. [Google Scholar] [CrossRef]
  5. Huang, G.; Wang, X.; Mei, G.; Zhang, W.; Shao, S. Dynamic response analysis of gearbox housing system subjected to internal and external excitation in high-speed train. J. Mech. Eng. 2015, 51, 95–100. [Google Scholar] [CrossRef] [Green Version]
  6. Wang, W.; Zhang, Y.; Qu, J.; Li, G.; Dai, X. Tell the research on dynamic stress response and fatigue reliability of train gearbox. China Railw. Sci. 2018, 39, 90–97. [Google Scholar]
  7. Wu, H. Dynamic Modeling of Traction Drive System of High Speed Train and Analysis of Vibration Characteristics of Gearbox. Ph.D. Thesis, Southwest Jiaotong University, Xian, China, 2020. [Google Scholar]
  8. Xia, Z. Performance Analysis and Fault Diagnosis of High-Speed Train Gearbox. Master’s Thesis, Shijiazhuang Tiedao University, Shijiazhuang, China, 2021. [Google Scholar]
  9. Xun, Q.; Wei, J.; Wu, H.; Li, W. Study on the influence of curving parameters on the dynamic response of high-speed train traction gear transmission system. J. Vib. Shock. 2022, 41, 283–293. [Google Scholar]
  10. Ru, X.; Wang, G.; Lai, Y.; Zhu, W. Experimental study on traction gear box of high-speed railway based on test rig. Mech. Strength 2018, 3, 589–595. [Google Scholar]
  11. He, Z.; Sun, S.; Deng, Z. Analysis and experimental study on vibration characteristics of subway drive gearbox. Mech. Transm. 2016, 10, 110–113. [Google Scholar]
  12. Que, H.; Lin, X. Research on noise test of gear box of high-speed EMU. Train Veh. Technol. 2016, 1, 34–35. [Google Scholar]
  13. Hu, W.; Liu, Z.; Liu, D.; Hai, X. Fatigue failure analysis of high Speed train gearbox housings. Eng. Fail. Anal. 2017, 73, 57–71. [Google Scholar] [CrossRef]
  14. Huang, G.; Zhou, N.; Zhang, W. Effect of internal dynamic excitation of the traction system on the dynamic behavior of a high-speed train. Proc. Inst. Mech. Eng. Part F J. Rail Rapid Transit 2016, 230, 1899–1907. [Google Scholar] [CrossRef]
  15. Li, G. Study on dynamic Characteristics and Fatigue Reliability of High-speed Train Gearbox. Ph.D. Thesis, Beijing Jiaotong University, Beijing, China, 2018. [Google Scholar]
  16. Wang, Z.; Mei, G.; Xiong, Q.; Yin, Z.; Zhang, W. Motor car–track spatial coupled dynamics model of a high-speed train with traction transmission systems. Mech. Mach. Theory 2019, 137, 386–403. [Google Scholar] [CrossRef]
  17. Wang, Z.; Mei, G.; Zhang, W.; Zou, H.; Huang, G.; Li, F. Effects of polygonal wear of wheels on the dynamic performance of the gearbox housing of a high-speed train. Proc. Inst. Mech. Eng. Part F J. Rail Rapid Transit 2016, 232, 1852–1863. [Google Scholar] [CrossRef]
  18. Wu, H.; Wu, P.; Li, F.; Shi, H.; Xu, K. Fatigue analysis of the gearbox housing in high-speed trains under wheel polygonization using a multibody dynamics algorithm. Eng. Fail. Anal. 2019, 100, 351–364. [Google Scholar] [CrossRef]
  19. Yang, G.; Li, G.; Liu, Z.; Wang, W. Analysis and Research on vibration characteristics of gearbox box of high-speed train under wheel rail excitation. J. Railw. 2017, 39, 46–52. [Google Scholar]
  20. Zhai, W.; Liu, P.; Lin, J.; Wang, K. Experimental investigation on vibration behaviour of a CRH train at speed of 350 km/h. Int. J. Rail Transp. 2015, 3, 1–16. [Google Scholar] [CrossRef]
  21. Zhang, M. Research on Gear Tooth Modification and Transmission Efficiency of High-Speed Railway Gearbox. Master’s Thesis, Taiyuan University of Technology, Taiyuan, China, 2020. [Google Scholar]
  22. Zhang, Z. Research on Gear Fault Diagnosis Method of HXD2 Locomotive Based on Electromechanical Coupling Model. Master’s Thesis, Southwest Jiaotong University, Chengdu, China, 2020. [Google Scholar]
  23. TB/T 3134-2013; Drive Gearbox for EMU. China Railway Publishing House: Beijing, China, 2013.
  24. ISO 8579-2:1993; Acceptance Code for Gears—Part 2: Determination of Mechanical Vibrations of Gear Units during Acceptance Testing. International Organization for Standardization: Geneva, Switzerland, 1993.
  25. ISO 2372:1974/AMD 1:1983; Mechanical Vibration of Machines with Operating Speeds from 10 to 200 rev/s—Basis for Specifying Evaluation Standards—Amendment 1. International Organization for Standardization: Geneva, Switzerland, 1983.
  26. ISO 10816-8:2014; Mechanical Vibration-Evaluation of Machine Vibration by Measurements on Non-Rotating Parts Part 8: Reciprocating Compressor Systems. International Organization for Standardization: Geneva, Switzerland, 2014.
  27. ISO 3744-2010; Acoustics—Determination of Sound Power Levels and Sound Energy Levels of Noise Sources Using Sound Pressure—Engineering Methods for an Essentially Free Field over a Reflecting Plane. International Organization for Standardization: Geneva, Switzerland, 1993.
  28. ISO 20283-2:2008; Mechanical Vibration—Measurement of Vibration on Ships—Part 2: Measurement of Structural Vibration. International Organization for Standardization: Geneva, Switzerland, 2008.
Figure 1. Helical gear meshing unit model.
Actuators 12 00103 g001
Figure 2. Gear meshing stiffness diagram.
Actuators 12 00103 g002
Figure 3. Graph of gear time–varying meshing error.
Actuators 12 00103 g003
Figure 4. Finite element model of traction gear transmission system.
Actuators 12 00103 g004
Figure 5. Meshing force diagram of traction gear system.
Actuators 12 00103 g005
Figure 6. Amplitude–frequency response curves of the specified node in different directions in shaft 1.
Actuators 12 00103 g006
Figure 7. Amplitude–frequency response curves of specified nodes in different directions in shaft 2.
Actuators 12 00103 g007
Figure 8. Schematic diagram of the layout of the high-speed train traction gearbox test rig. 1—Drive motor; 2,8,9,12,14—couplings; 3,6,7,11—support bases; 4—speed-increasing gearbox; 10—test gearbox; 5,13—torque sensor; 15—load generator.
Actuators 12 00103 g008
Figure 9. Test rig for traction gearbox of a high-speed train.
Actuators 12 00103 g009
Figure 10. Measurement point arrangement of acceleration sensors.
Actuators 12 00103 g010
Figure 11. Air noise measurement point layout.
Actuators 12 00103 g011
Figure 12. Curve of vibration acceleration with power at rated speed.
Actuators 12 00103 g012
Figure 13. Curve of vibration acceleration with rotation speed at rated load torque.
Actuators 12 00103 g013
Figure 14. Vibration acceleration frequency-domain graph of clockwise rotation at measuring point 1.
Actuators 12 00103 g014
Figure 15. Frequency-domain graph of vibration acceleration of clockwise rotation at measuring point 2.
Actuators 12 00103 g015
Figure 16. Frequency-domain graph of vibration acceleration of clockwise rotation at measuring point 3.
Actuators 12 00103 g016
Figure 17. Vibration acceleration frequency-domain graph of anticlockwise rotation at measuring point 1.
Actuators 12 00103 g017
Figure 18. Vibration acceleration frequency-domain graph of anticlockwise rotation at measuring point 2.
Actuators 12 00103 g018
Figure 19. Vibration acceleration frequency-domain graph of anticlockwise rotation at measuring point 3.
Actuators 12 00103 g019
Figure 20. Graph of vibration speed with power at rated speed.
Actuators 12 00103 g020
Figure 21. Variation graph of vibration speed with speed at rated load torque.
Actuators 12 00103 g021
Figure 22. Vibration velocity frequency-domain graph of measuring point 1 rotation at rated conditions and with clockwise rotation.
Actuators 12 00103 g022
Figure 23. Vibration velocity frequency-domain graph of measuring point 2 at rated conditions and with clockwise rotation.
Actuators 12 00103 g023
Figure 24. Vibration velocity frequency-domain graph of measuring point 1 at rated conditions and with anticlockwise rotation.
Actuators 12 00103 g024
Figure 25. Vibration velocity frequency-domain graph of measuring point 2 at rated conditions and with anticlockwise rotation.
Actuators 12 00103 g025
Figure 26. Graphs of air noise mean value in different operating conditions.
Actuators 12 00103 g026
Figure 27. Sound pressure frequency-domain graph and air noise graph at measuring point 1 at rated load.
Actuators 12 00103 g027
Table 1. Design parameters of traction gearbox gear pair.
ParameterGear 1Gear 2
Number of teeth/z3585
Normal modulus/mn (mm)66
Helix angle/ β (°)1818
Tooth angle/ α (°)2525
Transmission ratio/i2.42862.4286
Spiral directionLeftRight
Table 2. Names and models of main test equipment.
EquipmentEquipment ModelManufacturerMeasurement RangeMeasurement Accuracy
Acceleration sensorBK4384BK, Herlev, Denmark0.1–12,600 Hz±2%
Charge voltage filter
integral amplifier
DLF-8Beijing institute of
Oriental vibration and noise technology,
Beijing, China
//
Intelligent signal acquisition and processing analyzerINV306U-5260Beijing institute of Oriental vibration and noise technology,
Beijing, China
0.625–10 V±0.01%
Sound level meterNL-42Rion company, Tokyo, Japan25–138 dB±1%
Sound calibratorNC-74Rion company, Tokyo, Japan94 dB±0.3 dB
Table 3. Operating conditions of variable speed.
Input Shaft Speed (rpm)Output Shaft Speed (rpm)Meshing Frequency (Hz)Input Shaft Rotation Frequency (Hz)Output Shaft Rotation Frequency (Hz)
500206291.78.33.4
1000412583.316.76.9
1500618875.025.010.3
20008231166.733.313.7
250010291458.341.717.2
300012351750.050.020.6
350014412041.758.324.0
410016882391.768.328.0
Disclaimer/Publisher’s Note: The statements, opinions and data contained in all publications are solely those of the individual author(s) and contributor(s) and not of MDPI and/or the editor(s). MDPI and/or the editor(s) disclaim responsibility for any injury to people or property resulting from any ideas, methods, instructions or products referred to in the content.

