Article

Piezoelectric Shunt Damping for a Planar Motor Application under Cryogenic Conditions

1
Department of Mechanical Engineering, Eindhoven University of Technology, 5612 AZ Eindhoven, The Netherlands
2
KLA, FaST Division, 3 Technology Dr., Milpitas, CA 95035, USA
3
ASML Netherlands, De Run 6501, 5504 DR Veldhoven, The Netherlands
*
Author to whom correspondence should be addressed.
Actuators 2024, 13(10), 405; https://doi.org/10.3390/act13100405
Submission received: 3 September 2024 / Revised: 29 September 2024 / Accepted: 29 September 2024 / Published: 7 October 2024

Abstract

:
For several decades, Moore’s law has driven the semiconductor industry, with computational power and production costs as the main drivers. Such drivers have enabled several technological innovations in the mechatronics and dynamics architecture of photolithography machines, used for semiconductor circuits manufacturing. Among current investigations, the use of superconductive magnets would enable higher accelerating stages and, thus, higher throughput and lower manufacturing costs. However, this involves a complex magnet structure that needs to operate at cryogenic temperatures and mechanical resonances at relatively low frequencies as a result of the thermal architecture of the system. The damping options are also limited due to the very low temperature. This paper explores the use of shunted piezoelectric transducers for damping the internal modes of the magnet mass. A classical resistive and inductive RL shunt is considered. The study was conducted both numerically and experimentally on a demonstrator of a superconductive magnet plate concept, where piezoelectric transducers are incorporated to support the superconducting coils. The study demonstrates the effectiveness of piezoelectric shunts as a damping solution at very low temperatures, with limited impact of the temperature variation on the performance.

1. Introduction

1.1. Mechatronics Overview of a Photolithography Scanner

In optical lithography (or photolithography), light transfers a geometric pattern from an image (mask or reticle) to a light-sensitive chemical layer (resist) on a semiconductor substrate (silicon wafer). By far, the most common industrial method of exposure is projection printing, whereby an image is projected on a substrate through an optical system. The projection can be performed in either a stationary manner (wafer stepper) or by scanning (wafer scanner). In the latter case, the mask (reticle) stage and the substrate (wafer) stage move synchronously, while a stationary slit of light illuminates the scanning mask. Since multiple dies are exposed sequentially on the wafer, a hybrid step-and-scan approach is typically used. After exposing a field, the wafer steps to a new location and the scan is repeated.
Although Moore’s Law is enabled primarily by technological enhancements that allow for the integration of more components onto integrated circuits, it also predicts the economic advantage of a reduced cost per function. Shrinking of the dimensions (which is achieved by, among other methods, exposing wafers using shorter wavelengths, such as extreme ultraviolet light at 13.5 nm) has led to significant enhancements in functionality per unit of surface area, while the increased productivity has greatly contributed to the reduced cost of ownership and democratization of high-end computers and smartphones. Unlike other steps in semiconductor fabrication, photolithography is a die-to-die process, in which the high-precision motion control of the wafer stage and reticle stage is key to productivity. Indeed, achieving subnanometer precision on an industrial scale is the outcome of a fully integrated system engineering design approach. This precision is enabled by an optimized mechatronics architecture, employing multiple vibration isolation and damping systems, picometer accuracy position sensors, advanced feedback and feedforward controllers, and thermal stability control. The throughput, or production speed, is enabled by the power of the light source in the tool and the capability of the electromagnetic actuators, which are capable of accelerating the stages at about 150 m/s2. Indeed, over the last twenty years, stage acceleration has increased by more than a factor of five, primarily due to improvements in the electromagnetic actuators. In the next generation of extreme ultraviolet (EUV) systems, reticle stage accelerations will exceed 300 m/s2 and maintain alignment, with respect to the wafer, of within a fraction of a nanometer [1]. In combination with a more efficient machine concept based on a dual-wafer stage (TWINSCANTM) and planar motor technology, the productivity, in wafers per hour, has more than tripled over the last twenty years.
Figure 1 shows the evolution of photolithography resolution, as well as the sizes of the machines required to reach such resolutions. From a mechatronics architecture perspective, the increasing size of the machines and stringent precision and high productivity requirements translate into new structural dynamics and vibration issues. The study aims to address some of these challenges.

1.2. Toward Superconducting Motors

To enable further enhancements in the stage acceleration potential (i.e., force per unit of actuator volume), either a further increase in the magnetic field density, B [T], and/or current density, J [A/mm2], is required according to the Lorentz Law. In currently used linear and planar motors based on neodymium permanent magnets, the magnetic field density of the moving coils is bound to approximately 0.7 T, and the current density in the moving coils is increased to several tens of A/mm2 through the application of water cooling. To explore further revolutionary enhancements in stage acceleration, superconductivity is being explored [2,3]. Thin-film rare-earth barium copper oxide (ReBCO) superconductors provide exceptionally high current densities at high magnetic field densities within a temperature range of 4–50 K. Depending on the applied magnetic field density and orientation, a maximum current density in commercially available superconducting layers of up to 100 kA/mm2 is feasible. As opposed to scientific and medical applications, a superconducting coil for linear or planar motor application in high-tech equipment has specific characteristics and challenges related to the small footprint, high force density, and stable (room) temperature requirements in close proximity to the cryostat. It requires high stiffness coil support with minimal thermal conductivity [4] and a very thin isolation layer in the magnetic gap of the superconducting motor toward the mover outside the cryostat [5].
A conceptual design of a superconducting magnet plate for planar motor application is shown in Figure 2. By optimizing the magnetic field density per unit of volume as the figure of merit, and compared to a permanent magnet array, an increase in the peak magnetic field density by a factor of six seems feasible for high temperature superconductor (HTS) coils [6]. In view of the limited thermal efficiency of cryogenic coolers, on the order of a few percent of the Carnot efficiency, the design is optimized for minimum heat influx in the coil fixation and minimum thickness of the isolation layer in the motor gap of the cryostat. Non-contact thermal isolation is proposed based on the struts between the top and bottom plates, as well as a fully enclosing thermal shield at 80 K, thereby limiting the heat load to the inner frame at 4 K to a few watt. Such a design would enable the use of commercially available cryogenic coolers.
Moreover, cryostats generally operate in a vacuum and have poor heat extraction efficiency. Thermomechanical and electrical material properties, like thermal conductivity, thermal expansion, Young’s modulus, and electrical conductivity, are known to change significantly relative to room temperature.

1.3. Demonstrator Setup

For first proof of concept of the superconducting motor, a demonstrator was developed. The design [6] is depicted in Figure 3, where a set of three-phase normal conducting (moving) coils is magnetically levitated above the cryostat vessel. The superconducting part consists of three masses interconnected via flexure-based V-frames (struts) to provide kinematic support. The cold frame (in blue) keeps the superconducting coils at 4–20 K. The cold frame is connected via three pairs of double-hinged struts (inner V-frames) to the isolation frame (in yellow), which acts as a thermal shield, and is cooled down to 45–80 K. The isolation mass is connected via outer V-frames to the vacuum vessel (in gray), which operates at room temperature.
The supporting V-frames should accurately support the superconducting magnets (within 10 μm tolerances) and create a thermal barrier for heat influx at the same time. This implies a trade-off between mechanical stiffness and thermal isolation. It also implies undesired internal dynamics of the cryostat, with very lightly damped vibration modes. These challenges for the demonstrator are comparable to the superconducting motor design in the lithography system. To overcome them, a damping solution is required to be implemented in the cryogenic environment of the superconducting magnet plate. The aim is to fulfil the dynamic specifications in terms of natural frequency, f n , and modal damping, ζ , of Table 1.

2. Passive Damping Solutions

High-tech systems such as the lithography machine traditionally have very little damping as a result of the flexure-based and monolithic designs, required for high predictability. Moreover, in view of the relatively poor efficiency in removing heat at cryogenic temperatures, interfaces with the environment are typically designed to have high thermal resistance and, hence, poor (frictional) damping properties. For repeatability reasons, the aforementioned kinematic supporting V-frames for the cold frame and the isolation frame are made monolithically, resulting in very little (material) damping, with a typical loss factor of η = 0.001 [7]. This loss factor is reduced under cryogenic conditions, as the inherent material damping decreases with temperature [8]. In addition, common passive damping solutions are unsuitable or inefficient at such low temperatures.
Viscoelastic dampers, known to be effective under room temperature conditions, do not work at cryogenic temperatures. Because of its strong temperature dependency, rubber material loses its viscoelastic properties and becomes brittle at low temperatures, leading to negligible loss factors. Viscous fluids, as applied in hydraulic dampers, would simply solidify at cryogenic temperatures.
Two potential passive damping solutions for superconducting planar motors (SCPMs) were further investigated, viz., eddy current damping and piezoelectric shunt damping.

3. Eddy Current Damping

The motion of a conductive material with respect to a magnetic field induces eddy currents and results in a resistive damping force, proportional to the original motion speed. In cryogenic applications, particularly aerospace-related ones, eddy current damping (ECD) has been put forward as a viable solution [9,10,11]. More recently, ECD has also been studied for magnetic levitation systems [12,13]. In both application areas, ECD has shown to be a suitable damping method for relatively low temperatures, down to 15–80 K.

3.1. Increased Performance under Cryogenic Conditions

The eddy current damping constant, d [N/ms−1], of a conductive volume, V [m3], with electrical conductivity, σ [S/m], and moving perpendicular to a magnetic field, B [T], can be derived from [14] the following (for a given geometry):
d = σ   V B 2 d V .
The damping constant is linearly proportional to the electric conductivity ( σ ), and thus would increase as the temperature decreases. Figure 4 shows the electric conductivity ( σ ) of copper OFHC at low temperatures, which is a factor 1000 larger at 10 K compared to room temperature [15]. At 80 K, however, the difference in electric conductivity is only a factor 10.

3.2. Limiting Penetration Depth

Although the simplified relationship in Equation (1) typically holds, it neglects the conductor’s thickness limitations and the presence of mutual inductance. Unfortunately, these effects cannot be neglected for materials with high electrical conductivity and at relatively high frequencies. Particularly, the penetration depth is defined as follows [16]:
D d e p t h = 2 σ ω μ  
where σ is the material conductivity, ω is the eddy current (motion) frequency, and μ is the permeability. Indeed, the penetration depth of the eddy currents decreases significantly at high frequencies and the mutual inductance can no longer be ignored. This results in a significantly lower damping performance.
Figure 5 shows the ratio of the effective conductivity of a unit cube of copper OFHC to the conductivity calculated according to Equation (1) as a function of temperature for various working frequencies. The figure shows that the impact of the penetration depth (or skin depth) on the conductor conductivity increases for increasing frequency.
For our specific application on the SCPM, the effective conductivity (following from limited penetration depth) can be up to 6 times lower, as shown in Figure 5.

3.3. Insufficient Damping for the Planar Motor Application

Current ECD implementations at cryogenic temperatures are typically at low frequencies (<10 Hz) and with relatively low masses (<1 kg), resulting in relatively low damping values, typically d = ~10 N/ms−1 [12,13]. For large implementation volumes, somewhat higher damping values are reported ( d = ~500 Ns/m) [10,11]. For the superconducting planar motor, however, a high damping value is required ( d = 2000–20,000 Ns/m) due to the high mass and vibration frequencies of the SCPM, according to the following:
d = 2 ζ 2 π f n m
The required damping values are significant compared to the available implementation volumes. Combined with the marginal increase in conductivity at 80 K (see Figure 4), and the limited effective conductivity (Figure 5), ECD appears to be unsuitable as a passive damping solution. Therefore, our application specifications cannot be fully met using ECD at 80 K.
However, the full potential of the ECD at 4 K, where the conductivity is increased by 3 orders of magnitude, will be investigated in future studies. Piezoelectric shunt damping appears to be a serious candidate for operation within the full frequency range of interest.

4. Piezoelectric Shunt Damping

Embedding a piezoelectric transducer into a structure enables the transformation of its mechanical energy into electrical energy. The transformed energy can then be dissipated in simple passive circuits in the form of resistive and resistive–inductive shunts, or even in more complex semi-active circuits [17,18]. Piezoelectric shunt damping techniques have been extensively studied for room temperature, but are rather unexplored for cryogenic conditions. It has already been demonstrated that piezoelectric properties are not significantly impacted by temperature change [19], and thus, the damping performance should also be rather insensitive to cryogenic conditions. The piezoelectric strain at cryogenic temperatures, appears to be on the order of ~30% of the strain at room temperature [20,21], which suggests only a moderate decrease in the piezoelectric effect at low temperatures. This makes piezoelectric shunt damping a potential solution for the cryostat.

4.1. RL Shunt Damping

Consider the single degree of freedom (DoF) piezoelectric system shown in Figure 6, shunted in series on a resistor R   [ Ω ] and an inductor L   [ H ]. The related dynamics are governed by the following equations for the mechanical and electrical behaviors, respectively [22]:
M x ¨ + K a x = d 33 K a C ( 1 k 33 2 ) Q ,
L Q ¨ + R Q ˙ + 1 C ( 1 k 33 2 ) Q = d 33 K a C ( 1 k 33 2 ) x
where M   [ k g ] is the supported mass, x [m] is the displacement, Q [C] is the electrical charge, K a [N/m] is the piezoelectric transducer stiffness with short-circuited electrodes, C [F] is the capacitance with a free–free mechanical boundary condition, d 33 [m/V] is the piezoelectric constant, and k 33 2 [-] is the electromechanical coupling factor ( k 33 2 < 1 ), which depends on the material properties (see below) and represents the ability of the transducer to convert the mechanical energy into electrical energy and vice versa. The subscripts 33 refers to the actuation mode where the considered strain in the direction (3) is related to the electric field applied in the direction (3), which is also the direction of the polarization. In this case, the lateral strain in the directions (1) and (2) are constant and equal to zero.

4.2. Shunt Circuit Tuning

The system shown in Figure 6, which now consists of two coupled oscillators, is tuned such that the electrical oscillator is able to absorb the vibration energy of the mechanical oscillator. We define the resonance frequency, ω e , and the modal (relative) damping, ζ e , of the electrical circuit as follows:
ω e = 1 L C 1 k 33 2         a n d           ζ e = 1 2 ω e R L
The piezoelectric transducer, shunted on the inductor, L, and the resistor, R, behaves in a very similar way as the mechanical tuned mass damper system. The piezoelectric capacitor and the circuit inductor constitute the resonant system, which is tuned to maximize the circuit absorption, while the resistor is used to dissipate the absorbed energy, either mounted in series or in parallel [22,23]. Typically, the RL circuit is tuned to minimize the H norm (i.e., the maximum) of the frequency response function (FRF) from the external force, F, to the displacement, x, of the mass. This design is usually referred to as the equal peak design, as it results in two peaks with equal amplitude, as shown in Figure 7.
To maximize the energy absorption, the inductor, L , is tuned such that the optimal electrical resonance frequency, ω e * , matches the mechanical resonance frequency, Ω i . In this case, the optimal tuning frequency, ω e * , and damping, ζ e * , are given by the following:
ω e * Ω i = 1             or         ω e * ω i = 1 1 k 33 2        
and
ζ e * = 3 / 8 k 33 2 ,
where Ω i and ω i   are the resonance frequencies of the targeted mode i with open electrodes and short-circuited electrodes, respectively [23].
The optimal tuning of the RL circuit merely depends on four parameters, viz., the inherent piezoelectric capacitance, C , the resonance frequencies of the targeted mode with open and short-circuited electrodes, Ω i and ω i , respectively, and the electromechanical coupling factor, k 33 . All these parameters can be measured experimentally. Therefore, the tuning rules shown in Equations (7) and (8) apply directly to any piezoelectric structure, provided these four tuning parameters are available. However, unlike the single DoF system where the entire strain energy is addressed by a single piezoelectric transducer, for a multiple degree of freedom system, the generalized electromechanical coupling factor, K i , should be used instead of k 33 , to include the strain energy for a specific mode, i . It is defined as follows [22]:
K i 2     = 1 ω i 2 Ω i 2
This generalized electromechanical coupling factor, K i , scales with the electromechanical coupling factor, k 33 (material part), and the fraction of the modal strain energy addressed by the piezoelectric transducer, ν i (structural part):
K i 2     = k 33 2 1 k 33 2 ν i    
Multiple transducers can contribute to the dampening of a single mode. In this case, the generalized coupling factor follows from the total strain energy, which comes to the summation of the strain energies per transducer. The maximum obtainable relative damping with an equal peak design is given by the following:
ζ i = K i / 2
Finaly, one should note that the coupling factor, k 33 , is a material property, which scales with three temperature-dependent piezoelectric properties, as follows: (i) the piezoelectric constant, d 33 T in [m/V]; (ii) the dielectric constant, ε 33 T ( T ) [-]; and (iii) the elastic compliance, s E T [m2/N], as follows [24]:
k 33 2 ( T ) = d 33 ( T ) ε 33 T ( T ) s E ( T )
Any change in the environmental temperature will result in a change in the coupling factor, k 33 , and, thus, the shunt damping performance.

4.3. Cryogenic Properties of the Piezoelectric PZT Material

The damping performance of piezoelectric shunts at cryogenic temperatures is only impacted by the change in the electromechanical coupling factor, k 33 ( T ) , and the fraction of the modal strain energy, ν i (T), as a function of the transducer temperature. The former is straightforward, the latter, however, is more complicated, as it depends on the location of the transducer in the structure and the damped mode shape.
Compared to room temperature, the electromechanical coupling factor, k 33 , appears to decrease by 13% at 80 K and 22% at 4 K (as depicted in Figure 8 and Table 2). The effect on the damping performance is expected to be on the same order of magnitude, following Equations (10)–(12). On the other hand, the fraction of the modal strain energy addressed by the transducer depends on the relative compliance of the piezoelectric transducer with respect to that of the structure, and, thus, can be optimized by design to be maximal at low temperatures. For our specific application, the reduction in the elastic compliance from 293 K to 80 K of the titanium Ti6Al4V V-frames was 10% [25], while the reduction in the elastic compliance of the PZT-5A transducer was about 20%, according to Table 2. The larger change in the compliance of the transducers results in only a small change in the modal density of the strain energy, ν i , and, thus, has little effect on the damping performance.

5. Experimental Implementation

In order to limit the design impact, the piezoelectric transducers were integrated into the double-hinged V-frames that connect the isolation frame to the vacuum vessel (see Figure 9). The V-frames are designed to kinematically support the superconducting magnets and act as thermal isolators. The stacked piezoelectric transducers, NAC2014-H34P from CTS, consist of a multilayer ceramic PZT material, which is pre-tensioned by a monolithic spring to allow for both compression and tension when integrated into the V-frame. PZT was chosen as the material because of its high coupling factor, k 33 , and good availability. Single crystal piezoelectric transducers may offer even better performance, but they are complex and more expensive to produce.
A variable synthetic inductor (Antoniou circuit [27]) was used together with a variable resistance such that both the electrical eigenfrequency and resistance could be adjusted.
In total, six piezoelectric transducers were integrated into the demonstrator setup (see Figure 10). The strain energy, ν i , per transducer was obtained using FEM simulations (Modal Analysis in Ansys). The level of strain energy reflects the level of obtainable damping (Equations (10) and (11)). Note that the strain energy values from the FEM are only indicative of the effectiveness of damping a particular mode shape and should only be used as such. Because of the asymmetry of the structure, transducers P1 and P3 turn out to be the most efficient for dampening the mode at 150 Hz in the R y direction, and transducers P4 and P2 are the most effective for dampening the mode at 210 Hz in the X direction (see Figure 11).
Figure 12 shows two mode shapes of the test setup, obtained from FEM Modal Analysis. The mode shapes exhibit a rocking shape around the Y-axis (Ry mode at 150 Hz) and a translation shape along the X-axis (X mode at 210). Note that the resonance frequencies (and the mode shapes) do not match the measured test setup, and the model needs to be updated for a better comparison. The main difference is due to the undefined boundary conditions of the test rig laying inside the thermal isolation box (Figure 13b).

6. Experimental Validation

The dynamic performance of the demonstrator was evaluated through frequency response function (FRF) measurements at different temperatures and adjusted electrical shunt conditions for the piezo elements. One of the six transducers was used as an excitation source (sine sweep). Two accelerometers (PCB 351B41) were used to measure the acceleration of the isolation frame in the horizontal and vertical directions ( X and Z ). The temperature was measured using thin-film resistance temperature sensors (IST p1k0.232.6w) mounted on the V-frame on both sides of the transducers.
First, the setup was cooled to 77 K using liquid nitrogen, as shown in Figure 13; then, the system was enclosed with a 50 mm layer of thermal isolation. No active cooling was used. Slowly, the temperature increased at a rate of less than 10 K/h. As the temperature increased, system identifications (FRF measurements) were performed at distinct temperatures and under various electrical boundary conditions. Typically, each measurement takes only a few minutes and, therefore, the parameters are assumed to be unchanged. The temperature cycle was repeated twice, and each measurement was performed twice.
For the first four modes, the modal density of the strain energy per transducer, ν i , is calculated based on the identified generalized electromechanical coupling factor, K i . The resonance frequencies of the system are identified with open- and short-circuit electrodes from the measured FRF, x ¨ / V ,   as shown in Figure 14, where V is the input voltage applied to the transducer drive, and x ¨ is the measured acceleration. Then, Equations (9) and (10) were used to calculate the generalized electromechanical coupling factor, K i , and the associated modal density of the strain energy, ν i . Based on the datasheet, the PZT electromechanical coupling factor at 296 K was k 33 = 0.74 .
Figure 15 shows the measurement results for the two modes of interest, R y and X . Proportionally, the measured values match very well to the simulation results of Figure 11. The discrepancy in the absolute values is likely due to the simplification in joint connections, interface stiffness and boundary conditions of the FEM model. No model updating was performed, as the goal was to measure the temperature’s impact, and the model was only used as an estimation tool. The figure also shows that transducers P1 and P3 were the most efficient in dampening the mode in Ry because of their relatively high strain energy density, while P4 and P2 were most favorable for the mode in the X direction.
Next, only one transducer P4 is used for the damping of mode X . However, the electromechanical coupling factor of all the transducers, as if they were all used at the same time will be measured. Indeed, using all the transducers for the damping at the same time is also possible, but makes the tuning more time consuming and thus would require an actively temperature-controlled system.

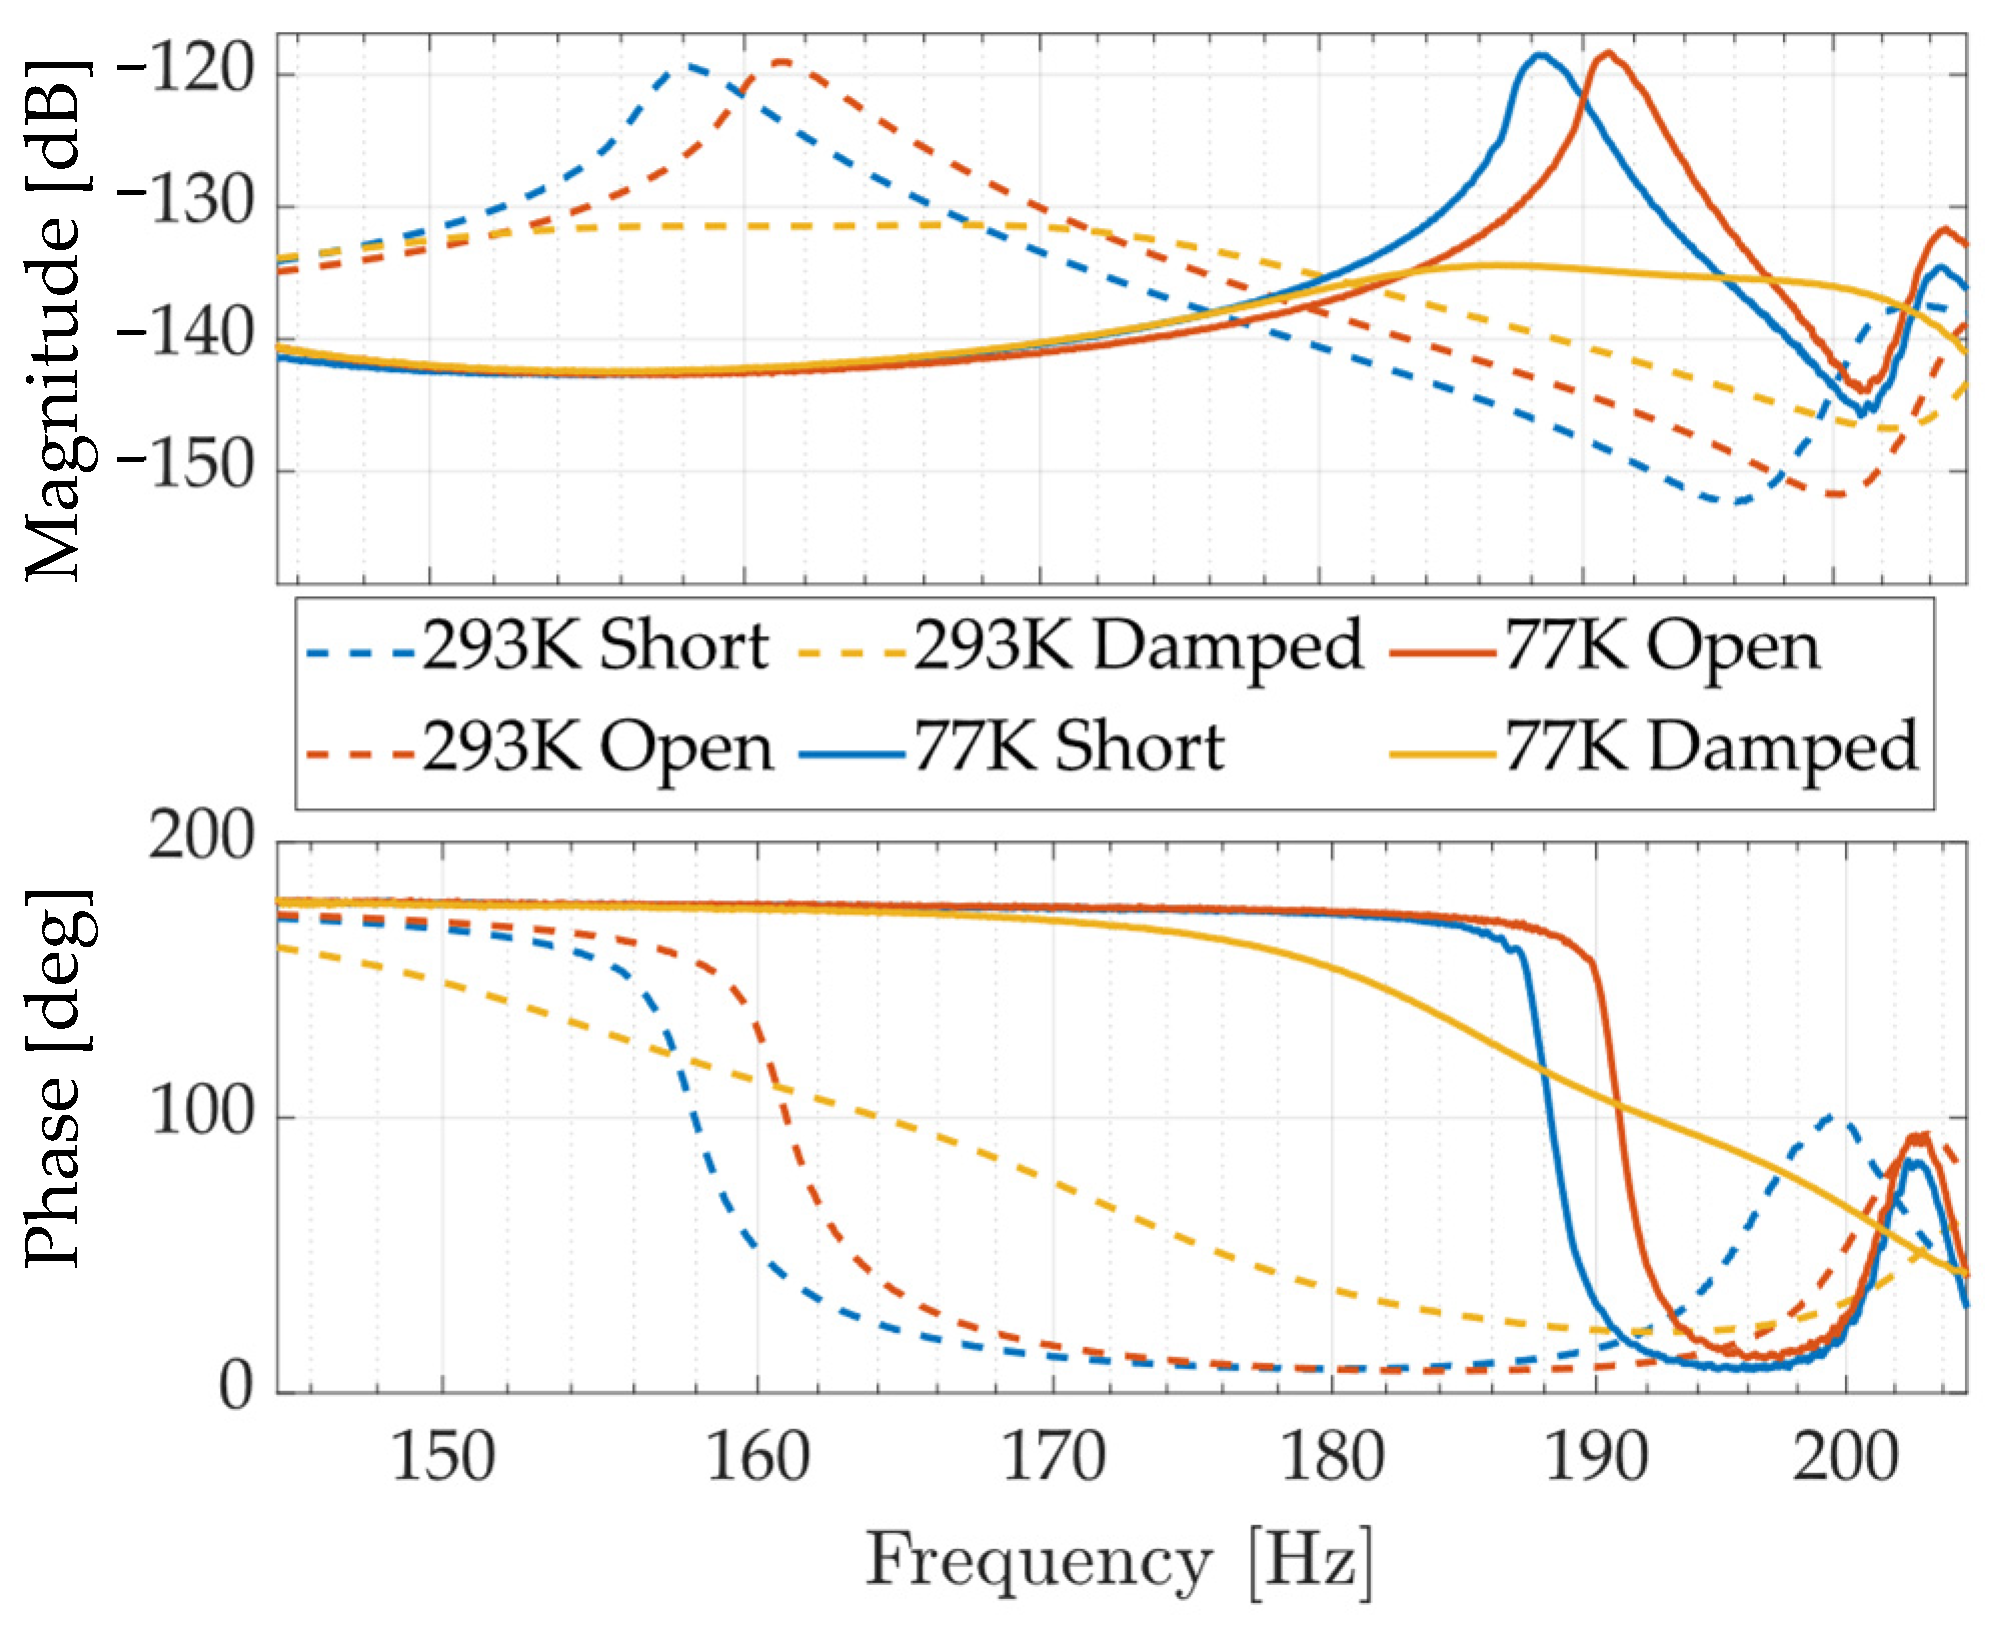
6.1. Shunt Damping at Room Temperature

Figure 16 shows the FRF of the structure measured from the injected voltage on the transducer P2 to the acceleration from the accelerometer mounted on the isolation frame. The damping of the second mode in X is determined using the half power method, it is ξ 0 = 1.8 % . The FRF is measured when: (i) all the electrodes are open, giving Ω i = 1.01 × 10³ rad/s, (ii) the transducers are short-circuited, giving ω i = 9.94 × 10² rad/s; and when (iii) the transducer P4 (most effective transducer) is shunted on a tuned RL circuit. The damped FRF has an attenuation of 12.3 dB, when compared to the open-circuited response, it corresponds to a modal damping ζ a t t = 7.5% (for an equivalent 1-DoF system).
For the sake of simplicity, only one transducer was used for damping here. The methodology can obviously be extended to all five transducers, where each transducer is shunted independently to its circuit and tuned according to its effective electromechanical coupling factor [23]. Mounting the transducers in parallel is also possible. The total generalized electromechanical coupling factor using all five transducers is K i = 20%, which corresponds to an expected maximum modal damping of ζ d , i = K i / 2 = 10%, assuming an equal peak design [23]. The inherent modal damping in the setup without PZT damping is estimated to be about 1.5%, which would lead to a total attenuation of a factor 6.6 if one would use all the transducers for shunt damping.

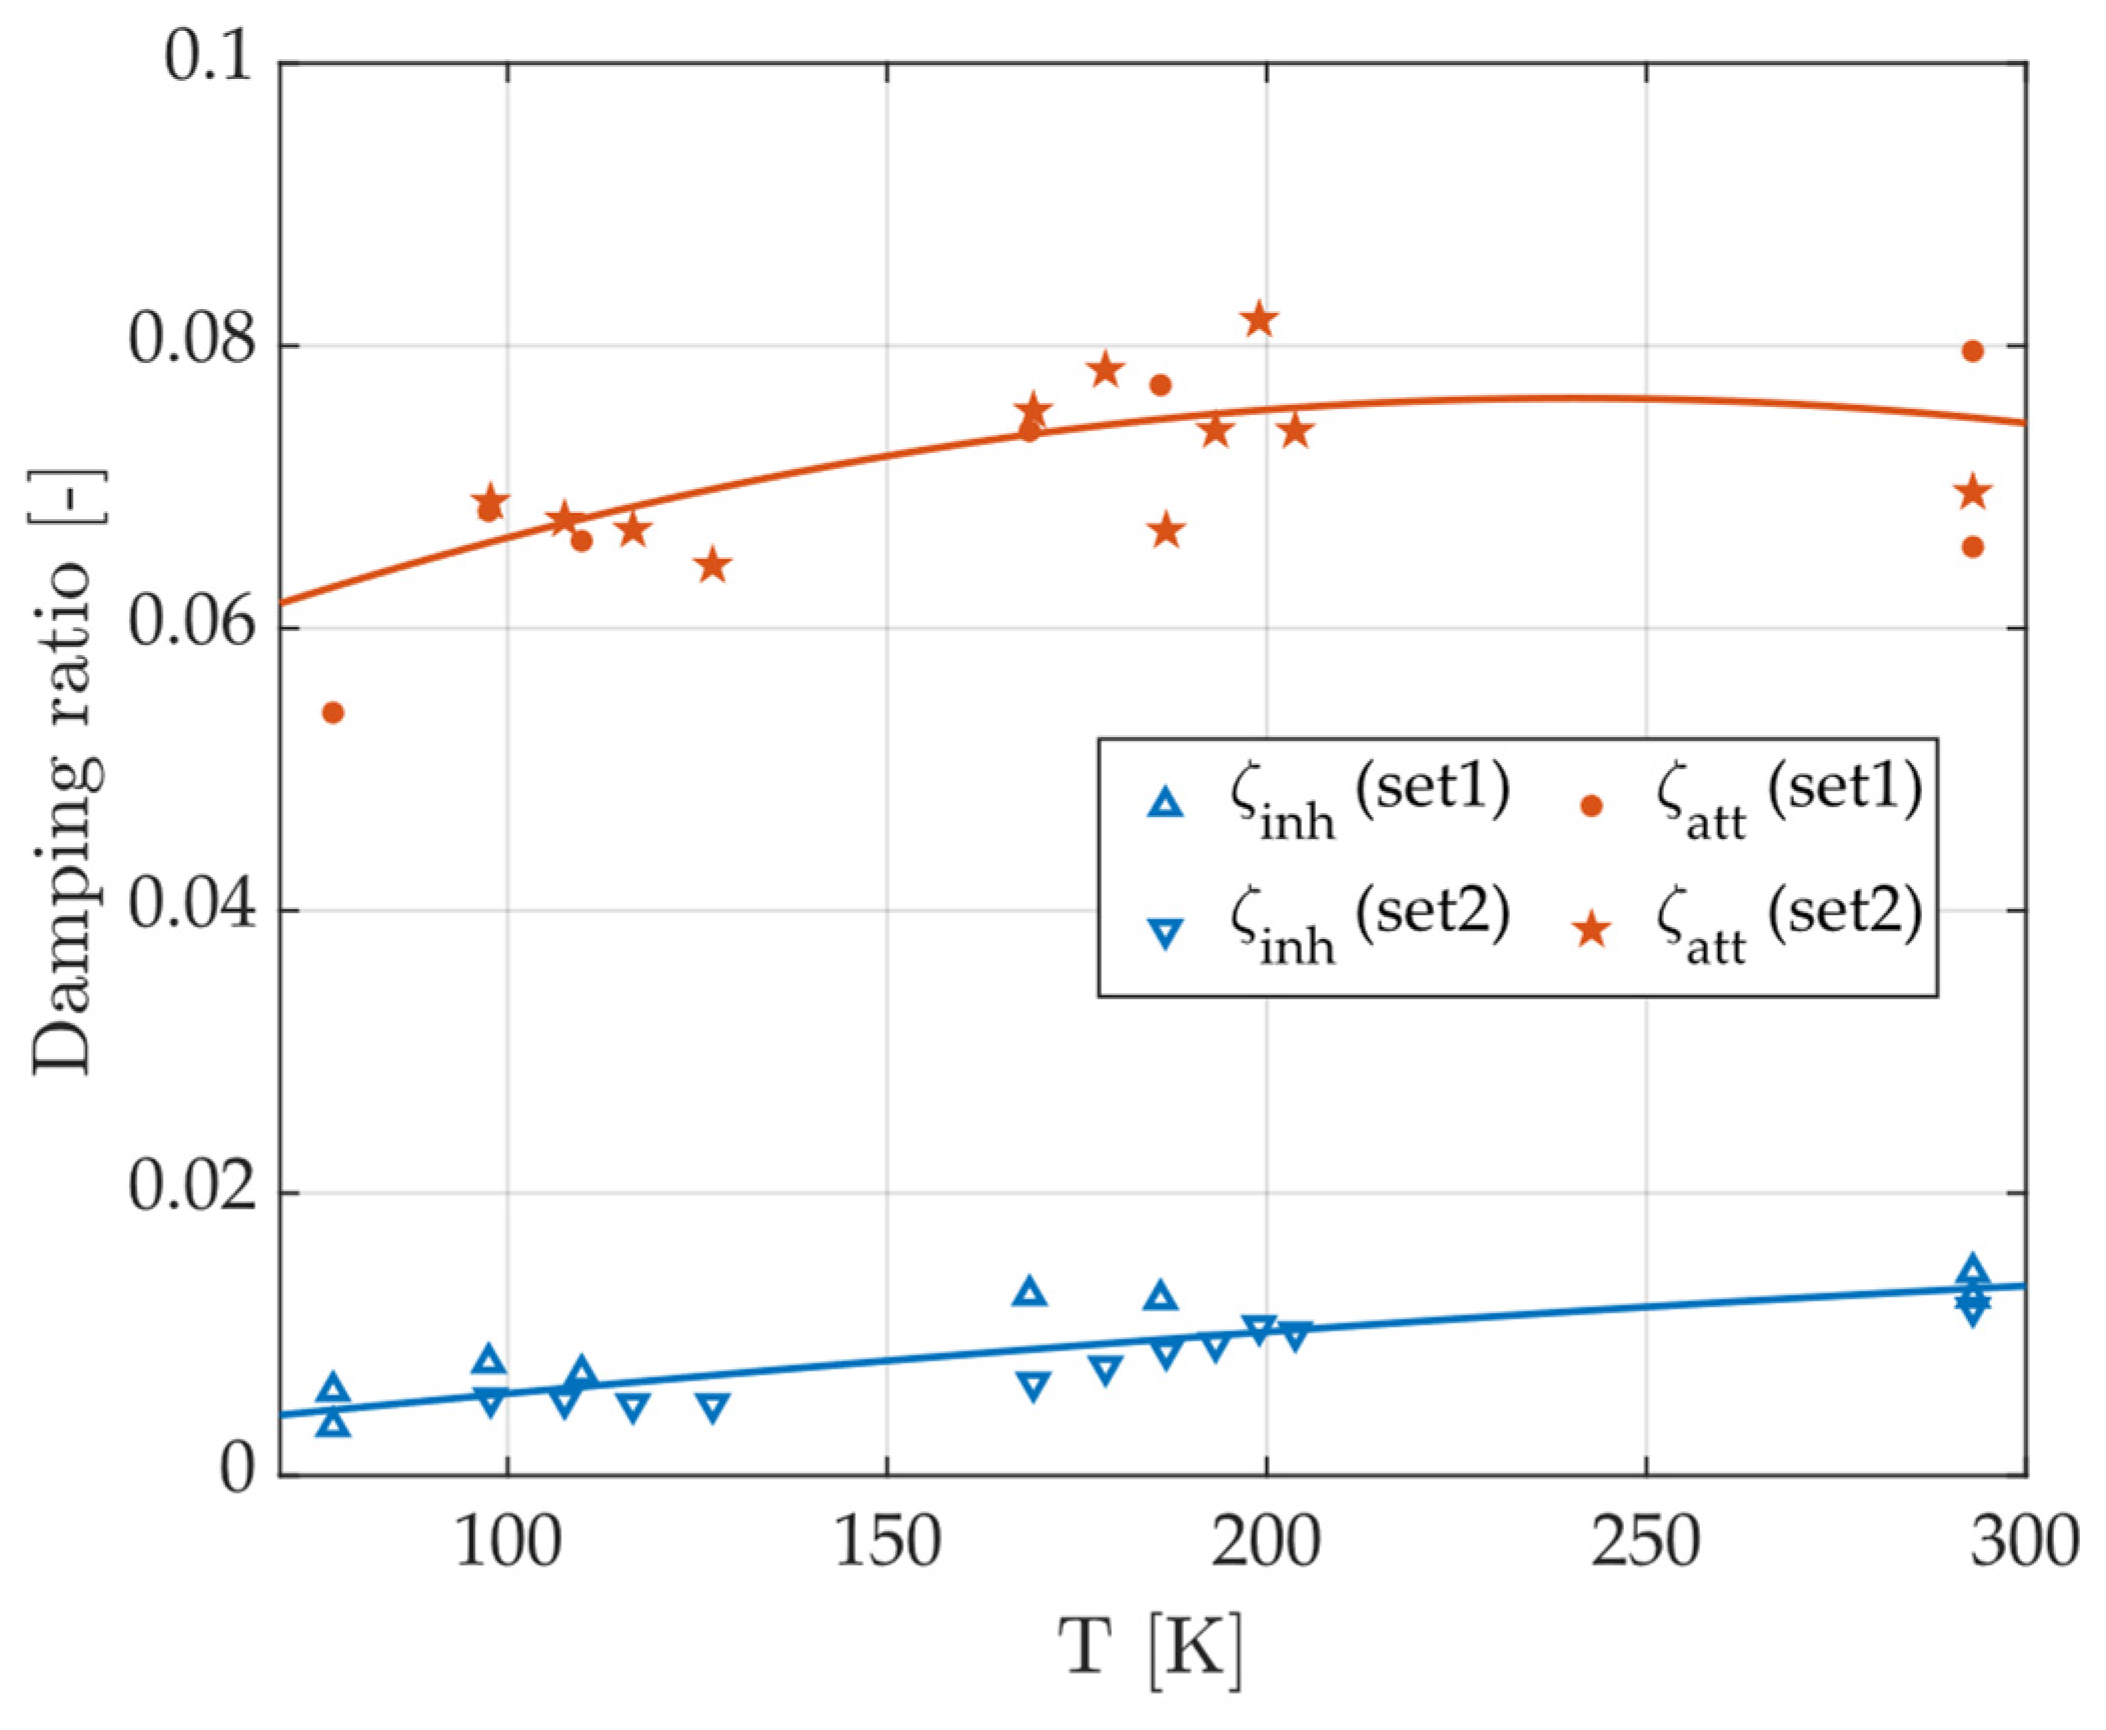
6.2. Shunt Damping at Cryogenic Temperatures

The generalized electromechanical coupling factor, K i , for the translation mode in the X direction at 160 Hz, was measured as a function of the temperature during heating from 77 K at a rate of about 10 K/h, as shown in Figure 17. The thermal cycle was repeated twice, leading to the following two data sets: set 1 and set 2. For each data point, the resonance frequency of the system was measured when all the transducers had open and short-circuited electrodes; next, K i was deduced using Equation (9). The solid line describes an approximate fit. As expected, K i decreased as the temperature decreased due to the change in the piezoelectric material property of k 33 (see Figure 8), exhibiting a maximum of around 200 K, which is likely associated with the change in the setup stiffness distribution and, thus, the fraction of strain energy addressed by the various transducers.
Figure 18 shows the FRF of the system with and without the RL shunt damping at 77 K and 293 K. Only P4 was used. Figure 19 finally shows the temperature-dependent RL shunt damping ratio that was obtained compared with the damping that is inherently present in the structure without shunt damping (ranging from 0.5% to 1.5%). Damping values at distinct temperatures are shown in Table 3. Only a relatively small decrease in piezoelectric damping was observed at 80 K relative to room temperature. Compared to the very low inherent damping ζ i n h = 0.6%, the RL shunt enables the significant attenuation by a factor of 12 to 15, corresponding to an increase in the level of damping of about 7–9% at 80 K.

7. Conclusions

The effectiveness of passive piezoelectric shunt damping at cryogenic temperatures is demonstrated as a viable option for reducing vibration amplitudes flexure-based systems. The relative damping in a kinematically supported superconducting magnet plate at 80 K was increased by over an order of magnitude from 0.6% (inherent damping) to a favorable amount of 7–9%. The study shows that the piezoelectric properties related to the damping performance slightly decreases with respect to room temperature, on the order of 15%, which is in line with the similarly small decrease in the electromechanical coupling factor, k 33 . Although it was found that eddy current damping cannot provide the required damping performance at 80 K, the preliminary study demonstrates higher potential for applications at lower operating frequencies and temperatures. Future studies and experiments should be conducted on full-sized demonstrators operating near 4 K. Updating the model of the test setup is also beneficial to facilitate future studies.

Author Contributions

Conceptualization, methodology, validation, formal analysis, ALL AUTHORS; writing—original draft preparation, N.A.; writing—review and editing, ALL AUTHORS; supervision, B.M. and H.V.; project administration, H.V.; funding acquisition, H.V. All authors have read and agreed to the published version of the manuscript.

Funding

This research received no external funding.

Data Availability Statement

No new data were created or analyzed in this study. Data sharing is not applicable to this article.

Acknowledgments

This study was supported by ASML. A. Preumont, from Université Libre de Bruxelles, is much acknowledged for providing the active electrical circuits used in the experimental study.

Conflicts of Interest

The authors declare that the research was conducted in the absence of any commercial or financial relationships that could be construed as a potential conflict of interest.

References

  1. van Schoot, J.; van Setten, E.; Troost, K.; Lok, S.; Peeters, R.; Stoeldraijer, J.; Benschop, J.; Zimmerman, J.; Gräupner, P.; Kürtz, P.; et al. High-NA EUV lithography exposure tool program progress. In Proceedings of the SPIE Advanced Lithography, San Jose, CA, USA, 23–27 February 2020. [Google Scholar]
  2. De Bruyn, B.J.H. Superconducting Linear Motors for High-Density Applications. Ph.D. Thesis, Eindhoven University of Technology, Eindhoven, The Netherlands, 2018. [Google Scholar]
  3. Koolmees, H.B.; de Bruyn, B.J.H.; Vermeulen, J.P.M.B.; Jansen, J.W.; Lomonova, E.A. On the Performance Potential of Superconducting Linear and Planar Motors. In Proceedings of the 17th Euspen International Conference, Hannover, Germany, 29 May 2017–2 June 2017. [Google Scholar]
  4. Koolmees, H.B.; Vermeulen, J.P.M.B. High Stiffness Cryogenic Support without Thermal. Conductance. Patent No. WO 2019072529 A1, 11 October 2017. [Google Scholar]
  5. Koolmees, H.B.; Vermeulen, J.P.M.B. High stiffness fixation and thermal insulation in a superconducting planar motor. In Proceedings of the 18th Euspen International Conference, Venice, Italy, 4–8 June 2018; pp. 3908–3913. [Google Scholar]
  6. Koolmees, H.B. A Superconducting Magnet Plate for a Planar Motor Application. Ph.D. Thesis, Eindhoven University of Technology, Eindhoven, The Netherlands, 2020. [Google Scholar]
  7. Lakes, R.S. High damping composite materials. J. Compos. Mater. 2002, 36, 287–297. [Google Scholar] [CrossRef]
  8. Levine, M.B.; White, C. Material damping experiments at cryogenic temperatures. In Proceedings of the Optical Materials and Structures Technologies, SPIE 48th Annual Meeting, San Diego, CA, USA, 4–7 August 2003; Volume 5179, p. 165. [Google Scholar]
  9. Gunter, E.J.; Humpris, R.R. Design Study of Magnetic Eddy Current Dampers for Application to Cryogenic Turbo-Machinery. Report No. UVA/528210/MAE84/101, Contractor Report NASA Grant NAG-3-263; University of Virginia: Charlottesville, VA, USA, 1983. [Google Scholar]
  10. Cunningham, R.E. Passive Eddy-Current Damping as a Means of Vibration Control in Cryogenic Turbomachinery; NASA Tech Paper 2562; Lewis Research Center: Cleveland, OH, USA, 1986. [Google Scholar]
  11. NASA Tech Port. Cryogenic Vibration Damping Mechanisms for Space Telescopes and Interferometers; California Jet Propulsion Laboratory: La Cañada Flintridge, CA, USA, 2005. Available online: https://techport.nasa.gov/view/5809 (accessed on 1 May 2024).
  12. Zheng, J.; Deng, Z.; Zhang, Y.; Wang, W.; Wang, S.; Wang, J. Performance improvement of high temperature superconducting maglev system by eddy current damper. IEEE Trans. Appl. Supercond. 2009, 19, 2148–2151. [Google Scholar] [CrossRef]
  13. Jiang, Z.F.; Gou, X.F. Eddy damping effect of additional conductors in superconducting levitation systems. Phys. C Supercond. Its Appl. 2015, 519, 112–117. [Google Scholar] [CrossRef]
  14. Sodano, H.A.; Bae, J.S.; Inman, D.J.; Belvin, W.K. Concept and model of eddy current damper for vibration suppression of a beam. J. Sound Vib. 2005, 288, 1177–1196. [Google Scholar] [CrossRef]
  15. Janssen Precision Engineering. Cryogenic Material Properties. Available online: http://www.jpe-innovations.com/precision-point/cryogenic-material-properties/ (accessed on 1 May 2024).
  16. Gripp, J.A.B.; Rade, D.A. Vibration and noise control using shunted piezoelectric transducers: A review. Mech. Syst. Signal Process. 2018, 112, 359–383. [Google Scholar] [CrossRef]
  17. Johnson, W.C. Transmission Lines and Networks, 1st ed.; McGraw-Hill: New York, NY, USA, 1950; pp. 58–79. [Google Scholar]
  18. Marakakis, K.; Tairidis, G.K.; Koutsianitis, P.; Stavroulakis, G.E. Shunt piezoelectric systems for noise and vibration control: A review. Front. Built Environ. 2019, 5, 64. [Google Scholar] [CrossRef]
  19. Jaffe, H. Piezoelectric ceramics. J. Am. Ceram. Soc. 1958, 41, 494–498. [Google Scholar] [CrossRef]
  20. Taylor, R.P.; Nellis, G.F.; Klein, S.A.; Hoch, D.W.; Fellers, J.; Roach, P.; Park, J.M.; Gianchandani, Y. Measurements of the material properties of a laminated piezoelectric stack at cryogenic temperatures. AIP Conf. 2006, 824, 200–207. [Google Scholar]
  21. Jiang, X.; Cook, W.B.; Hackenberger, W.S. Cryogenic piezoelectric actuators. In Astronomical and Space Optical Systems; SPIE: San Diego, CA, USA, 2009; Volume 7439, p. 74390Z. [Google Scholar]
  22. Mokrani, B. Piezoelectric Shunt Damping of Rotationally Periodic Structures. Ph.D. Thesis, Université Libre de Bruxelles, Brussels, Belgium, 2015. [Google Scholar]
  23. Tsai, H.C.; Lin, G.C. Explicit formulae for optimum absorber parameters for force excited and viscously damped systems. J. Sound Vib. 1994, 176, 585–596. [Google Scholar] [CrossRef]
  24. Zhang, X.L.; Chen, Z.X.; Cross, L.E.; Schulze, W.A. Dielectric and piezoelectric properties of modified lead titanate zirconate ceramics from 4.2 to 300 K. J. Mater. Sci. 1983, 18, 968–972. [Google Scholar] [CrossRef]
  25. Naimon, E.R.; Weston, W.F.; Ledbetter, H.M. Elastic properties of two titanium alloys at low temperatures. Cryogenics 1974, 14, 246–249. [Google Scholar] [CrossRef]
  26. Sabat, R.G.; Mukherjee, B.K.; Ren, W.; Yang, G. Temperature dependence of the complete material coefficients matrix of soft and hard doped piezoelectric lead zirconate titanate ceramics. J. Appl. Phys. 2007, 101, 064111. [Google Scholar] [CrossRef]
  27. Antoniou, A.; Naidu, K.S. Modeling of a gyrator circuit. IEEE Trans. Circuit Theory 1973, 20, 533–540. [Google Scholar] [CrossRef]
Figure 1. Evolution of photolithographic resolution over the last 4 decades (critical dimension, viz., the size of the smallest feature that can be printed on a microchip) and the sizes of ASML machines. Each evolutionary step is achieved by reducing the light source wavelength, λ; increasing the numerical aperture, NA, of the optical column; or both.
Actuators 13 00405 g001
Figure 2. Schematic representation of the superconducting dual-stage planar motor for lithography application with various components, viz., two magnetically levitated movers (green) at room temperature carrying the wafer (blue), cold frame (light blue) with superconducting coils (orange), active thermal shield (yellow), vacuum vessel (gray), and struts for kinematic mounting (dark blue) [6].
Actuators 13 00405 g002
Figure 3. Demonstrator of a superconducting magnet plate for potential application in an in vacuum planar motor: (a) isometric view—the three-phase normal coils are magnetically levitated on top of the vessel; (b) cross-sectional view—the superconducting coils are mechanically fixed to the cold frame (blue) and thermally isolated, via an isolation frame (yellow), from the environment.
Actuators 13 00405 g003
Figure 4. Electrical conductivity of copper as a function of temperature (adapted from [15]), which shows a significant increase below 80 K.
Actuators 13 00405 g004
Figure 5. Ratio of effective conductivity to electrical conductivity of copper OFHC.
Actuators 13 00405 g005
Figure 6. Single degree of freedom piezoelectric system shunted in series on a resistor, R, and an inductor, L.
Actuators 13 00405 g006
Figure 7. FRF of a single degree of freedom piezoelectric system without (blue) and with (orange) an RL shunt tuned to the mechanical resonance (adapted from [22]).
Actuators 13 00405 g007
Figure 8. The piezoelectric, electromechanical, and dielectric constants (for PZT Navy Type II) as a function of temperature (adapted from [25]).
Actuators 13 00405 g008
Figure 9. (a) Two piezoelectric transducers implemented in a V-frame; (b) single NAC2014-H34P piezo transducer with pre-loaded springs.
Actuators 13 00405 g009
Figure 10. Demonstrator setup showing locations and numbering of all six piezoelectric transducers.
Actuators 13 00405 g010
Figure 11. Fraction of the strain energy per mode, obtained using FEM simulations as a qualitative measure of the piezoelectric transducer’s efficiency in dampening a particular vibration mode. The colors are associated with each piezo stack.
Actuators 13 00405 g011
Figure 12. Nodal displacement of the modes at 150 Hz (Ry rocking mode) and 210 Hz (X translation mode) from FEM simulation.
Actuators 13 00405 g012
Figure 13. Test setup for measuring cryogenic damping: (a) piezoelectric transducers implemented as part of the V-frames that support the isolation frame connected to the vacuum vessel (only partly visible). Here, the cold frame is removed. (b) Isolated test setup, including full vacuum vessel, filled with liquid nitrogen for cooling to cryogenic temperatures.
Actuators 13 00405 g013
Figure 14. Measured FRFs, x ¨ / V , at 293 K using different electrical boundary conditions for the circuited electrodes, with a focus on the resonance frequency of the mode along the X direction. The open- and short-circuited resonance frequencies are used to calculate the fraction of strain energy for the different transducers using Equations (9) and (10).
Actuators 13 00405 g014
Figure 15. Fraction of strain energy for the R y - and X -mode shapes from the measurement at 293 K. P2 is used for excitation to measure the FRFs.
Actuators 13 00405 g015
Figure 16. Measured FRFs using all 5 transducers at 293 K for short- and open circuited electrodes (undamped), and using a single transducer with the tuned RL-shunt (damped). The targeted mode around 160 Hz corresponds to the translation mode in X direction.
Actuators 13 00405 g016
Figure 17. Measured generalized coupling factor vs. temperature, with each data set representing measurements performed within the same temperature cycle. The targeted mode around 160 Hz corresponds to the translation mode in X direction.
Actuators 13 00405 g017
Figure 18. Measured FRFs at various temperatures with the transducer P4 shunted on an RL circuit and tuned on the X mode.
Actuators 13 00405 g018
Figure 19. Damping ratio of the X mode vs. temperature with (i) only the P4 transducer RL shunted, ζ p i e z o , and (ii) without any shunt damping ( ζ i n h ). The targeted mode, around 160 Hz, corresponds to the translation mode in the X direction.
Actuators 13 00405 g019
Table 1. Dynamic specifications of the cold frame and the isolation frame in the cryostat at 10 K and 80 K, respectively.
Isolation FrameCold Frame
T 80 K10 K
f n 50–500 Hz500–1000 Hz
ζ 5–10%1–2%
Table 2. Electromechanical coupling factor and elastic compliance of multilayer ceramic PZT at various temperatures [24,26].
T   [ K ] k 33 [-] s E   [ μ m 2 / N ]
2930.6718.5
800.5815.0
40.5213.7
Table 3. Measured maximum obtainable modal damping ( ζ p i e z o ,   m a x ) using all 5 transducers simultaneously and realized damping ( ζ p i e z o ) based on the most effective transducer only at distinct temperatures.
T   [ K ] ζ p i e z o , m a x   % ζ p i e z o   [ % ]
29310.27.5
20010.37.5
1009.06.6
808.56.3
Disclaimer/Publisher’s Note: The statements, opinions and data contained in all publications are solely those of the individual author(s) and contributor(s) and not of MDPI and/or the editor(s). MDPI and/or the editor(s) disclaim responsibility for any injury to people or property resulting from any ideas, methods, instructions or products referred to in the content.

