Abstract
The development of the electrification of aircraft has prompted aviation hydraulic systems to shift from traditional centralized valve actuators (CVAs) to electro-hydrostatic actuators (EHAs). In this paper, aiming at the demand for a quantitative comparison of performance between CVAs and EHAs, CVA and EHA prototypes with the same power level and test platform were developed. Then, based on the power flow and dynamic models of the CVA and EHA, simulation and experimental comparative tests were conducted using different load spectrum test conditions and step response test conditions. The comparative test results showed that the efficiency of the EHA was better than that of the CVA, and the dynamic response of the CVA was better than that of the EHA. Finally, a power loss quantification and parameter sensitivity analysis were performed to reveal the impact of different parameters on the different power losses and to provide suggestions for improving the performance of CVAs and EHAs.
1. Introduction
Aviation hydraulic systems are widely used in actuation control scenarios, such as in aircraft surface drive and landing gear retraction [1,2]. Traditional fly-by-wire (FBW) type aircraft hydraulic systems use centralized valve-controlled actuators (CVAs) to achieve aircraft surface control. The energy for the CVA comes from an engine-driven pump (EDP), and the hydraulic power is transmitted through thin-walled high-pressure pipelines [3]. When using a centralized oil source to drive multiple surfaces, power matching is difficult and inevitably results in significant power loss and heat [4]. Moreover, the total length of hydraulic pipelines in large aircraft is thousands of meters, and risks such as vibration fatigue, seal failure, damage, and rupture threaten the reliability and safety of aviation hydraulic systems [5]. Therefore, the power-by-wire (PBW) aircraft hydraulic system was proposed to convert the energy of the actuator from hydraulic pipeline transmission to electric power transmission. An electro-hydrostatic actuator (EHA) is a typical PBW-type hydraulic system component, which has the advantages of high efficiency, high power density, no pipeline, and easy maintenance [6,7].
Although most hydraulic systems on aircraft still use CVAs for surface control, EHAs are increasingly being studied and applied on aircraft such as the the A380 and B787 [8,9,10]. In order to ensure that the actuator can meet flight requirements, a reliable performance comparison analysis is required before replacing CVAs with EHAs [11,12,13]. Efficiency and dynamic response are key characteristics of CVAs and EHAs [14]. A low efficiency increases the power, weight, and heat of the actuator, thereby reducing its reliability and service life [15,16,17]. A slow dynamic response will cause the actuator action to lag behind the surface action requirements, making it impossible to adjust the aircraft attitude in time. In severe cases, this may even threaten flight safety [18].
For comparative studies on the efficiency and dynamic response of CVAs and EHAs, Quan et al. [19] reviewed different types of CVAs and EHAs and found that the throttling loss of the main pipeline in CVAs generates a large amount of power loss and heat, while EHAs can avoid this problem and have a higher efficiency. Li et al. [20] established a lumped-parameter thermal-hydraulic model based on power losses to estimate the heat production of EHAs. Through simulation analysis, the authors found that compared with CVAs, EHAs are more efficient, but their heat dissipation performance is poor because there is no centralized oil tank and the pipeline is short. Hu et al. [21] compared the efficiency characteristics of CVAs and EHAs through simulation and found that the power loss of CVAs mainly comes from the throttling loss of the servo valve, the power loss of EHAs mainly comes from the copper loss of the motor, while the efficiency of EHAs is higher than that of CVAs. Navatha et al. [22] analyzed the efficiency and dynamic response of EHAs and pointed out that EHAs combine the advantages of traditional hydraulic systems and direct-drive actuators. Maré et al. [23] took the aileron actuation of a single-aisle commercial aircraft as the research object and established an inverse simulation method based on a bi-causal bond-graph to calculate the power demand of aircraft power sources during a generic flight mission. The modeling focused on the friction in the cylinder, friction torque and volumetric loss of the pump, friction torque of the roller screw, the electric motor rotor drag and copper losses, and finally on the motor drive conduction and switching losses within the power electronics. The power demand and overall efficiency of CVAs and EHAs were calculated. The results showed that the actuators of CVAs and EHAs are required to mainly operate at very low speeds and holding loads, the CVA mean efficiency over the whole mission was less than 0.1%, and the overall EHA average efficiency was close to 1%. However, this study did not perform prototype verification and ignored the power loss along the pipeline of the CVA, the iron loss of the motor in the EHA, and the power loss on the energy generation side (the pressure-compensated pump source of the CVA and the electrical generator of the EHA). Maré et al. [24] further analyzed the above simulation data, and it was found that the internal leakage of the servo valve puts a high penalty on the efficiency of the CVA for the entire mission profile. The power loss of the motor driver and the copper loss of the motor also decreased the efficiency of the EHA for the entire mission profile. Gaile et al. [25] conducted a categorical review of CVAs and EHAs and summarized different power losses. Through a performance comparison, it was found that EHAs have advantages in efficiency, volume, weight, and repair, but have disadvantages in dynamics and failure management. However, this study only conducted a qualitative comparative analysis and lacked experimental verification of actual prototypes.
Li et al. [26] analyzed the dynamic characteristics of EHAs from the two aspects of natural frequency and motor power demand. They found that the EHAs had a poorer dynamic response compared with CVAs. Then, methods to increase the maximum output torque and reduce the motor inertia were proposed to improve the dynamic response of EHAs, and a simulation and experimental verification were conducted. Waheed et al. [27] took a redundant actuation system as research object and conducted modeling and dynamic response characteristic analysis of a CVA and EHA. The same controller was used to control the CVA and EHA, and it was found that the dynamic response of the CVA was better than that of the EHA. Hu et al. [28] established efficiency and dynamic response models of CVAs and EHAs, respectively. Then, the step response and power loss under the same flight control surface were simulated and analyzed. Simulation results showed that compared with the EHA, the CVA had a faster step response but higher power losses. However, this study lacked an experimental validation.
In the comparative analysis of CVAs and EHAs in existing studies, some areas such as the unquantified power loss and sensitivity analysis need improvement. Furthermore, the impact of parameter changes on different power losses of CVAs and EHAs remains unclear. In this paper, CVA and EHA prototypes, as well as a test platform, are developed. Based on power flow and dynamic models of the CVA and EHA, different load spectrum and step response test conditions were designed to conduct simulation and experimental comparative tests. A power loss quantification and parameter sensitivity analysis were carried out to reveal the impact of different parameters on different power losses. The main contributions are as follows:
- (1)
- A test platform and prototypes of a CVA and EHA were developed. Quantitative results of power losses under different test conditions are provided.
- (2)
- Parameter sensitivity analysis of different power losses was conducted, and suggestions for performance optimization of CVAs and EHAs are provided.
The remainder of this paper is organized as follows. Section 2 establishes the power flow and dynamic models of the CVA and EHA. In Section 3, different load spectrum test conditions and step test conditions are designed, and the performances of the CVA and EHA are simulated and compared. Section 4 develops a test platform and prototypes, and carries out a matching verification between the simulation and experimental results. Furthermore, power loss quantification and parameter sensitivity analysis are conducted in the same section. The conclusions are provided in Section 5.
2. Modeling of CVAs and EHAs
2.1. Operating Principles
CVAs mainly comprise a cylinder, servo valve, controller, and centralized oil source. Their operating principle is shown in Figure 1. The centralized oil source converts electrical or mechanical energy into hydraulic energy, and the output high-pressure oil flows into the cylinder after passing through the servo valve. The controller adjusts the oil flowing into the cylinder by controlling the valve port opening in the servo valve, thereby realizing displacement control of the cylinder. The displacement sensor installed in the cylinder detects the displacement of the cylinder in real time and feeds it back to the controller. The controller outputs the control command of the servo valve according to the difference between the expected displacement and the actual displacement, and then realizes the displacement control of the cylinder by regulating the valve port opening. At present, the centralized oil source in aviation hydraulic systems usually uses a pressure-compensated variable displacement pump and one centralized oil source to drive multiple cylinders. In this paper, the oil source is regarded as a constant-pressure oil source with a sufficient flow rate and a stable pressure of 28 MPa. In the actual CVA, auxiliary components such as the mode selection valve, bypass solenoid valve, block solenoid valve, and pressure relief valve are assembled [29]. However, considering that these auxiliary components have little impact on the efficiency and dynamic response performance of CVAs, they are ignored in the subsequent modeling studies.
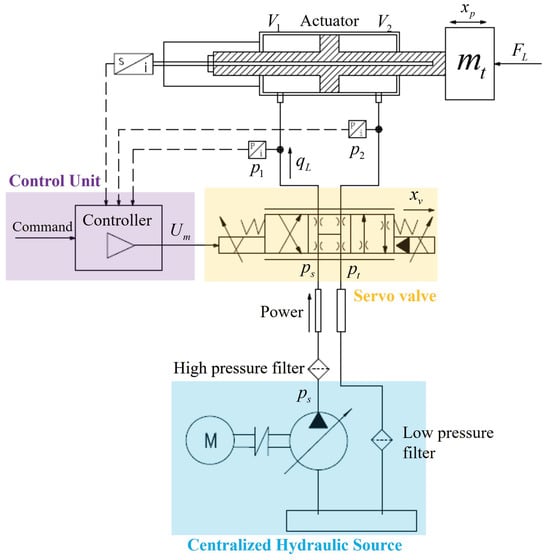
Figure 1.
Operating principle of CVA.
An EHA controls the size and direction of the flow in and out of the cylinder through a motor or a pump. According to different control variables, EHAs can be divided into three types [30]: the fixed pump displacement variable motor speed type (EHA-FPVS), variable pump displacement fixed motor speed type (EHA-VPFS), and variable pump displacement variable motor speed type (EHA-VPVS). The EHA studied in this paper belongs to the EHA-FPVS type, which have the advantages of high reliability, simple structure, and good controllability. In this paper, the EHA is mainly composed of a cylinder, a bidirectional gear pump, a variable speed motor, an accumulator, a valve block, and control units (including a power control unit (driver) and an electronic control unit (controller)). Its operating principle is shown in Figure 2. First, the motor converts electrical energy into rotational mechanical energy and transmits it to the gear pump. The gear pump then converts the rotational mechanical energy into hydraulic energy and transmits it to the cylinder. Finally, the cylinder converts the hydraulic energy into reciprocating mechanical energy. The displacement sensor installed in the cylinder detects the displacement of the cylinder in real time and feeds it back to the controller. The controller outputs motor control commands according to the expected and feedback displacements. In this paper, the EHA realizes the displacement control of the cylinder by adjusting the motor speed.
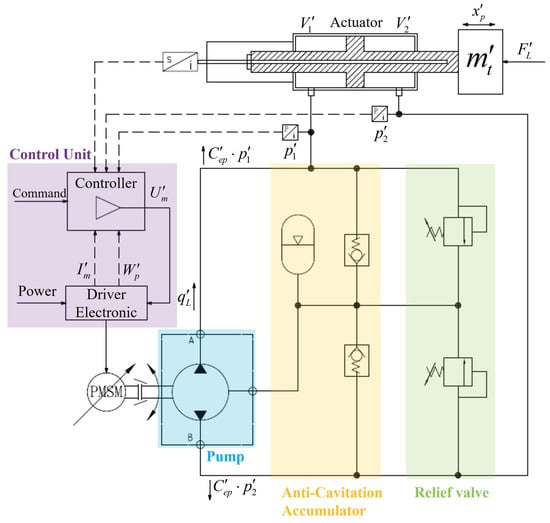
Figure 2.
Operating principle of EHA.
2.2. Modeling
- (1)
- Modeling of the CVA
The CVA models include a power flow model and a dynamic model.
1) Power flow model
The main power losses of the CVA mainly include power loss along the pipeline, throttling power loss of the servo valve, and leakage power loss in the cylinder [31].
a) Power loss along the pipeline
The centralized oil source of the aircraft hydraulic system is installed near the engine, while cylinders are installed on control surfaces. The distance between the oil source and the cylinder is generally large, and the power loss along the pipeline cannot be ignored. As shown in Figure 1, the power loss along the pipeline on the high-pressure side of the CVA includes the power loss along the high-pressure pipeline from the pump outlet to the servo valve inlet P and the local power loss caused by components such as high-pressure filters, pipe adaptors, and pipe elbows [32]. The power loss along the pipeline on the low-pressure side of the CVA includes the power loss along the low-pressure pipeline from the drain port T of the servo valve to the pressurized oil tank and the local power loss caused by components such as low-pressure filters, pipe adaptors, and pipe elbows.
The Reynolds number of the oil in the aviation hydraulic pipeline is
where is the oil flow velocity in the hydraulic pipeline, is the inner diameter of the hydraulic pipeline on the high-pressure side, and is the kinematic viscosity of the oil. When , the oil in the hydraulic pipeline is in the laminar flow state. When , the oil in the hydraulic pipeline is in the turbulent flow state. Therefore, the resistance coefficient along the hydraulic pipeline is
Then, the pressure loss along the hydraulic pipeline is
where is the length of the hydraulic pipeline on the high-pressure side.
The local pressure loss due to a single pipe elbow in the hydraulic pipeline is calculated as
where is the pipe elbow resistance coefficient. As the diameter of the pipe elbow is generally four times the inner diameter of the hydraulic pipeline, it is set to in this paper.
Since the inner diameter of the pipe adaptor is generally smaller than the inner diameter of the hydraulic pipeline, the pipe adaptor can be regarded as the inner diameter of the hydraulic pipeline that first becomes smaller and then becomes larger.The local pressure loss due to the pipe adaptor is then calculated as
where is the variable diameter resistance coefficient when the inner diameter of the hydraulic pipeline changes from large to small, and is the variable diameter resistance coefficient when the inner diameter of the hydraulic pipeline changes from small to large. The calculations of and are as follows
where is the inner diameter of the pipe adaptor on the high-pressure side.
According to Equations (3)–(5), the total power loss of the hydraulic pipeline on the high-pressure side is
where is the total pressure loss of the hydraulic pipeline on the high-pressure side; is the pressure loss of the high-pressure filter; and , , and are the number of pipe elbows, pipe adaptors, and high-pressure filters in the high-pressure side pipeline, respectively.
Similarly, the total power loss of the hydraulic pipeline on the low-pressure side is
where is the total pressure loss of the hydraulic pipeline on the low-pressure side; and , , , and are the pressure loss along the pipeline, the pressure loss of the pipe elbow, the pressure loss of the pipe adaptor, and the pressure loss of the low-pressure filter on the low-pressure side, respectively. It is worth noting that and in Equations (3)–(8) need to be replaced by the inner diameter of the low-pressure side pipeline and the inner diameter of the low-pressure side pipe adaptor , respectively.
During the period from to , the average power loss along the pipeline of the CVA is calculated as
b) Throttling power loss of the servo valve
The throttling power loss of the servo valve is [33]
where , , , and are the pressure at ports P, T, 1, and 2, respectively. Among them, and . and are the outlet pressure of the pressure-compensated variable displacement pump source and the pressure of the reservoir, respectively.
During the period from to , the average throttling power loss of the servo valve in the CVA is calculated as
c) Leakage power loss in the cylinder
The leakage power loss in the cylinder is
During the period from to , the average leakage power loss in the cylinder is calculated as
In summary, the average efficiency of the CVA is
2) Dynamic model
In this paper, the main stage of the servo valve in the CVA is a four-way slide valve, and its linearized flow equation is
where is the load flow, and . and are the inlet and outlet flow of the cylinder, respectively. is the load pressure, and . and are the inlet and outlet pressure of the cylinder, respectively. is the displacement of the servo valve spool, is the flow gain of the servo valve, and is the flow-pressure coefficient of the servo valve.
Set as the initial oil inlet chamber volume of the cylinder, as the initial oil return chamber volume of the cylinder, and as the total volume of the cylinder. When the piston is in the middle position of the cylinder, that is, when , the compressibility of the oil in the cylinder is the largest, the natural frequency of the power element is the lowest, and the damping ratio is the smallest. At this time, the stability of the CVA is the worst. Therefore, this paper sets the initial position of the piston to the middle position of the cylinder when analyzing the dynamic performance. Since the external leakage is usually very small and can be ignored, the compression flow rate of the two cylinder chambers is approximately the same, namely . The flow continuity equation of the cylinder is
where is the piston area of the cylinder, is the displacement of the piston, and is the internal leakage coefficient of the piston. is the external leakage coefficient of the piston, is the bulk elastic modulus of the oil, is the piston leakage coefficient, and . It is worth noting that, in order to improve the dynamic response, the servo valve is installed directly on the cylinder of the CVA. Compared with the volume of the two cylinder chambers, the volume between the servo valve and the actuator is very small and can be ignored. Therefore, the pipeline volume from the valve to the cylinder is not considered. The CVA studied in this paper has no elastic load, and the viscous damping load is small enough to be negligible. Therefore, the balance equation of the cylinder and load force is
where is the equivalent mass of the piston and the load, and is the external load force acting on the piston.
Generally, the linearity and dynamic response of the servo valve are much better than that of the cylinder, so that the servo valve can be regarded as a proportional element. The spool displacement of the servo valve is proportional to its voltage command signal; that is,
where is the electromagnet amplification factor of the servo valve.
After solving Equations (16)–(19) with a Laplace transform, the transfer function of the CVA is obtained as
where is the total flow–pressure coefficient of the CVA, and . is the hydraulic natural frequency of CVA, and . is the hydraulic damping of CVA, and . A block diagram corresponding to Equation (20) is shown in Figure 3.
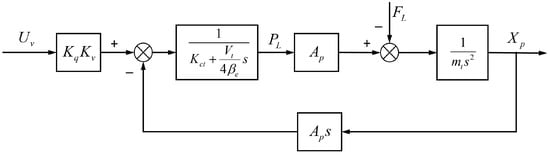
Figure 3.
Transfer function block diagram of CVA.
- (2)
- Modeling of the EHA
The EHA models include a power flow model and a dynamic model.
1) Power flow model
The main power loss of the EHA includes the gear pump power loss, motor power loss, and leakage power loss in the cylinder.
a) Gear pump power loss
The gear pump power loss mainly includes leakage power loss and mechanical friction power loss. Among them, the leakage power loss mainly includes the leakage power loss of the gear end face gap and the leakage power loss of the gear radial gap. The mechanical friction power loss is caused by many factors, mainly including the viscous friction power loss between the gear side/liquid and the viscous friction power loss between the addendum surface/pump body.
The leakage flow rate of the gear end face gap is [34]
where and are the wrap angles of the transition zone and high-pressure zone in the gear pump, respectively. is the dynamic viscosity of the oil, Z is the number of gear teeth, is the radius of the dedendum circle, is the radius of the gear shaft, is the pressure difference between the high-pressure chamber and the low-pressure chamber, is the axial gap between the gear and the end face, and is the oil density.
The leakage flow of the gear radial gap is
where B is the width of the gear, is the thickness of the addendum, is the number of teeth in the transition zone, is the radial gap between the addendum and the pump case, and is the radius of the addendum circle.
According to Equations (21) and (22), the volumetric efficiency of the gear pump can be calculated as
The viscous friction loss between the gear side/liquid is [35]
where is the radius of the pitch circle.
The viscous friction loss between the addendum surface/pump body is
According to Equations (24) and (25), the mechanical efficiency of the gear pump can be calculated as
The overall efficiency of the gear pump is
During the period from to , the average power loss of the gear pump is calculated as
b) Motor power loss
The power loss of the permanent magnet synchronous motor (PMSM) mainly includes the winding copper loss, the stator iron loss, and the rotor eddy current loss. Usually, the value of the rotor eddy current loss is low and can be ignored in power flow modeling [36].
The winding copper loss is the Joule heat loss caused by the current flowing through the conductor, which is one of the critical factors affecting motor heating [36]. The winding copper loss can be calculated as
where is the phase number of the motor winding, is the phase current of the motor, is the AC resistance of the winding, and is the q-axis current in the rotating coordinate system. When the amplitude constant constraint is adopted, the q-axis current equals the amplitude of the phase current.
The stator iron loss is another critical power loss of the PMSM, mainly composed of magnetic hysteresis loss, eddy current loss, and additional loss. The stator iron loss can be calculated as
where is the effective mass of the iron core lamination, and is the empirical coefficient of iron loss, which can be obtained by reverse deduction from a motor experiment or simulation data. is the iron loss corresponding to the unit weight of the iron core lamination when the magnetic field frequency is 50 Hz and the magnetic density amplitude is 1 T. In this paper, the iron core material of the motor is 20WTG1500, and W/kg [37]. The motor used by the EHA is a three-phase PMSM with four pairs of poles, , and the iron loss is
In addition to the motor, the power loss of the motor driver also needs to be considered [38]:
where is the switching power loss of the motor driver, is the turn-on power loss, and
where is the number of power switches, is the power loss of each power switch, and is the operating frequency of the motor driver.
where is the nominal voltage drop and , is the collector-emitter voltage drop when forward conduction, is the freewheeling diode voltage drop, is the nominal current, and .
During the period from to , the average power loss of the gear pump is calculated as
In summary, during the period from to , the average motor efficiency is
c) Leakage power loss in the cylinder
The leakage power loss in the cylinder is
During the period from to , the average leakage power loss in the cylinder is calculated as
In summary, the average efficiency of the EHA is
2) Dynamic model
The flow equation of the gear pump is
where is the arc displacement of the gear pump, is the speed of the gear pump, is the load flow, and and are the internal leakage coefficient and the external leakage coefficient of the gear pump, respectively.
Set as the load pressure, and . Set as the overall flow coefficient of the gear pump. Then, Equation (40) can be further simplified as
Similarly to the CVA, when analyzing the dynamic performance of the EHA, the initial position of the piston is set at the middle position of the cylinder. The continuity equation of the cylinder flow is
where is the total leakage coefficient of the cylinder, and .
The balance equation of the cylinder and load force is
where is the equivalent mass of the piston and load, and is the external load force acting on the piston.
After solving Equations (41)–(43) with the Laplace transform, the transfer function of the hydraulic subsystem composed of the gear pump and the cylinder is obtained as
where is the total leakage coefficient of the EHA, and . is the hydraulic natural frequency of the EHA, . is the hydraulic damping ratio of the EHA, and .
The motor torque equation is
where is the output torque of the motor, is the number of pole pairs, is the magnetic flux of the permanent magnet, and and are the current vectors in the d-q axis coordinate system. and are equivalent inductances in the d–q axis coordinate system. Since the motor in this paper uses a salient pole rotor, . Then, Equation (45) can be further simplified as
where is the motor current, is the angle between and the d-axis, and is the torque coefficient of the motor.
The torque equation between the motor and the pump is as follows:
where is the inertia moment of the motor and pump shaft, is the speed of the motor and pump, is the pump displacement, is the load pressure, and is the friction torque. Generally, under low-speed conditions, due to the influence of the friction torque in the motor and pump, an EHA will have a low-speed dead zone [39]. Since this paper focuses on the efficiency and dynamic response of EHAs, the frictional torque is ignored, and . Combining Equations (46) and (49), we can obtain
The motor voltage equation is
where is the terminal voltage in the phase coordinate system, is the inductance matrix in the phase coordinate system, is the flux linkage generated by the rotor magnetomotive force in the winding, and is the counter electromotive force coefficient.
After solving Equations (41)–(49) with the Laplace transform, the transfer function between the cylinder displacement and motor voltage command is obtained as
where , , , , , , , and . A block diagram corresponding to the transfer function (47) is shown in Figure 4.
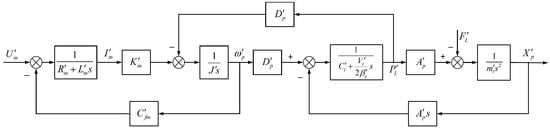
Figure 4.
Transfer function block diagram of EHA.
It worth noting that the transfer functions of the CVA and EHA (Equations (20) and (50)) are linear models and are only used for qualitative comparative studies of the CVA and EHA.
3. Simulation Results and Analysis
3.1. Simulation Model
This paper used AMESim software to establish a simulation model of the CVA to perform load spectrum testing and step response testing, and used Simulink software and AMESim software to establish a joint simulation model of the EHA to perform load spectrum testing and step response testing.
The simulation model of the CVA is shown in Figure 5. The servo valve and cylinder used the model that comes with the AMESim software, and their parameter settings adopted prototype parameters, as shown in Table 1. It is worth noting that, when conducting the step response test of the CVA, the open-loop control method was used.
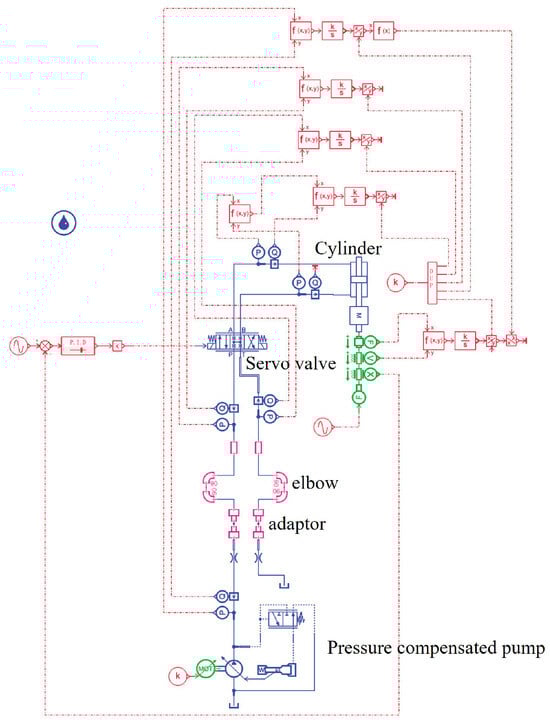
Figure 5.
The simulation model of the CVA.

Table 1.
Parameter settings of the CVA model. (-) means no unit.
A motor simulation model of the EHA is shown in Figure 6. The control parameters of the closed-loop controller and vector controller in the model used the parameters of the motor driver prototype. The motor model parameters were set according to the prototype, as shown in Table 2. AMESim software was utilized to model the pump and cylinder, as shown in Figure 7. The mechanical efficiency and volumetric efficiency of the gear pump model were calculated and imported based on the mathematical model in the previous section. The parameter settings of the gear pump model are shown in Table 2. It is worth noting that, when conducting the step response test of the EHA, the open-loop control method was used.
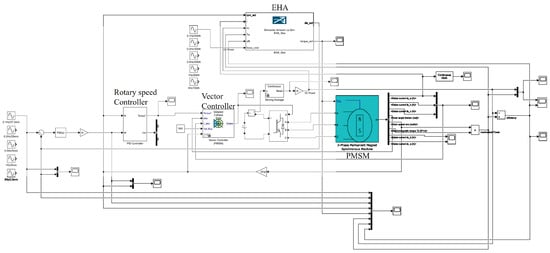
Figure 6.
The motor simulation model of the EHA.
Table 2.
Parameter settings of the EHA model. (-) means no unit.
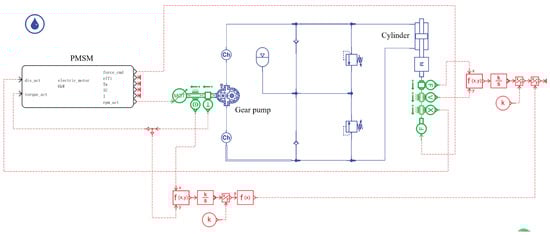
Figure 7.
The pump and cylinder simulation model of the EHA.
3.2. Simulation Setup
- (1)
- Parameter settings
- (2)
- Simulation test design
1) Efficiency test conditions
In order to systematically and comprehensively compare the efficiency of the CVA and EHA, five load spectrum test conditions with different frequencies and loading forces were designed, as shown in Table 3. The frequencies of the five load spectrum test conditions were 0.1 Hz, 0.2 Hz, 0.5 Hz, 1 Hz, and 3 Hz, respectively. The displacement amplitudes of the cylinder were 37.5 mm, 25 mm, 5 mm, 5 mm, and 2.5 mm, respectively. The loading force amplitudes were 5 kN, 3 kN, 2 kN, 2 kN, and 1 kN, respectively. It is worth noting that, in order to avoid a negative load of the CVA and EHA and thus affect the efficiency calculation, the loading force phase was set ahead of the cylinder displacement phase, and the leading amount was 90∘. In the simulation process, the power losses and average efficiency of the CVA and EHA under different test conditions were calculated.
Table 3.
Five load spectrum test conditions.
2) Dynamic response test conditions
In order to systematically and comprehensively compare the dynamic response characteristics of the CVA and EHA, four different step test conditions were designed, as shown in Table 4. The initial velocities of the four step test conditions were 0 mm/s, 0 mm/s, 20 mm/s, and 30 mm/s, respectively. The terminal velocities were 20 mm/s, 30 mm/s, 0 mm/s, and 0 mm/s, respectively. The loading forces were 50 kN, 100 kN, 50 kN, and 100 kN, respectively.
Table 4.
Four step test conditions.
3) Control methods
The control block diagrams of the CVA, EHA, and loading platform are shown in Figure 8. In order to achieve a fair comparison, both the CVA and EHA employed PID controllers. The loading force control of the loading platform adopted the PID + Feedforward control strategy.
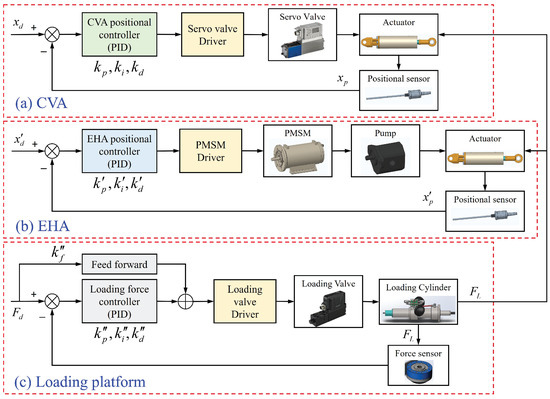
Figure 8.
Control block diagrams of CVA, EHA, and loading platform.
For the CVA, the displacement sensor collects the cylinder displacement in real time and inputs it to the PID controller together with the expected cylinder displacement. After calculation, the PID controller outputs the control command of the servo valve driver, and the servo valve driver outputs the driving current to control the movement of the spool, thereby realizing the displacement control of the cylinder. Similarly, for the EHA, based on the expected displacement and real-time displacement of the cylinder, the PID controller outputs the control command of the motor driver, and the motor rotates to drive the gear pump to output oil, thereby realizing the displacement control of the cylinder. For the loading platform, the force sensor collects the loading force of the loading cylinder in real time, and inputs it to the PID + Feedforward controller together with the expected loading force. The PID + Feedforward controller outputs the control command of the servo valve driver after calculation, and the servo valve driver outputs the driving current to control the movement of the spool, thereby realizing the control of the loading force.
In this paper, the premise of comparing the CVA and EHA was to ensure the displacement control accuracy of the cylinder under different test conditions. Therefore, it was necessary to reset the parameters of the different controllers under different test conditions, as shown in Table 5. It is worth noting that for the four step test conditions, in order to avoid the influence of controller parameters on the dynamic response characteristics of the CVA and EHA, an open-loop control strategy was adopted for the initial and terminal velocity control of the cylinder.
Table 5.
Controller parameters of CVA, EHA, and loading platform.
3.3. Simulation Results
- (1)
- Efficiency test results
1) CVA model
The displacement tracking and force loading curves of the CVA model under different load spectrum test conditions are shown in Figure 9. It can be found that the displacement tracking performance of the CVA model under the five load spectrum test conditions was excellent.
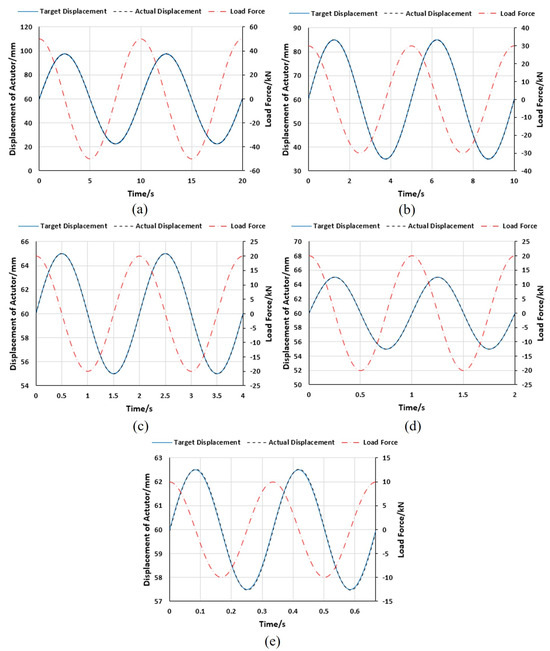
Figure 9.
Simulation results of CVA model under different load spectrum test conditions. (a) Condition (a). (b) Condition (b). (c) Condition (c). (d) Condition (d). (e) Condition (e).
According to Equations (10), (12), and (14), the average power loss along the pipeline, the average throttling power loss of the servo valve, the average leakage power loss in the cylinder, and the average output power of the CVA in the two load spectrum periods were calculated, as shown in Table 6. The average efficiency of the CVA model varied greatly under the different load spectrum test conditions. Overall, the energy efficiency of the CVA model was low, and the average efficiency under the five load spectrum test conditions was only about 18.3%.
Table 6.
Average power losses and efficiency of CVA model under different load spectrum test conditions.
2) EHA model
Under the different load spectrum test conditions, the displacement tracking and force loading curves of the EHA model were as shown in Figure 10. It can be found that the displacement tracking performance of the EHA model was ideal under the first four load spectrum test conditions. However, under the fifth load spectrum test condition (e), the dynamic response of the EHA model could not reach 3 Hz, and the displacement followed a large amplitude lag and phase lag.
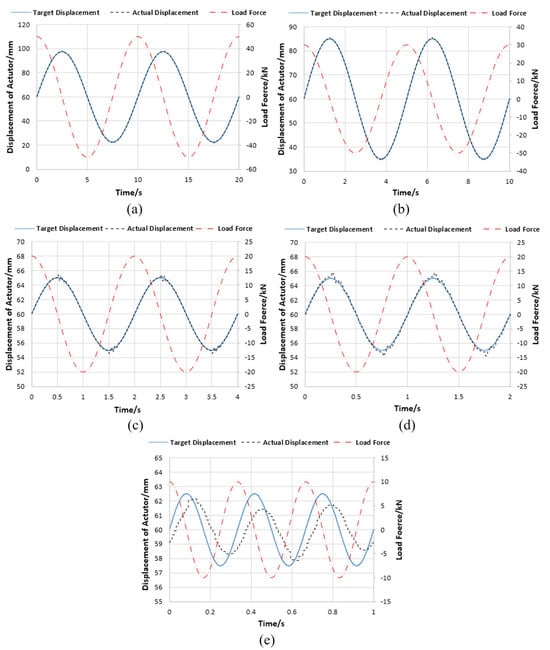
Figure 10.
Simulation results of EHA model under different load spectrum test conditions. (a) Condition (a). (b) Condition (b). (c) Condition (c). (d) Condition (d). (e) Condition (e).
According to Equations (28), (35) and (34), the average power losses of the gear pump, motor, cylinder, and the average output power of the EHA in the two load spectrum periods were calculated, as shown in Table 7. As mentioned above, the displacement tracking of the EHA model under the fifth load spectrum test condition (e) had a large amplitude lag and phase lag. At this time, since both the motor and the gear pump had negative loads, the power losses and average efficiency of the EHA model were not calculated. It can be seen that the average efficiency of the EHA model varied under the different load spectrum test conditions, but the difference was not significant. Overall, the efficiency of the EHA model was relatively high, and the average efficiency under the four load spectrum conditions was as high as about 54.4%.
3) Analysis
The main power losses of the CVA were the power loss along the pipeline and the throttling power loss of the servo valve. It can be seen from Equations (1) and (3) that the power loss along the pipeline was positively correlated with the pipeline length and negatively correlated with the square of the pipeline diameter. In order to improve the power-to-weight ratio and reliability, the hydraulic pipelines of aircraft are generally slender and have pipe elbows, pipe adaptors, and filters. When the hydraulic oil flows at high speed, the power loss caused by the pipeline cannot be ignored [40]. Since the constant-pressure pump as a centralized hydraulic source can only output high-pressure oil continuously, and the low-medium pressure of the aircraft can meet the requirements in most flight profiles, it is necessary to throttle the oil through the servo valve. According to Equation (11), it can be seen that, when the demand for load differential pressure is small, the throttling power loss will be relatively significant.
Table 7.
Average power losses and efficiency of EHA model under different load spectrum test conditions.
Table 7.
Average power losses and efficiency of EHA model under different load spectrum test conditions.
| Conditions | Motor Power Losses (W) | Gear Pump Power Losses (W) | Leakage Power Losses in the Cylinder (W) | Output Power of EHA (W) | Overall Efficiency of EHA (%) |
|---|---|---|---|---|---|
| (a) | 233.6 | 117.7 | 27.6 | 592.3 | 61.0 |
| (b) | 271.1 | 124.9 | 16.7 | 473.8 | 53.4 |
| (c) | 115.9 | 47.8 | 7.6 | 158.4 | 48.0 |
| (d) | 180.9 | 75.8 | 8.8 | 328.3 | 55.3 |
| (e) | - | - | - | - | - |
According to the simulation results, the average efficiency of the CVA model was low, and the average efficiency under the first four load spectrum test conditions was only about 21.2%. The average efficiency of the EHA model was relatively high, and the average efficiency under the first four load spectrum test conditions was as high as about 54.4%, which is consistent with the analysis results.
- (2)
- Dynamic response test results
1) CVA model
Under the different step test conditions, the speed step response curves of the CVA model were as shown in Figure 11. It can be found that the step response performance of the CVA model was very good.
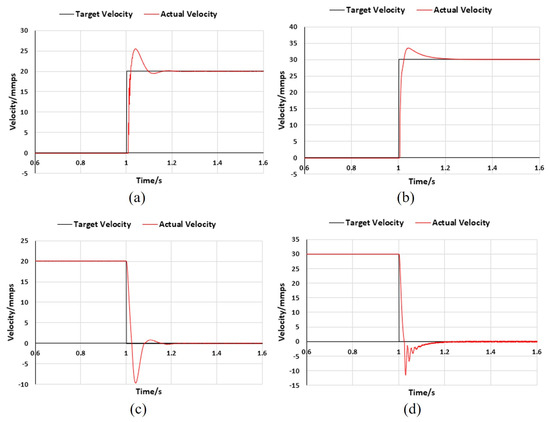
Figure 11.
Simulation results of CVA model under different step test conditions. (a) Condition (a). (b) Condition (b). (c) Condition (c). (d) Condition (d).
Under the four step test conditions, the rise/fall time of the CVA model was as shown in Table 8, and the average step response time was only about 23.3 ms. Moreover, the larger the step and loading force, the longer the rise/fall time of the CVA model.
Table 8.
Response time of CVA model under different step test conditions.
2) EHA model
Under the different step test conditions, the speed step response curves of the EHA model were as shown in Figure 12. It can be found that the step response performance of the EHA model was poor.
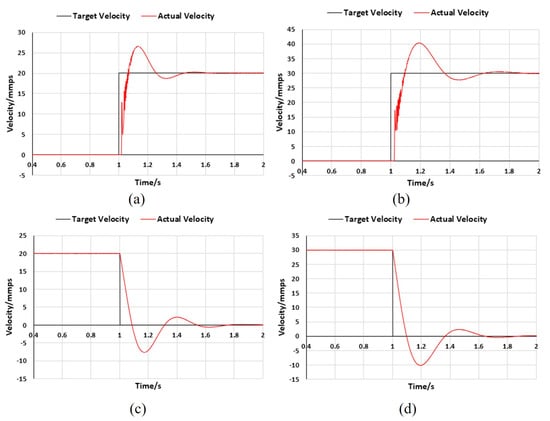
Figure 12.
Simulation results of EHA model under different step test conditions. (a) Condition (a). (b) Condition (b). (c) Condition (c). (d) Condition (d).
Under the four step test conditions, the rise/fall time of the EHA model was as shown in Table 9, and the average step response time was about 89.3 ms. Moreover, the larger the step and loading force, the longer the rise/fall time of the EHA model.
Table 9.
Response time of EHA model under different step test conditions.
Comparing the simulation results of Table 8 and Table 9, it can be found that the dynamic response performance of the EHA model under the different step test conditions was much lower than that of the CVA model. At the same time, comparing Figure 9 and Figure 10, it can be seen that under the fifth load spectrum test condition (e), the displacement amplitude and phase tracking performance of the CVA model were good, while the displacement amplitude and phase tracking of the EHA model had a large lag, which also verifies that the dynamic response performance of the CVA model was better than that of the EHA model.
3) Analysis
It can be seen from Equations (20) and (50) that the hydraulic natural frequency and velocity gain had a great impact on the dynamic performance of the CVA and EHA.
a) Hydraulic natural frequency
The hydraulic natural frequency is the frequency at which the hydraulic fluid interacts with the load mass of the cylinder to form an equivalent dynamic hydraulic spring–mass system. The hydraulic natural frequency can characterize the response speed of hydraulic power components. In a hydraulic servo system, the hydraulic natural frequency often affects the response speed of the entire system.
According to Equations (20) and (44), the hydraulic natural frequencies of the CVA and EHA are and , respectively. In this paper, the cylinders and loads used by the CVA and EHA were exactly the same; that is, and . Then, . However, the internal cavity of the pump in the EHA was larger than that of the servo valve in the CVA, and there was also a cavity inside the valve block of the EHA; that is, . Moreover, the rotors of the motor and pump also needed to be calculated into the total mass; that is, . Therefore, ; that is, the hydraulic natural frequency of the CVA was more than times that of the EHA.
b) Velocity gain
The velocity gains of CVAs and EHAs represent the sensitivity of the servo valve and motor to the velocity control of the cylinder. Increasing the velocity gain can improve the response speed and control the precision of the cylinder. With the same cylinder and load, the velocity gain depends on the performance of the servo valve and motor. Since the frequency response of the servo valve in the CVA was greater than 120 Hz, it could be regarded as a proportional element. Therefore, the CVA in this paper could be simplified as a third-order system. According to Equation (50), the motor in the EHA is a second-order system. The total transfer function of the EHA is fifth-order, with 5 poles in the denominator, and more than the 3 poles of CVA transfer function. Therefore, the phase angle of the EHA lagged behind that of the CVA, and the dynamic performance of the EHA was also weaker than the CVA.
In summary, EHAs are smaller than CVAs in terms of hydraulic natural frequency and also smaller than CVAs in terms of velocity gain, so their dynamic response is slower than CVAs. The simulation results verified the above conclusions. Under the four step response conditions, the speed step response of the CVA model was swift, and the average step response time was only about 23.3 ms. The step response speed of the EHA model was relatively slow, and the average step response time was as long as about 89.3 ms.
4. Experimental Results and Analysis
4.1. Experiment Setup
- (1)
- Prototypes and test platform
1) CVA prototype
The CVA prototype mainly included a servo valve, cylinder, and displacement sensor. The servo valve model was 4WRPEH6C3B24L (Rexroth), the rated flow was 24 lpm at 70 bar pressure difference, and the control signal was a current signal with a range of 4∼20 mA. The servo valve had a high dynamic frequency response, and the step response time of the valve spool from 0 to 100% stroke was less than 10 ms. A driver is integrated into the servo valve, which generates a driving current to drive the servo valve. The servo valve had a spool displacement sensor, the model was 7.1-1-150-1-1-1-1G (FAD), the maximum measuring range was 150 mm, and the precision was 0.05 mm. The EHA prototype adopted a customized symmetrical servo cylinder, and its starting pressure was less than 0.1 MPa. The CVA prototype is shown in Figure 13, and its component parameters are provided in Table 10.
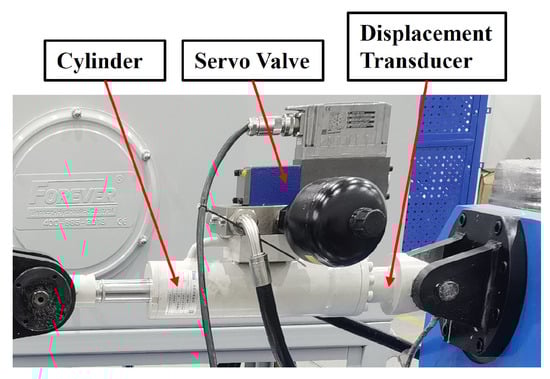
Figure 13.
CVA prototype.
Table 10.
Component Parameters of CVA.
2) EHA prototype
The EHA prototype included a three-phase permanent magnet synchronous motor (PMSM), gear pump, cylinder, displacement sensor, and other components. The motor was the control component of the EHA, the model was ZCS015-03 (Zhenzheng), the maximum torque was 10 N·m, and the maximum speed was 6000 rpm. The motor and the gear pump were connected through coupling. The EHA prototype used an external mesh bidirectional gear pump, which was also a fixed displacement pump, and the model was GHP1A-R-2-FG-E1 (MARZOCCHI). The cylinder and displacement sensor used in the EHA prototype were the same as for the CVA prototype. The EHA prototype is shown in Figure 14, and its component parameters are provided in Table 11.
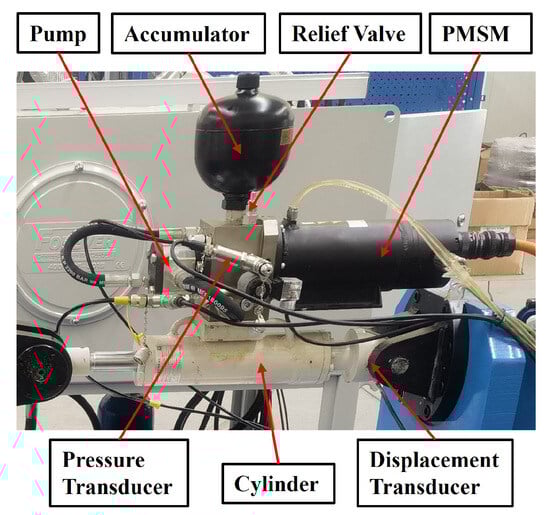
Figure 14.
EHA prototype.
Table 11.
Component parameters of EHA.
3) Test platform
As shown in Figure 15 and Figure 16, the unified test platform of the CVA and EHA prototypes included a loading table, loading cylinder, loading servo valve, valve controller, industrial computer, motion controller, motor driver, force sensor, and other components. The CVA or EHA prototype to be tested was installed on the test platform in opposition to the loading cylinder. The loading cylinder was utilized to load the CVA or EHA prototypes linearly, with a customized symmetrical servo cylinder with a starting pressure of less than 0.1 MPa. The loading servo valve was used to control the loading force of the loading cylinder, and its model was D1FPE50MH9NB70 (Parker). A driver was integrated into the loading servo valve, which generated a driving current to drive the loading servo valve. At the same time, closed-loop control of the spool displacement could be realized with the spool displacement sensor that came with the loading servo valve. The model of the motion controller was RMC75E-MA1 (Delta), which was used to control and collect data on the loading cylinder, CVA, and EHA prototypes. The model of the industrial computer was IPC610 (Advantech), which was used for the user operation, data processing, and data storage of the test platform. The model of the motor driver was WB-3016-N4FA (Zhenzheng), which was used to drive the EHA motor to realize control of the motor speed and current. The model of the force sensor was 1020AF-125KN-B (Interface), which was used to detect the top loading force of the prototypes and complete closed-loop control of the loading force together with the servo valve and the loading cylinder. The installation of the CVA and EHA prototypes on the test platform is shown in Figure 15 and Figure 16, and the main component parameters of the test platform are shown in Table 12.

Figure 15.
CVA prototype and test platform.
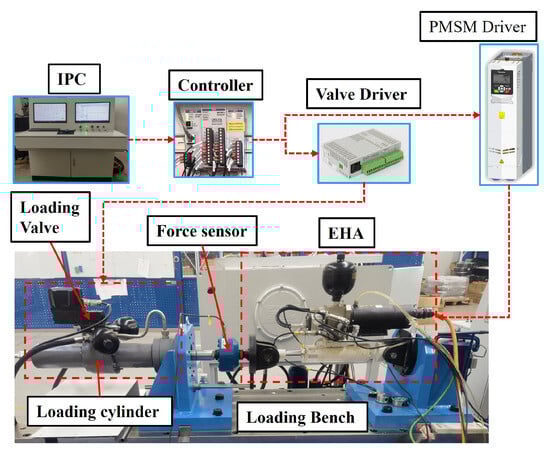
Figure 16.
EHA prototype and test platform.
- (2)
- Experiment design
1) Test conditions
Based on the test platform, the experimental tests carried out with the CVA and EHA prototypes were consistent with the simulation tests carried out in Section 3, and the test conditions used were also the same as the simulation test conditions. Five load spectrum test conditions were used to verify the efficiency characteristics of the CVA and EHA prototypes. Four step test conditions were used to verify the dynamic response characteristics of the CVA and EHA prototypes.
2) Control methods
The control methods of the CVA prototype, EHA prototype, and test platform are shown in Figure 8a, Figure 8b, and Figure 8c, respectively. The parameter settings of different controllers were the same as those in Table 5.
Table 12.
Component parameters of test platform.
Table 12.
Component parameters of test platform.
| Components | Symbols | Values |
|---|---|---|
| Loading cylinder | Max Stroke (mm) | 300 |
| Max force (kN) | 150 | |
| Piston diameter (mm) | 100 | |
| Rod diameter (mm) | 63 | |
| Loading servo Valve | Nominal diameter (mm) | 6 |
| Nominal Flow (lpm) | 45 | |
| Response time (ms) | ≤10 | |
| Hysteresis (%) | ≤0.2 | |
| Force sensor | Max Force (kN) | 150 |
| Accuracy (%F.S.) | ±0.05 | |
| Position sensor | Stroke (mm) | 150 |
| Accuracy (mm) | 0.05 |
4.2. Experimental Results
- (1)
- Efficiency test results
1) CVA prototype
The experimental results of the CVA prototype under different load spectrum test conditions are shown in Figure 17. It can be found that the displacement tracking performance of the CVA prototype under the five load spectrum test conditions was excellent.
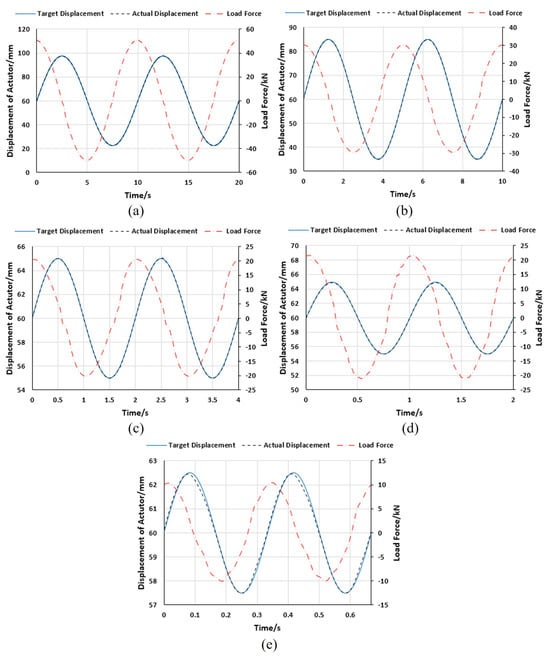
Figure 17.
Experimental resultsof CVA prototype under different load spectrum test conditions. (a) Condition (a). (b) Condition (b). (c) Condition (c). (d) Condition (d). (e) Condition (e).
The displacement amplitude error and phase error between the simulation results and experimental results were compared, as shown in Figure 18. It was found that the maximum displacement amplitude error was about 0.3 mm, and the maximum phase error was about 0.04 rad, all belonging to test condition (e). It is worth noting that the displacement amplitude error (not the phase error) did not affect the efficiency results, since the cylinder output power used to calculate efficiency was the product of actual speed and loading force, not the product of command speed and loading force. However, the occurrence of phase error will bring a negative load, which will cause errors in the efficiency results. Under the five test conditions, the maximum phase error of CVA was about 0.04 rad, which was only about 0.7% of the full cycle. Therefore, the influence of phase error could be ignored.
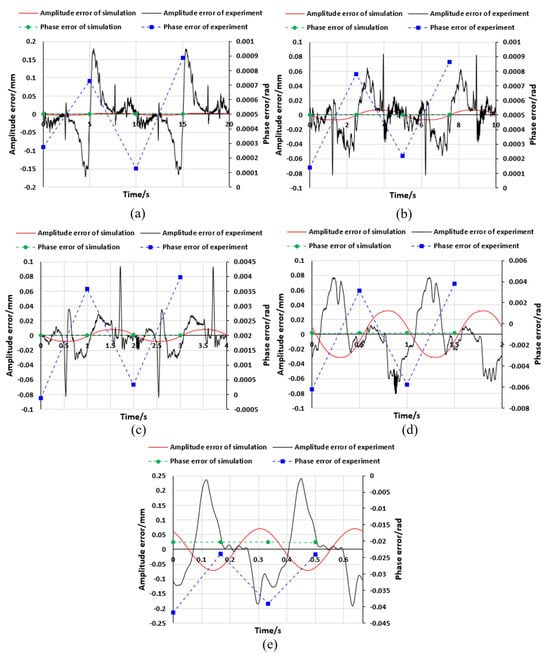
Figure 18.
Simulation and Experimental errors of CVA prototype under different load spectrum test conditions. (a) Condition (a). (b) Condition (b). (c) Condition (c). (d) Condition (d). (e) Condition (e).
The average output power of the CVA prototype in the two load spectrum periods was calculated, as shown in Table 13. The energy efficiency of the CVA prototype varied significantly under the different load spectrum test conditions. Overall, the energy efficiency of the CVA prototype was low, and the average efficiency under the five load spectrum test conditions was only about 19.6%. Comparing Table 6 and Table 13, it can be found that the experimental results of the CVA prototype under the five load spectrum test conditions were consistent with the simulation results of the CVA model.
Table 13.
Efficiency of CVA prototype under different load spectrum test conditions.
2) EHA prototype
Under the different load spectrum test conditions, the experimental results of the EHA prototype were as shown in Figure 19. It can be found that the displacement tracking performance of the EHA prototype was ideal under the first four load spectrum test conditions. However, under the fifth load spectrum test condition (e), the dynamic response of the EHA prototype could not reach 3 Hz, and the displacement followed a large amplitude lag and phase lag.
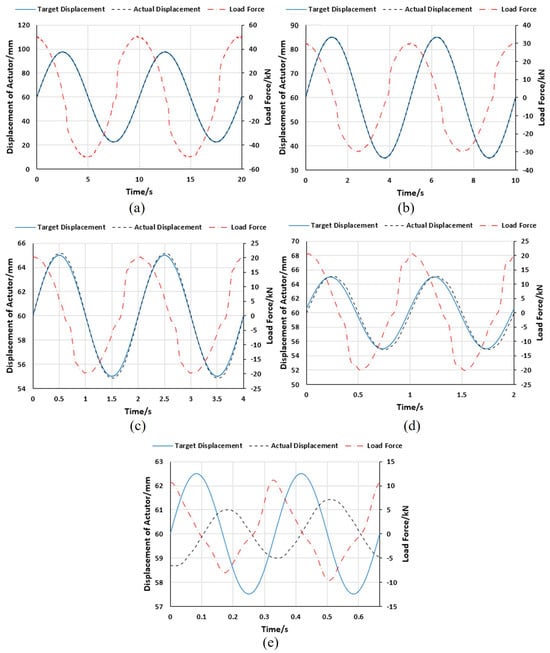
Figure 19.
Experimental results of EHA prototype under different load spectrum test conditions. (a) Condition (a). (b) Condition (b). (c) Condition (c). (d) Condition (d). (e) Condition (e).
The displacement amplitude error and phase error was compared between the simulation results and experimental results, as shown in Figure 20. It was found that in the first four test conditions, the maximum displacement amplitude error was about 0.8 mm, and the maximum phase error was about 0.03 rad (about 0.5% of the full cycle), and the influence of phase error could be ignored. In the fifth test condition (e), the maximum displacement amplitude error was about 3.2 mm, and the maximum phase error was about 2.0 rad. At this time, the impact of the phase error was very serious and the efficiency of EHA could not be calculated.
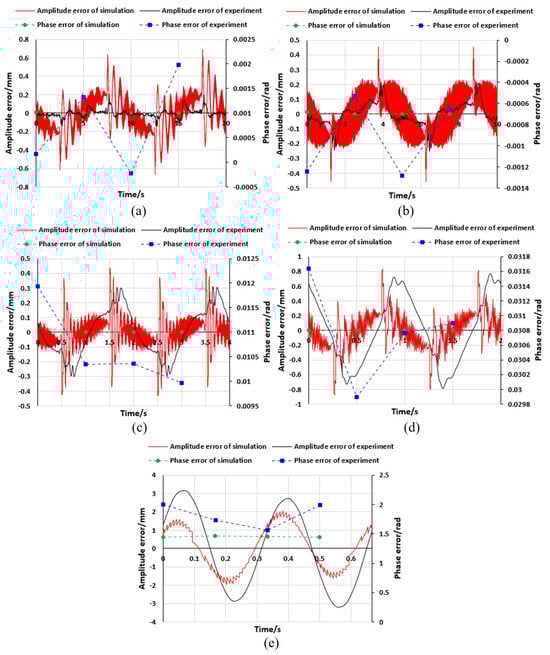
Figure 20.
Simulation and experimental errors of EHA prototype under different load spectrum test conditions. (a) Condition (a). (b) Condition (b). (c) Condition (c). (d) Condition (d). (e) Condition (e).
The average output power of the EHA prototype in the two load spectrum periods was calculated, as shown in Table 14. The energy efficiency of the EHA prototype varied under the different load spectrum test conditions, but the difference was not significant. Overall, the efficiency of the EHA prototype was relatively high, and the average efficiency under the first four load spectrum test conditions was as high as about 55.2%.
Table 14.
Efficiency of EHA prototype under different load spectrum test conditions.
3) Efficiency comparison results
The comparison of the energy efficiency results obtained by simulation and experiment is shown in Table 15. The lack of EHA efficiency results under the last test condition (e) does not affect the fairness of the comparison between CVA and EHA.
Table 15.
Average efficiency comparison of CVA and EHA.
It can be seen from Table 15 that (a) the displacement tracking performance of the CVA was better than that of the EHA, but its energy efficiency was much lower than that of the EHA, which is consistent with the theoretical analysis conclusions in Section 3. (b) For the energy efficiency of the CVA and EHA, the simulation and experimental results under different load spectrum test conditions were relatively close. The average efficiencies obtained in the simulation and experiment for the CVA under the first four load spectrum test conditions were about 21.2% and 22.7%, respectively. The absolute error was about 1.6%. The average efficiencies obtained by simulation and experiment for the EHA under the first four load spectrum test conditions were about 54.4% and 55.2%, respectively. The absolute error was only about 0.8%.
- (2)
- Dynamic response test results
1) CVA prototype
Under the different step test conditions, the experimental results of the CVA prototype were as shown in Figure 21. It can be seen that the step response performance of the CVA prototype was excellent.
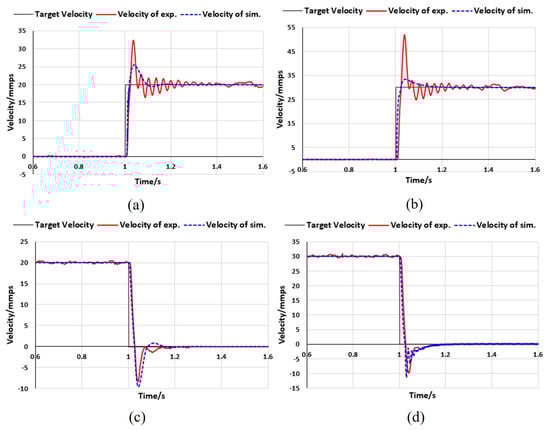
Figure 21.
Simulation and experimental results of CVA prototype under different step test conditions. (a) Condition (a). (b) Condition (b). (c) Condition (c). (d) Condition (d).
Under the four step test conditions, the rise/fall time of the CVA prototype was as shown in Table 16, and the average step response time was only about 25.8 ms. Comparing Table 8 and Table 16, it can be found that the simulation results of the CVA prototype under the four step test conditions were consistent with the experimental results.
Table 16.
Response time of CVA prototype under different step test conditions.
2) EHA prototype
Under the different step test conditions, the experimental results of the EHA prototype were as shown in Figure 22. It can be seen that the step response performance of the EHA prototype was poor.
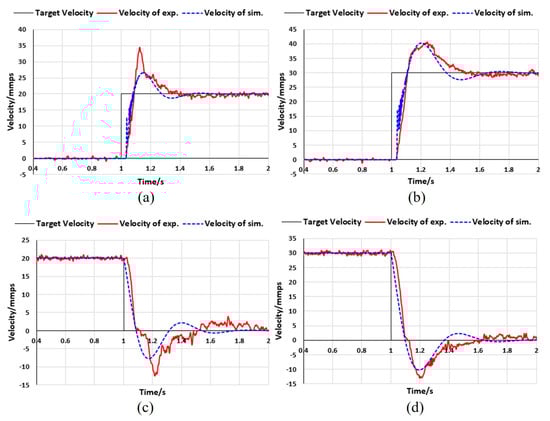
Figure 22.
Simulation and experimental results of EHA prototype under different step test conditions. (a) Condition (a). (b) Condition (b). (c) Condition (c). (d) Condition (d).
Under the four step test conditions, the rise/fall time of the EHA prototype was as shown in Table 17, and the average step response time was about 95.3 ms. Comparing Table 9 and Table 17, it can be found that the simulation results of the EHA prototype under the four step test conditions were consistent with the experimental results.
Table 17.
Response time of EHA prototype under different step test conditions.
3) Dynamic response comparison results
A comparison of the step response time obtained by simulation and experiment is shown in Table 18.
Table 18.
Step response time comparison of CVA and EHA.
It can be seen from Table 18 that (a) the step response times of the CVA were much shorter than those of the EHA, and its dynamic response performance was better than that of the EHA, which is consistent with the theoretical analysis conclusions in Section 2. (b) For the dynamic response performance of the CVA and EHA, the simulation and experimental results under the different load spectrum test conditions were relatively close. Under the four step test conditions, the step response times of the CVA obtained through simulation and experiment were about 23.3 ms and 25.8 ms, respectively. The absolute error was only about 2.5 ms. The step response times of the EHA obtained in the simulation and experiment were about 89.3 ms and 95.3 ms, respectively. The absolute error was about 6.0 ms.
4.3. Discussions
The above experiments verified the accuracy of the CVA and EHA models established in Section 2. This section adopts power flow models for further power loss quantification and sensitivity analysis.
- (1)
- Power loss quantification
1) Power loss quantification under actuation phase
According to Table 6, the power loss along the pipeline, the throttling power loss of the servo valve, and the leakage power loss in the cylinder were quantified under different test conditions, as shown in Figure 23. It can be found that under the five load spectrum test conditions, the throttling power loss of the servo valve occupied the main part of the total power loss (accounting for about 76.6% of the total input power on average), which was the main reason for the low energy efficiency of the CVA. The average power loss along the pipeline accounted for about 8.6% of the total input power, which cannot be ignored. Especially under the fifth load spectrum test condition (e), the power loss along the pipeline accounted for about 15.3% of the total input power. The leakage power loss in the cylinder accounted for about 0.6% of the total input power on average, which is negligible.
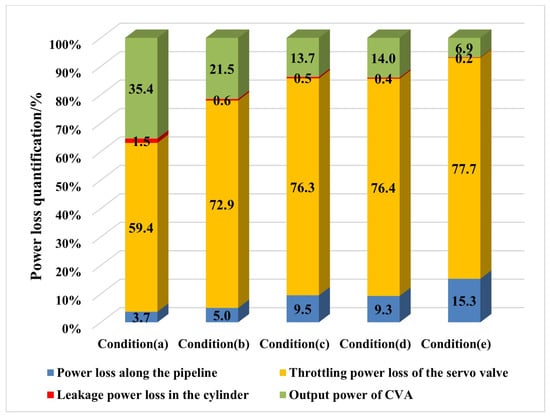
Figure 23.
Power loss quantification of CVA.
Similarly, according to Table 7, the main power loss of the EHA under the different test conditions was quantified, including the gear pump power loss, motor power loss, and leakage power loss in the cylinder, as shown in Figure 24. It can be found that under the four load spectrum test conditions, the motor power loss accounted for the main part of the total power loss (accounting for about 28.6% of the total input power on average). The gear pump power loss accounted for about 13.7% of the total input power on average, which cannot be ignored. The leakage power loss in the cylinder accounted for about 2.2% of the total input power on average, which is negligible.
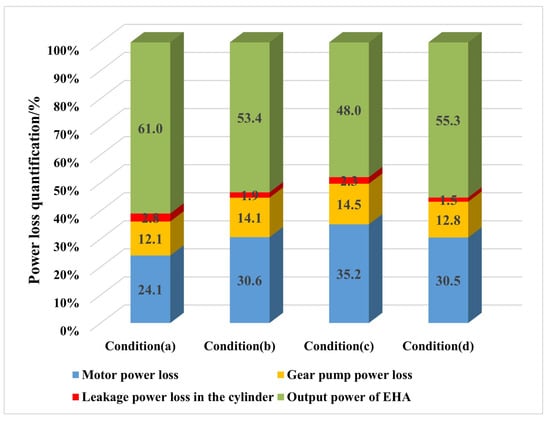
Figure 24.
Power loss quantification of EHA.
This paper mainly focuses on the comparison of power losses between the CVA and EHA on the actuation side. However, a more fair comparison of power losses would be from the same source to the same actuator, and all power loss factors from the energy generation side to the actuation side should be considered. Whether it is the CVA or EHA, the initial power source is the gearbox of aircraft engine [5]. For the CVA, the power losses of the gearbox-driven EDP need to be considered. For the EHA, the power losses of the gearbox-driven generator, electric power transmission, and transformer need to be considered. However, it is difficult to develop prototypes to study the above energy losses. Furthermore, this paper incorporated the power losses of the gearbox-driven EDP and the gearbox-driven generator into the simulation model for simulation comparison analysis.
During the flight of the aircraft, the output pressure of the gearbox-driven EDP remains unchanged, the rotation speed remains consistent with the engine, and the displacement changes with changes in load flow demand. Since one pump source provides high-pressure oil to many actuators, the efficiency variation range of the the gearbox-driven EDP generally remains within a certain range throughout the flight profile. For example, the overall efficiency of a Vickers PV3-240 series EDP is in the range of 80–90% [41]. The average mechanical efficiency of the gearbox-driven EDP studied in this paper was about 90.0%, the volumetric efficiency was about 95%, and the total efficiency was about 85.0%. Therefore, this paper set the efficiency of the gearbox-driven EDP to 85.0%.
The efficiency of a gearbox-driven generator is generally above 90.0% [42]. Taking into account the efficiency of the electric power transmission and transformer, this paper set the efficiency of the EHA’s power supply system to 90.0%.
The efficiency of the CVA and EHA under the first four load spectrum test conditions was recalculated, as shown in Table 19. The average efficiencies of the CVA and EHA were about 19.3% and 49.7%, respectively.
Table 19.
Efficiency comparison of CVA and EHA.
2) Power loss quantification under load-holding phase
Since almost all of the output power is generated under the actuation condition, the research of power loss in this paper mainly focused on the actuation condition. However, the load-holding condition is also a key condition and its proportion in a flight profile is not low. Under load-holding conditions, since neither a CVA nor EHA produces output power, and as the cylinder continues to maintain high pressure, both a CVA and EHA will produce power loss.
For a CVA, the power loss in the load-holding condition includes the leakage loss of the gearbox-driven EDP and servo valve.
where , , and are total power loss, volumetric loss of gearbox-driven EDP, and leakage loss of servo valve under load-holding conditions, respectively. is the max flow of the CVA, is the volumetric efficiency of the gearbox-driven te EDP, and is the leakage flow of the servo valve at 10 MPa differential pressure.
For EHA, the power loss in the load-holding condition includes the leakage loss of the gear pump, the copper loss of PMSM, and the power loss of the motor driver.
where , , , and are total power loss, volumetric loss of gear pump, copper loss of the PMSM, and power loss of the motor driver under load-holding conditions, respectively. , , , and can be found in Equations (21), (22), (29) and (32).
The power loss of the CVA and EHA under different load-holding conditions was simulated, and the results are shown in Figure 25. It can be found that, since the outlet pressure of the gearbox-driven EDP remained unchanged, the power loss of the CVA under the different load-holding conditions almost remained unchanged. Unlike the CVA, the power loss of the EHA increased rapidly as the load-holding force increased, even exceeding the power loss of the CVA under the same load-holding force. It is worth mentioning that the heat generated by the copper loss of the PMSM under load holding conditions is also a shortcoming of the EHA.
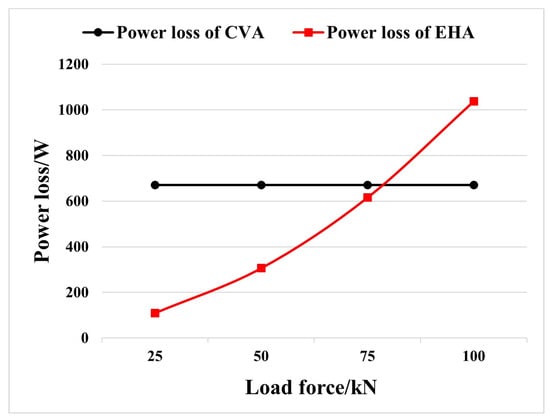
Figure 25.
Power losses of CVA and EHA under different load-holding conditions.
3) Power loss quantification under a specific flight mission profile
The calculation of efficiency has a strong relationship with the type of aircraft, type of actuator, flight mission profile, and other factors. The aircraft type determines whether the actuators that control the flight attitude will operate for a long time. For example, the flight trajectory of a large commercial aircraft is relatively gentle, and there are not many attitude changes during routine flight. The actuators that control the flight attitude can operate for a short time. Small aircraft will frequently change their flight attitude when taxiing, taking off, circling, performing tasks, and other flight profiles, and the actuators that control the flight attitude must operate for a long time. The type of actuator determines whether it will operate frequently. For example, the landing gear actuator only operates during takeoff and landing, the brake actuator only operates during braking, and the flap actuator needs to be operated frequently to combat the impact of airflow on the flight attitude. The mission profile determines how long the actuators are in the actuation and load-holding phases. With the same model, different aircraft types, actuator types, and flight mission profiles will lead to significant differences in the power loss and efficiency of the actuators.
This paper took the flap actuator as the research object and selected a specific flight mission profile [43], as shown in Table 20. Among them, there were eight flight profiles from F1 to F8, namely takeoff run, climb, cruise, circling, mission, cruise, landing, and landing run. Table 20 shows the time, actuator load, and velocity of each flight profile. Based on the established power flow models, the average efficiency and power losses of the CVA and EHA under this specific flight mission profile could be calculated, as shown in Figure 26 and Figure 27. It can be seen that since the load-holding phase accounted for a larger proportion of the entire flight mission profile, the efficiency of the CVA and EHA in the entire flight mission profile dropped significantly to 2.5% and 5.4%. Relative to the proportion of power losses in the actuation phase (Figure 23 and Figure 24), the leakage loss of the servo valve in the CVA increased significantly, and the power losses of the motor and driver in the EHA also increased significantly.
Table 20.
The specific flight mission profile.
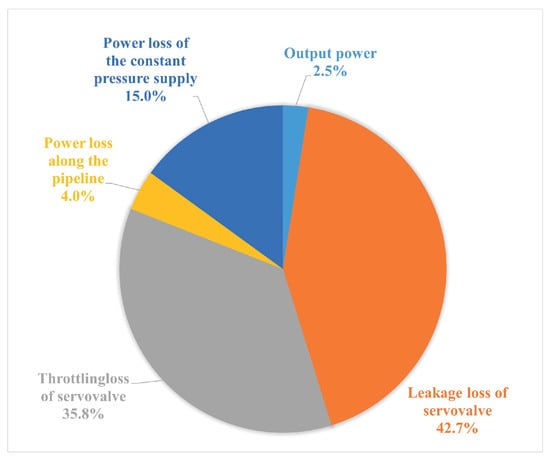
Figure 26.
Power loss quantification of the CVA under the specific flight mission profile.

Figure 27.
Power loss quantification of the EHA under the specific flight mission profile.
- (2)
- Sensitivity analysis
Sensitivity analysis can be utilized to analyze the sensitivity of a system’s state or output when its parameters or environmental conditions change. Sensitivity analysis can also determine which parameters have a greater impact on a system or model. This paper used a sensitivity analysis method to analyze different power losses, which could further explore the impact of different test conditions and parameters on each power loss, and to propose methods to improve the efficiency of the CVA and EHA.
1) Sensitivity analysis method
Sensitivity analysis is an analysis method that changes the variables of a model within a certain range to observe the behavior or changes of the model [44]. There are many sensitivity analysis methods, among which the derivative-based sensitivity index is the most commonly used [45], and its calculation is as follows:
where is the sensitivity matrix, and its -th elements represent the sensitivity of the i-th output to the j-th parameter. is the model parameter vector and is the model prediction output vector. However, this method has significant limitations, and it can only obtain sensitivity analysis results for a single operating condition and a single operating point.
In order to better study the influence of each parameter on the model output in its entire value range and obtain representative sensitivity results in the entire value range, this paper adopted a sample-based sensitivity index [46,47], which could be used to calculate the sensitivity of parameter i at any point in its entire value range. Specifically, the parameters were first linearly normalized and mapped to a unit interval
where is the normalized value, and its value range is 0∼1. and are the minimum and maximum values of parameter , respectively.
Then, n equidistant parameter samples (set n = 9 in this paper) were taken from the unit interval and used to calculate the model output. The -th element of the sensitivity matrix could be calculated as
where is the jth model output calculated with the kth sample, and is the kth sample of the ith parameter. When this method was used to calculate the sensitivity of each parameter, the remaining parameters were fixed and set as the average value of their value range.
Since the power losses of the CVA and EHA are greatly affected by the operating environment (such as the temperature and viscosity of the oil), ten different operating environmental conditions were designed in this paper. At the same time, in order to consider the completeness and comprehensiveness of the sensitivity analysis results [48], the average value and standard deviation of each parameter sensitivity vector were calculated
where is the sensitivity vector of the ith parameter in the parameter space, is the average value of , and is the standard deviation of . reflects the overall sensitivity of the model output to the parameter i, and reflects the degree to which the sensitivity of the model output to the parameter i is affected by environmental conditions.
2) Sensitivity analysis setup
a) Model output
According to the quantitative analysis results of the different power losses obtained in the previous section, it can be seen that the internal leakage power loss of the cylinder was very small and can be ignored. Therefore, in the sensitivity analysis in this section, the CVA model output selected four items: the power loss along the pipeline, throttling power loss of the servo valve, total power loss, and total efficiency. The EHA model output selected four items: the gear pump power loss, motor power loss, total power loss, and total efficiency.
b) Sensitivity parameters
The power flow model parameters and their value ranges used for sensitivity analysis are shown in Table 21.
Table 21.
Power flow model parameters and value ranges.
c) Environmental conditions
The power flow models of the CVA and EHA showed that the main environmental factor affecting power loss and efficiency was the change in oil viscosity caused by the change in oil temperature. In this paper, ten different oil temperature environmental conditions were designed, and the oil kinematic viscosity and dynamic viscosity corresponding to the different oil temperatures are shown in Table 22 [49].
Table 22.
Different oil temperatures and viscosities.
3) Sensitivity analysis results
a) CVA
Figure 28a–d are the sensitivity analysis results of the power loss along the pipeline, throttling power loss of servo valve, total power loss, and total efficiency under the different oil temperature environmental conditions. Among them, the sensitivity analysis of the five parameters of , , , , and was carried out for the power loss along the pipeline; the sensitivity analysis of the three parameters , , and was carried out for the throttling power loss of servo valve; and the sensitivity analysis of the seven parameters , , , , , , and was carried out for the total power loss and total efficiency. In Figure 28, the gray circle points indicate the sensitivity value of the model output to the sensitivity parameter under the different environmental conditions, the red diamond points indicate the average sensitivity value, and the blue diamond points indicate the standard deviation of the sensitivity.
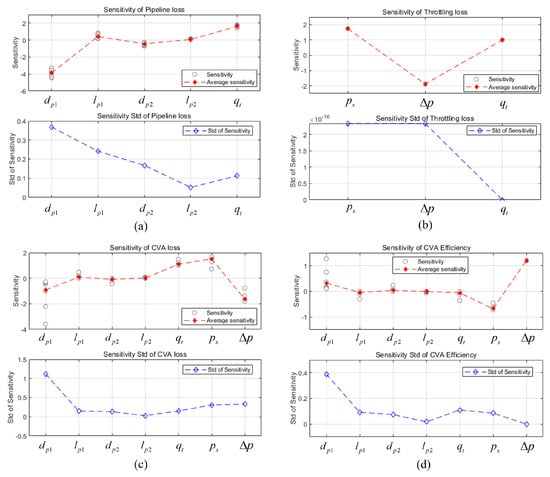
Figure 28.
Sensitivity analysis results of CVA. (a) Power loss along the pipeline. (b) Throttling power loss of the servo valve. (c) Total power loss of CVA. (d) Total efficiency of CVA.
It can be seen from Figure 28a that the sensitivity of the power loss along the pipeline to parameters and was negative, which means that when the diameters of the high-pressure side and low-pressure side pipelines increased, the power loss along the pipeline was reduced. The sensitivity of the power loss along the pipeline to parameters , , and was positive, which means that the power loss along the pipeline increased when the pipeline length and flow rate on the high-pressure and low-pressure sides increased. Since the value of parameter is generally smaller than parameter in an actual aircraft hydraulic system, the sensitivity value of power loss along the pipeline to parameter was smaller than that of parameter . Since the sensitivity value of parameter was the largest, the power loss along the pipeline increased significantly when the flow rate increased. This is why the proportion of power loss along the pipeline to the total power increased significantly as the frequency and cylinder speed of the load spectrum test conditions increased in Figure 23. Regarding the standard deviation of sensitivity, the standard deviation corresponding to parameter A was the largest, indicating that with the change in oil temperature and viscosity, this parameter had the greatest influence on the power loss along the pipeline.
It can be seen from Figure 28b that the throttling power loss of the servo valve was susceptible to parameters , , and , and the increase in parameters and caused an increase in the throttling power loss. The increase in parameter reduced the throttling power loss. Currently, constant-pressure hydraulic pumps are generally used on aircraft, and the outlet pressure is constant. Since there is always a pressure difference between the inlet and outlet of the servo valve, there is always a throttling power loss. When is low and is high, the throttling power loss of the servo valve will be large. The throttling power loss has a small sensitivity standard deviation to parameters , , and , meaning that it is less affected by changes in oil temperature and viscosity.
It can be seen from Figure 28c,d that the increase in parameters , , and reduced the total power loss, thereby improving the total efficiency of the CVA. The increase in parameters , , , and increased the total power loss, thereby reducing the total efficiency of the CVA.
b) EHA
Figure 29a–d are the sensitivity analysis results of gear pump power loss, motor power loss, total power loss, and total efficiency under the different environmental conditions, respectively. Among them, a sensitivity analysis of the two parameters and was carried out for the gear pump power loss; the sensitivity analysis of the three parameters , , and was carried out for the motor power loss; and the sensitivity analysis of the three parameters , , and was carried out for the total power loss and the total efficiency. As in Figure 28, the gray circle points in Figure 29 indicate the sensitivity value of the model output to the sensitivity parameter under the different environmental conditions, the red diamond points indicate the average sensitivity value, and the blue diamond points indicate the standard deviation of the sensitivity.
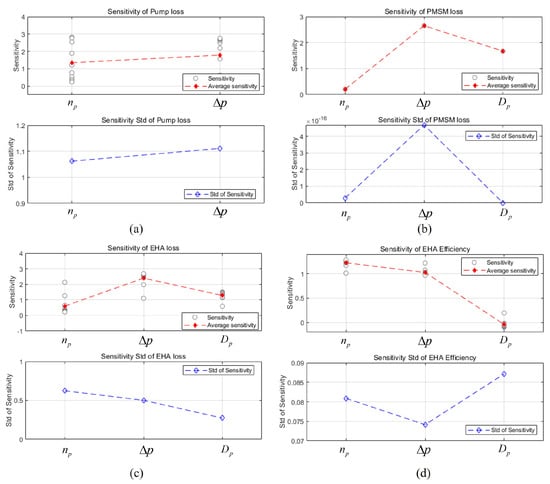
Figure 29.
Sensitivity analysis results of EHA. (a) Gear pump power loss. (b) Motor power loss. (c) Total power loss of EHA. (d) Total efficiency of EHA.
It can be seen from Figure 29a that the gear pump power loss was susceptible to both parameters and , and it increased with the increase in parameters and . Among them, the increase in parameter mainly increased the mechanical loss of the gear pump, and the increase in parameter mainly increased the volume loss of the gear pump. The sensitivity standard deviations of the gear pump power loss to the two parameters and were also large, which means that it was also greatly affected by the oil temperature and viscosity.
It can be seen from Figure 29b that the motor power loss was susceptible to parameters , , and , and it increased with the increase in the three parameters. Among them, the increase in parameter mainly increased the motor iron loss, and the increase in parameters and increased the motor torque, resulting in a corresponding increase in the motor copper loss. The standard deviation shows that the sensitivity of the motor power loss to the three parameters , , and was little affected by the oil temperature.
From Figure 29c,d, it can be seen that, although the sensitivity of the total power loss to parameters , , and was positive, the increase in parameters , , and also increased the effective power of the EHA. When the increased effective power is greater than the increased total power loss, the overall efficiency of the EHA will also increase. Therefore, although the total power loss was increased when the output power was increased, the overall efficiency of the EHA was also improved simultaneously.
- (3)
- Improvement methods
1) CVA
a) Efficiency improvement of CVA
From the sensitivity analysis results in Figure 28, it can be seen that the efficiency of the CVA could be improved by reducing the power loss along the pipeline and the throttling power loss of the servo valve.
For the reduction in throttling power loss, the following solutions are possible.
First, reduce the difference between the pump outlet pressure and the load pressure . Constant-pressure hydraulic pumps are commonly used in aircraft hydraulic systems. Due to the high output pressure and low load pressure demand, a large amount of throttling power loss is caused. Under the premise of meeting the load pressure requirements, appropriately reducing can reduce the throttling power loss of the servo valve. Specifically, the pressure-compensated variable displacement pump can be intelligently transformed so that its pressure can intelligently match the load pressure.
Second, increase the pressure level of the CVA. From the sensitivity analysis results in Figure 28, it can be seen that reducing can also improve the overall efficiency of the CVA. Increasing the pressure level can reduce the effective area of the cylinder under the same load force requirement, thereby reducing the flow requirement.
For the reduction in the power loss along the pipeline, the following solutions are proposed.
First, optimize the hydraulic pipeline layout. Appropriately increasing the diameter of the hydraulic pipeline, reducing the bending of the pipeline, reducing the effective length of the pipeline, and using joints can reduce the power loss along the pipeline.
Second, from the sensitivity analysis results in Figure 28, it can be seen that reducing can reduce the power loss along the pipeline and improve the overall efficiency of the CVA. By increasing the pressure level, the effective area of the cylinder can be reduced under the same load force requirements, thereby reducing the demand for .
b) Dynamic response improvement of CVA
Increasing the pressure level of CVA can improve its dynamic response. Increasing the pressure level can reduce the effective area of the cylinder under the same load force requirement. According to Equation (18), when is reduced, and are also reduced. When the cylinder stroke is the same, the reduction ratio of and is consistent with that of , then the natural frequency remains unchanged. At this time, the speed gain will be increased, and the dynamic response of the CVA will be improved.
2) EHA
a) Efficiency improvement of EHA
From the sensitivity analysis results in Figure 29, it can be found that the efficiency of EHA can be improved by following solutions.
First, reduce the pump displacement . The sensitivity analysis results in Figure 29 show that reducing the pump displacement can reduce the total power loss and improve the total efficiency of the EHA. For a real aircraft hydraulic system, flow requirements are mostly low over the entire flight profile. By intelligently controlling the reduction in the pump displacement, the heat generation of the EHA can be greatly reduced, and the efficiency can be improved.
Second, increase the speed . Increasing can keep the load demand flow of EHA unchanged, while reducing the pump displacement . From the sensitivity analysis results in Figure 29, increasing can also improve the overall efficiency of the EHA.
b) Dynamic response improvement of EHA
The dynamic response of the EHA can be improved with following solutions.
First, increase the pressure level of the EHA. Similarly to for the CVA, increasing the pressure level can reduce the effective area of the cylinder with the same load force requirement. In the case of a constant natural frequency, the speed gain will increase, and the dynamic response of the EHA will be improved.
Second, increase the motor and pump speed . Increasing can reduce the pump displacement and motor output torque, thereby increasing the power density of the motor pump and reducing the moment of inertia, and finally improving the dynamic response of the EHA.
In summary, the results of this paper can be utilized to improve the design and control of CVAs and EHAs, thereby achieving higher efficiency and dynamic performance. For CVAs, increasing the pressure level of the centralized pump source and intelligently controlling it can improve the efficiency and dynamic performance. For EHAs, increasing the pressure level, increasing the rotation speed, and intelligently controlling the pump displacement can improve the efficiency and dynamic performance.
5. Conclusions
This paper established power flow and dynamic models for CVAs and EHAs. Then, five load spectrum test conditions and four step test conditions were designed to test the efficiency and dynamic response characteristics of CVAs and EHAs. Based on the model and simulation analysis, this paper further develops prototypes of a CVA and EHA. Then, a test platform was developed, and the energy efficiency and dynamic response of the CVA and EHA prototypes were compared through experimental tests. The simulation and experimental test results showed that the energy efficiency of the CVA was much lower than that of the EHA, while the dynamic response performance was better than that of the EHA. This paper further carried out a power loss quantification and sensitivity analysis of the CVA and EHA. Quantitative analysis results showed that the throttling power loss of the servo valve was the main reason for the low energy efficiency of the CVA. The results of the sensitivity analysis showed that for the CVA, increasing the pressure and adaptively adjusting the pressure could improve its efficiency and dynamic response. For the EHA, in addition to increasing the pressure and motor speed, adaptively adjusting the pump displacement could improve its efficiency and dynamic response. In the future, the optimized design and control of CVAs and EHAs can be carried out based on the results of this paper, thereby achieving higher efficiency and dynamic performance.
Author Contributions
Conceptualization, B.Y., H.L. and X.O.; Data curation, B.Y., Y.L. and T.L.; Formal analysis, Y.L., H.J. and Z.L.; Funding acquisition, X.O.; Investigation, B.Y., H.J. and X.O.; Methodology, B.Y., H.L. and X.O.; Project administration, H.L. and X.O.; Resources, B.Y., Y.L. and T.L.; Software, B.Y. and Y.L.; Supervision, H.L. and X.O.; Validation, Y.L.; Writing—original draft, B.Y.; Writing—review and editing, H.L. All authors have read and agreed to the published version of the manuscript.
Funding
This research was funded by the National Natural Science Foundation of China (Grant No. 51890883, 52305077, and U2141209), the National Natural Science Foundation of Zhejiang Province (Grant No. LQ23E050013) and the Project 1912.
Data Availability Statement
The data presented in this study are available on request from the corresponding author.
Conflicts of Interest
The authors declare no conflicts of interest.The funders had no role in the design of the study; in the collection, analyses, or interpretation of data; in the writing of the manuscript; or in the decision to publish the results.
Abbreviations
The following abbreviations are used in this manuscript:
| CVA | Centralized valve actuator |
| EDP | Engine-driven pump |
| EHA | Electro-hydrostatic actuator |
| FPVS | Fixed pump displacement variable motor speed |
| VPFS | Variable pump displacement fixed motor speed |
| VPVS | Variable pump displacement variable motor speed |
| PMSM | Permanent magnet synchronous motor |
Nomenclature
| Piston area of the hydraulic cylinder of CVA (m2) | |
| Piston area of the hydraulic cylinder of EHA (m2) | |
| B | Width of the gear of gear pump (m) |
| Piston leakage coefficient of CVA (m3/s/Pa) | |
| Internal leakage coefficient of the piston of CVA (m3/s/Pa) | |
| External leakage coefficient of the piston of CVA (m3/s/Pa) | |
| Overall flow coefficient of the hydraulic pump (m3/s/Pa) | |
| Internal leakage coefficient of the pump of EHA (m3/s/Pa) | |
| External leakage coefficient of the pump of EHA (m3/s/Pa) | |
| Total leakage coefficient of the cylinder of EHA (m3/s/Pa) | |
| Internal leakage coefficient of the cylinder of EHA (m3/s/Pa) | |
| External leakage coefficient of the cylinder of EHA (m3/s/Pa) | |
| Overall flow coefficient of EHA (m3/s/Pa) | |
| Counter electromotive force coefficient (-) | |
| Inner diameter of the adaptor on the high-pressure side (mm) | |
| Inner diameter of the adaptor on the low-pressure side (mm) | |
| Inner diameter of the pipeline on the high-pressure side (mm) | |
| Inner diameter of the pipeline on the low-pressure side (mm) | |
| Displacement of the gear pump (ml/rev) | |
| Energy loss per switch of each power switch (mJ) | |
| Operating frequency of the driver (Hz) | |
| External load force acting on the piston of CVA (N) | |
| External load force acting on the piston of EHA (N) | |
| Effective mass of the iron core lamination (kg) | |
| Current vectors in the d axis (A) | |
| Current of Permanent magnet Synchronous Motor (A) | |
| Nominal current of motor driver (A) | |
| Phase current of the motor (A) | |
| Current vectors in the q axis (A) | |
| Inertia moment of the motor and pump shaft (kg·m2) | |
| Empirical coefficient of iron loss (-) | |
| Flow-pressure coefficient of the servo valve (-) | |
| Total flow-pressure coefficient of CVA (-) | |
| Torque coefficient of the Permanent magnet Synchronous Motor (-) | |
| Flow gain of the servo valve (-) | |
| Electromagnet amplification factor of the servo valve (-) | |
| Quantity of elbows of the pipeline on the high-pressure side (-) | |
| Quantity of adaptors of the pipeline on the high-pressure side (-) | |
| Quantity of filters of the pipeline on the high-pressure side (-) | |
| Quantity of elbows of the pipeline on the low-pressure side (-) | |
| Quantity of adaptors of the pipeline on the low-pressure side (-) | |
| Quantity of filters of the pipeline on the low-pressure side (-) | |
| Length of the pipeline on the high-pressure side (m) | |
| Length of the pipeline on the low-pressure side (m) | |
| Equivalent inductances in the d axis (H) | |
| Equivalent inductances in the q axis (H) | |
| Inductance matrix in the phase coordinate system (H) | |
| Equivalent mass of the piston and the load of CVA (kg) | |
| Equivalent mass of the piston and the load of EHA (kg) | |
| Phase number of the motor winding (-) | |
| Number of power switches of motor driver (-) | |
| Pressure of the P port of servo valve (Pa) | |
| Pressure of the T port of servo valve (Pa) | |
| Pressure of the pressure compensated pump source (Pa) | |
| Pressure of the pressurized reservoir (Pa) | |
| Pressure of the cylinder inlet of CVA (Pa) | |
| Pressure of the cylinder outlet of CVA (Pa) | |
| Load pressure of CVA (Pa) | |
| Load pressure of EHA (Pa) | |
| Pressure of the cylinder inlet of EHA (Pa) | |
| Pressure of the cylinder outlet of EHA (Pa) | |
| Iron loss corresponding to the unit weight of the iron core lamination (W) | |
| Load flow of the hydraulic of CVA (lpm) | |
| Flow of the cylinder inlet of CVA (lpm) | |
| Flow of the cylinder outlet of CVA (lpm) | |
| Load flow of the hydraulic of EHA (lpm) | |
| Flow of the cylinder inlet of EHA (lpm) | |
| Flow of the cylinder outlet of EHA (lpm) | |
| Reynolds number of the oil (-) | |
| R | Radius of the pitch circle (m) |
| Radius of the addendum circle (m) | |
| Radius of the dedendum circle (m) | |
| Radius of the gear shaft (m) | |
| AC resistance of the winding () | |
| Thickness of the addendum (m) | |
| Friction torque of the Permanent magnet Synchronous Motor (N·m) | |
| Output torque of the Permanent magnet Synchronous Motor (N·m) | |
| Terminal voltage in the phase coordinate system (V) | |
| Command voltage signal of the servo valve (V) | |
| Oil flow velocity in the hydraulic pipeline (m/s) | |
| Initial oil inlet chamber volume of the cylinder of CVA (m3) | |
| Initial oil return chamber volume of the cylinder of CVA (m3) | |
| Total volume of the cylinder of CVA (m3) | |
| Initial oil inlet chamber volume of the cylinder of EHA (m3) | |
| Initial oil return chamber volume of the cylinder of EHA (m3) | |
| Collector-emitter voltage drop when forward conduction of motor driver (V) | |
| Freewheeling diode voltage drop of motor driver (V) | |
| Nominal voltage drop of motor driver (V) | |
| Total volume of the hydraulic cylinder of EHA (m3) | |
| Displacement of the servo valve spool (mm) | |
| Displacement of cylinder of CVA (mm) | |
| Displacement of cylinder of EHA (mm) | |
| Z | Number of gear teeth (-) |
| Number of teeth in the transition zone (-) | |
| Bulk modulus of oil (Pa) | |
| Average leakage power loss in hydraulic cylinder (W) | |
| Leakage power loss in hydraulic cylinder (W) | |
| Winding copper loss of Permanent magnet Synchronous Motor (W) | |
| Stator iron loss of Permanent magnet Synchronous Motor (W) | |
| Viscous friction loss between the gear side/liquid (W) | |
| Viscous friction loss between the addendum surface/pump body (W) | |
| Average power loss of Permanent magnet Synchronous Motor (W) | |
| Power loss of CVA under load-holding condition (W) | |
| Power loss of EHA under load-holding condition (W) | |
| Switching power loss of motor driver (W) | |
| Turn-on power loss of motor driver (W) | |
| Total power loss of the hydraulic pipeline on the high-pressure side (W) | |
| Total power loss of the hydraulic pipeline on the low-pressure side (W) | |
| Average power loss of the hydraulic pipeline in CVA (W) | |
| Average power loss of gear pump (W) | |
| Power loss of motor driver (W) | |
| Throttling power loss of servo valve (W) | |
| Average throttling power loss of servo valve in CVA (W) | |
| Engine-driven pump (EDP) volumetric loss under load-holding condition (W) | |
| Gear pump volumetric loss of EHA under load-holding condition (W) | |
| Servo valve leakage loss of CVA under load-holding condition (W) | |
| Pressure loss along the hydraulic pipeline on the low-pressure side (Pa) | |
| Pressure loss of a single elbow on the low-pressure side (Pa) | |
| Pressure loss of a single adaptor on the low-pressure side (Pa) | |
| Pressure loss of filters on the low-pressure side (Pa) | |
| Pressure loss along the hydraulic pipeline (Pa) | |
| Pressure loss of a single elbow on the high-pressure side (Pa) | |
| Pressure loss of a single adaptor on the high-pressure side (Pa) | |
| Pressure loss of filters on the high-pressure side (Pa) | |
| Total pressure loss of the hydraulic pipeline on the high-pressure side (Pa) | |
| Total pressure loss of the hydraulic pipeline on the low-pressure side (Pa) | |
| Leakage flow rate of the gear end face gap (lpm) | |
| Leakage flow of gear radial gap (lpm) | |
| Leakage flow of servo valve at 10 MPa differential pressure (lpm) | |
| Axial gap between the gear and the end face (m) | |
| Radial gap between the addendum and the pump case (m) | |
| Average efficiency of CVA (%) | |
| Average efficiency of EHA (%) | |
| Mechanical efficiency of the gear pump (%) | |
| Average efficiency of Permanent magnet Synchronous Motor (%) | |
| Overall efficiency of the gear pump (%) | |
| Volumetric efficiency of the gear pump (%) | |
| Wrap angles of transition zone in the gear pump (rad) | |
| Wrap angles of high-pressure zone in the gear pump (rad) | |
| Resistance coefficient along the pipeline (-) | |
| Dynamic viscosities of the oil (N·s/m2) | |
| Kinematic viscosity of the oil (mm2/s) | |
| Pipe elbow resistance coefficient (-) | |
| Resistance coefficient when the diameter of the pipeline changes from large to small (-) | |
| Resistance coefficient when the diameter of the pipeline changes from large to small (-) | |
| Hydraulic damping of CVA (-) | |
| Hydraulic damping ratio of EHA (-) | |
| Density of the oil (kg/m3) | |
| Number of pole pairs of Permanent magnet Synchronous Motor (-) | |
| Magnetic flux of the permanent magnet (Wb) | |
| Hydraulic natural frequency of CVA (Hz) | |
| Hydraulic natural frequency of EHA (Hz) | |
| Rotary speed of gear pump (rpm) |
References
- Chakraborty, I.; Mavris, D.N.; Emeneth, M.; Schneegans, A. A methodology for vehicle and mission level comparison of More Electric Aircraft subsystem solutions: Application to the flight control actuation system. Proc. Inst. Mech. Eng. Part G J. Aerosp. Eng. 2015, 229, 1088–1102. [Google Scholar] [CrossRef]
- Chao, Q.; Zhang, J.; Xu, B.; Huang, H.; Pan, M. A Review of High-Speed Electro-Hydrostatic Actuator Pumps in Aerospace Applications: Challenges and Solutions. J. Mech. Des. 2019, 141, 050801. [Google Scholar] [CrossRef]
- Naayagi, R.T. A review of more electric aircraft technology. In Proceedings of the International Conference on Energy Efficient Technologies for Sustainability, Nagercoil, India, 10–12 April 2013. [Google Scholar]
- Yao, J.; Wang, P.; Yin, Y.; Li, M.; Li, Y. Power management of multi-source network hydraulic system with multiple actuators. Energy Convers. Manag. 2020, 223, 113247. [Google Scholar] [CrossRef]
- Wheeler, P.; Bozhko, S. The More Electric Aircraft: Technology and challenge. IEEE Electrif. Mag. 2014, 2, 6–12. [Google Scholar] [CrossRef]
- Ho, T.H.; Le, T.D. Development and Evaluation of Energy-Saving Electro-Hydraulic Actuator. Actuators 2021, 10, 302. [Google Scholar] [CrossRef]
- Maré, J.-C. From Douglas DC3 to Airbus A380–seventy years of innovation in aerospace hydraulics. In Proceedings of the 4th Internationales Fluidtechnisches Kolloquium, Dresden, Germany, 24–26 March 2004. [Google Scholar]
- Van Den Bossche, D. The A380 flight control electrohydrostatic actuators, achievements and lessons learnt. In Proceedings of the 25th International Congress of the Aeronautical Sciences, Hamburg, Germany, 3–8 September 2006. [Google Scholar]
- McCollom, N.N.; Brown, E.R. PHM on the F-35 fighter. In Proceedings of the IEEE Conference on Prognostics and Health Management, Denver, CO, USA, 20–23 June 2011. [Google Scholar]
- Shaw, J.C.; Fletcher, S.D.A.; Norman, P.J.; Galloway, S.J. More electric power system concepts for an environmentally responsible aircraft (N+2). In Proceedings of the 47th International Universities Power Engineering Conference, Uxbridge, UK, 4–7 September 2012. [Google Scholar]
- Tom, L.; Khowja, M.; Vakil, G.; Gerada, C. Commercial Aircraft Electrification-Current State and Future Scope. Energies 2021, 14, 8381. [Google Scholar] [CrossRef]
- Ma, Z.; Wang, S.; Shi, J.; Li, T.; Wang, X. Fault diagnosis of an intelligent hydraulic pump based on a nonlinear unknown input observer. Chin. J. Aeronaut. 2018, 31, 385–394. [Google Scholar] [CrossRef]
- Alle, N.; Hiremath, S.S.; Makaram, S.; Subramaniam, K.; Talukdar, A. Review on electro hydrostatic actuator for flight control. Int. J. Fluid Power 2016, 17, 125–145. [Google Scholar] [CrossRef]
- Wang, M.; Wang, Y.; Yang, R.; Fu, Y.; Zhu, D. A Sliding Mode Control Strategy for an ElectroHydrostatic Actuator with Damping Variable Sliding Surface. Actuators 2021, 10, 3. [Google Scholar] [CrossRef]
- Andersson, J.; Krus, P.; Nilsson, K. Optimization as a support for selection and design of aircraft actuation systems. In Proceedings of the 7th AIAA/USAF/NASA/ISSMO Symposium on Multidisciplinary Analysis and Optimization, St. Louis, MO, USA, 2–4 September 1998. [Google Scholar]
- Shang, Y.; Liu, X.; Jiao, Z.; Wu, S. An integrated load sensing valve-controlled actuator based on power-by-wire for aircraft structural test. Aerosp. Sci. Technol. 2018, 77, 117–128. [Google Scholar] [CrossRef]
- Agostini, T.; De Negri, V.; Minav, T.; Pietola, M. Effect of Energy Recovery on Efficiency in Electro-Hydrostatic Closed System for Differential Actuator. Actuators 2020, 9, 12. [Google Scholar] [CrossRef]
- Song, Y.; Ba, K.; Wang, Y.; Zhang, J.; Yu, B.; Zhang, Q.; Kong, X. Study on nonlinear dynamic behavior and stability of aviation pressure servo valve-controlled cylinder system. Nonlinear Dyn. 2022, 108, 3077–3103. [Google Scholar] [CrossRef]
- Quan, Z.; Quan, L.; Zhang, J. Review of energy efficient direct pump controlled cylinder electro-hydraulic technology. Renew. Sustain. Energy Rev. 2014, 35, 336–346. [Google Scholar] [CrossRef]
- Li, K.; Lv, Z.; Lu, K.; Yu, P. Thermal-hydraulic Modeling and Simulation of the Hydraulic System based on the Electro-hydrostatic Actuator. Procedia Eng. 2014, 80, 272–281. [Google Scholar] [CrossRef]
- Hu, W.; Zhou, L.; Tian, Y.; Jiao, Z.; Shang, Y.; Song, Z.; Yan, L. Analysis for the power loss of electro hydrostatic actuator and hydraulic actuator. In Proceedings of the IEEE International Conference on Advanced Intelligent Mechatronics, Busan, Republic of Korea, 7–11 July 2015. [Google Scholar]
- Navatha, A.; Bellad, K.; Hiremath, S.S.; Karunanidhi, S. Dynamic Analysis of Electro Hydrostatic Actuation System. Procedia Technol. 2016, 25, 1289–1296. [Google Scholar] [CrossRef]
- Maré, J.-C.; Budinger, M. Comparative analysis of energy losses in servo-hydraulic, electro-hydrostatic and electro-mechanical actuators. In Proceedings of the 11th Scandinavian International Conference on Fluid Power, Linköping, Sweden, 2–4 June 2009. [Google Scholar]
- Maré, J.-C. Towards more electric drives for embedded applications:(re) discovering the advantages of hydraulics. In Proceedings of the 7th International Fluid Power Conference, Aachen, Germany, 22–24 March 2010. [Google Scholar]
- Gaile, A.; Lue, Y. Electro Hydraulic Actuation (EHA) systems for primary flight control, landing gear and other type of actuation. In Proceedings of the IEEE International Conference on Aircraft Utility Systems, Beijing, China, 10–12 October 2016. [Google Scholar]
- Li, Z.; Shang, Y.; Jiao, Z.; Lin, Y.; Wu, S.; Li, X. Analysis of the dynamic performance of an electro-hydrostatic actuator and improvement methods. Chin. J. Aeronaut. 2018, 31, 2312–2320. [Google Scholar] [CrossRef]
- Waheed, U.R.; Wang, S.; Wang, X.; Fan, L.; Kamran, A.S. Motion synchronization in a dual redundant HA/EHA system by using a hybrid integrated intelligent control design. Chin. J. Aeronaut. 2016, 29, 789–798. [Google Scholar]
- Hu, X.; Mao, Z.; Jiao, Z.; Wu, S.; Yu, X.; Li, F. Analysis of the characteristics by modeling and simulation of actuator in flight control system. In Proceedings of the IEEE Chinese Guidance, Navigation and Control Conference, Yantai, China, 15 January 2015. [Google Scholar]
- Roboam, X.; Sareni, B.; De Andrade, A. More Electricity in the Air: Toward Optimized Electrical Networks Embedded in More-Electrical Aircraft. IEEE Ind. Electron. Mag. 2012, 6, 6–17. [Google Scholar] [CrossRef]
- Wang, Y.; Guo, S.; Dong, H. Modeling and control of a novel electro-hydrostatic actuator with adaptive pump displacement. Chin. J. Aeronaut. 2020, 33, 365–371. [Google Scholar] [CrossRef]
- Quan, L. Current State, Problems and the Innovative Solution of Electric-hydraulic Technology of Pump Controlled Cylinder. Chin. J. Mech. Eng. 2008, 44, 87–92. [Google Scholar] [CrossRef]
- Gao, Z.-X.; Deng, J.; Ge, X. Simulation of bubbly two-phase turbulent flow in circular pipe bend. J. Hydraul. Eng. 2009, 40, 696–702. [Google Scholar]
- Qu, S.; Zappaterra, F.; Vacca, A.; Busquets, E. An electrified boom actuation system with energy regeneration capability driven by a novel electro-hydraulic unit. Energy Conv. Manag. 2023, 293, 117443. [Google Scholar] [CrossRef]
- Thiagarajan, D.; Dhar, S.; Vacca, A. A Novel Fluid Structure Interaction-EHD Model and Optimization Procedure for an Asymmetrical Axially Balanced External Gear Machine. Tribol. Trans. 2015, 58, 274–287. [Google Scholar] [CrossRef]
- Torrent, M.; Gamez-Montero, P.J.; Codina, E. Model of the Floating Bearing Bushing Movement in an External Gear Pump and the Relation to Its Parameterization. Energies 2021, 14, 8553. [Google Scholar] [CrossRef]
- Dambrauskas, K.; Vanagas, J.; Zimnickas, T.; Kalvaitis, A.; Azubalis, M. A Method for Efficiency Determination of Permanent Magnet Synchronous Motor. Energies 2020, 13, 1004. [Google Scholar] [CrossRef]
- Iron Core One-Stop Solution. Available online: https://www.20wtg1500.com/ (accessed on 20 January 2024).
- Akoro, E.; Tevi, F.M.E.; Hamoud, F.; Maiga, A.S.; Doumbia, M.L. Comparative Study of Power Losses in Single and Parallel High-Power Photovoltaic Inverter Systems. In Proceedings of the 2020 1st International Conference on Innovative Research in Applied Science, Engineering and Technology, Meknes, Morocco, 16–19 April 2020. [Google Scholar]
- Zhou, F.; Sun, M.; Liu, H.; Ouyang, X.; Xu, L.; Yao, Y. An adaptive dead zone compensation control method for EHAs under low-speed conditions. Chin. J. Mech. Eng. 2022, in press. [CrossRef]
- Li, X.; Wang, S. Flow field and pressure loss analysis of junction and its structure optimization of aircraft hydraulic pipe system. Chin. J. Aeronaut. 2013, 26, 1080–1092. [Google Scholar] [CrossRef]
- Cooper, M.A. Simulating Actuator Energy Demands of an Aircraft in Flight. Ph.D. Thesis, Cranfield University, Bedford, UK, 2014. [Google Scholar]
- Dai, W.L.; Yan, Y.G. Development trend and current situation of starter-generator for aircraft engine. Aeronaut. Sci. Technol. 2010, 5, 28–32. [Google Scholar]
- Huang, B.; Wang, S.; Shi, J. Energy-saving optimization for intelligent pumps based on performance reliability restriction. J. Beijing Univ. Aeronaut. Astronaut. 2013, 39, 559–563. [Google Scholar]
- Zhang, K.; Zhang, J.; Gan, M.; Zong, H.; Wang, X.; Huang, H.; Su, Q.; Xu, B. Modeling and Parameter Sensitivity Analysis of Valve-Controlled Helical Hydraulic Rotary Actuator System. Chin. J. Mech. Eng. 2022, 35, 66. [Google Scholar] [CrossRef]
- Hall, J.W.; Boyce, S.A.; Wang, Y.; Dawson, R.J.; Tarantola, S.; Saltelli, A. Sensitivity Analysis for Hydraulic Models. J. Hydraul. Eng. 2009, 135, 1080–1092. [Google Scholar] [CrossRef]
- Goshtasbi, A.; Chen, J.; Waldecker, J.R.; Hirano, S.; Ersal1, T. Effective Parameterization of PEM Fuel Cell Models—Part I: Sensitivity Analysis and Parameter Identifiability. J. Electrochem. Soc. 2020, 167, 044504. [Google Scholar] [CrossRef]
- Goshtasbi, A.; Chen, J.; Waldecker, J.R.; Hirano, S.; Ersal1, T. Effective Parameterization of PEM Fuel Cell Models—Part II: Robust Parameter Subset Selection, Robust Optimal Experimental Design, and Multi-Step Parameter Identification Algorithm. J. Electrochem. Soc. 2020, 167, 044505. [Google Scholar] [CrossRef]
- Saltelli, A.; Ratto, M.; Andres, T.; Campolongo, F.; Cariboni, J.; Gatelli, D.; Saisana, M.; Tarantola, S. Global Sensitivity Analysis: The Primer; John Wiley & Sons, Ltd.: Hoboken, NJ, USA, 1998. [Google Scholar]
- Huang, H.; Mao, Y.; Sun, Y.; Pei, X. Test and Analysis of YH-15 Aviation Hydraulic Oil Viscosity-temperature Characteristics. Ordnance Ind. Autom. 2015, 34, 42–43. [Google Scholar]


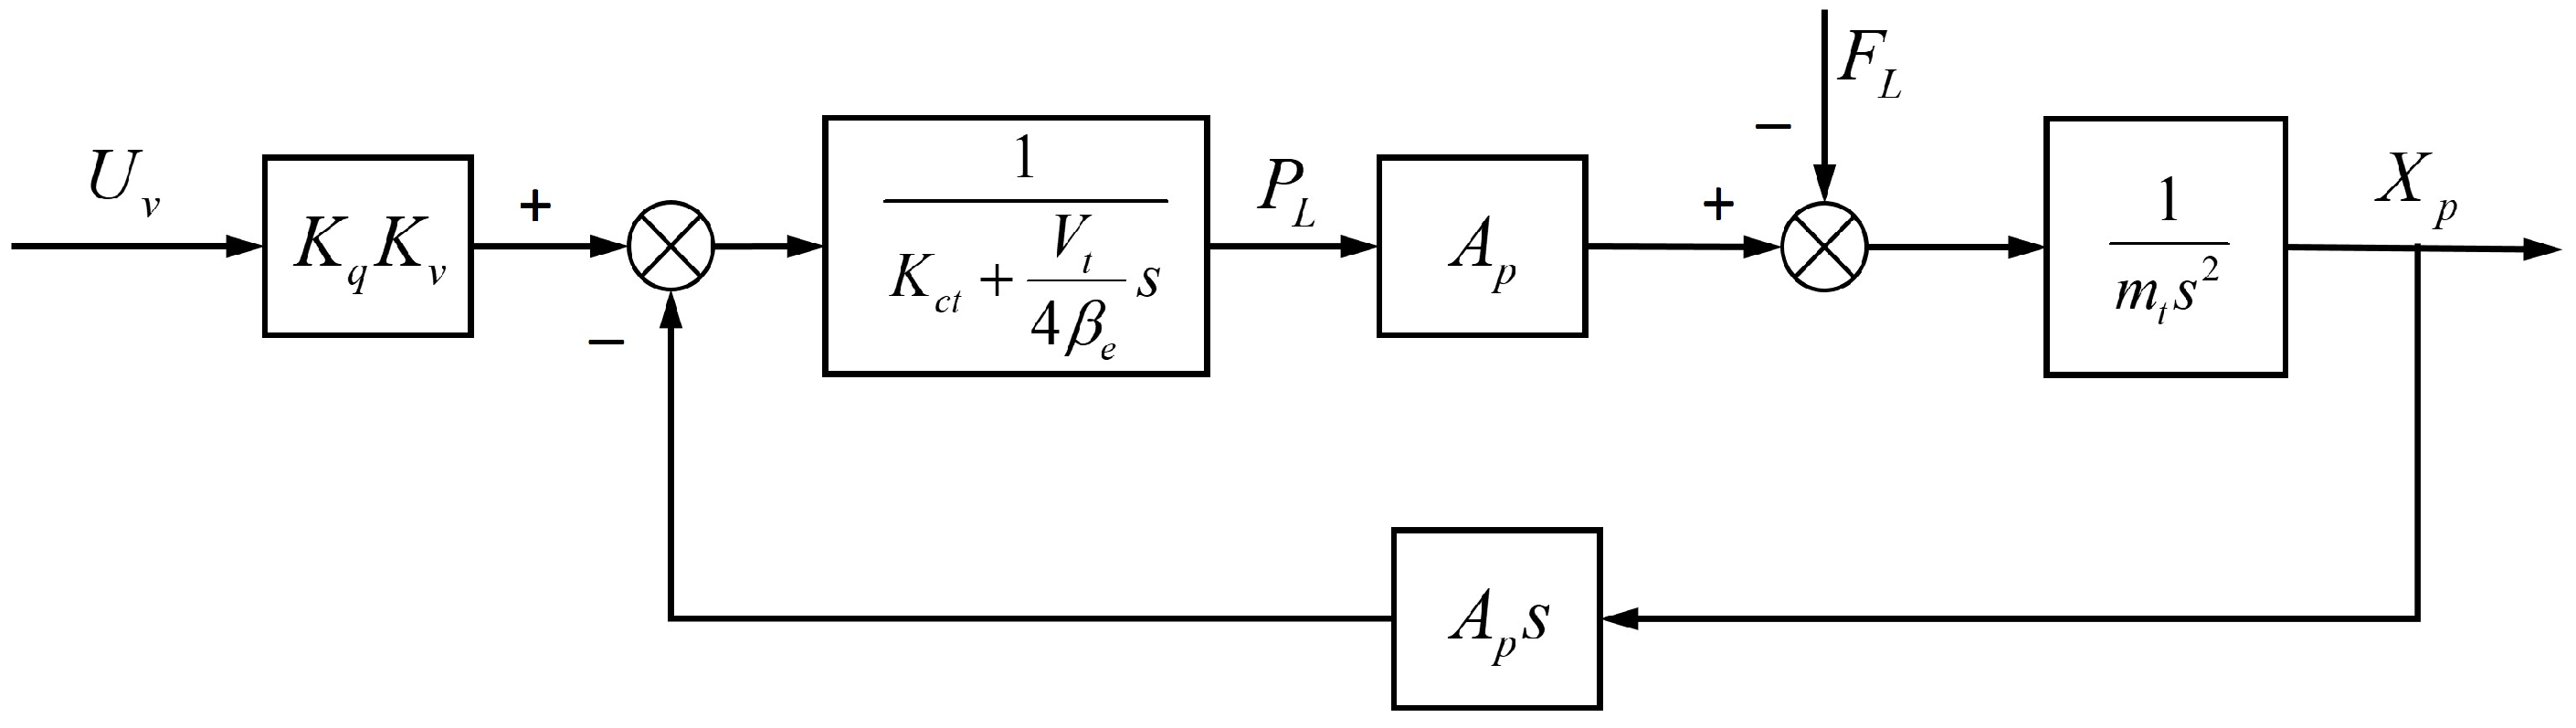
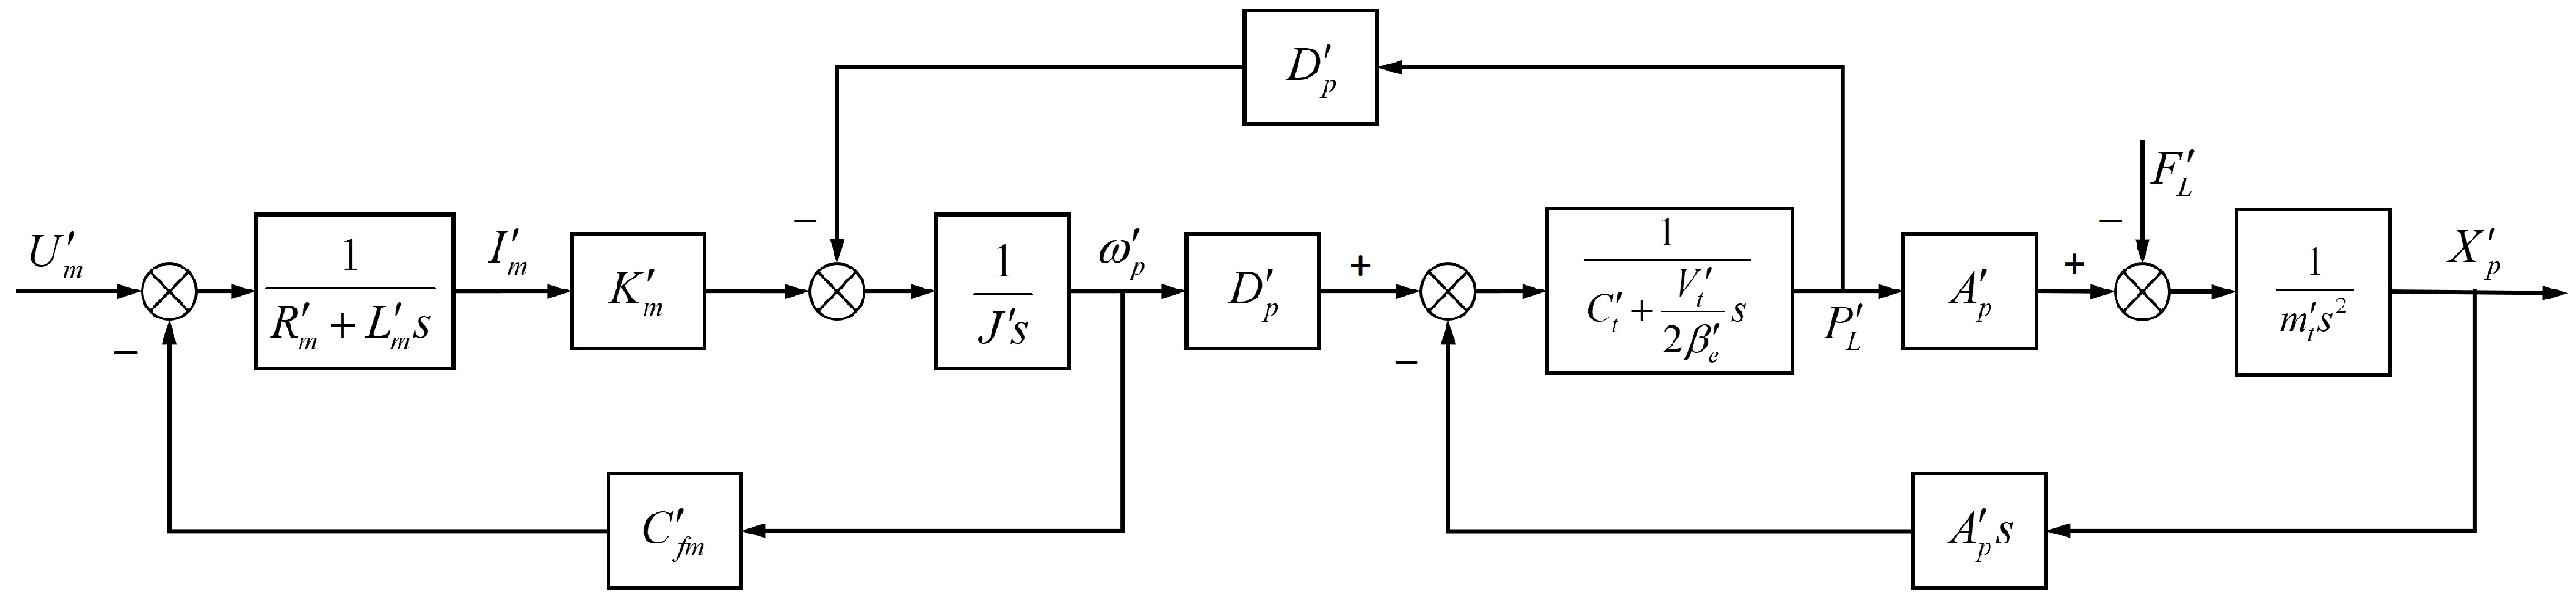
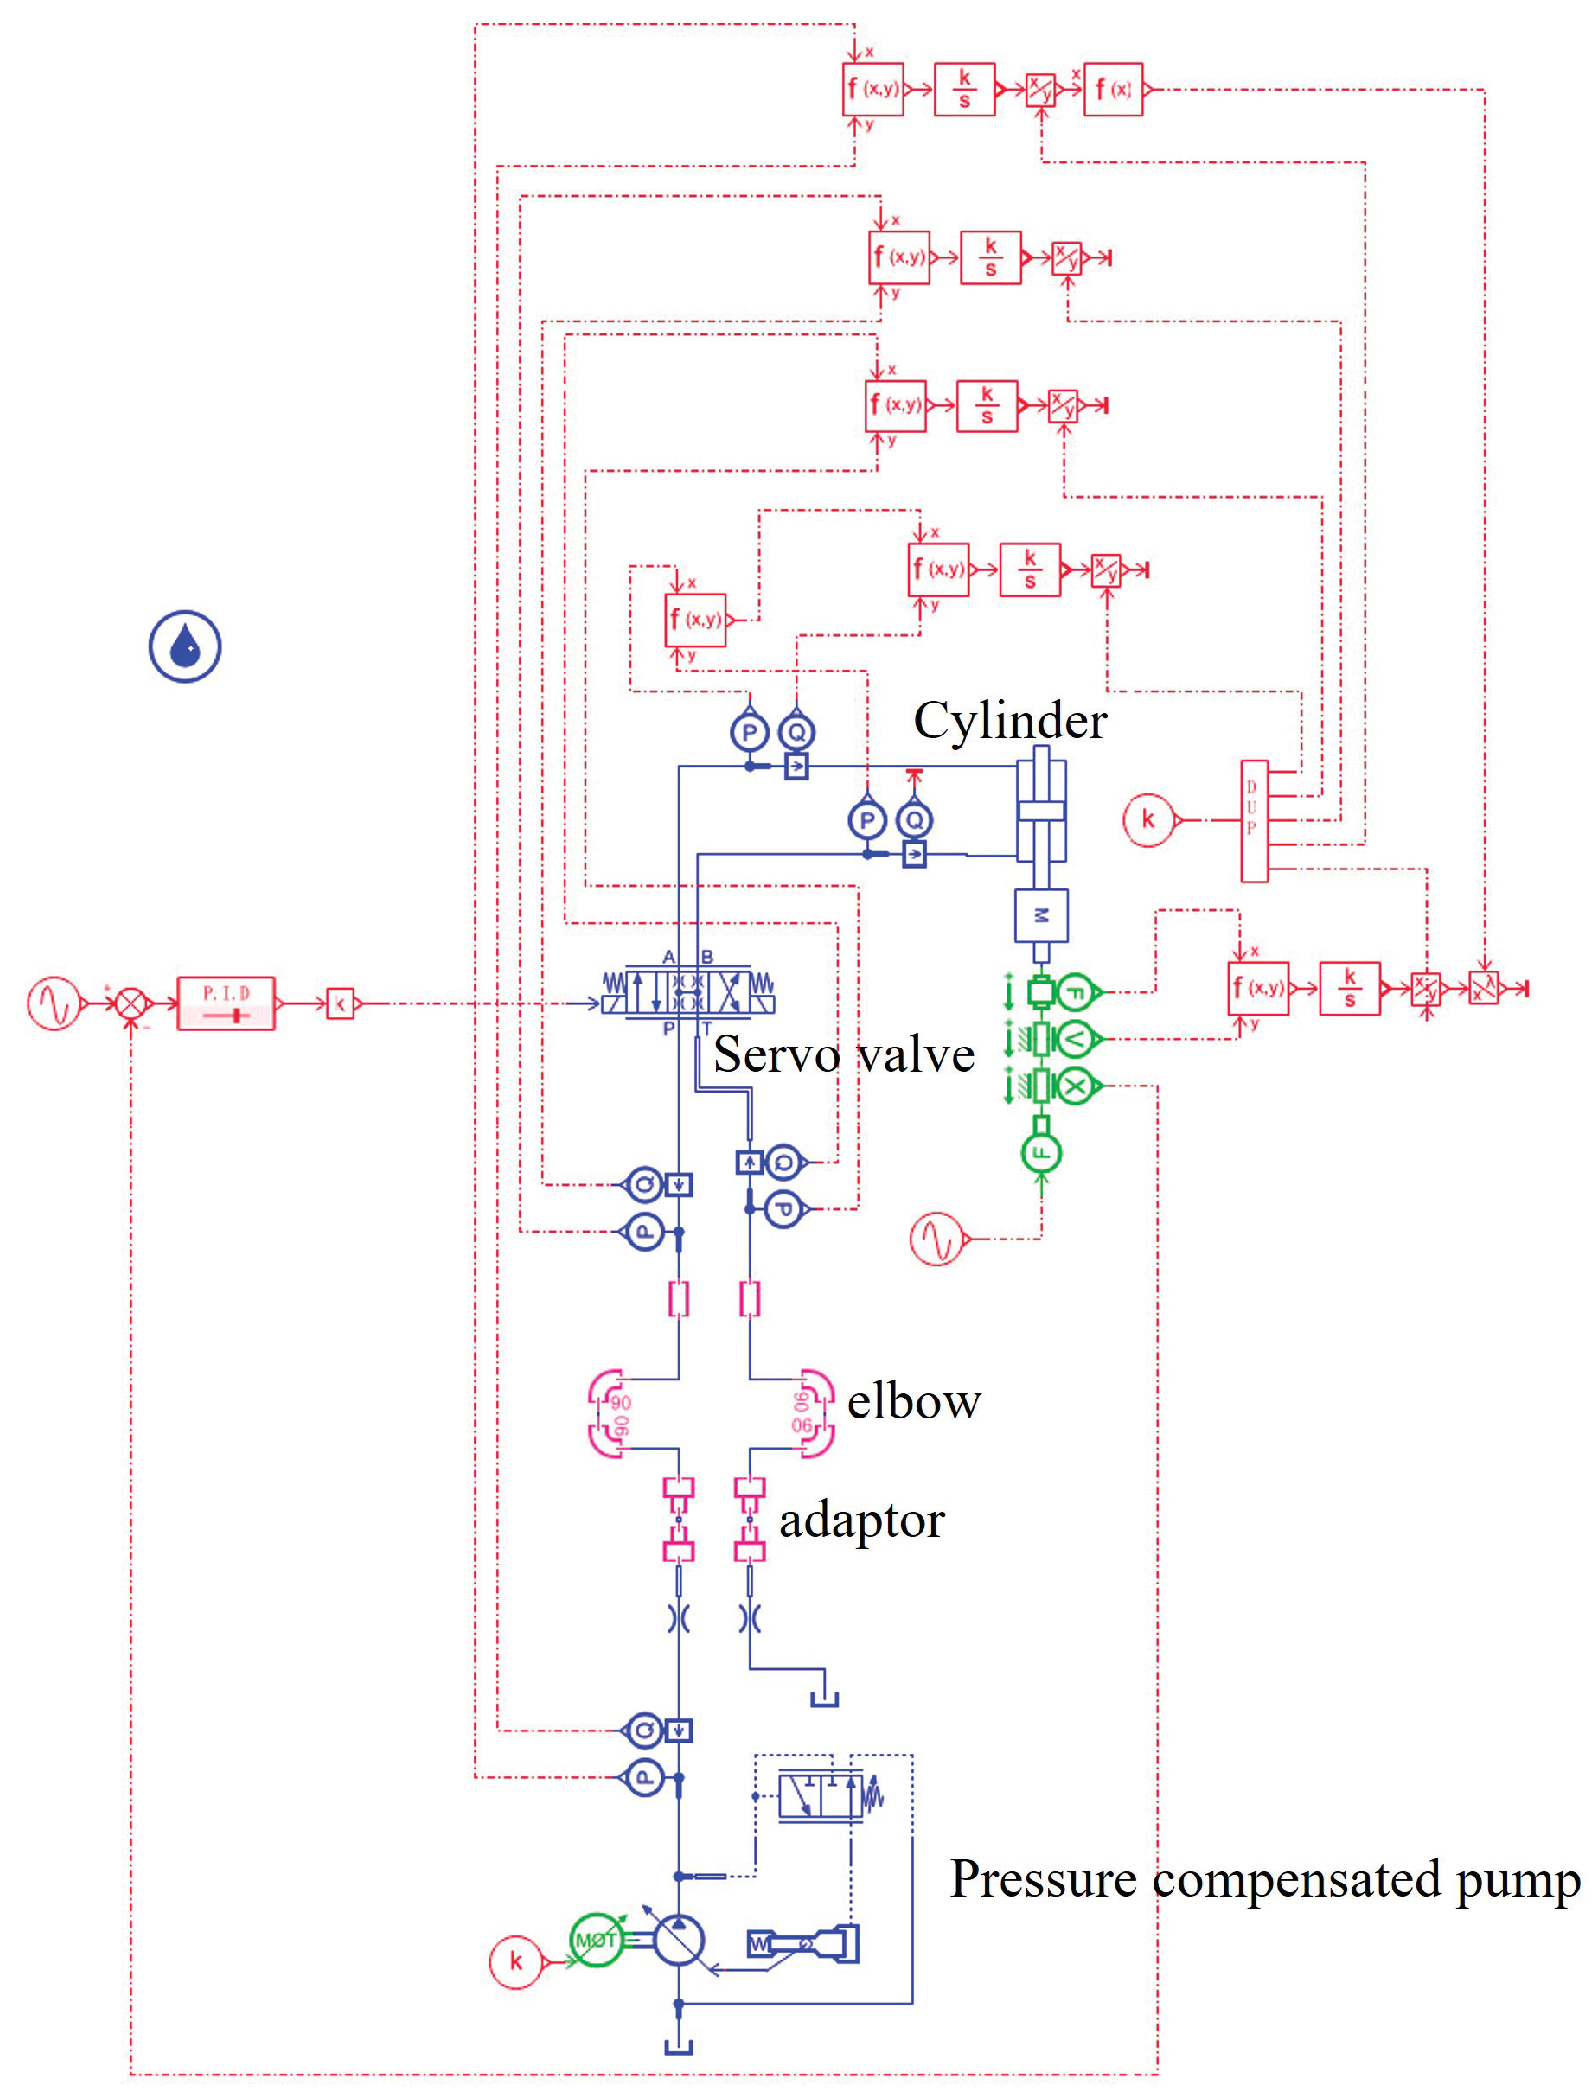
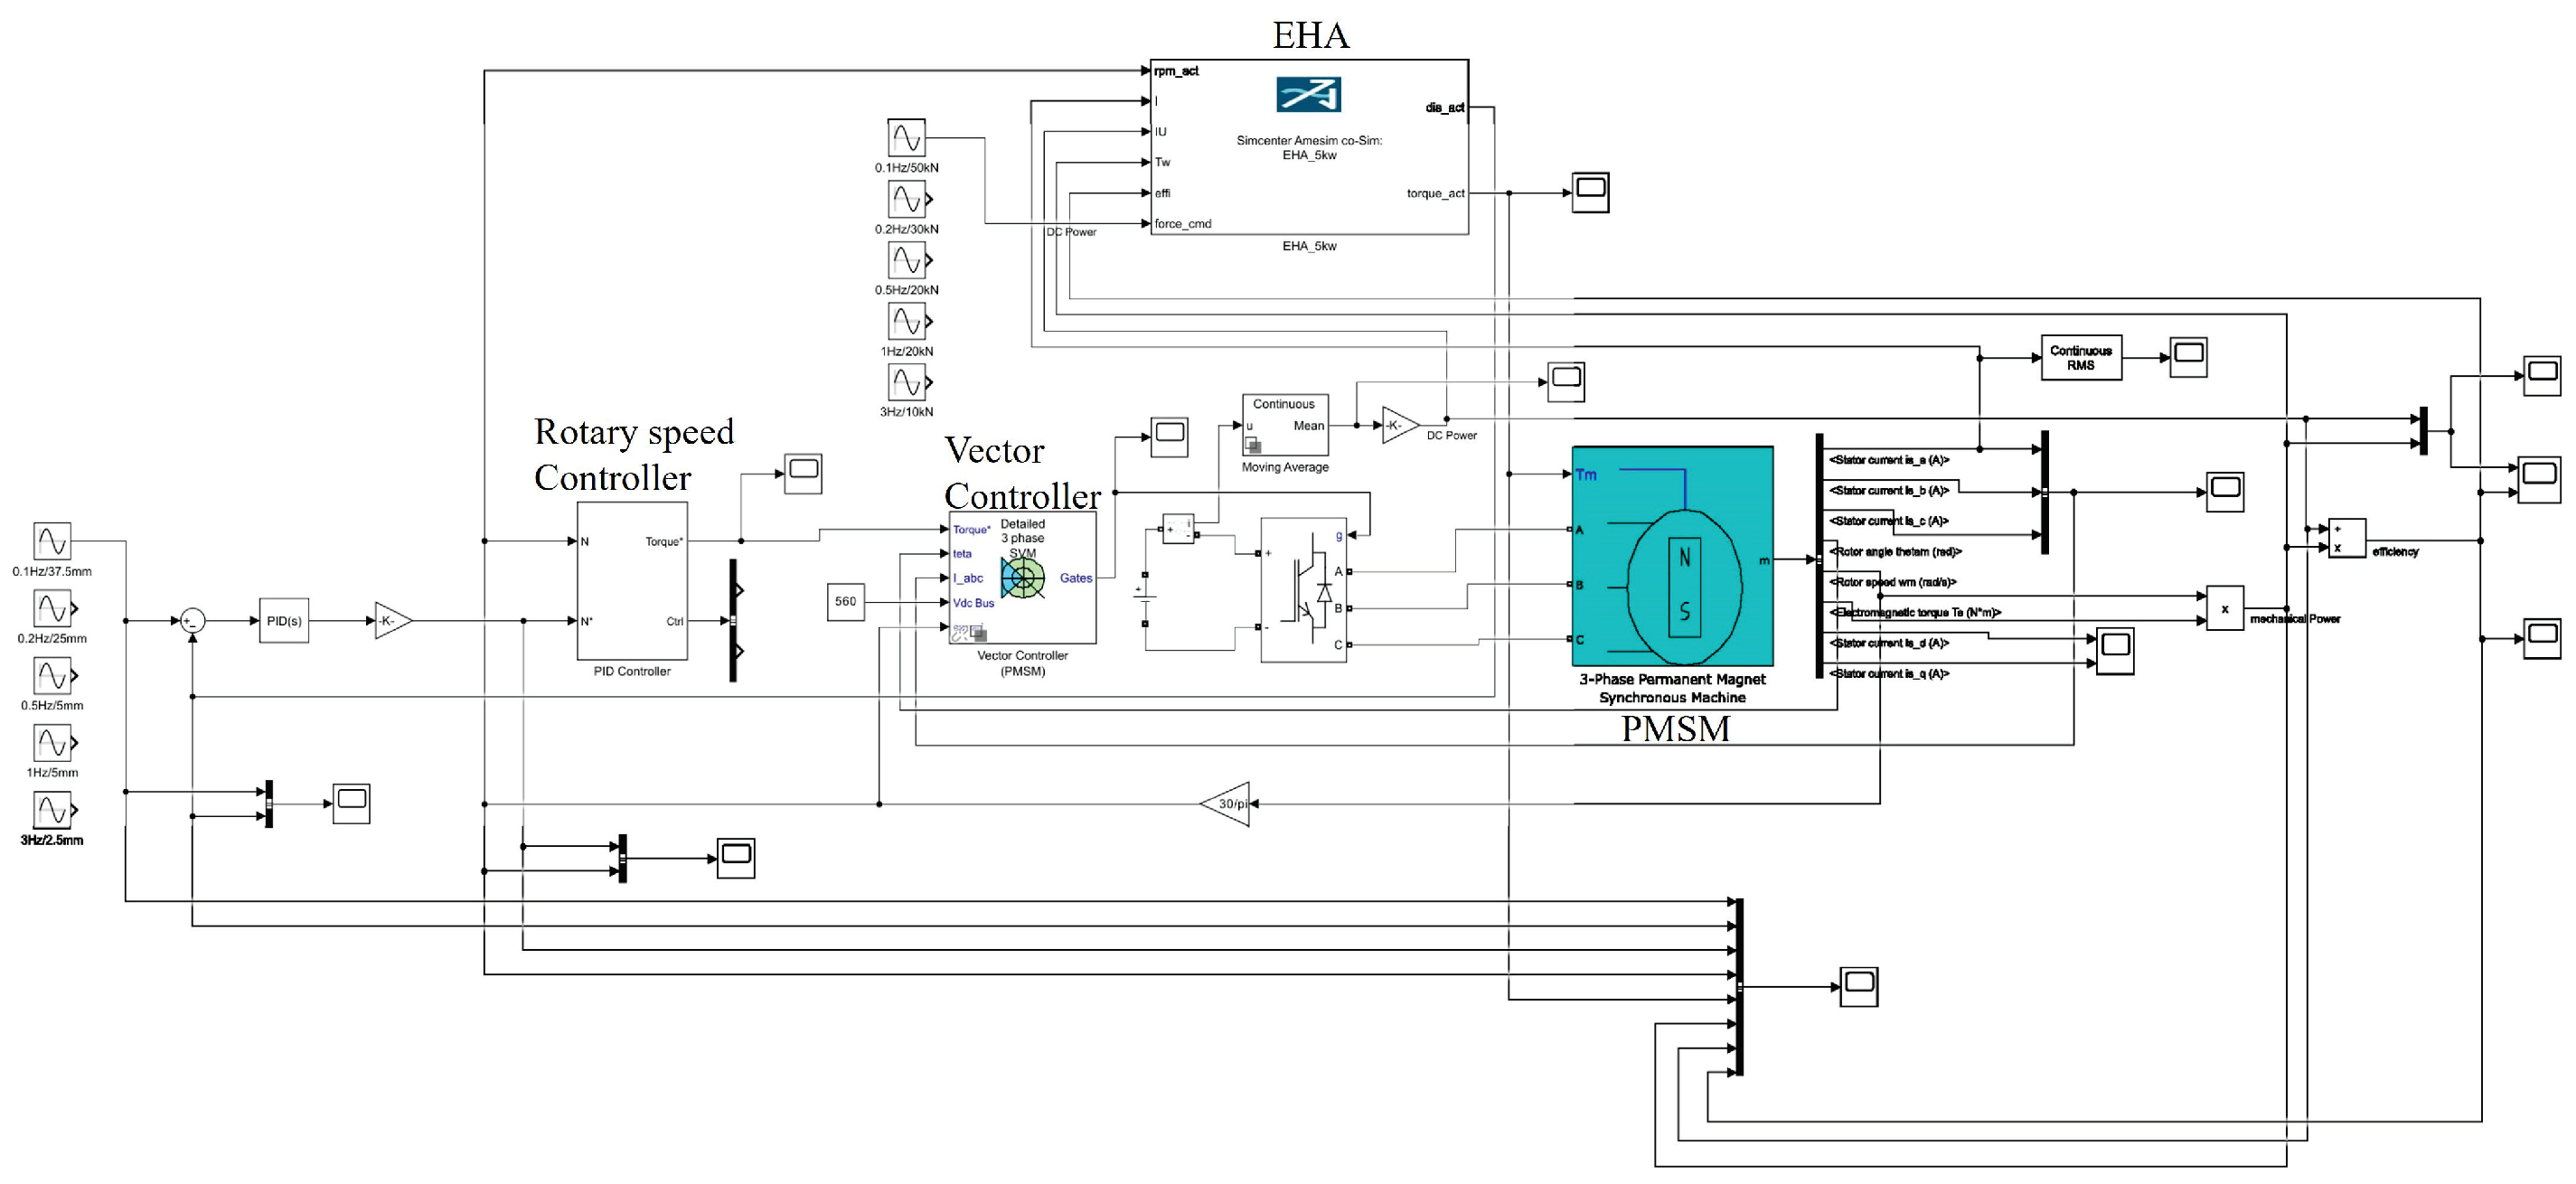
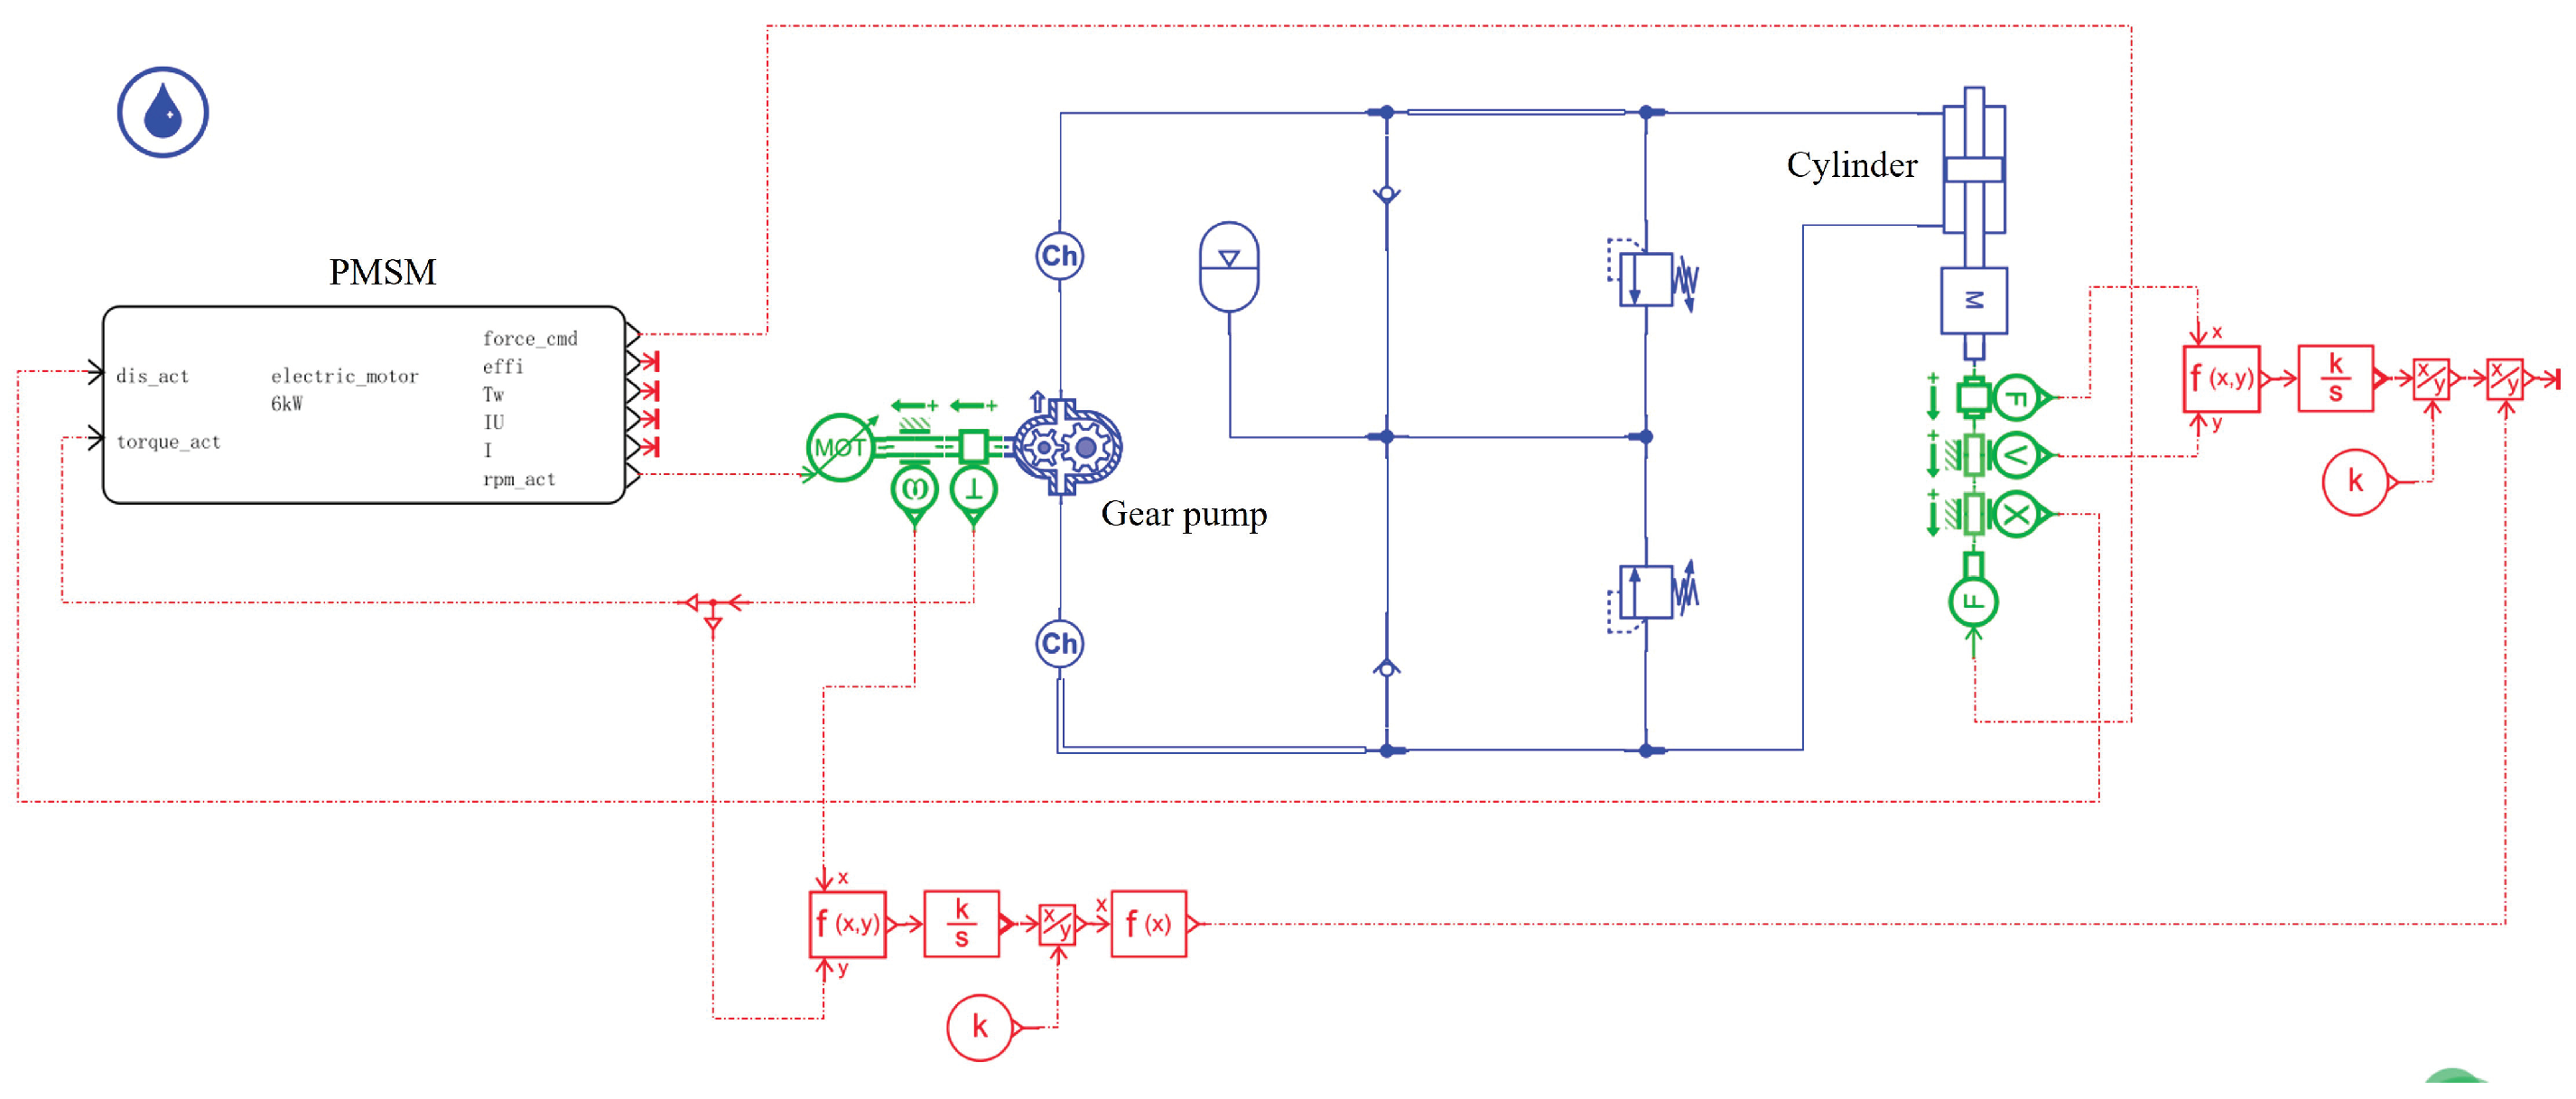
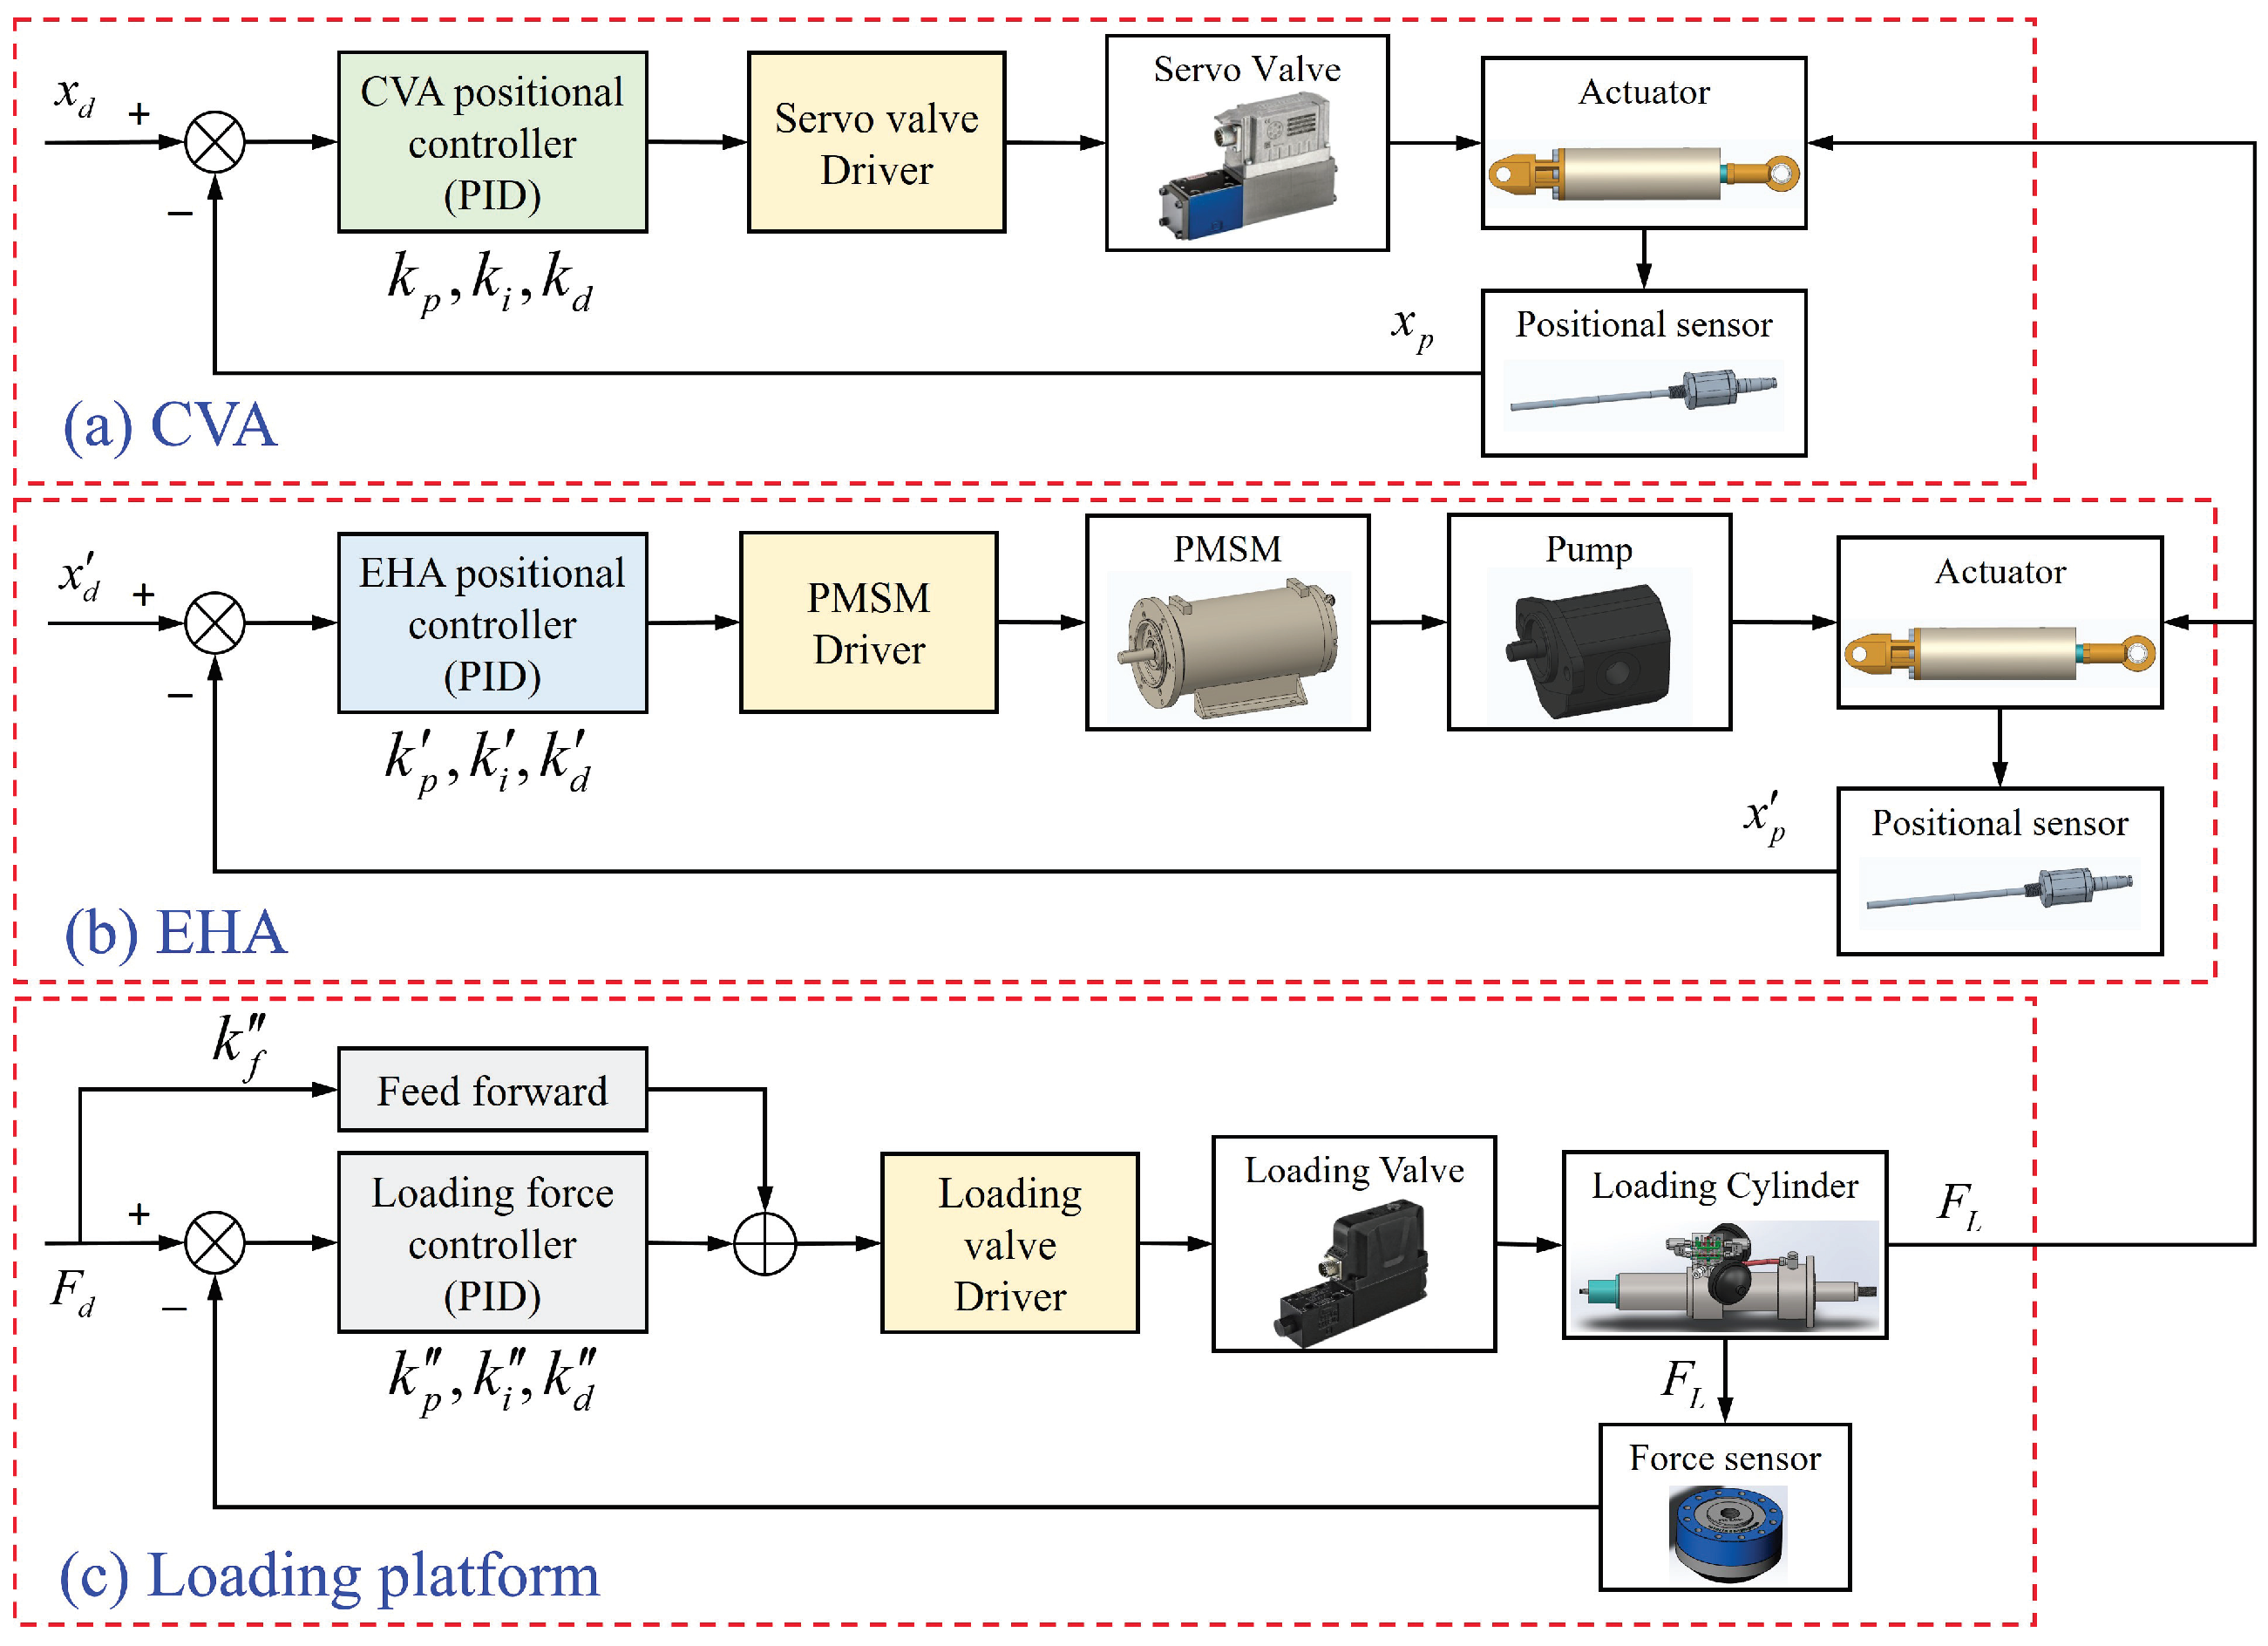
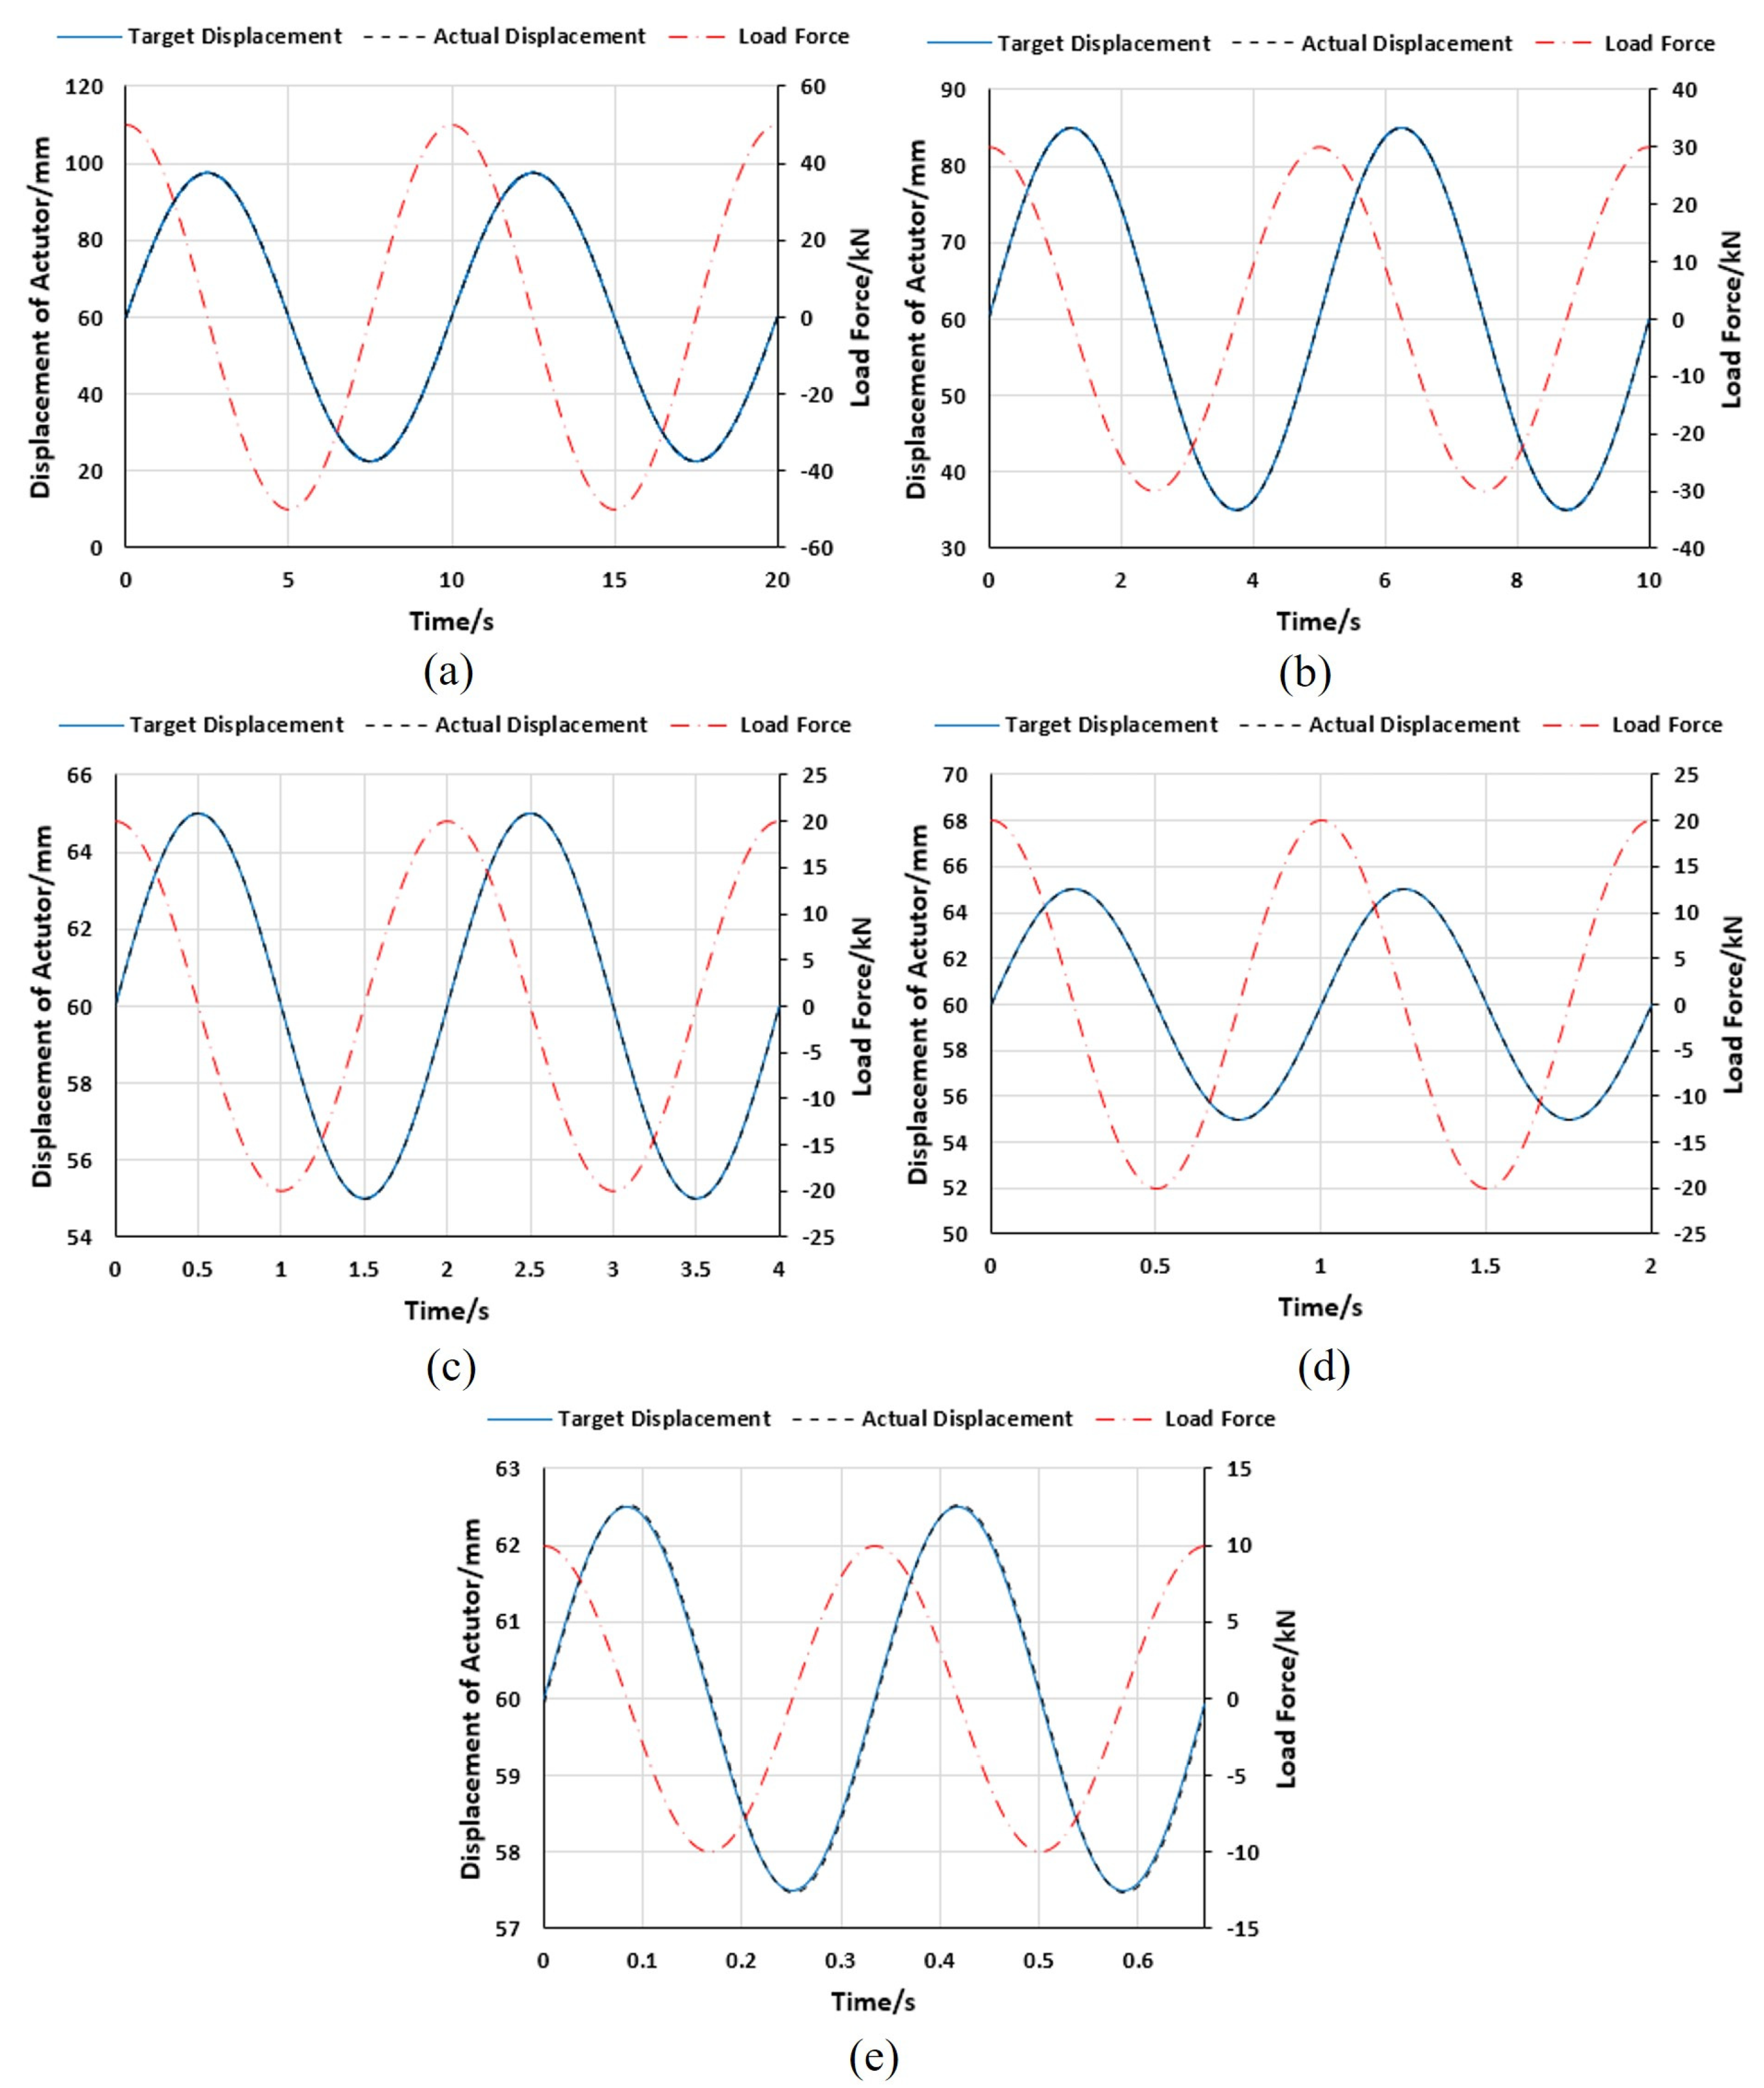
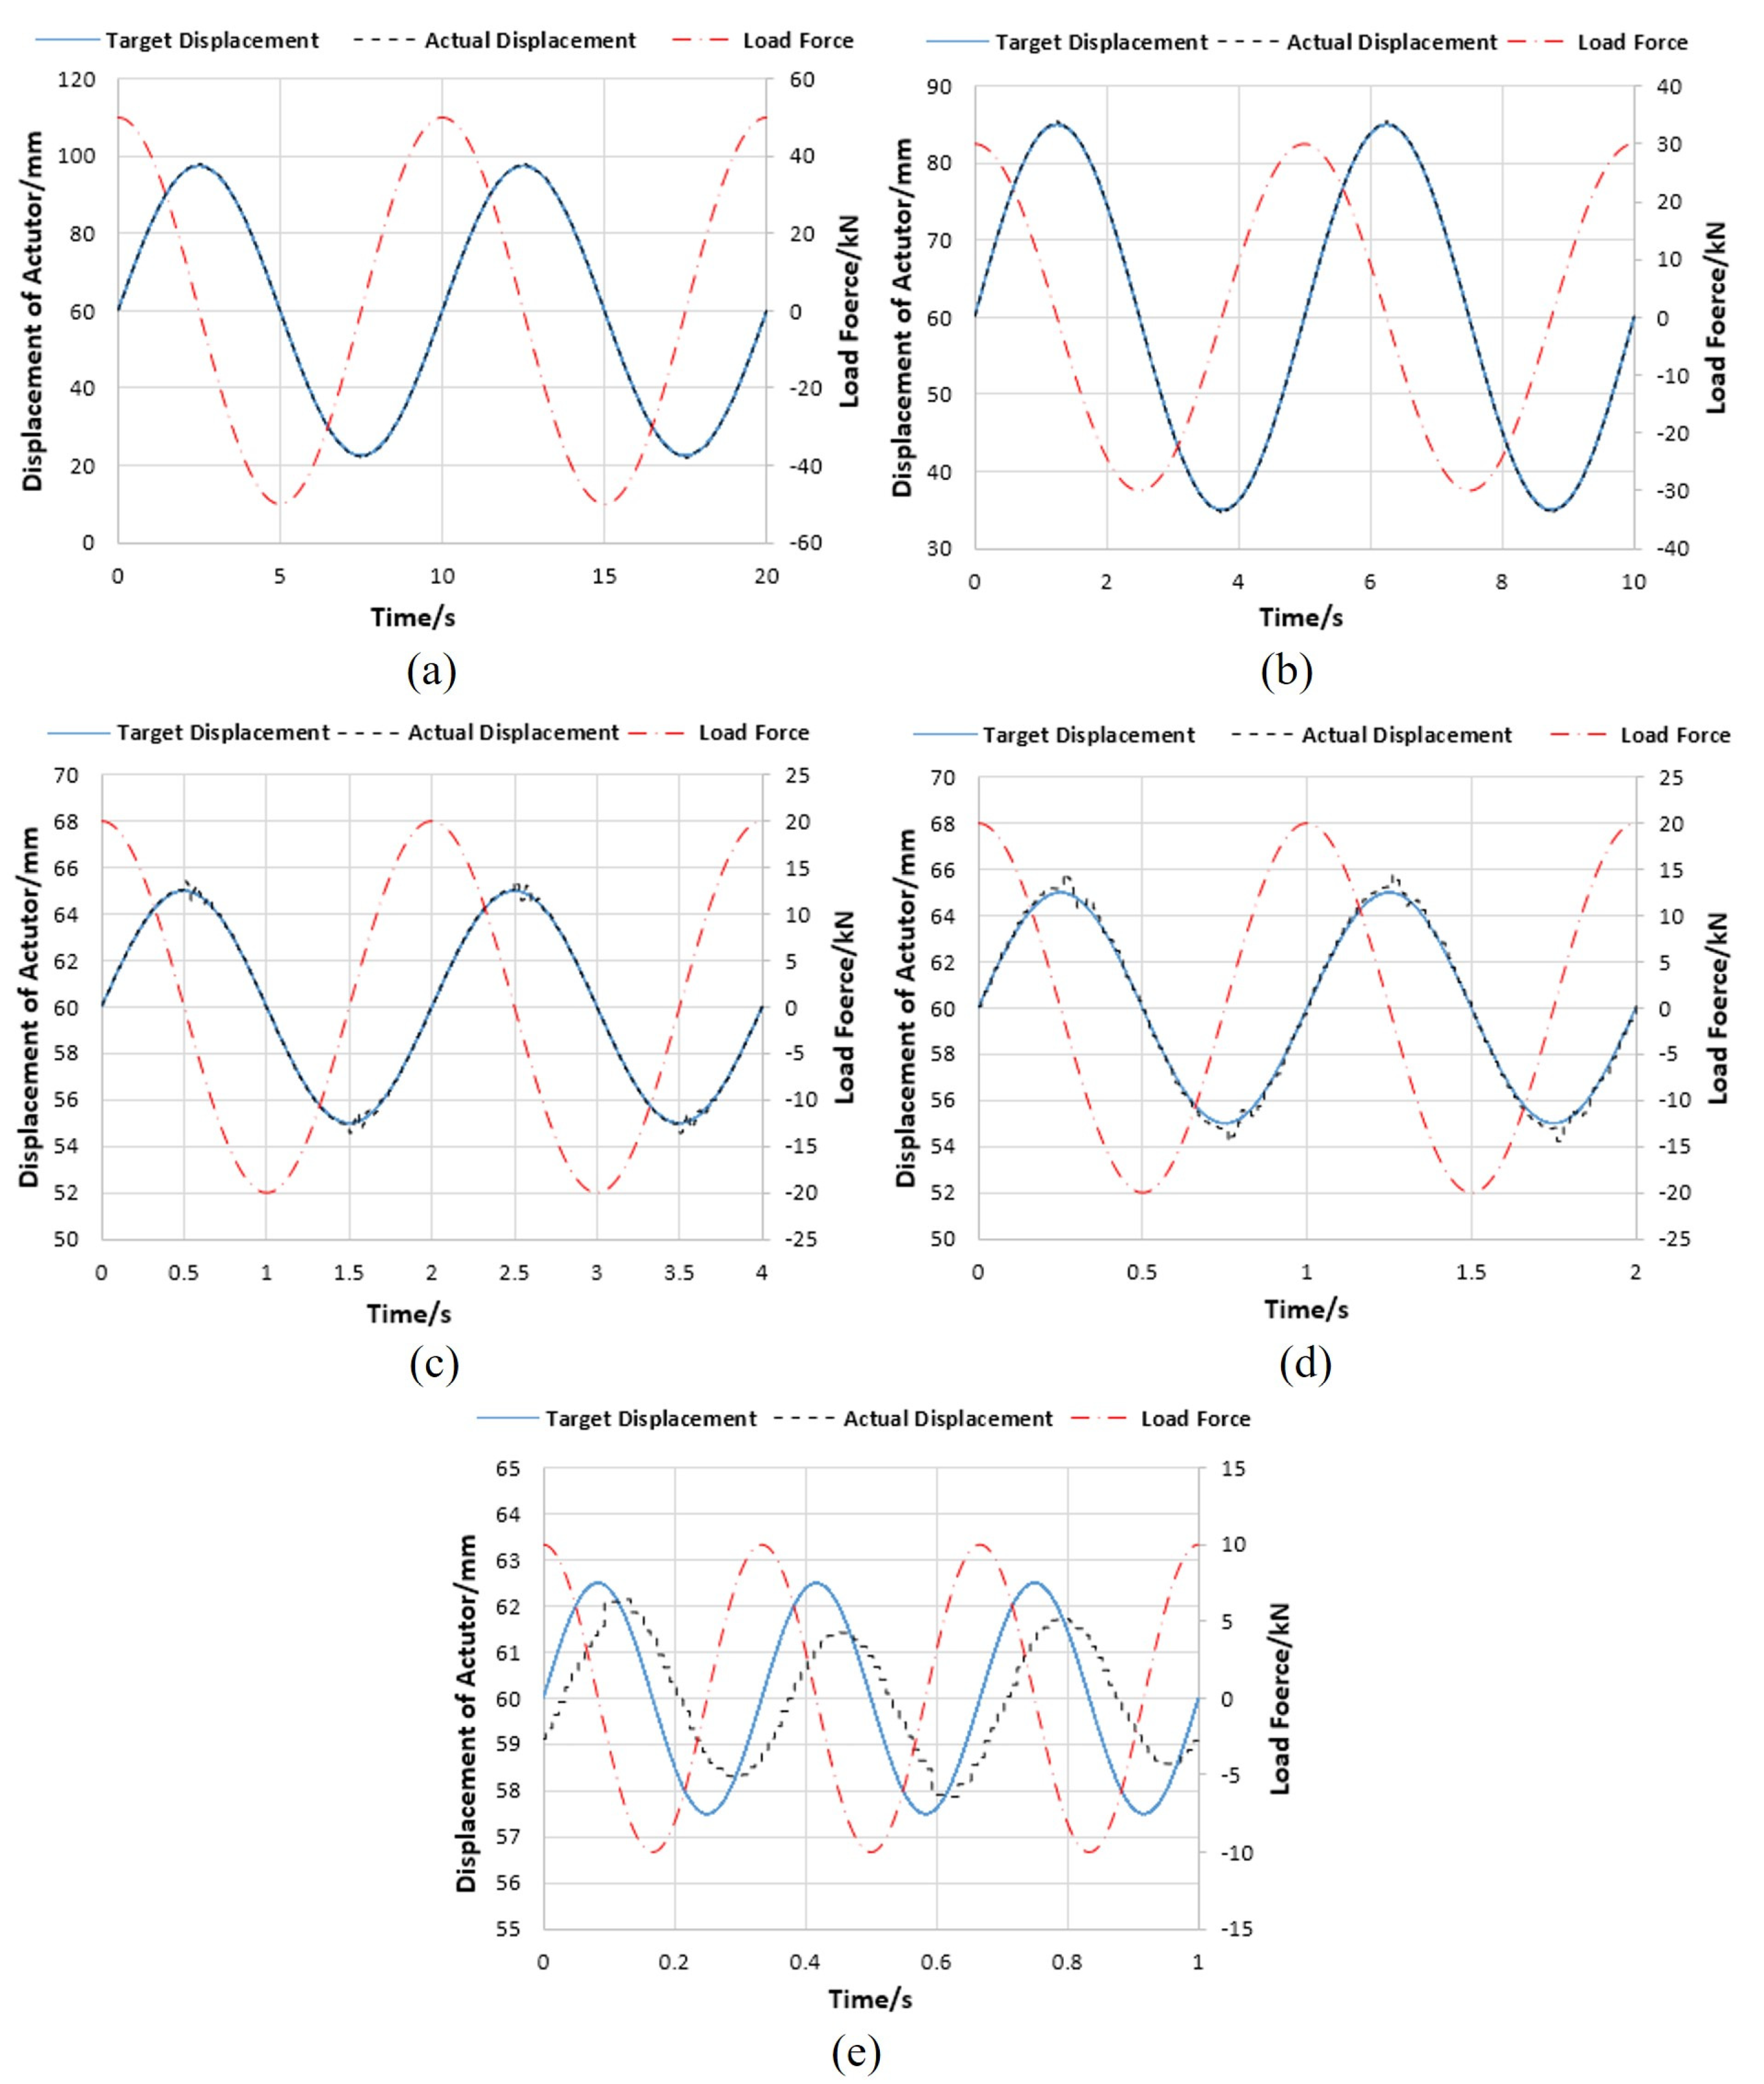
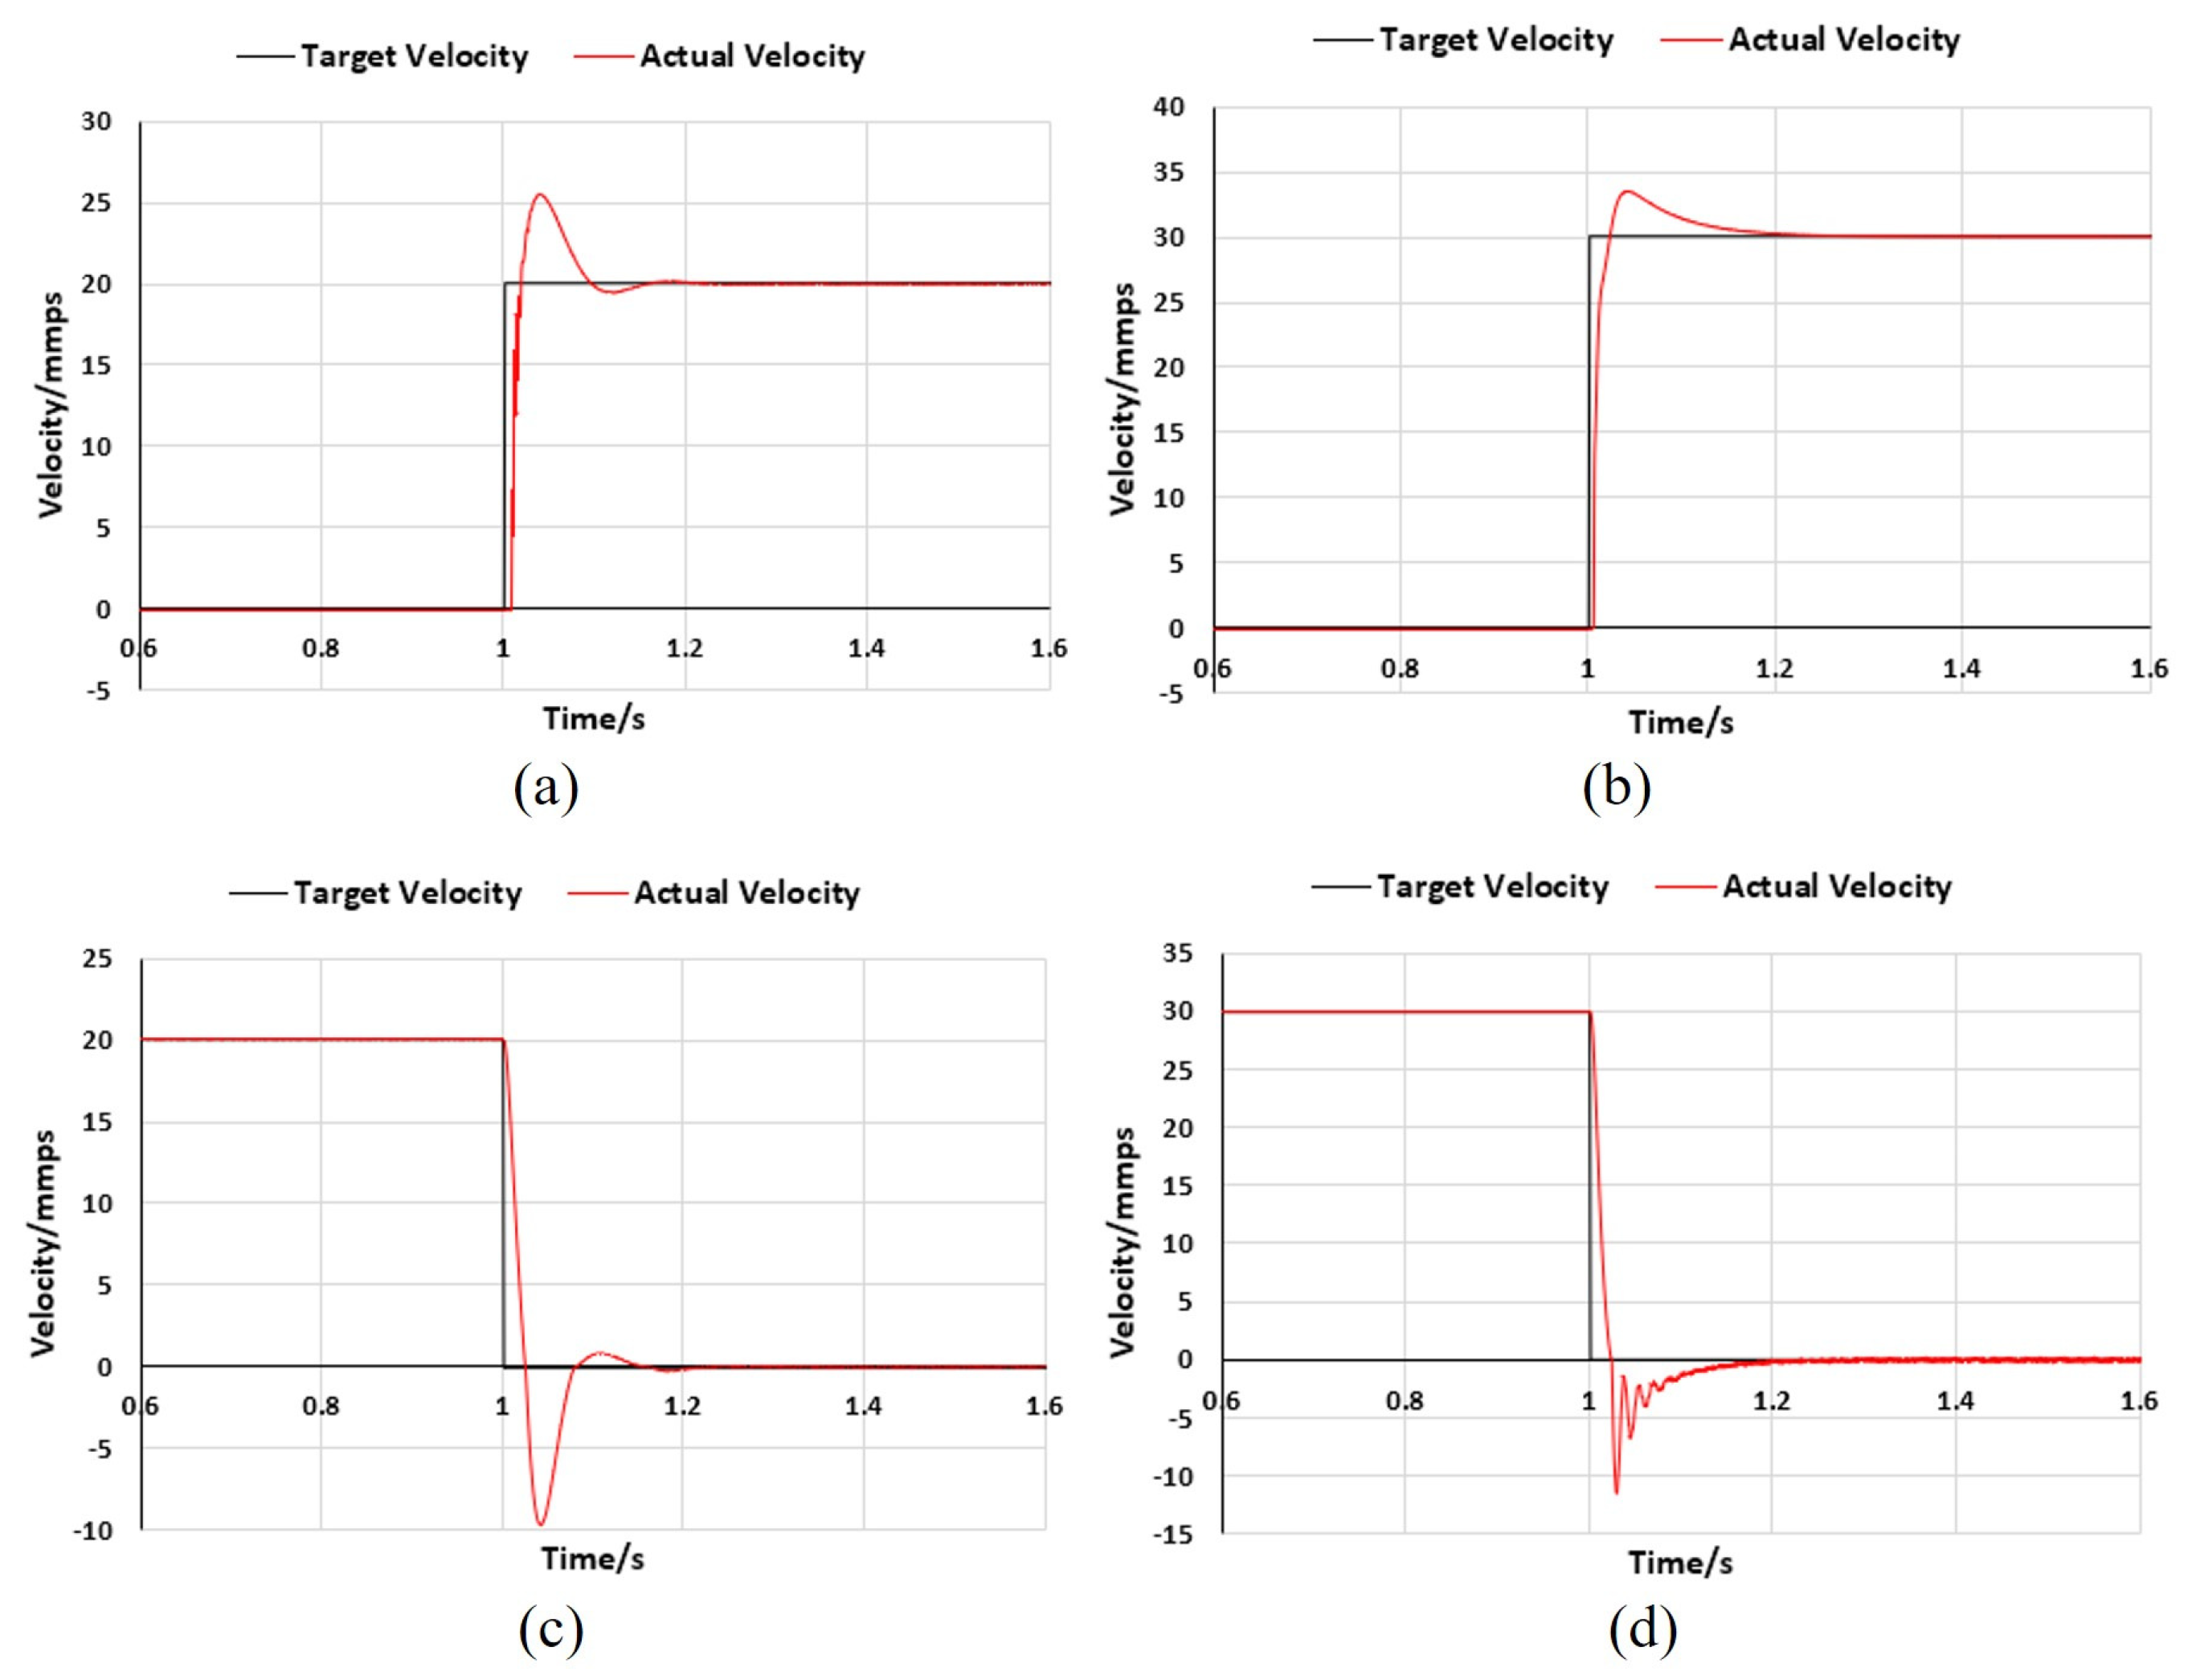
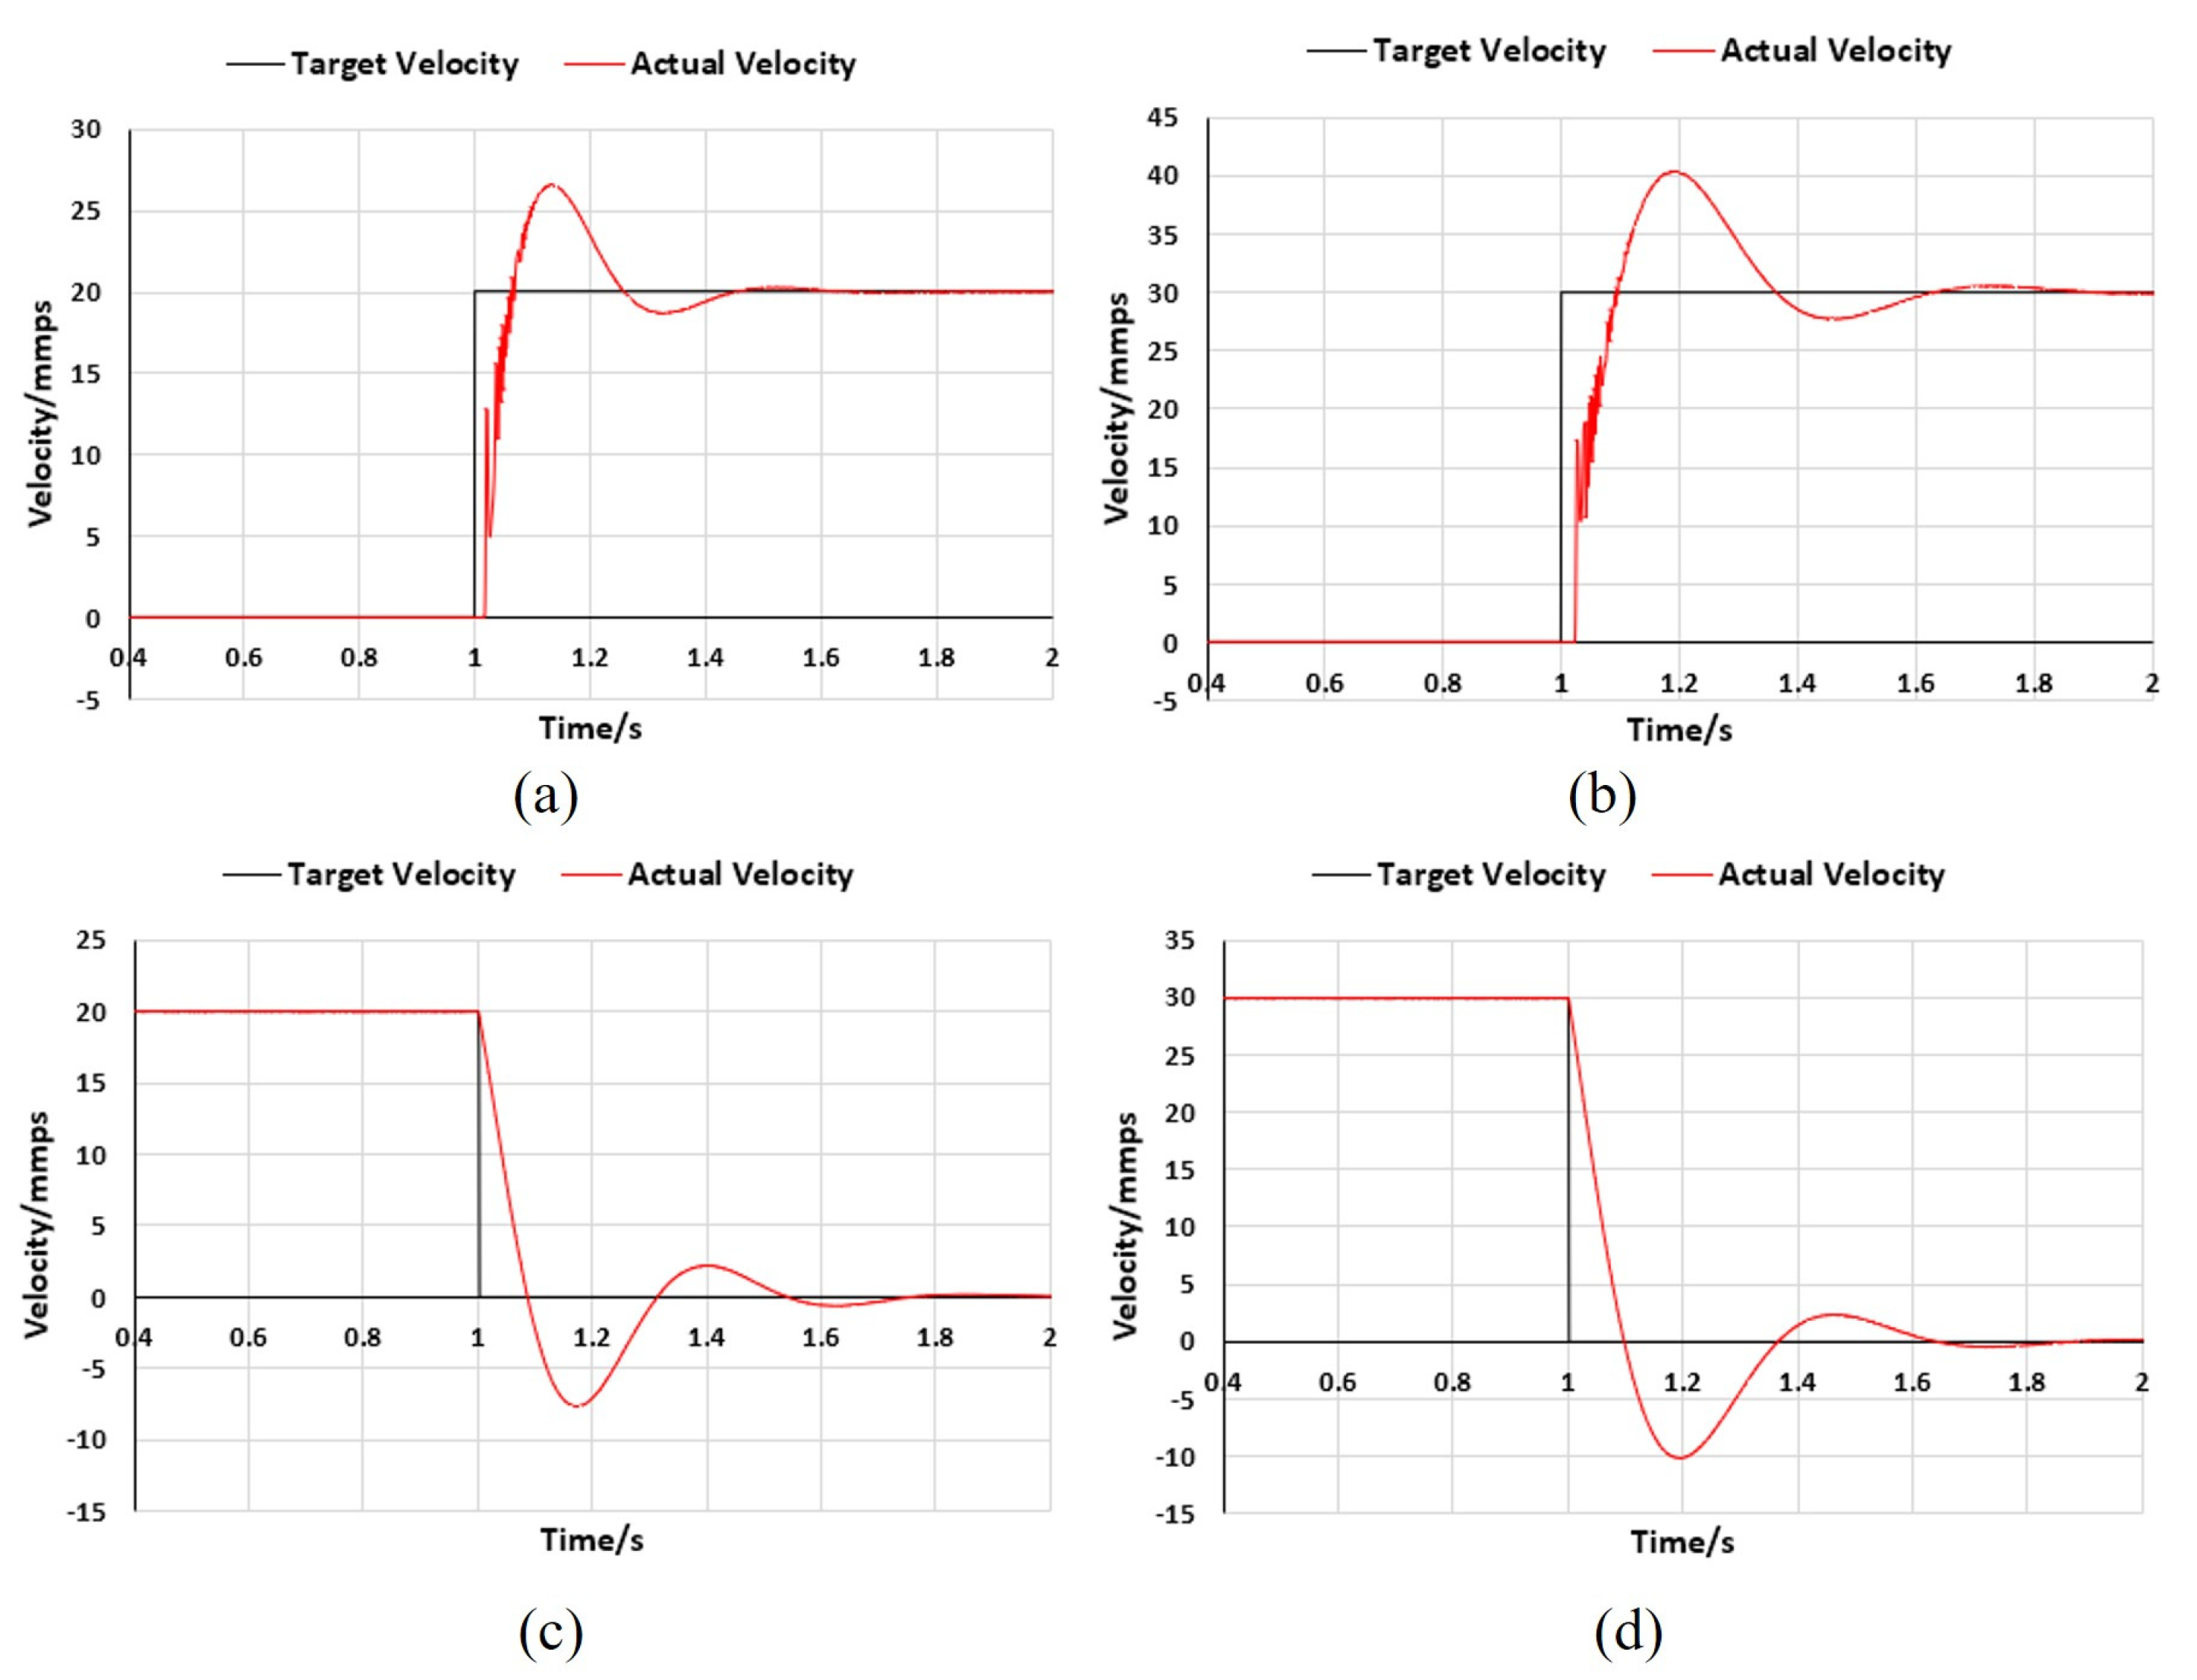


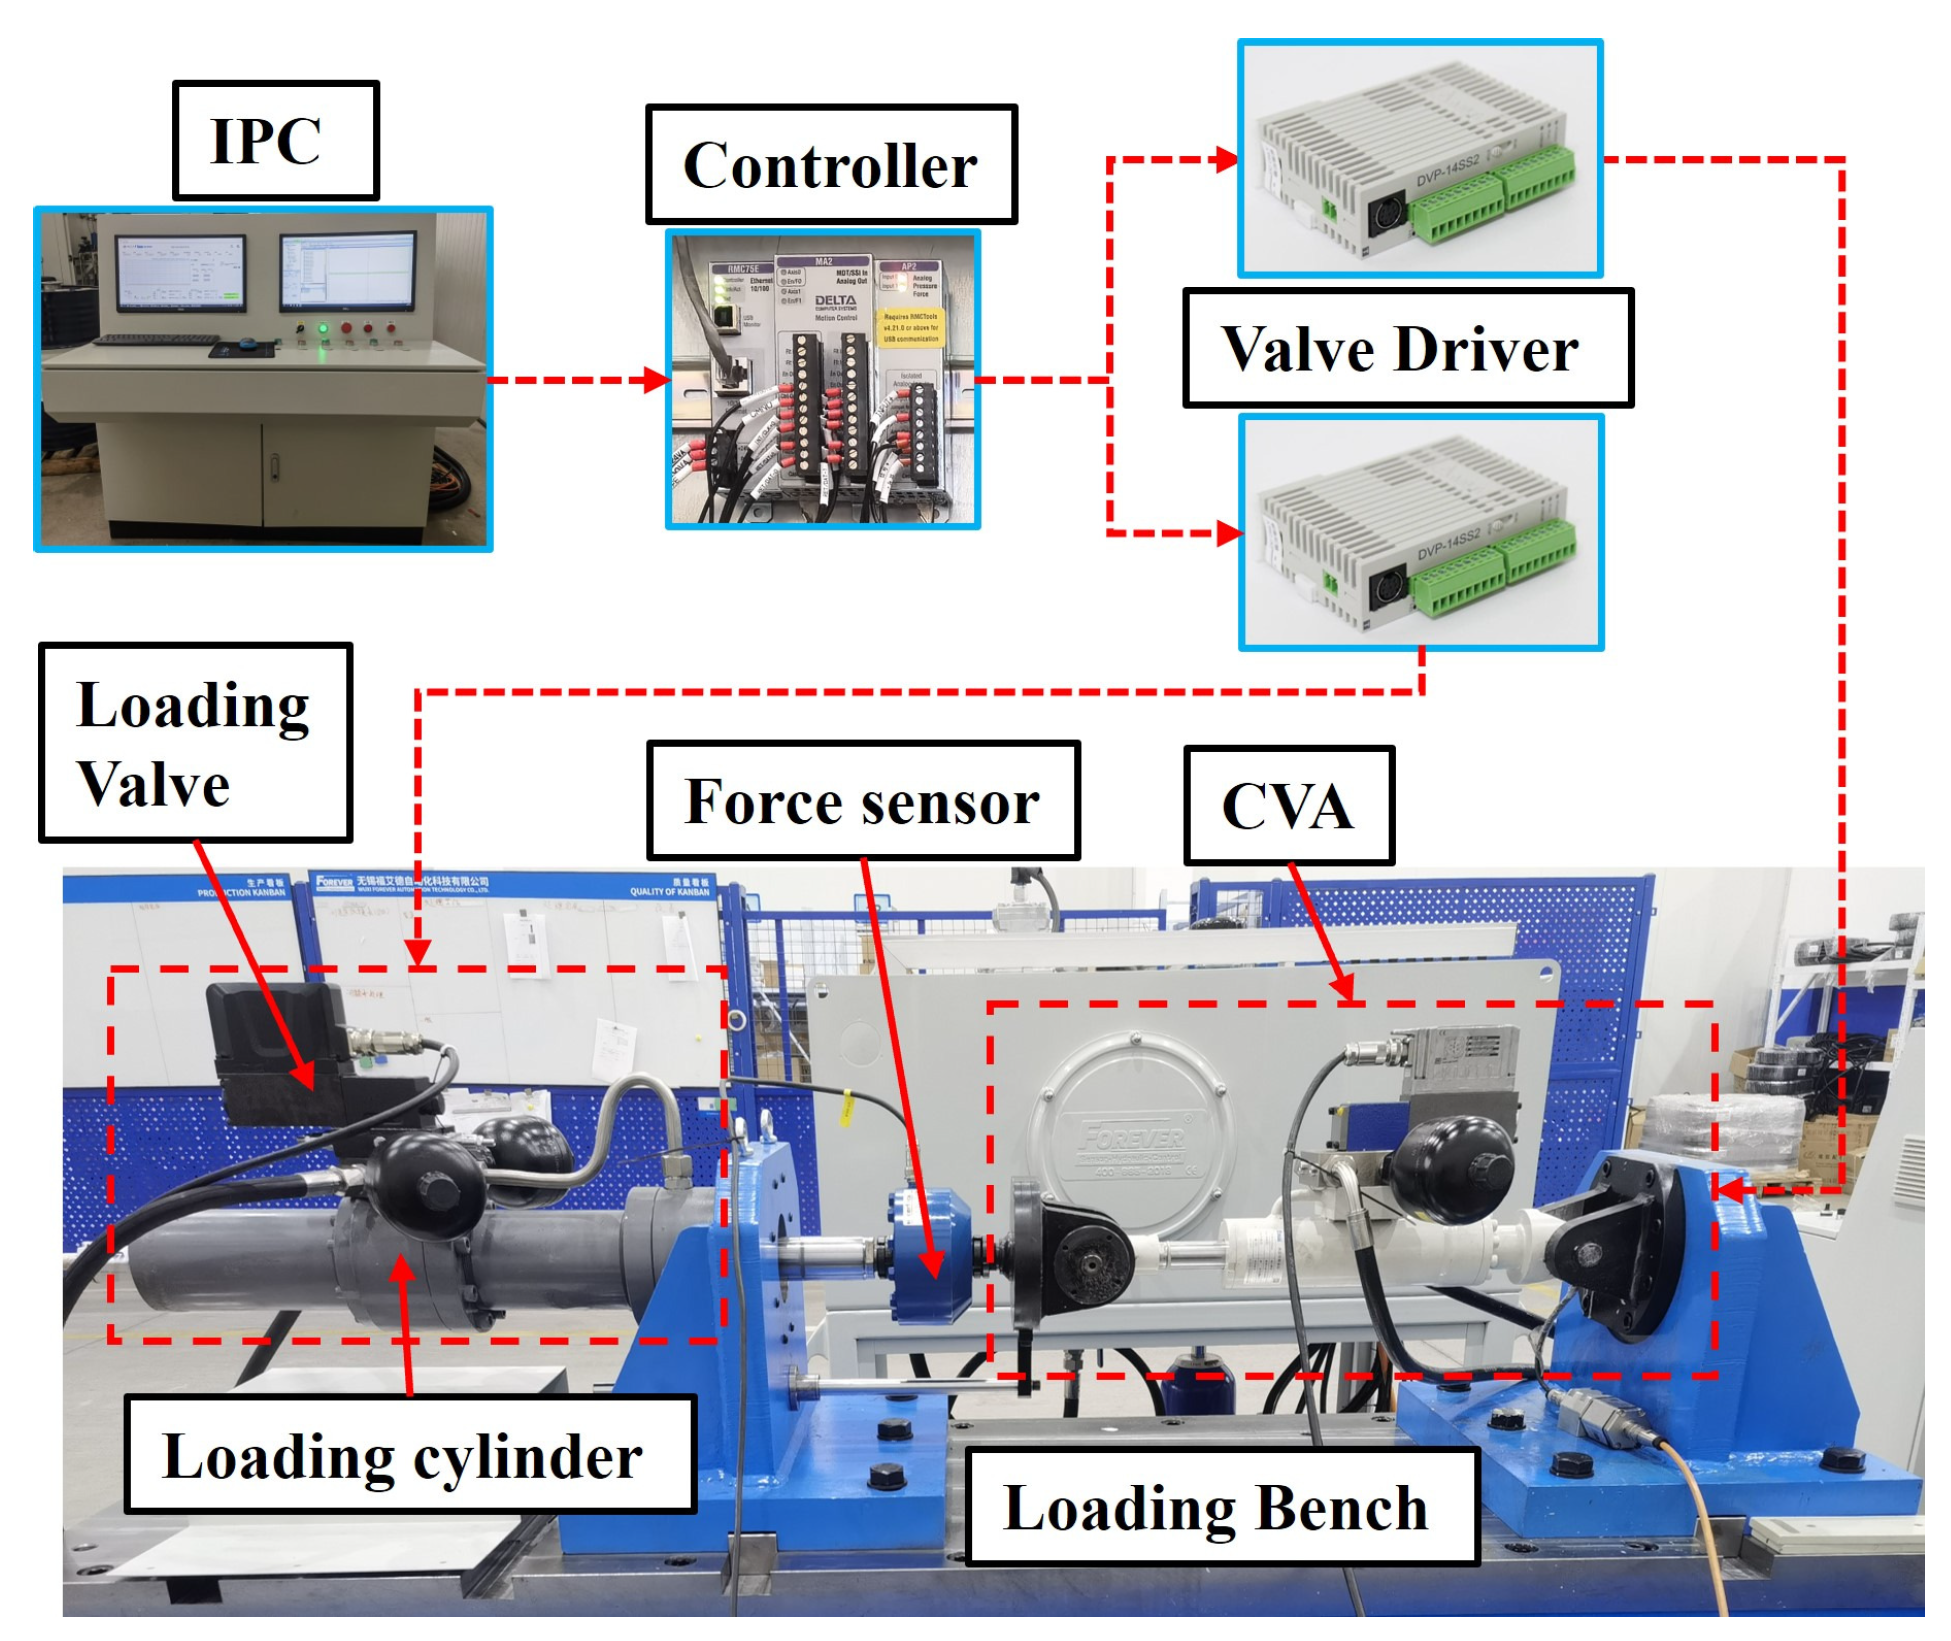
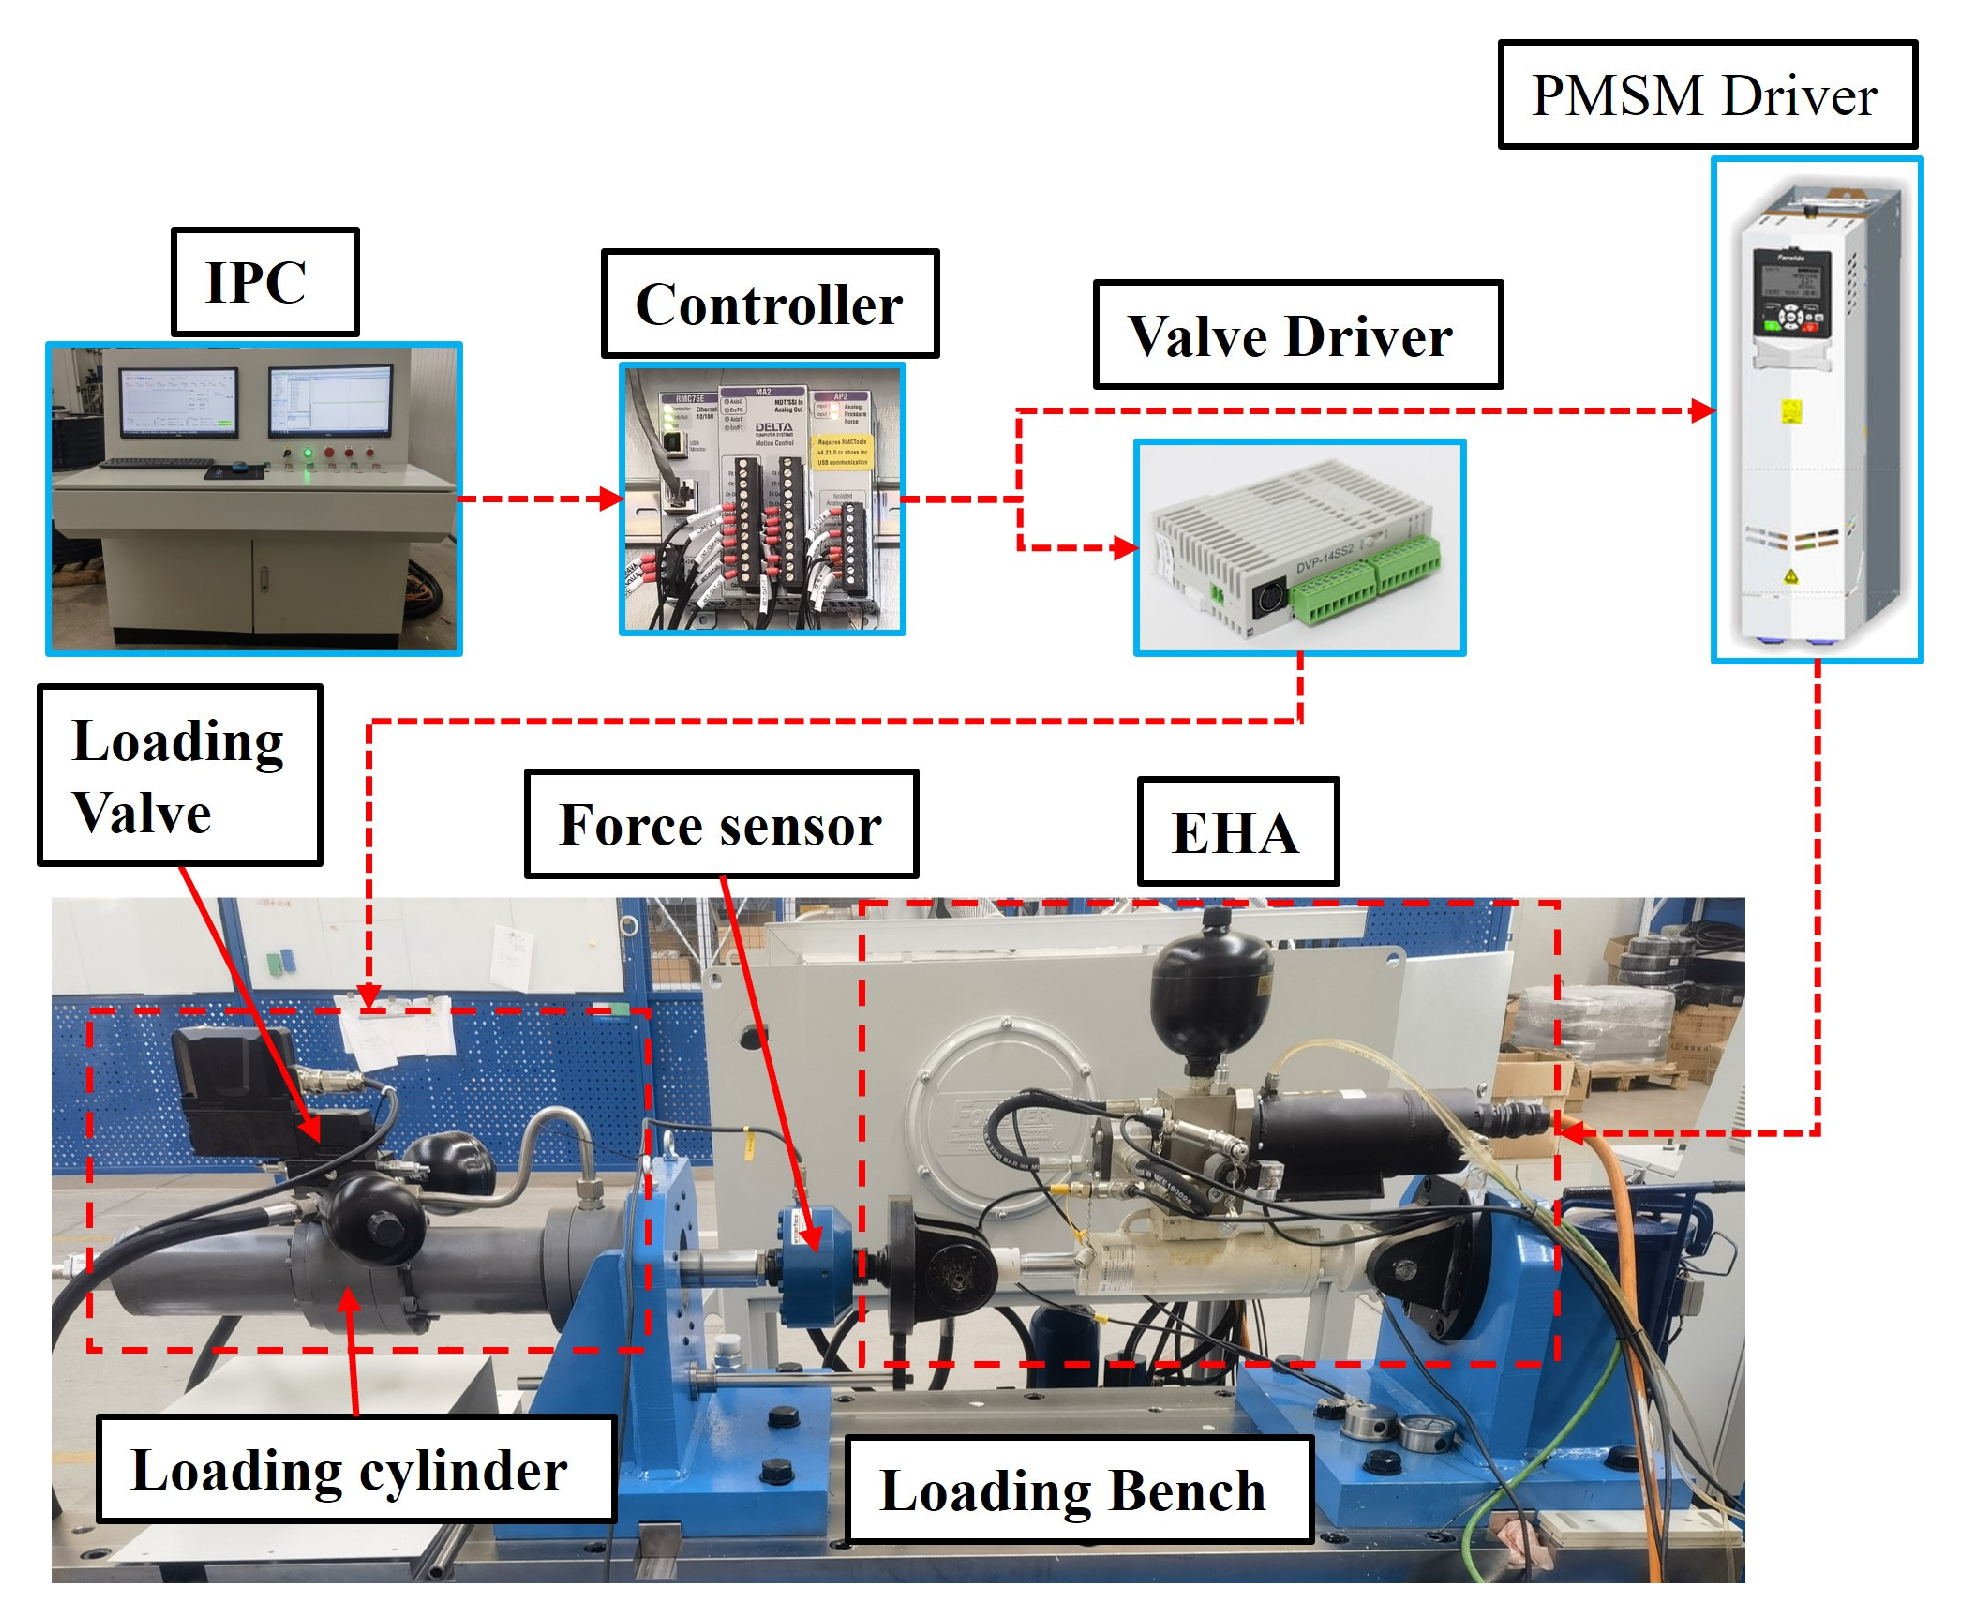
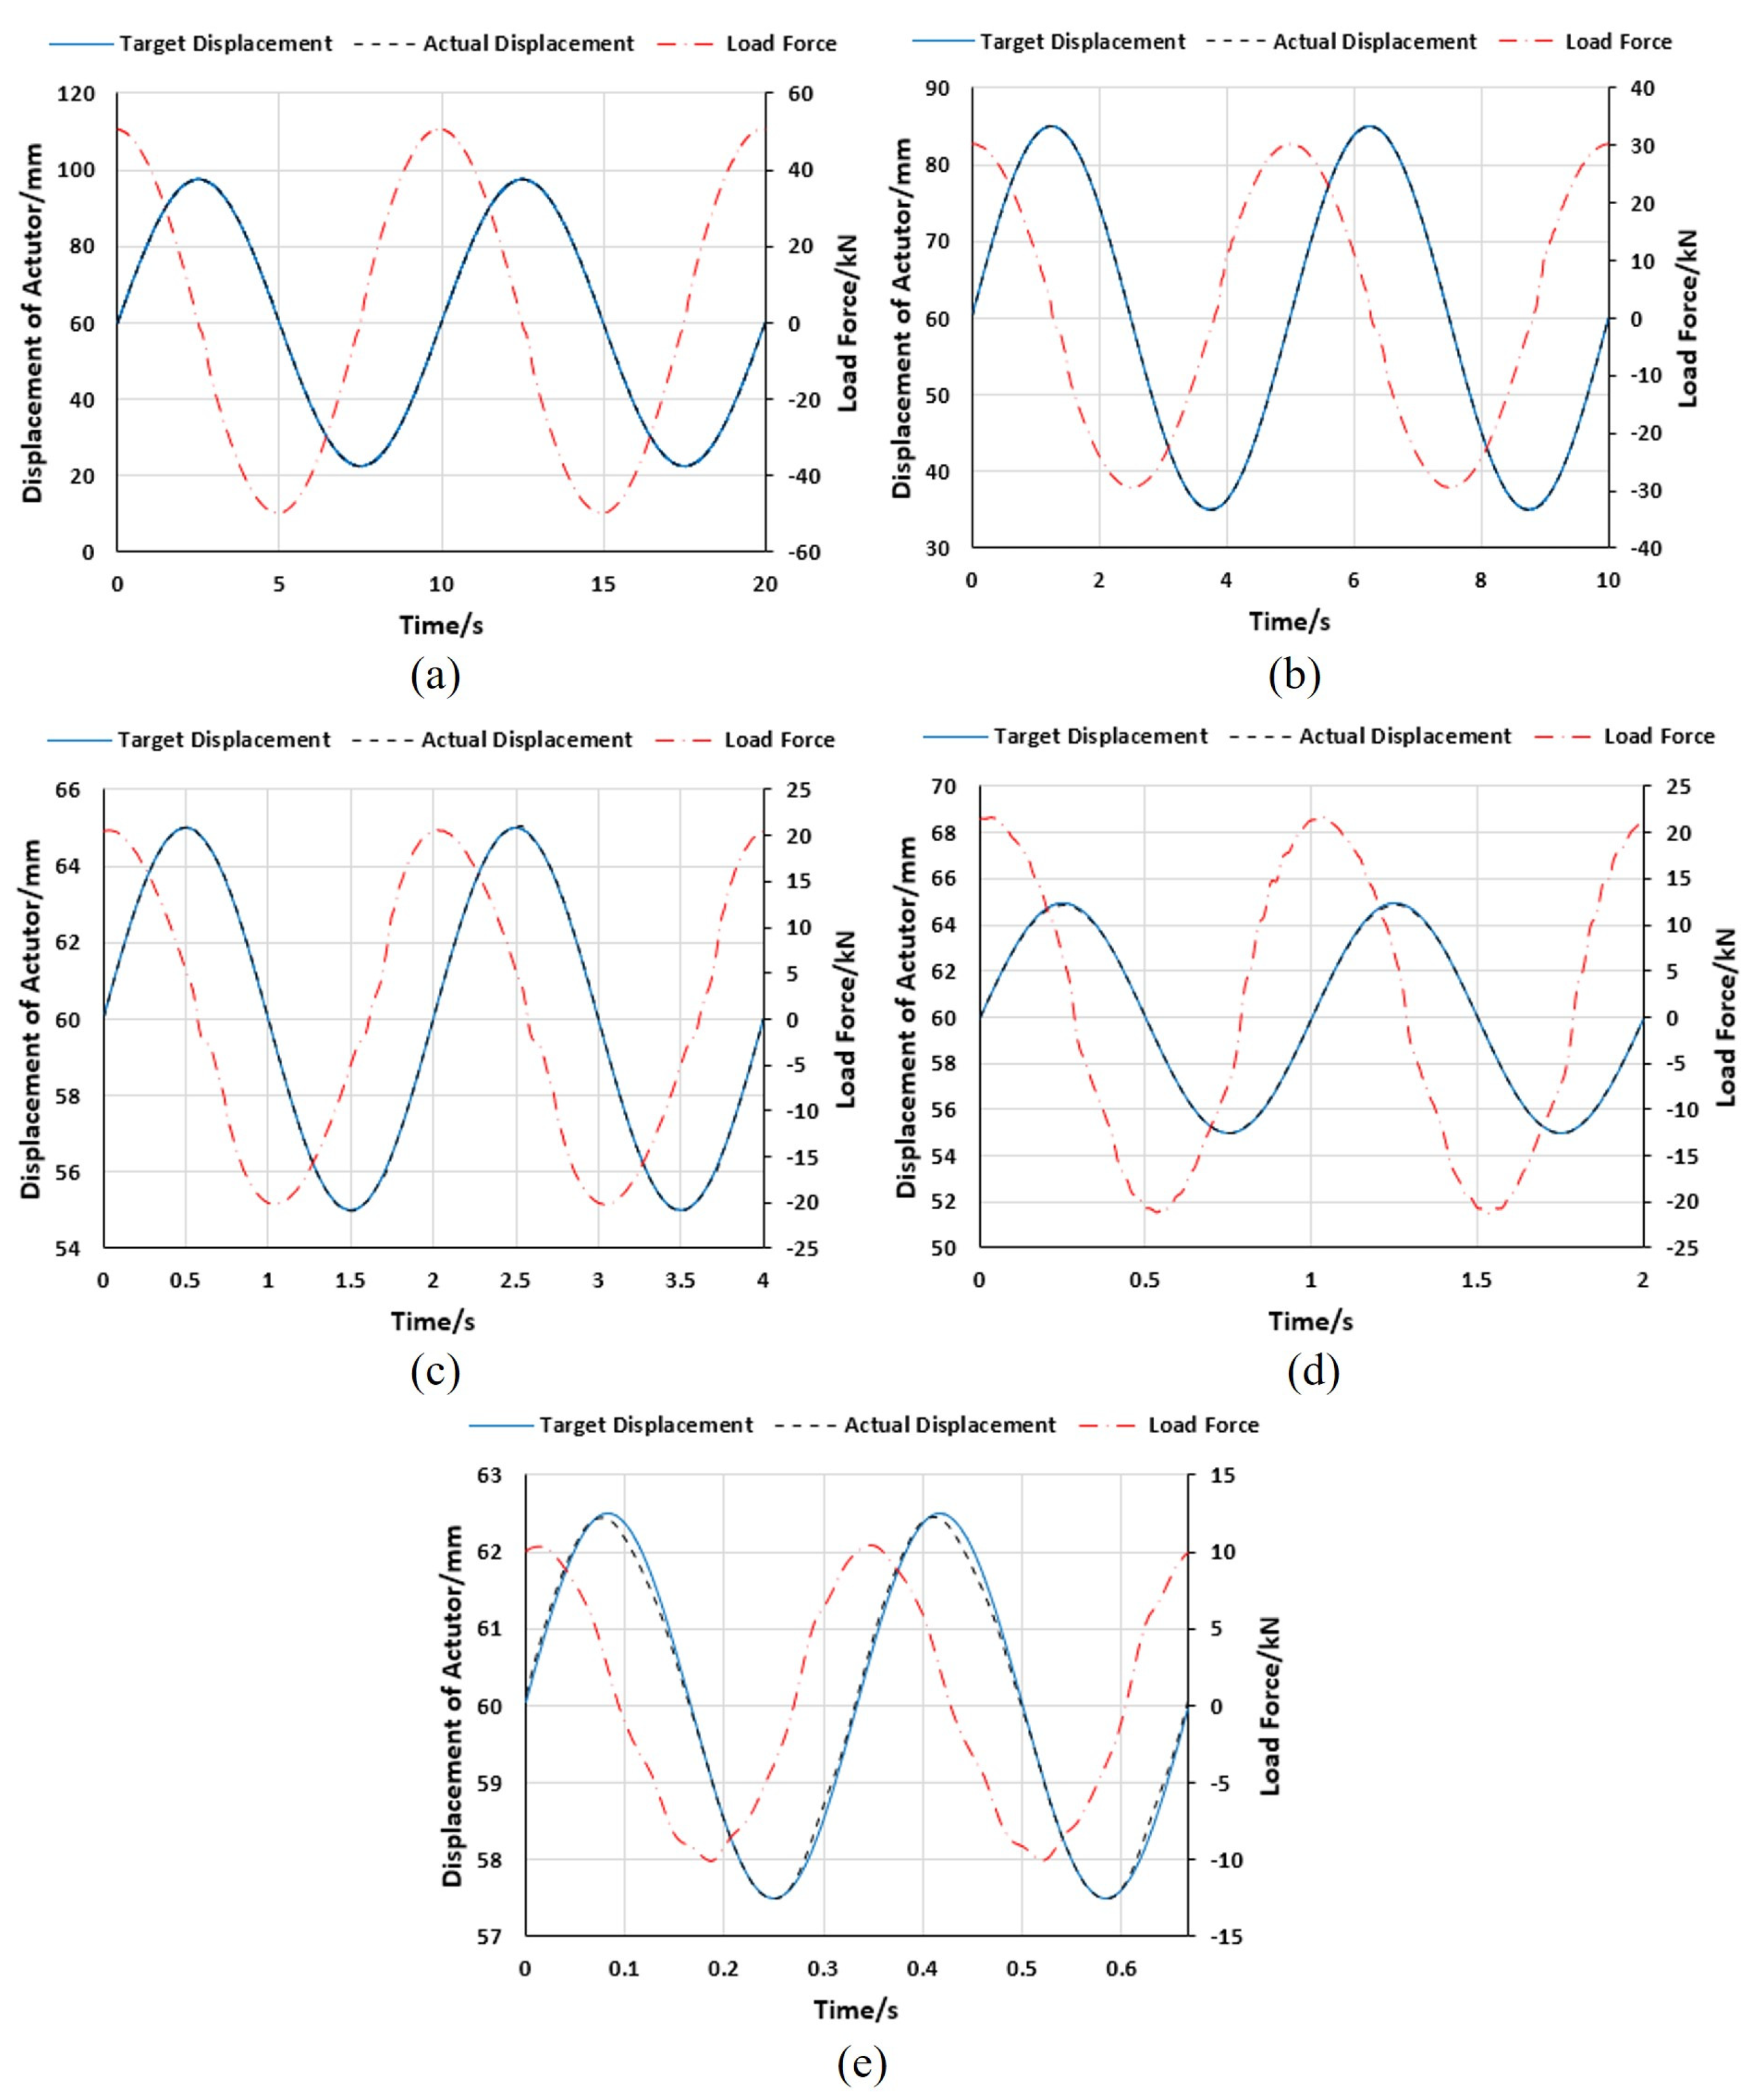
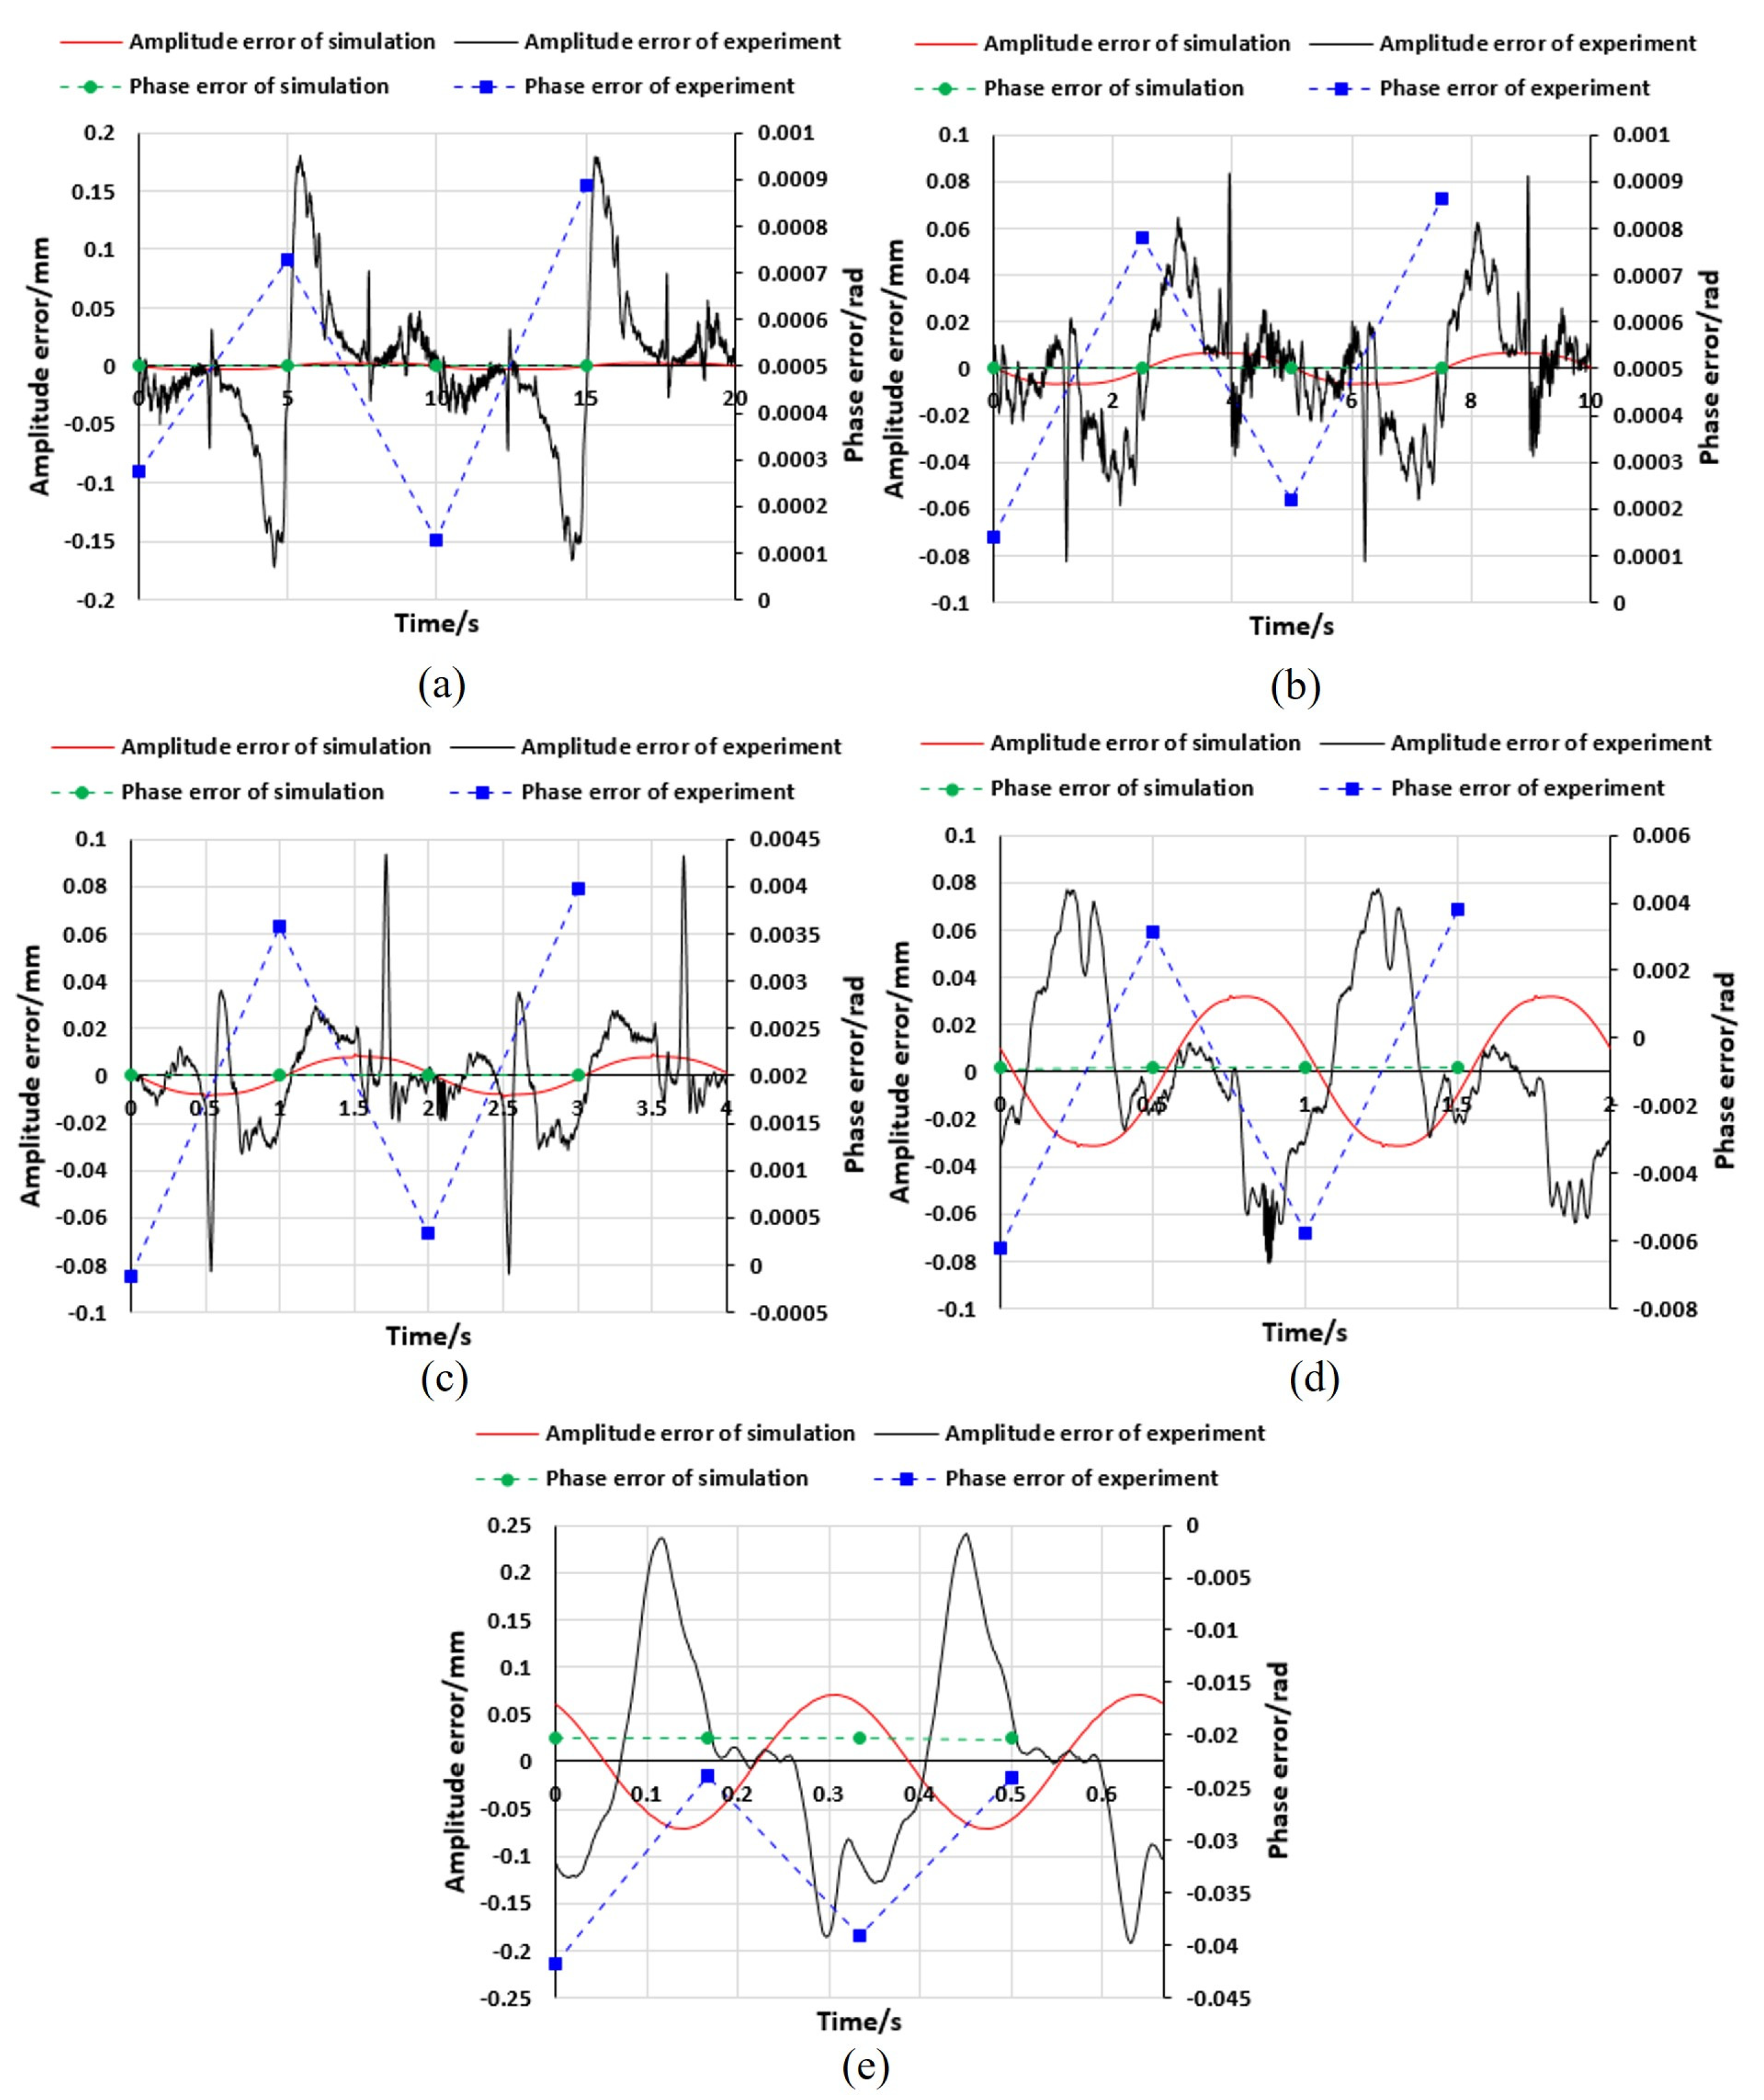
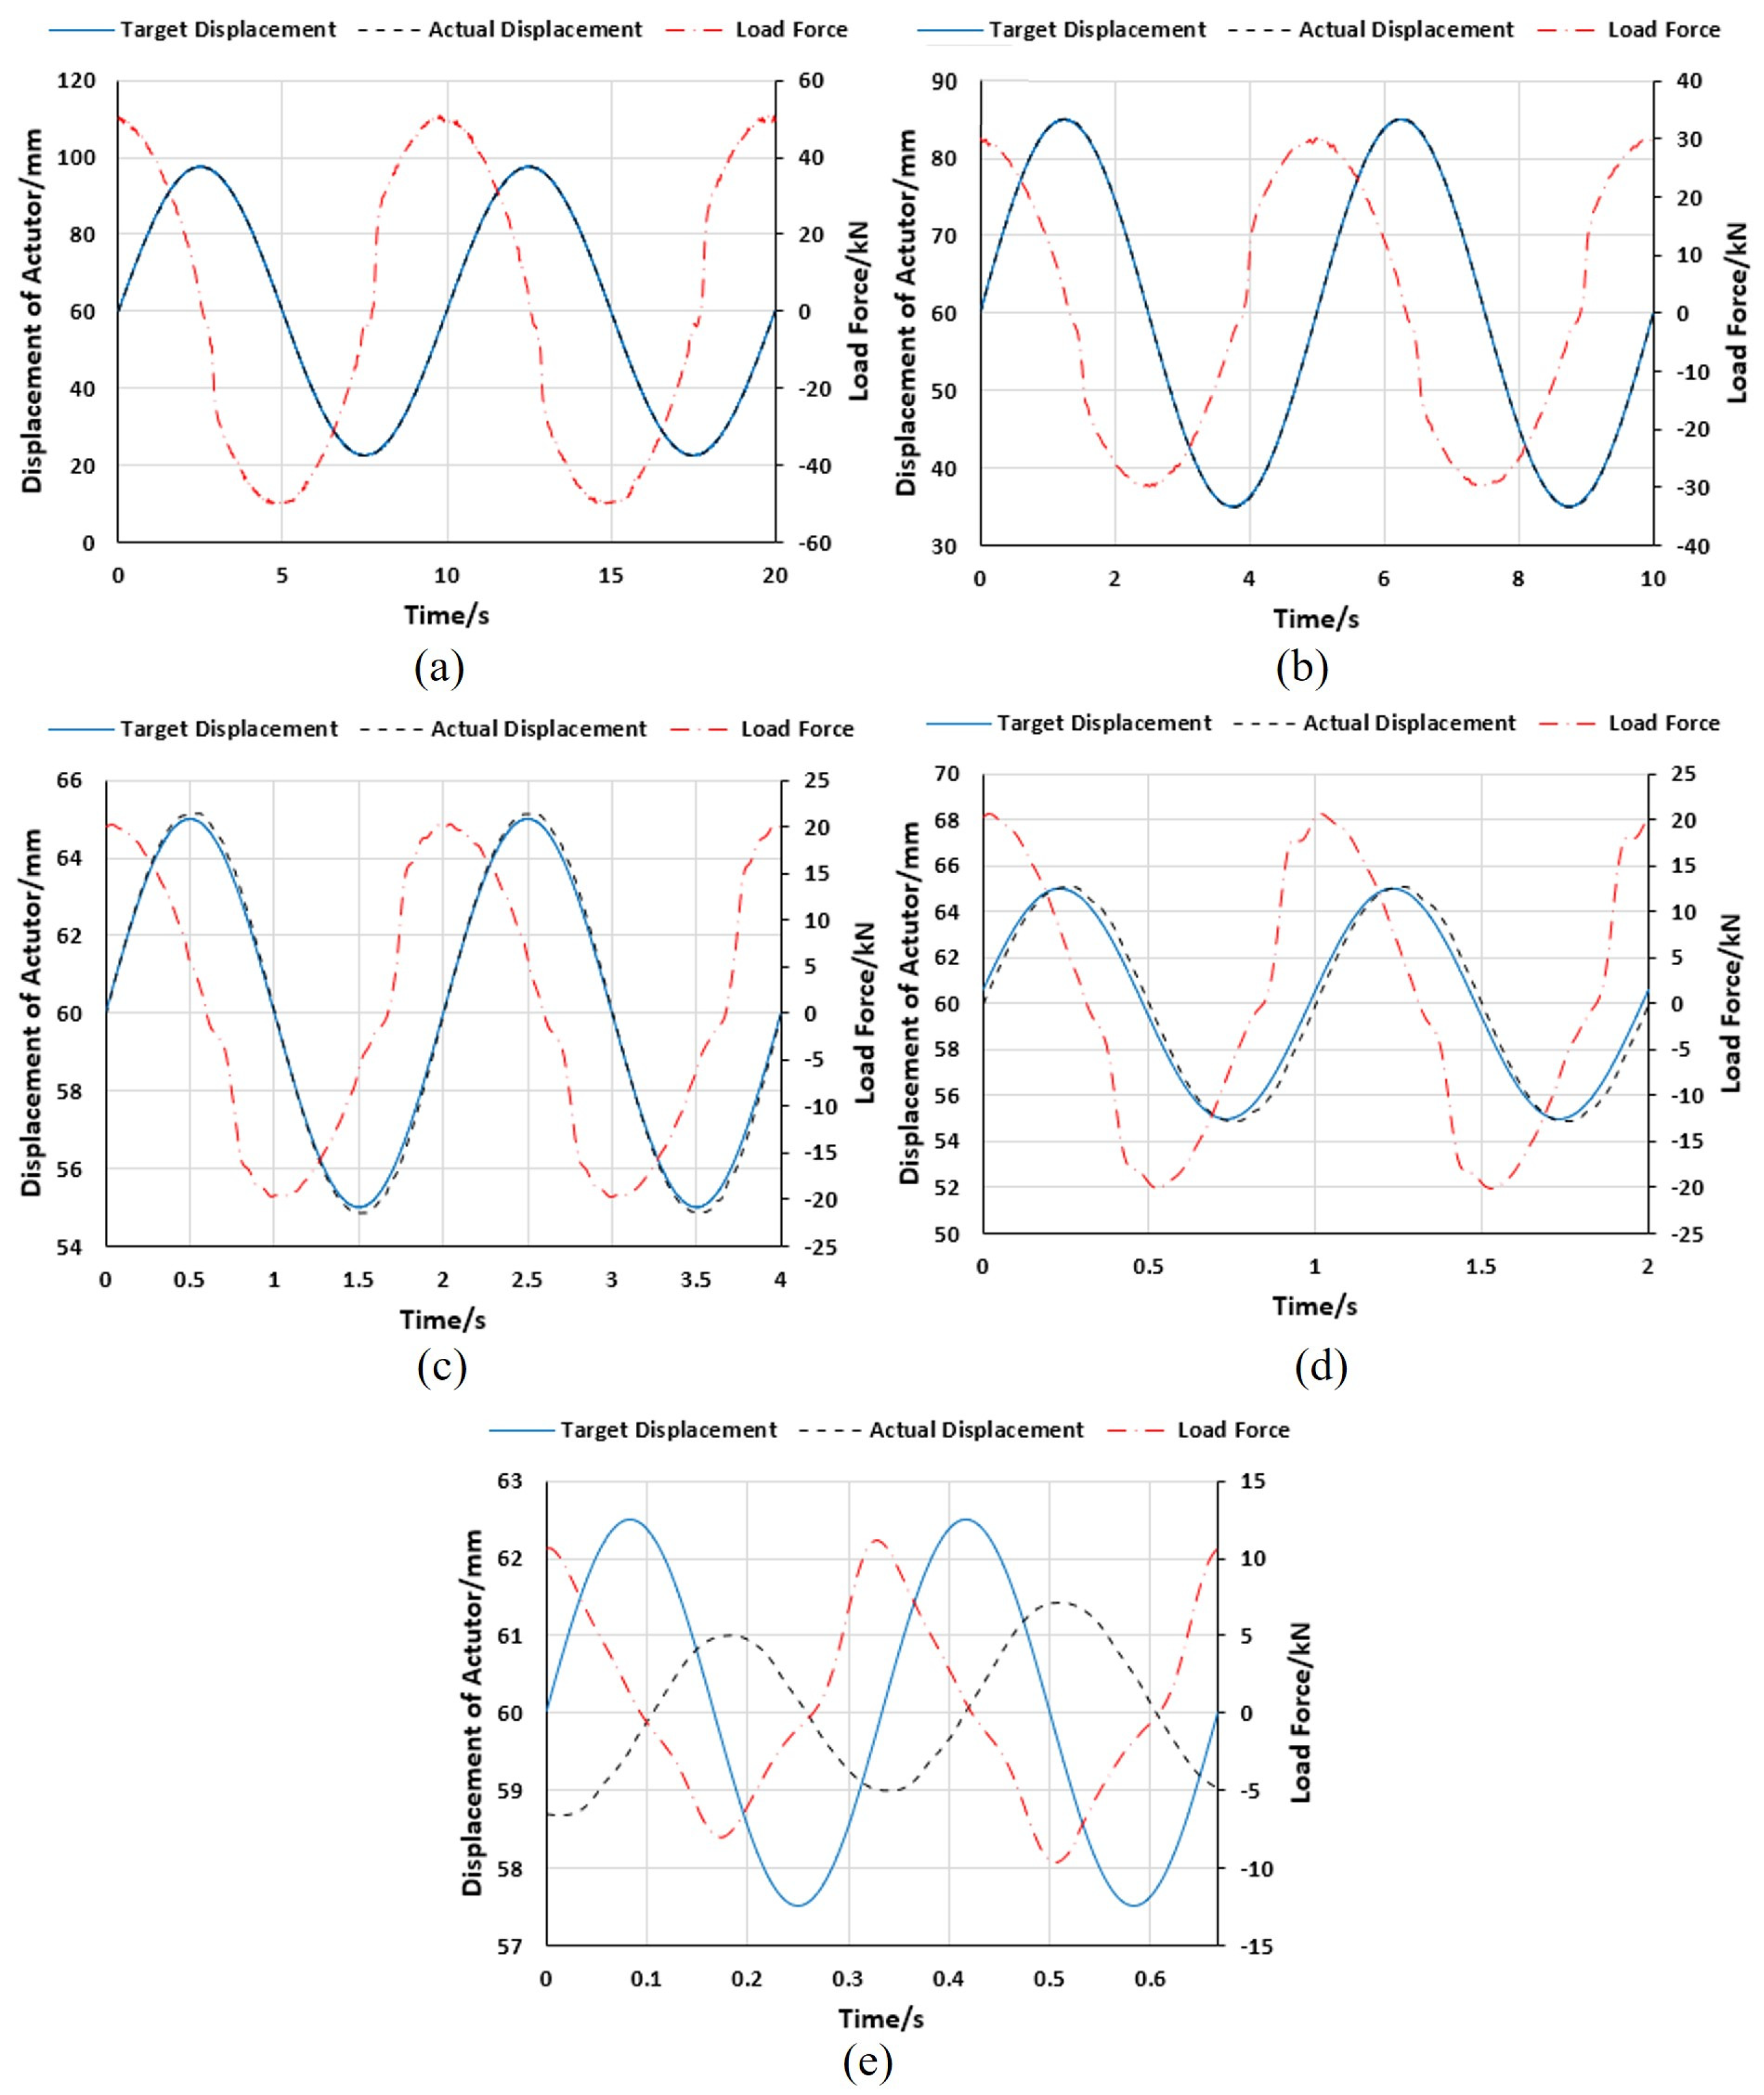
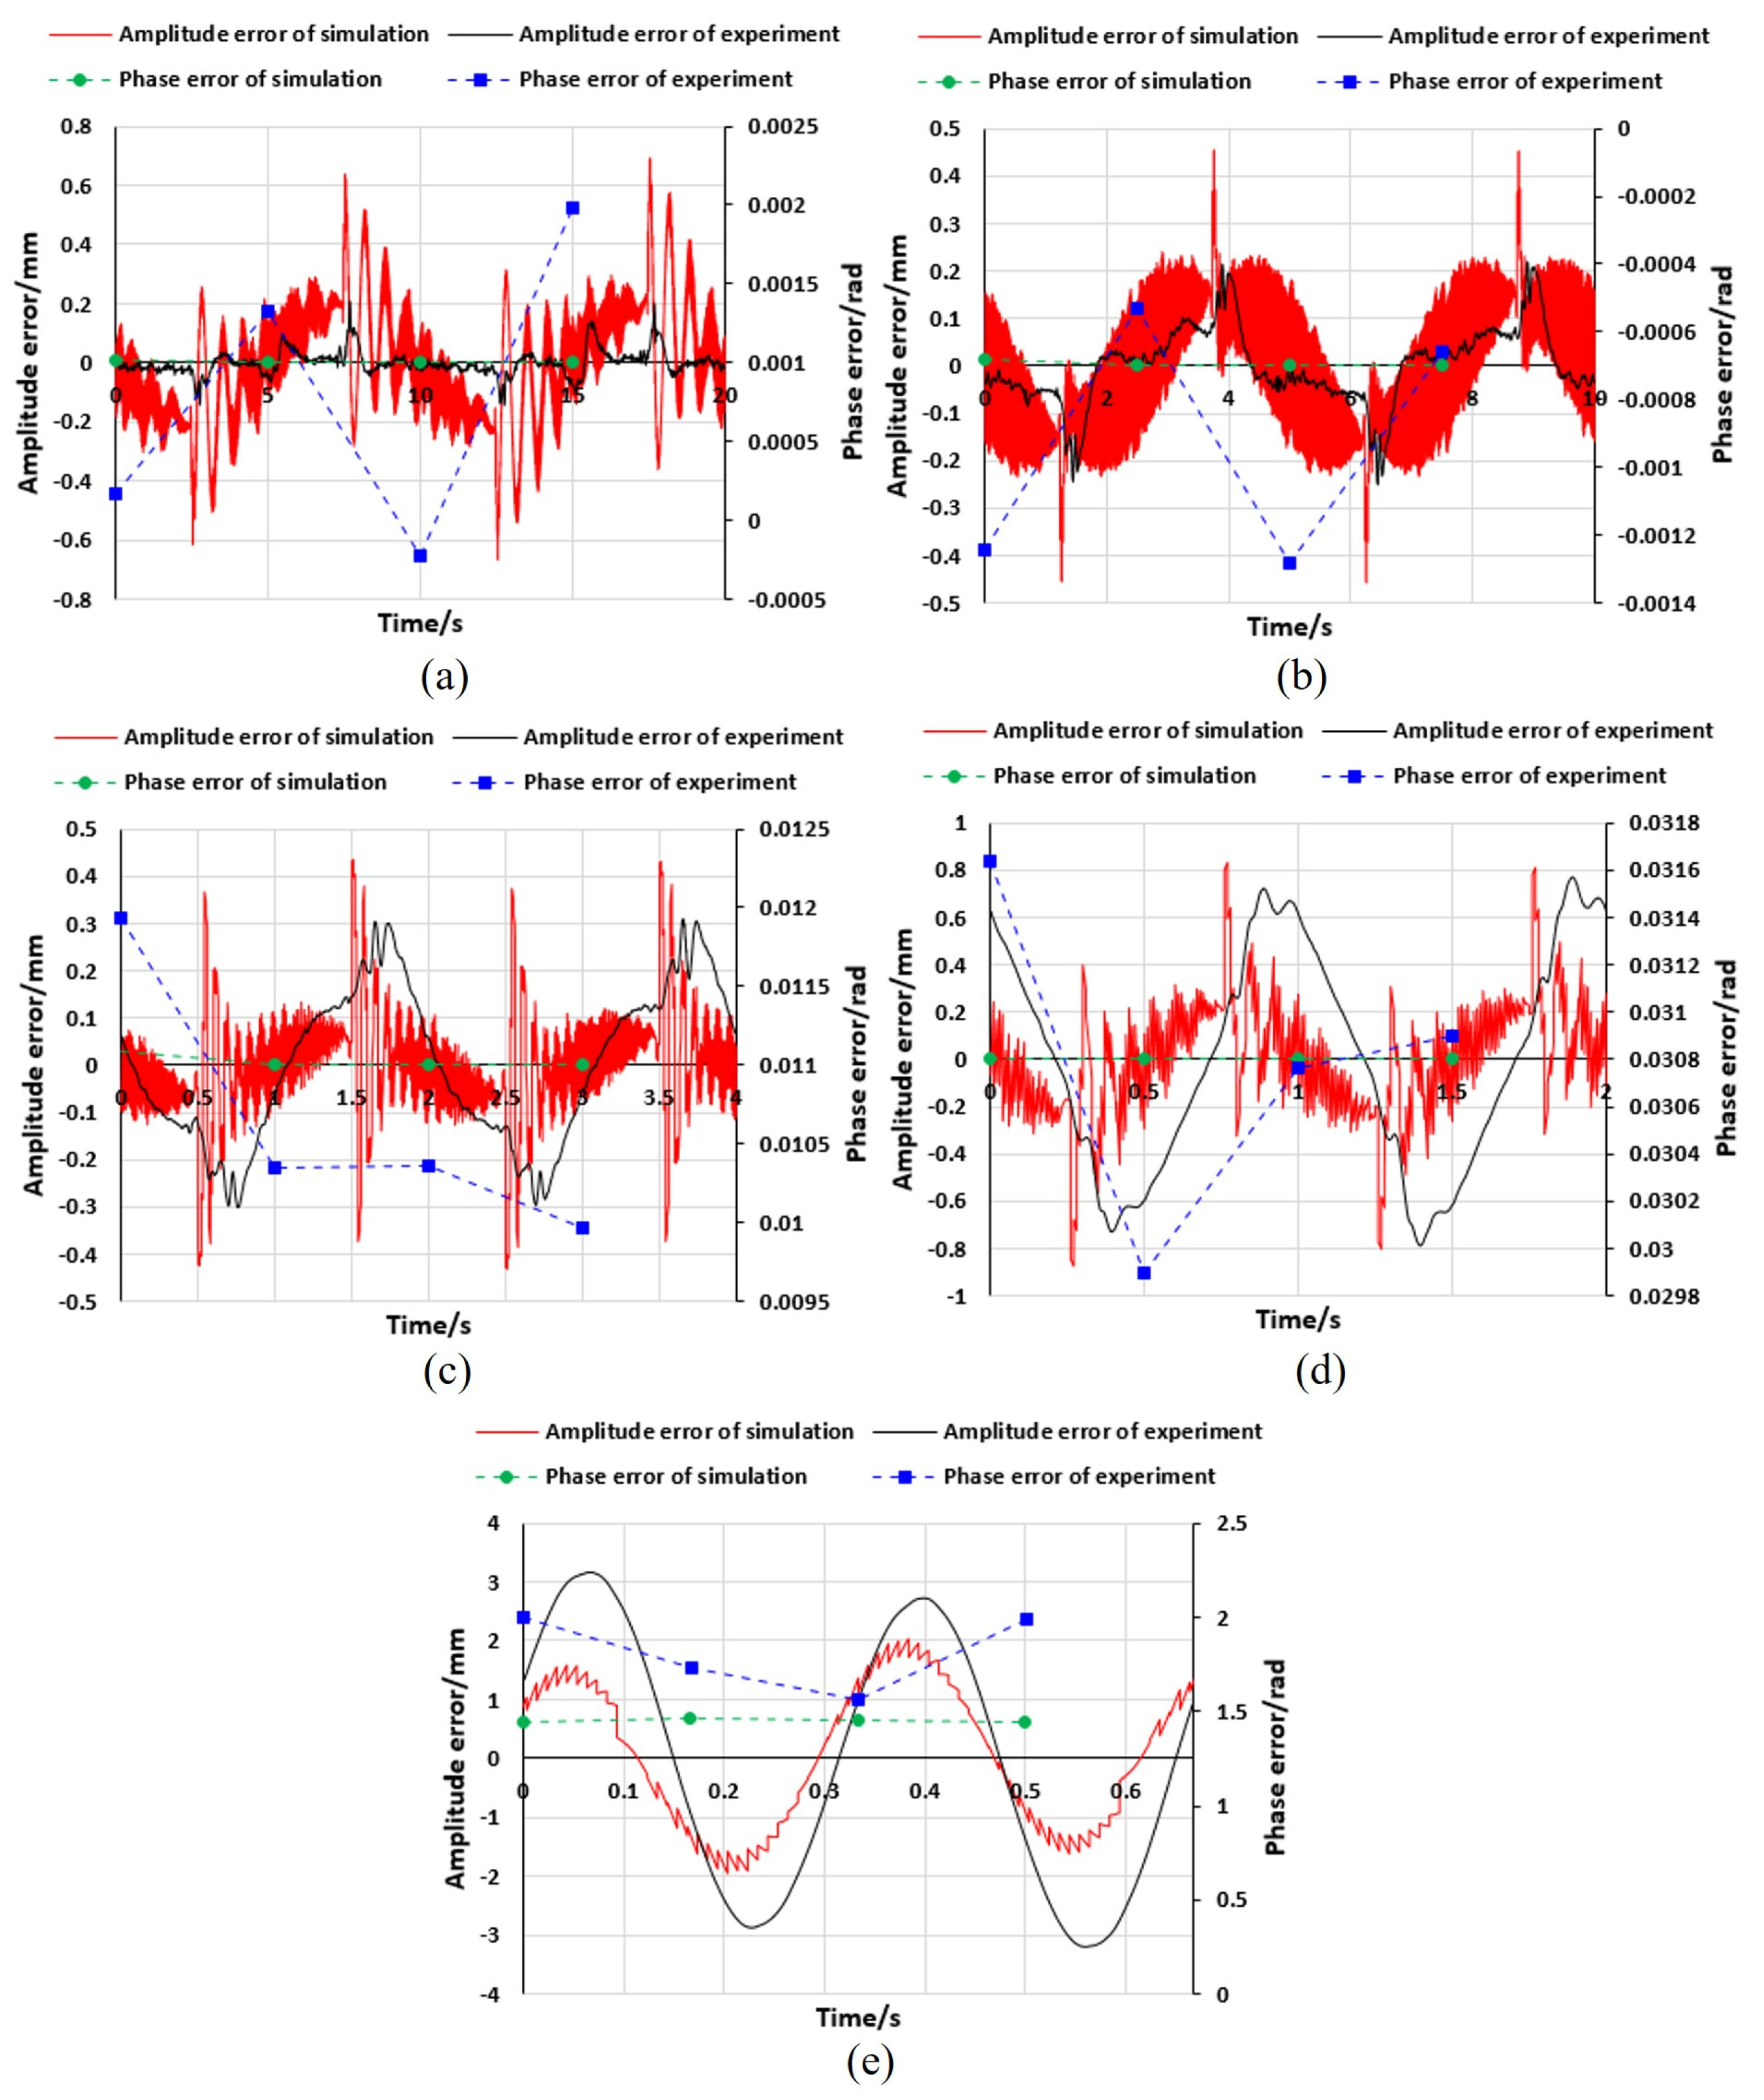
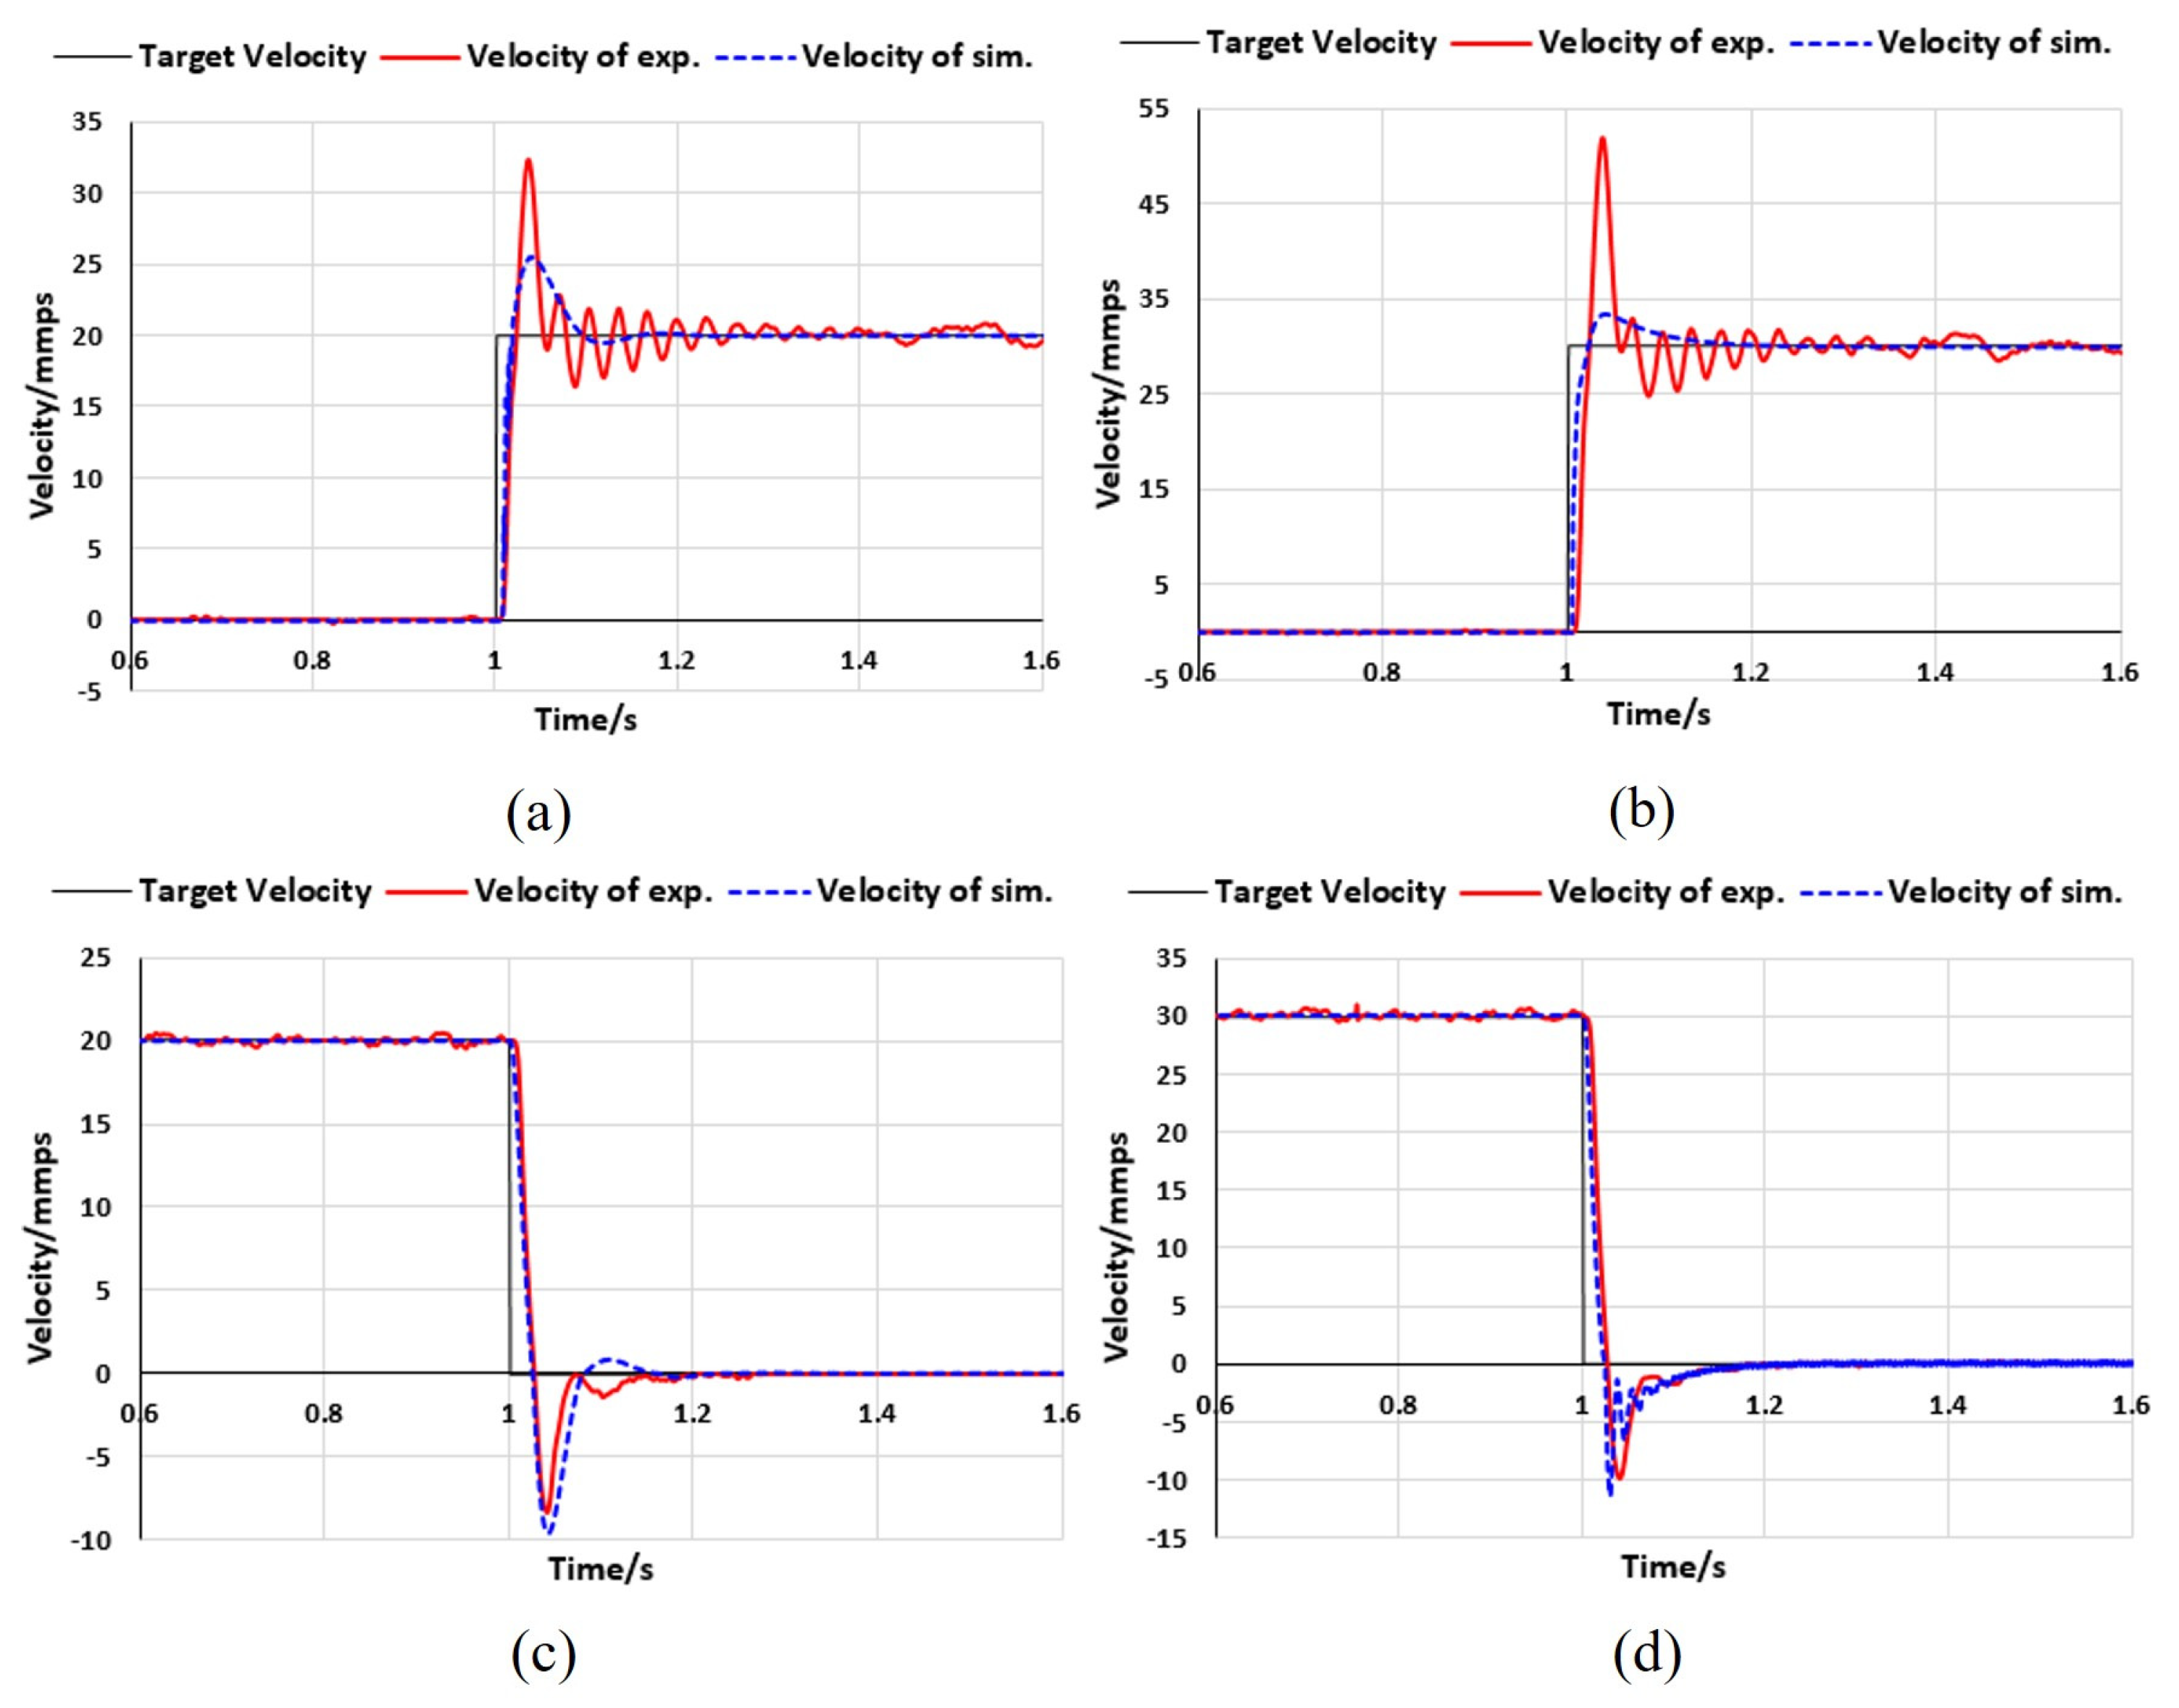
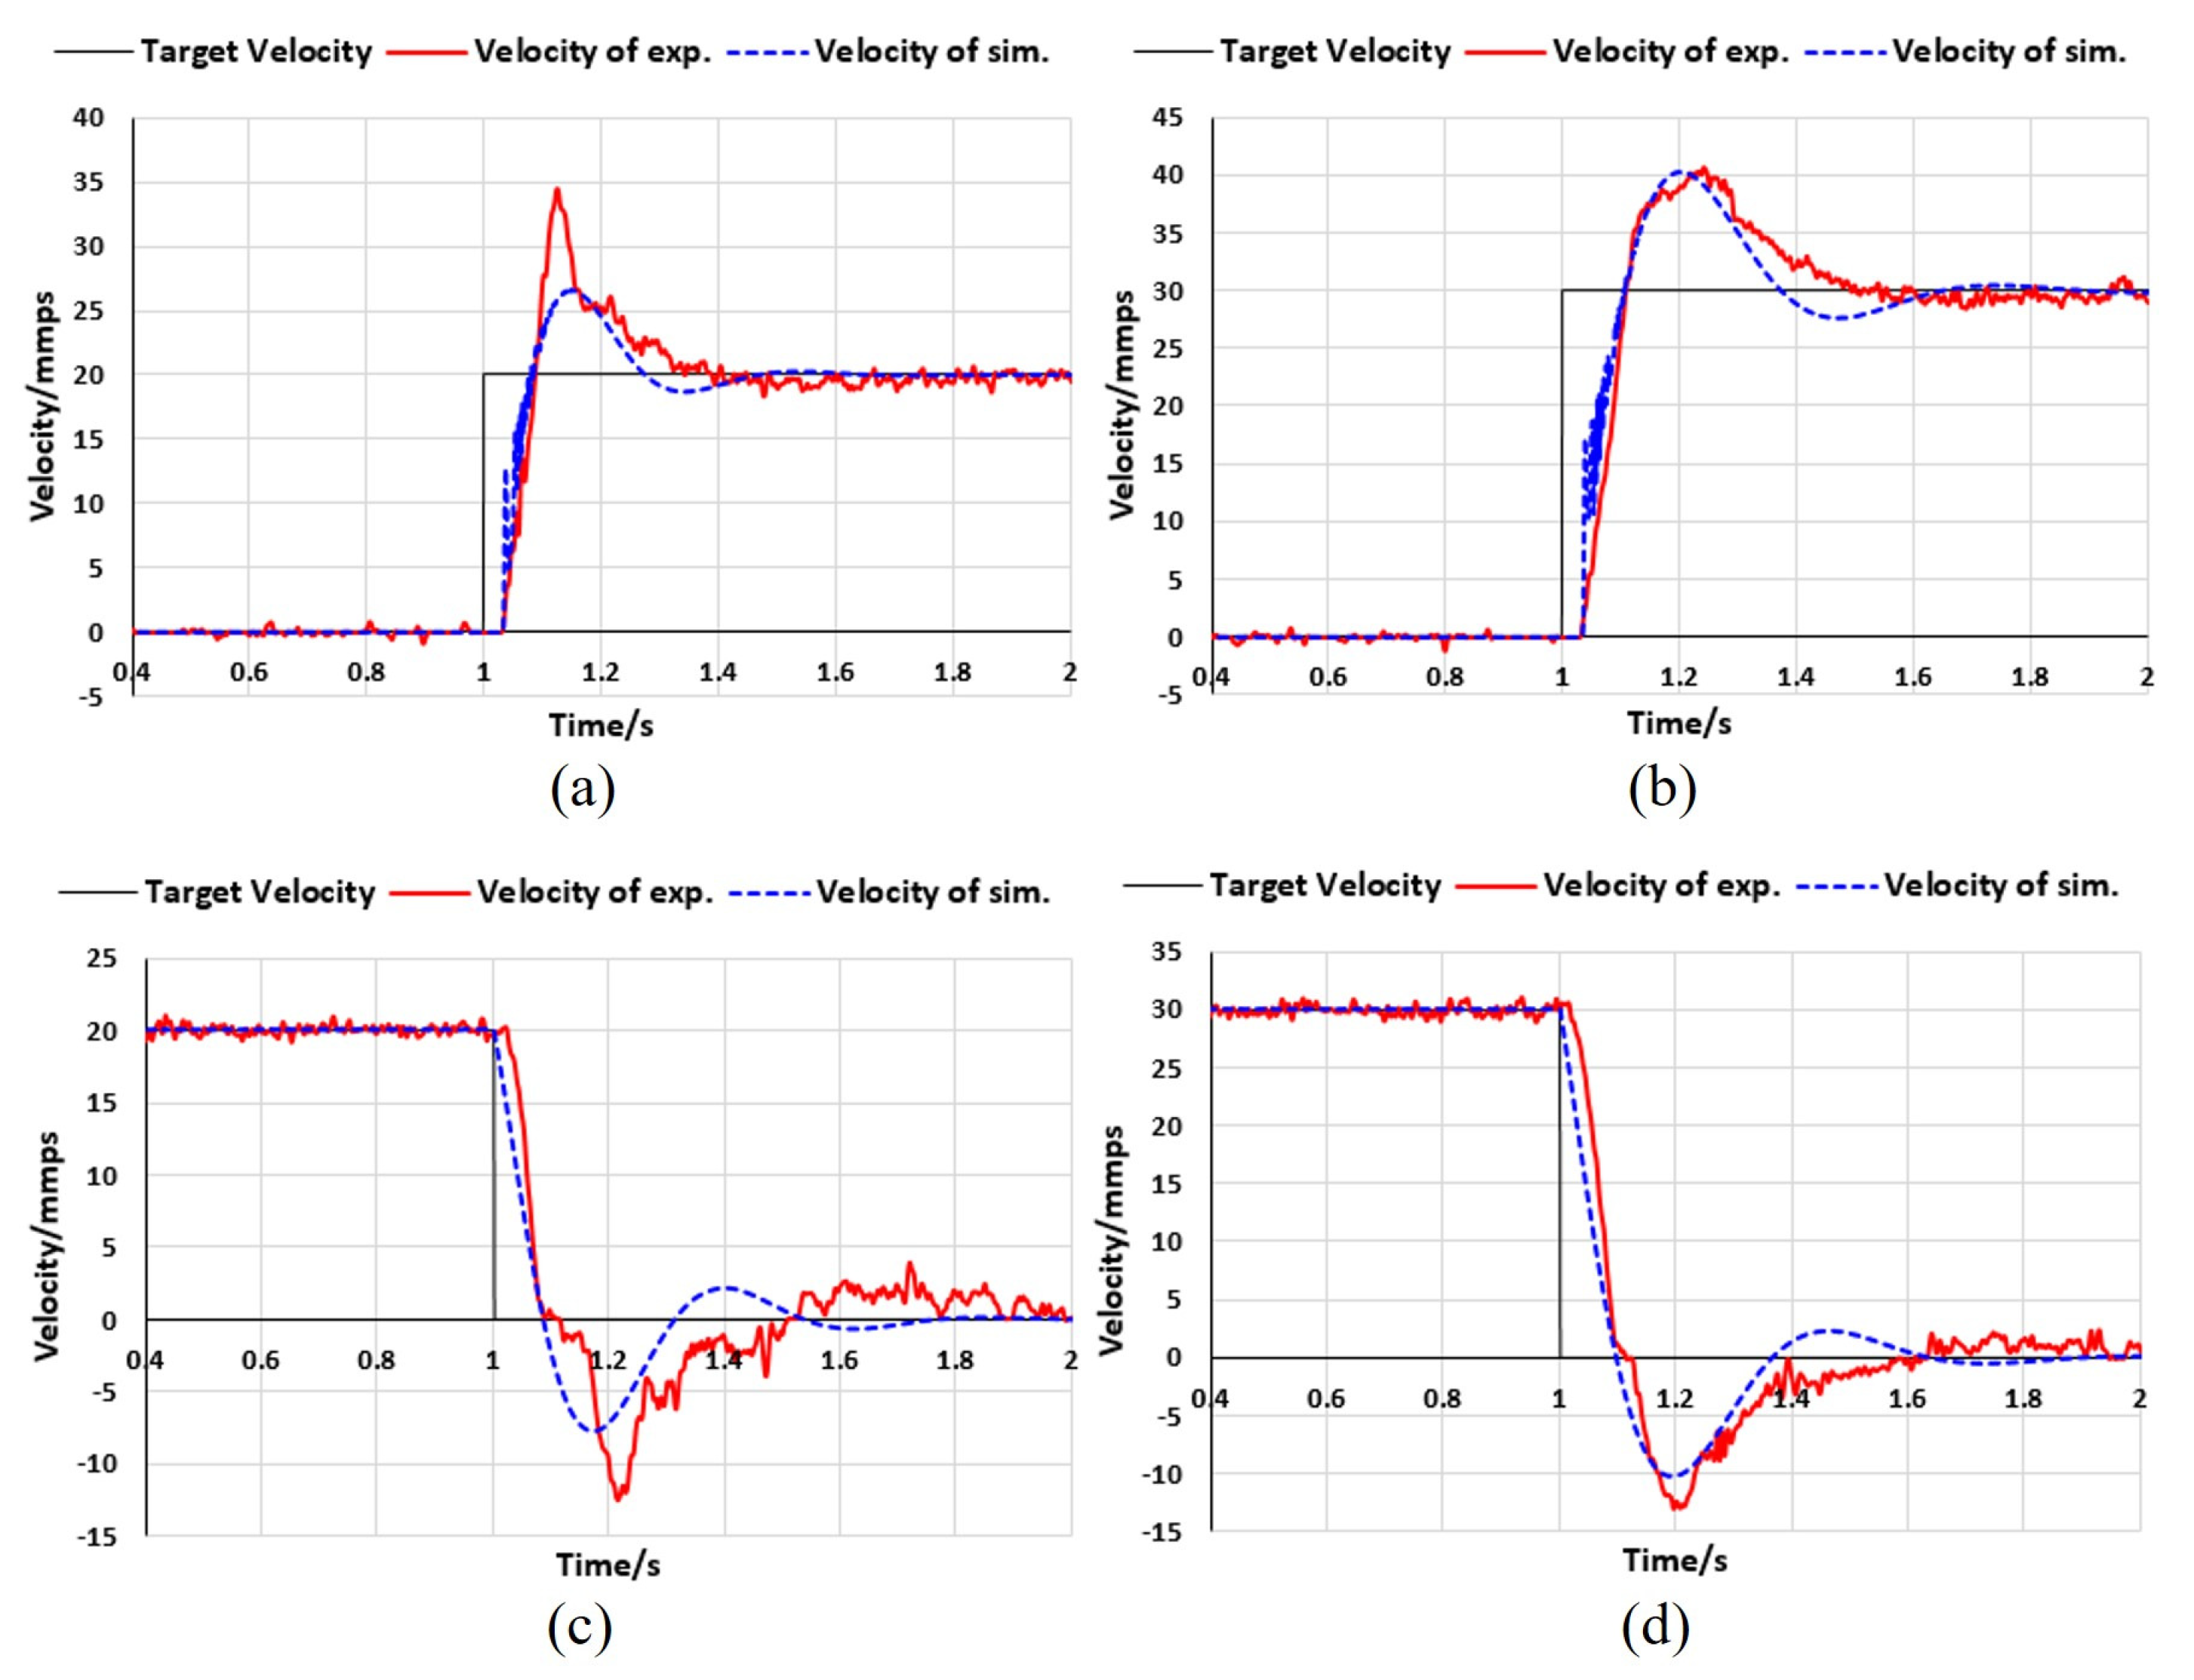

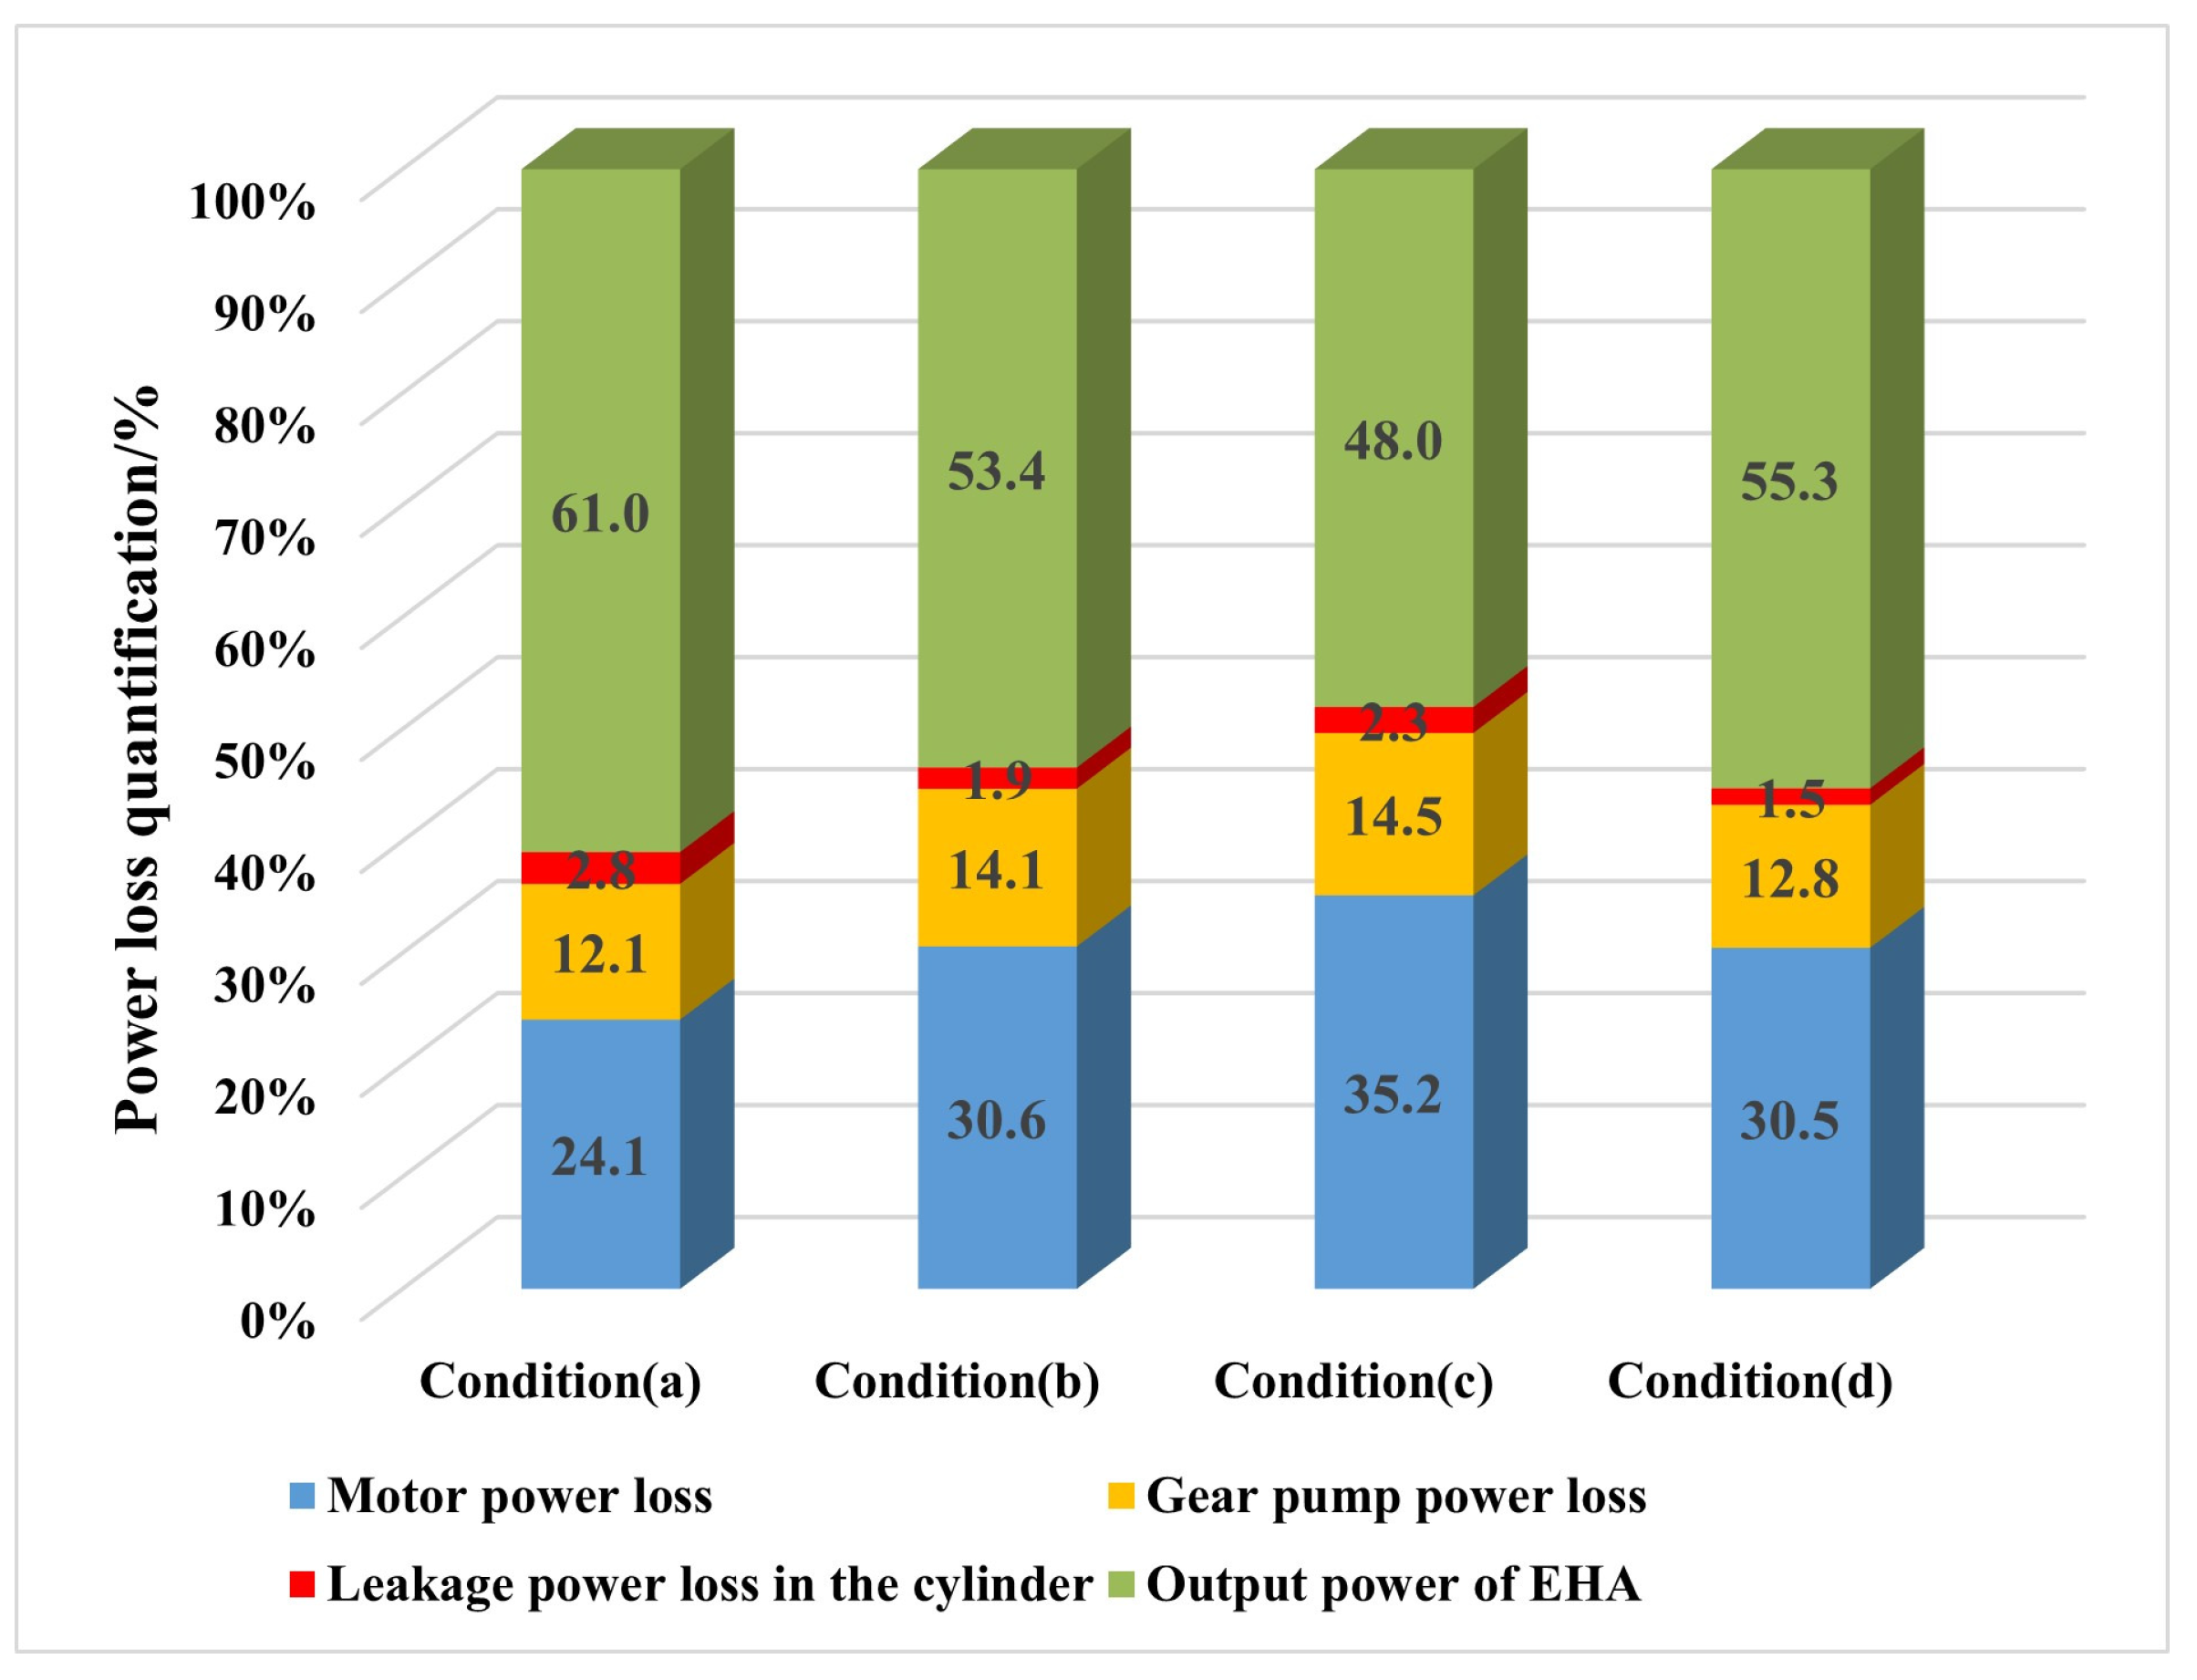
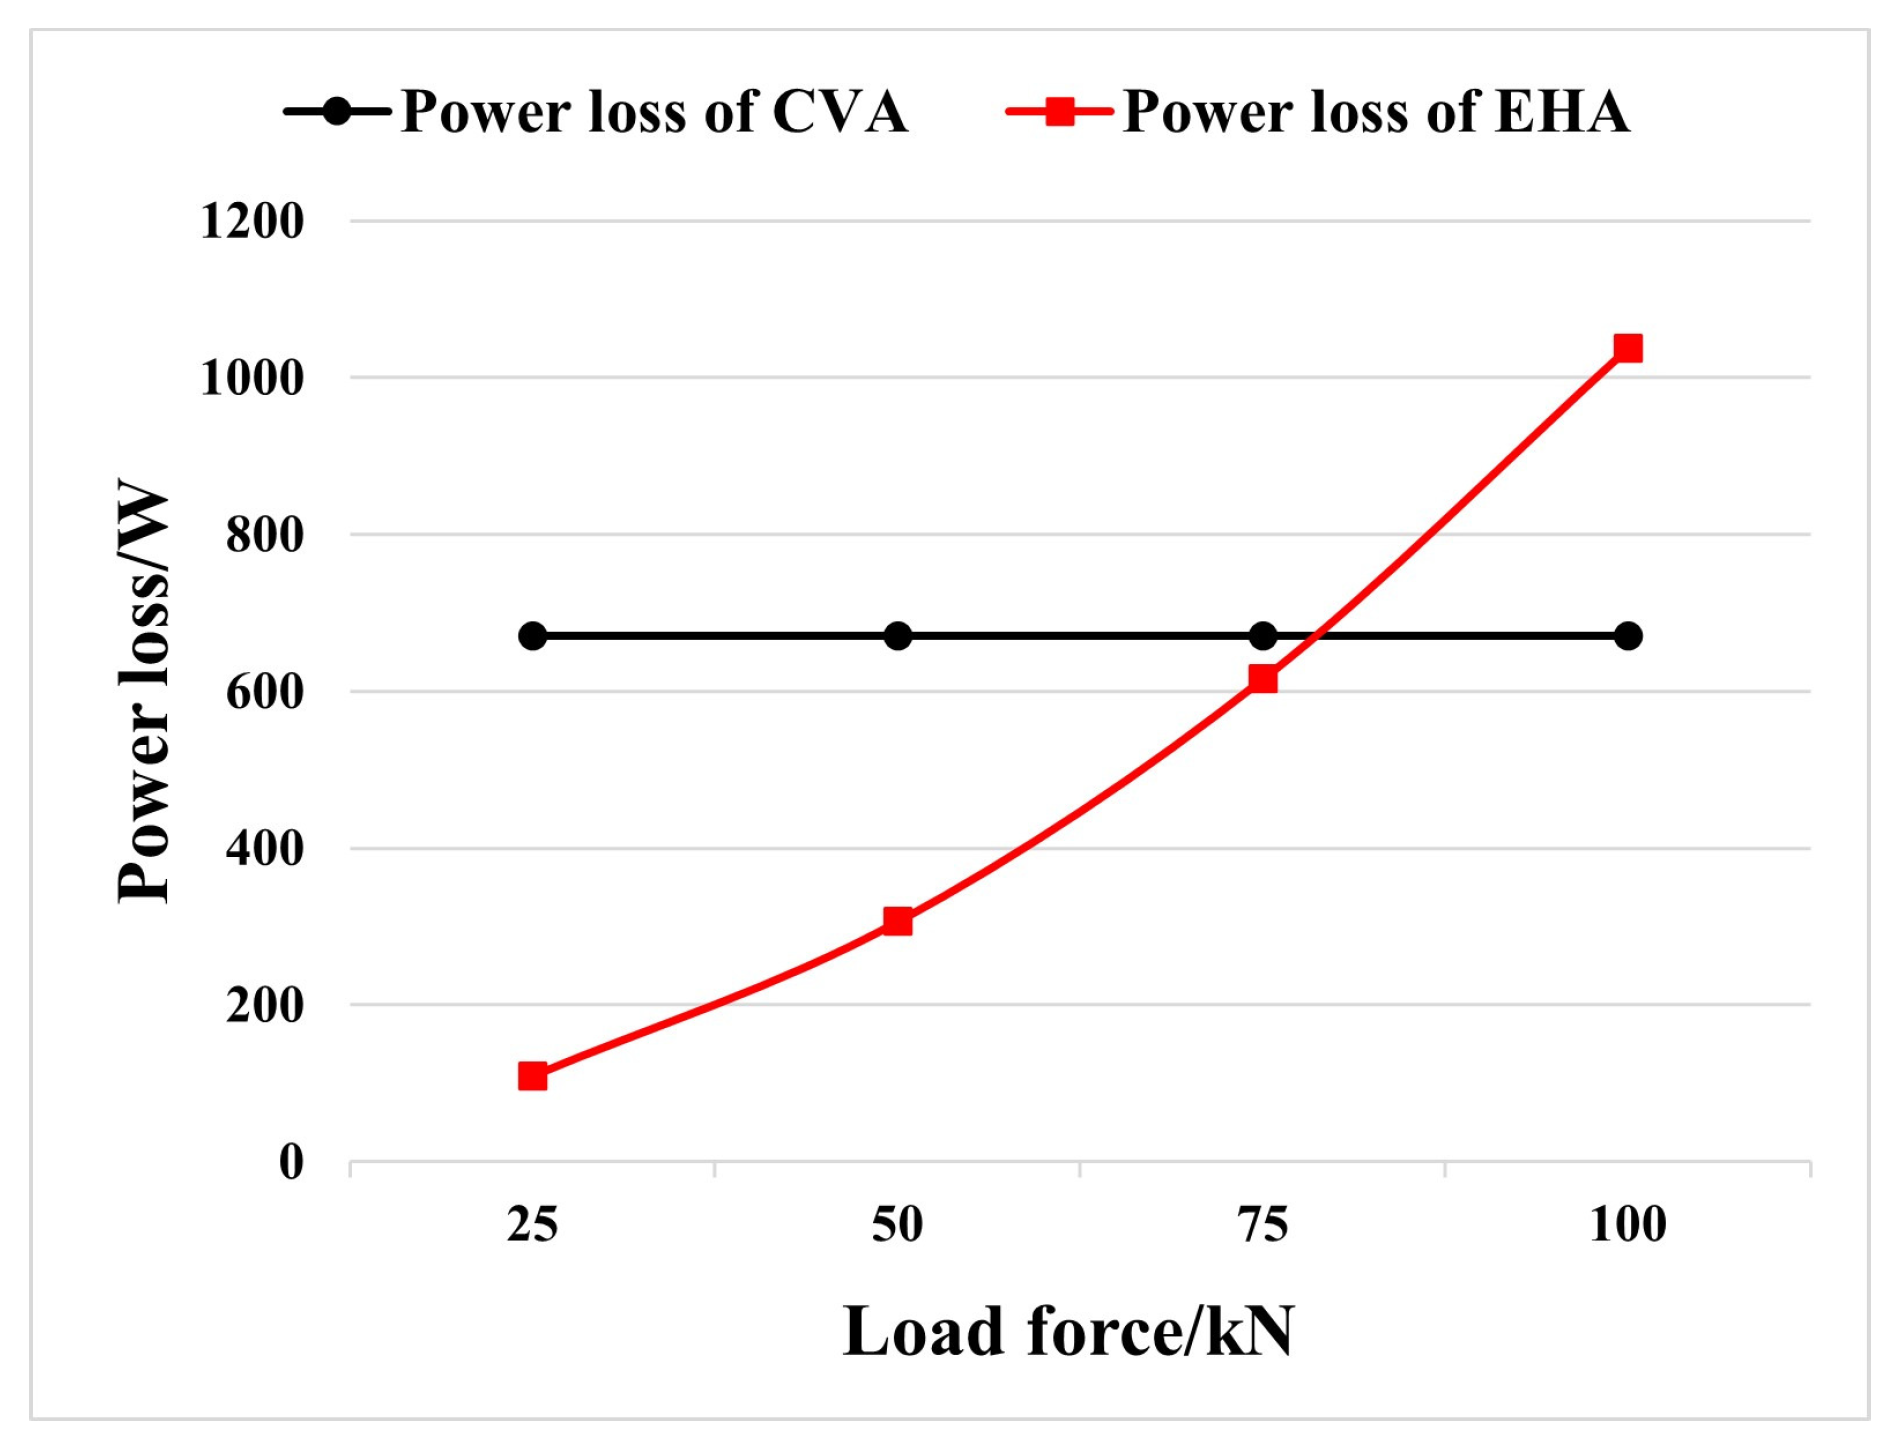

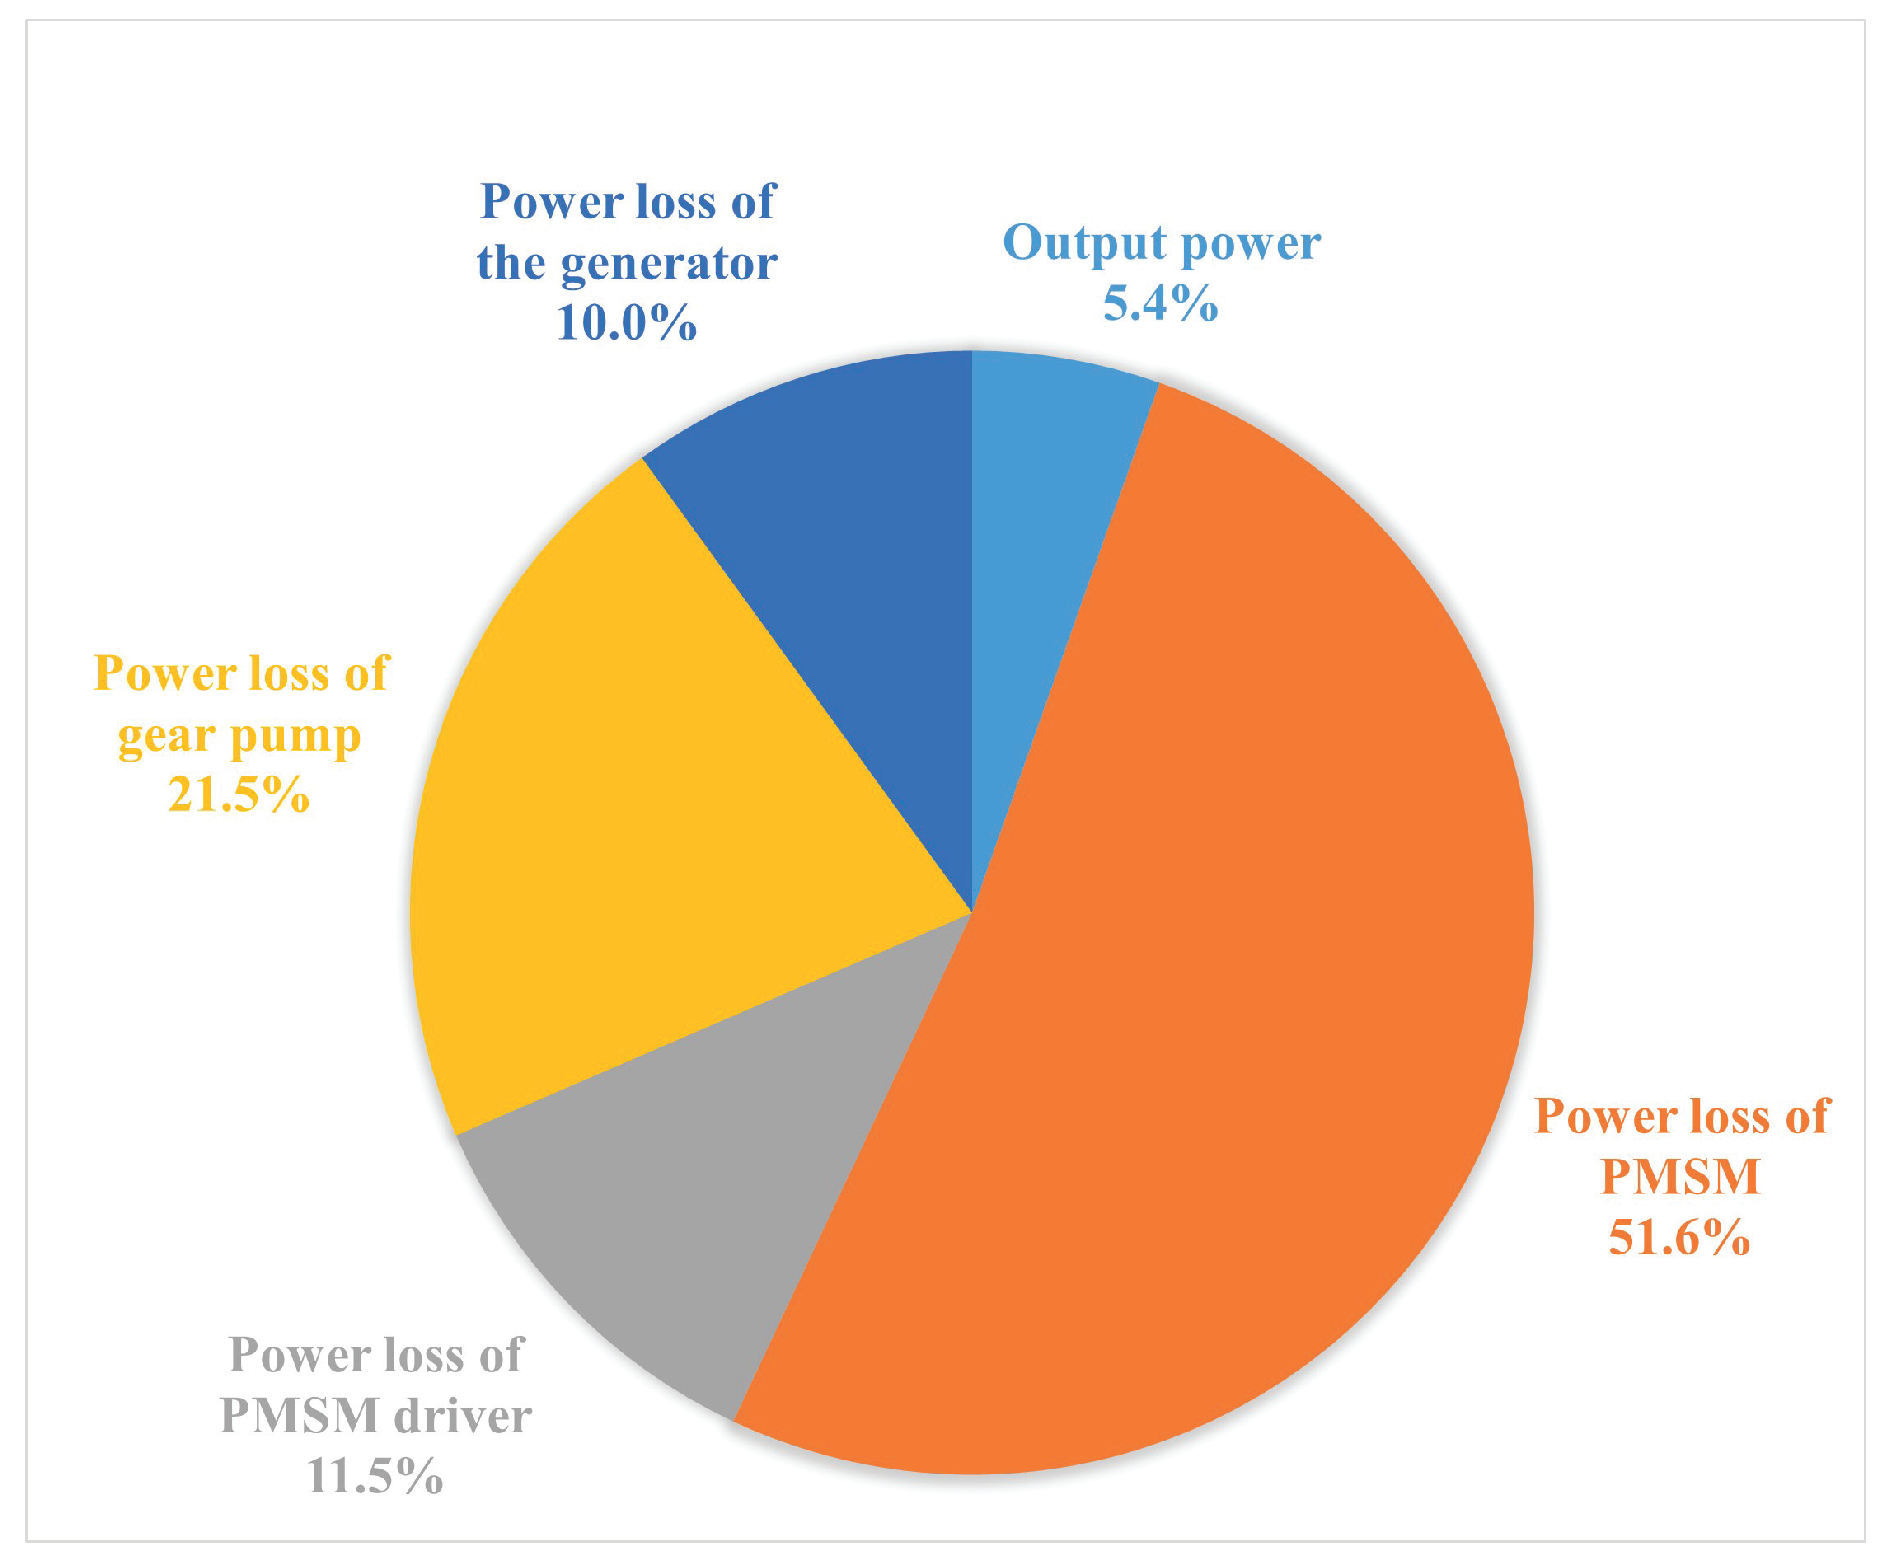
Disclaimer/Publisher’s Note: The statements, opinions and data contained in all publications are solely those of the individual author(s) and contributor(s) and not of MDPI and/or the editor(s). MDPI and/or the editor(s) disclaim responsibility for any injury to people or property resulting from any ideas, methods, instructions or products referred to in the content. |
© 2024 by the authors. Licensee MDPI, Basel, Switzerland. This article is an open access article distributed under the terms and conditions of the Creative Commons Attribution (CC BY) license (https://creativecommons.org/licenses/by/4.0/).