Abstract
Modern laver fluffiness is achieved by applying high-speed gas to a laver, which is generated by the opening and closing of a laver fluffiness control valve in a fluffiness system. To address the problems of the slow response speed and poor stability of valves used in the laver processing industry at present, this paper proposes a novel principle of a high-speed switching control valve, which has the advantages of a fast response speed, high stability, and long service life. The structure and working principle of the control valve are introduced, and the calculation equation of the valve’s flow area is established. The flow field inside the control valve with different openings was numerically calculated in this study using Fluent. The flow regulation characteristics and flow field performance of the control valve were also analyzed. The results show that, with an increase in the valve opening, the influence of the flow area at the valve throttle on the valve flow rate was weakened. When the valve was opened, a vortex appeared in both the upper and lower cavities, and jet flow occurred at the throttle of the middle flow channel. As the valve opening increased, the pressure in the upper cavity reduced, while the pressure in the lower cavity increased. The vortex in the flow field intensified, and the jet phenomenon at the valve throttle gradually disappeared. At the same time, the main stream in the lower cavity gradually changed from an annular flow to a direct flow toward the valve outlet. Furthermore, the impact, collision, and vortex formation of the fluid caused energy loss of the fluid, leading to a decrease in the outlet flow of the control valve.
1. Introduction
With global attention being paid to human health and food hygiene, laver has become an ideal health food for human beings. The product has a high protein content, a fat content of almost zero, and the effects of strengthening the stomach, lowering blood lipids, and inhibiting the growth of cancer cells. The product is in short supply but has significant market potential [1,2]. Depending on the variety, laver processing can be divided into the following: Porphyra haitanensis processing and Porphyra yezoensis processing. Porphyra haitanensis is suitable for all ages, rich in nutrition, and pollution-free, and its development has been rapid in recent years [3]. In mechanical processing, it is crucial to carry out a fluffy treatment after the completion of the dewatering stage, so that the surface of the processed laver is fluffy and glossy. In the fluffing station, a control valve with a large flow rate and fast switching is required. This valve controls the release of gas and is the main switch for the entire fluffing system. When the control valve works, through continuous opening and closing, the formation of high-velocity gas impacts the laver on the sheet, causing it to loosen and expand. Therefore, the control valve plays an important role in laver processing.
In recent years, many researchers in the field of valves have carried out a considerable amount of research on the flow structure and dynamic characteristics of valves. Tabrizi et al. [4] used a combination of numerical simulation and experiment to compare and analyze the internal flow field of conventional ball valves. The researchers found that with a decrease in the valve opening, the pressure dropped and the eddy current increased gradually, and energy loss also increased. Chern et al. [5] used the PTFV method to study the visualization of ball valves, discussed the relationship between valve performance and a flow field, and proposed an effective method for determining valve performance coefficient and cavitation conditions. Tao et al. [6] studied the regulating performance and flow loss of ball valves by combining numerical simulation and experiment. Their results showed that the position of internal energy loss in a downstream pipeline corresponds to the position of external pressure fluctuation, which provided a new method for ensuring the stability of the downstream pressure of a valve. Campagne et al. [7] studied the influence of bubbles on a ball valve piping system using CFD software AVL-Fire and found that when the volume fraction of the gas was 4%, bubble blocking led to a 10% reduction in the ball valve flux. Sedghkerdar et al. [8] studied the influence of average flow velocity and gate valve opening on the downstream function of a valve, and the results showed that turbulence and strong velocity gradient near the upper pipe wall resulted in higher wall shear stress. Duda et al. [9] calculated the maximum heating and cooling rates of a boiler by determining the initial cutoff temperature step in order to reduce the thermal stress and total stress in the process of opening and closing the boiler, finding that the steam gate valve generated high cyclic thermal stress during operation, which led to the fracture of the valve core. Chen et al. [10] studied the eccentric jet characteristics caused by gate valves by combining numerical simulation and experiment and proposed that the critical pipe length could be used to judge the eccentric jet terminal point of downstream pipeline development. Through several tests on a valve, Smith et al. [11] determined that noise was caused by the shedding of eddy current and the acoustic resonance of a valve throat. On this basis, the valve seat, valve seat cavity, and other structures of a gate valve were optimized to reduce the shedding of vortex. Dong et al. [12] designed a parallel slide valve pilot high-pressure solenoid valve. Using MATLAB calculations, it was found that the opening response speed of the valve was about 48.3 ms while the flow rate was guaranteed.
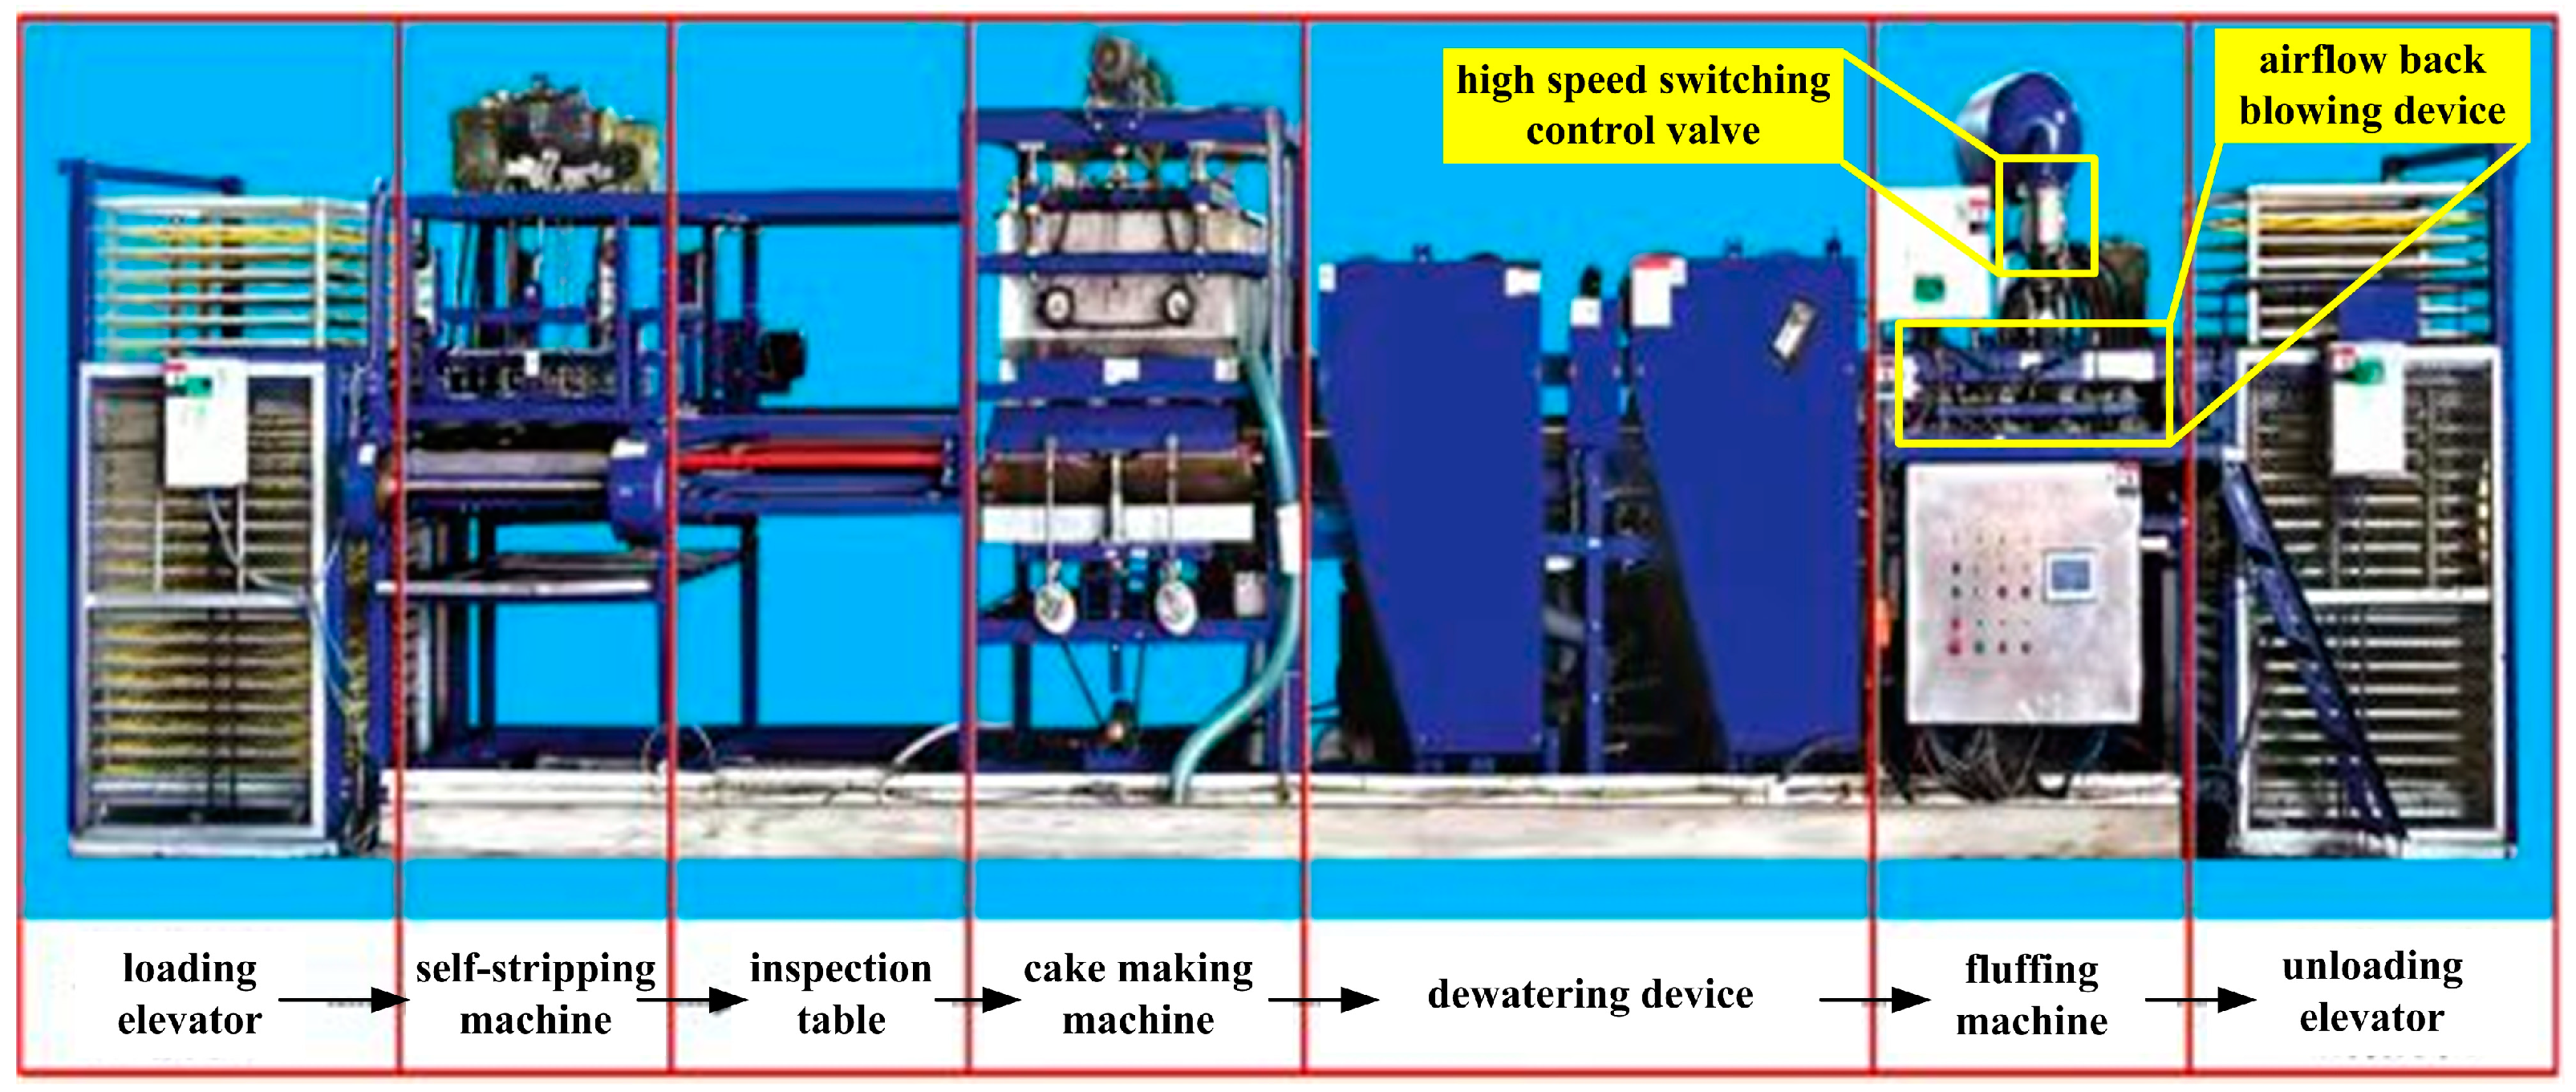
In the past few years, research has found that laver (Porphyra haitanensis) processing is widely distributed in the Jiangnan region of China, all of which involves manual processing, while in Japan, South Korea, and other countries, laver (Porphyra yezoensis) processing has already moved toward mechanical processing. In order to improve the efficiency and quality of Porphyra haitanensis processing, the present author and his team independently developed primary processing equipment, as shown in Figure 1. Figure 2 shows a structural diagram of this equipment, which is mainly composed of a loading elevator, self-stripping machine, inspection table, cake-making machine, dewatering device, fluffing machine, and unloading elevator. In the early stage of the use of the equipment, it was found that the products processed by the mechanical equipment were obviously different from the products processed by hand, and the laver was not fluffy. The main reason was that the mechanical processing and manual processing were obviously different, and the manual process could not be completely copied. In order to make the laver fluffy, the airflow back-blowing method can be utilized. Therefore, on the basis of the primary processing equipment shown in Figure 1, an airflow back-blowing device for laver was developed (as shown in Figure 2). When the device is running, at the position of the fluffiness machine, it requires a control valve that can control the high-pressure airflow (about 1 MPa) and meet the working requirements of switching (about 100 milliseconds once), a large flow (about 150–200 m3/h), and a long service life (20,000 times per day). According to the investigation of a large number of enterprises, these requirements have not been met so far; the switching speed of a solenoid valve can come close to that of the airflow back-blowing device, but its flowthrough is small. Although some manufacturers can provide large-flow solenoid valves, such as those with a diameter of 30 mm, their switching speed is too slow, each switching speed is about 1 s, and their service life is only about 200,000 cycles [13,14]. Gate valves can withstand a high-pressure fluid medium, but their switching speed is slow during the reciprocating operation [15]. Butterfly valves and ball valves are fast, but are not resistant to high pressure and their service life is relatively short. Thus, traditional valves are difficult to apply.
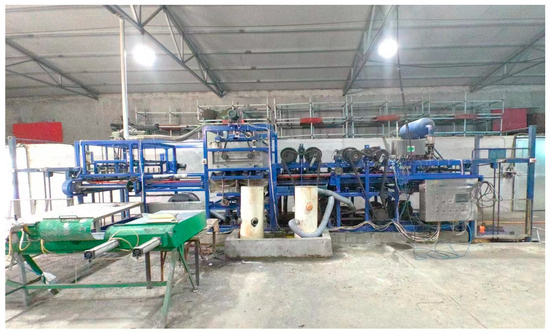
Figure 1.
Physical diagram of the primary processing equipment for laver (Porphyra haitanensis).

Figure 2.
Structure diagram of the primary processing equipment for laver (Porphyra haitanensis).
In response to the slow response speed, poor stability, and other limitations of traditional control valves currently used, a novel principle of a high-speed switching control valve is proposed in this paper, which can be used to quickly connect or truncate the high-pressure gas path in the process of fluffy laver processing. Wang et al. [16,17] introduced the structure in detail: the control valve has the advantages of a good sealing effect, a fast response speed, high stability, and a long service life. Furthermore, according to the characteristics of the structure of the control valve, in the process of working through the surface contact and dynamic friction of the friction plate of the moving valve body and the static valve body to realize the quick switching action of the valve, high-pressure gas interacts with the structure of the control valve. The dynamic behavior of this process is very complex. Therefore, in this study, numerical simulation research was carried out on the flow characteristics and flow field performance of a laver fluffiness control valve; we also reveal the formation mechanism and evolutionary law of the flow field in the valve during the working process and provide theoretical guidance for the promotion and application of the structure or similar control valves in the future.
The structure of this paper is as follows. Section 2 introduces the structure and principle of the new laver fluffiness control valve and deduces the flow area of the valve. Section 3 establishes a control valve internal flow field simulation model and provides grid divisions, boundary conditions, and related parameter settings. Section 4 presents the simulation results, including the flow regulation characteristics of the control valve, the force on the upper and lower chamber of the control valve, and an analysis of the flow field. Section 5 concludes this paper.
2. Control Valve Structure and Principle
2.1. Control Valve Structure
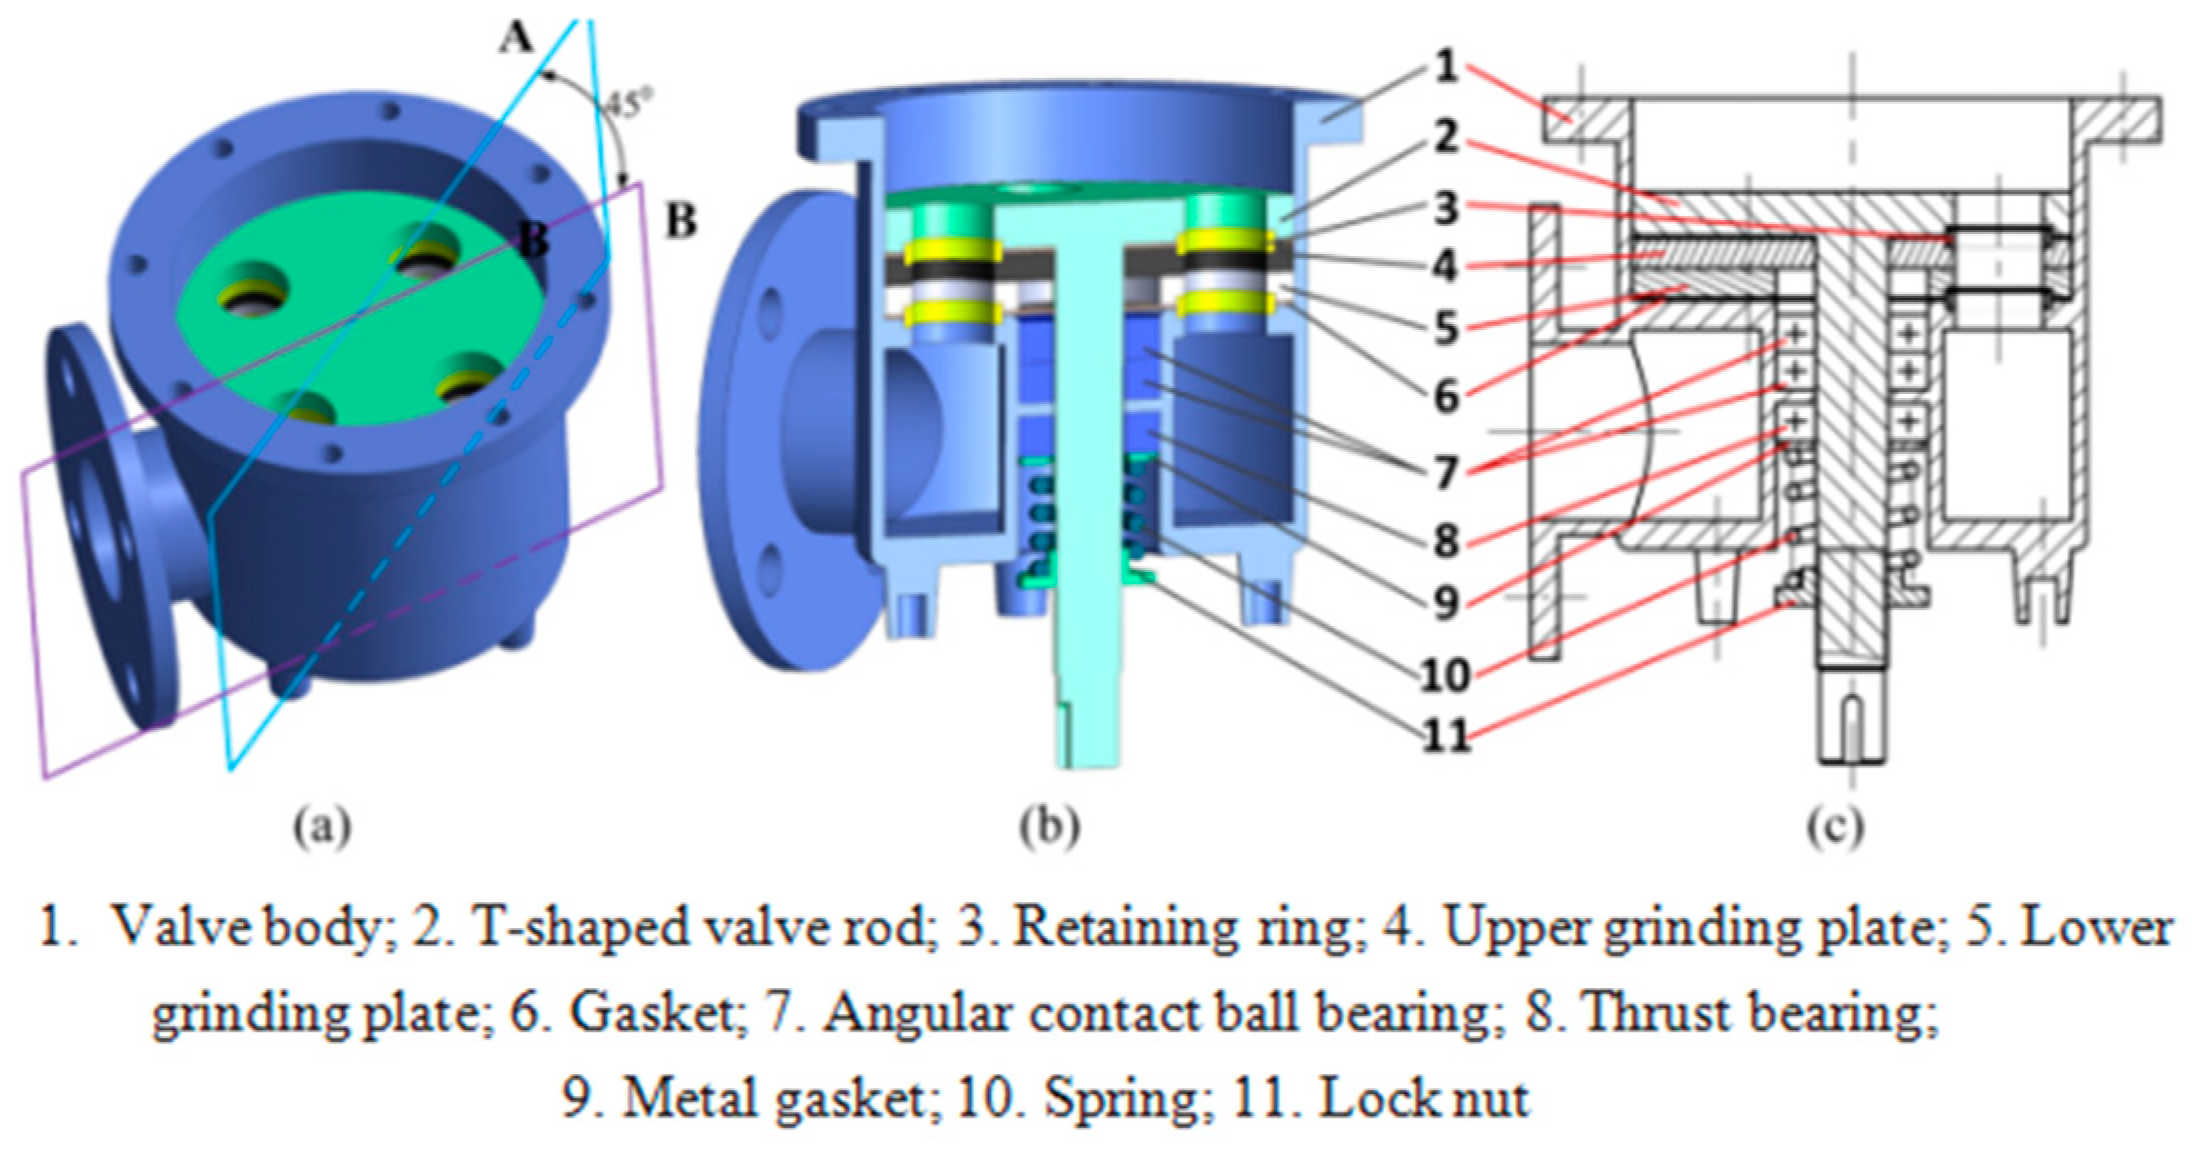
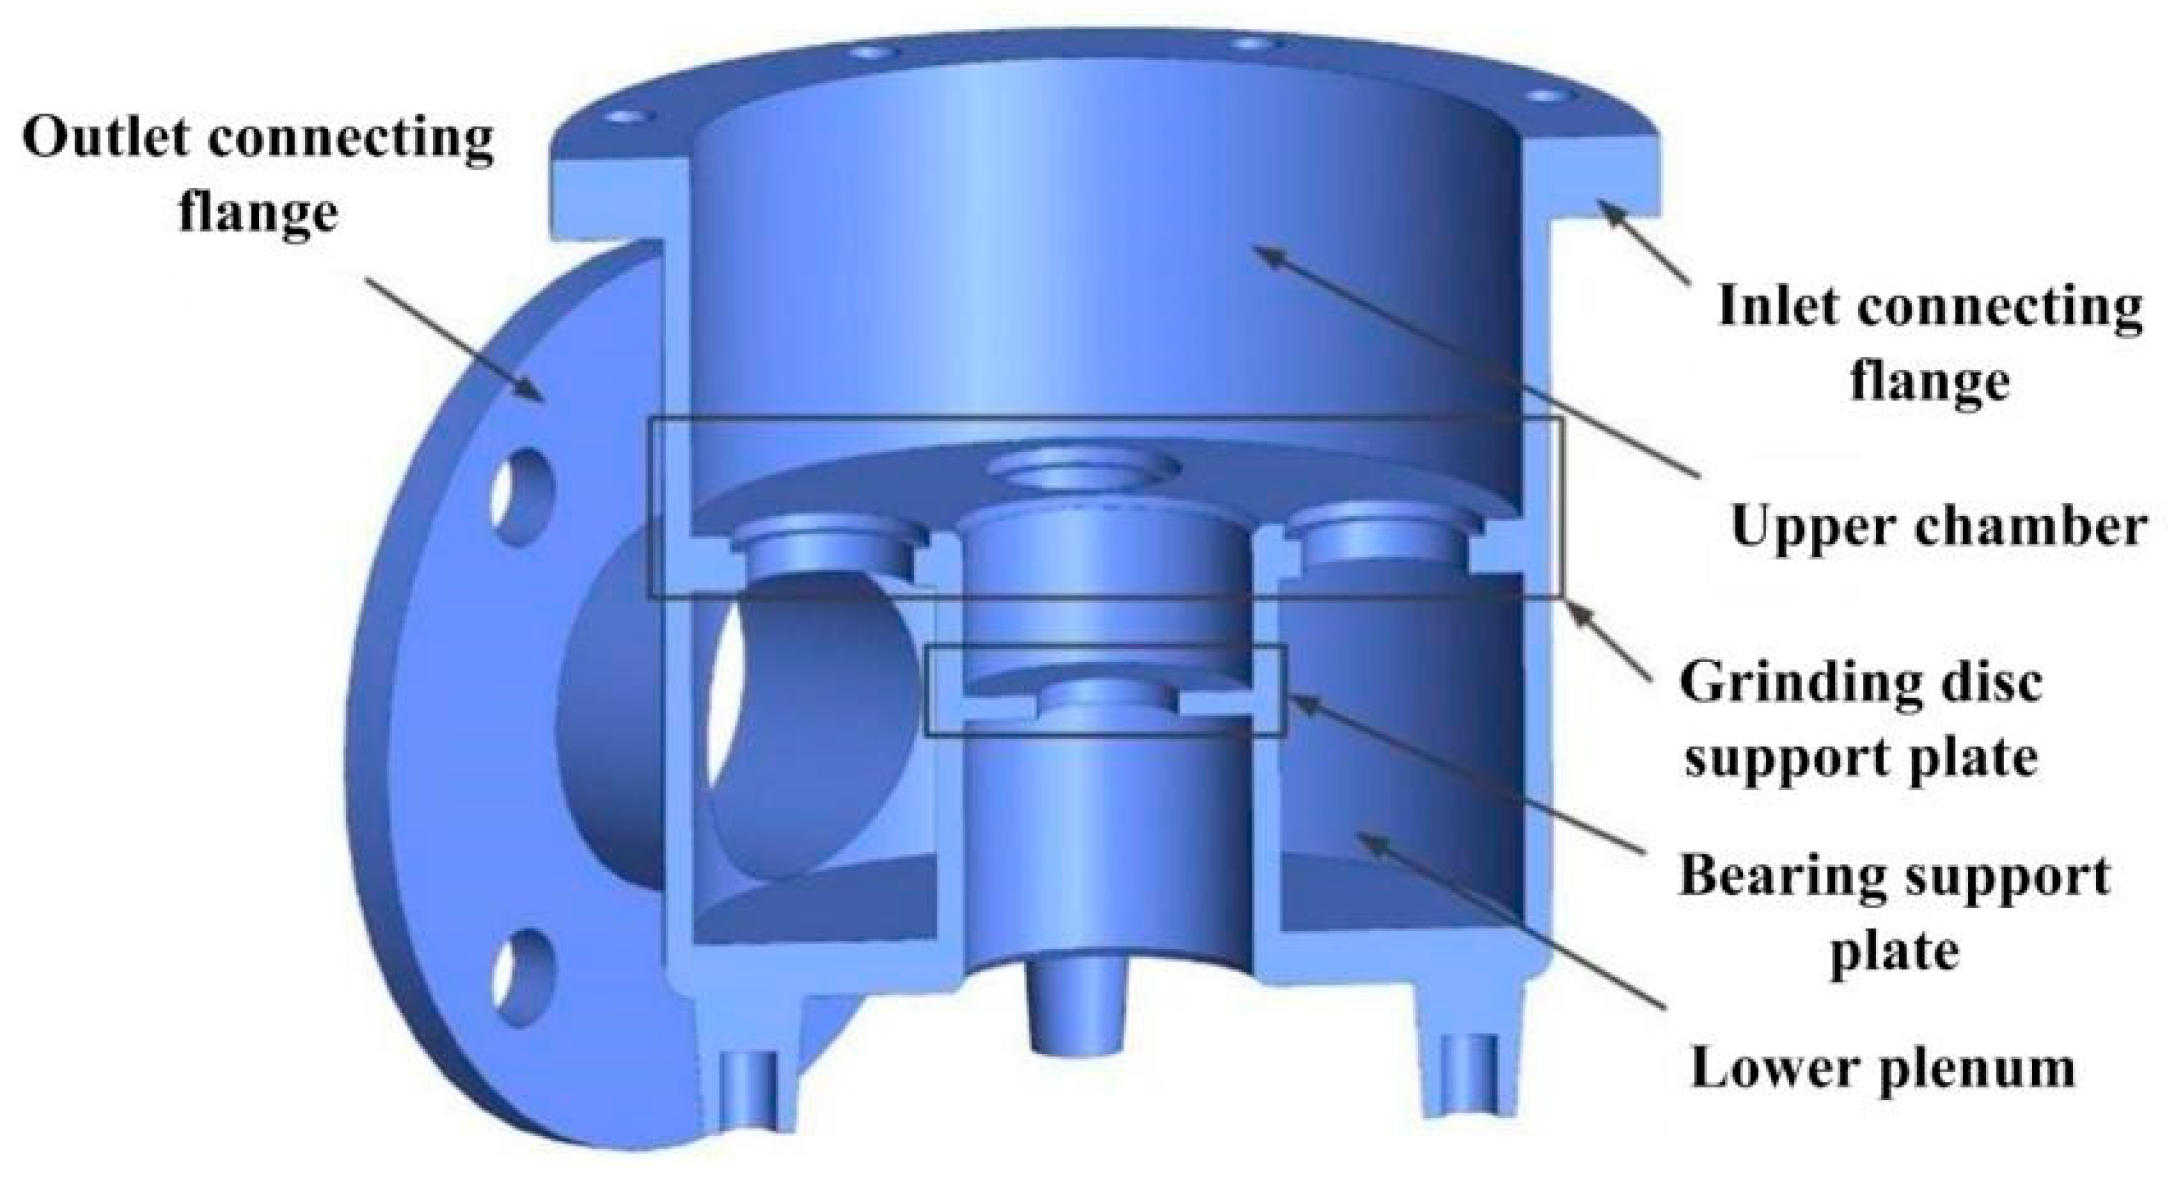
As shown in Figure 3, the design of the laver fluffiness control valve uses part of the structure and principle of a ball valve or gate valve for reference. The structure can be divided into a static part, moving part, and locking support part. The static part is composed of a lower grinding plate, a retaining ring, a gasket, and a valve body. The grinding plate support plate divides the valve body into an upper chamber and a lower chamber. The upper chamber is connected to a high-pressure gas inlet, and the lower chamber is connected to the laver fluffiness pipe, as shown in Figure 4. The moving part is composed of a T-shaped stem, a retainer, an upper grinding plate, and a gasket. The locking support part is composed of a diagonal contact ball bearing, thrust bearing, metal gasket, spring, and locking nut. The spacers at the stationary part and the moving part are used to seal the valve and prevent the leakage of high-pressure gas. In addition, the T-shaped stem, upper grinding plate, lower grinding plate, and grinding disc support plate of the valve body are provided with four identical holes evenly distributed along the circumference.

Figure 3.
Laver fluffiness control valve structure: (a) the relative position angle between section A and section B is 45º; (b) section view with section A as the dividing plane; (c) rotating sectional view with the intersection common line of section A and section B as the axis.

Figure 4.
Valve body structure.
The control valve has a simple structure and reliable operation. When the control valve is working, the lower grinding plate is fixed on the valve body to maintain a static state, and the T-shaped valve stem is driven by a servomotor connected to a reducer to transfer the power to the upper grinding plate so that it rotates relative to the lower grinding plate. When the through-holes of the upper and lower grinding plates overlap each other, the high-pressure gas flows into the lower chamber as the valve is open. When the through-holes of the upper grinding plate and lower grinding plate are completely staggered, the upper chamber of the valve becomes separated from the lower chamber, and the valve is closed.
The novel switch control valve working medium can be clean gas, clean steam, water, or other clean liquid. In the actual operation process, the contact surface of the valve and the medium has no lubricating oil or other pollution sources, meaning that it can be widely used in the food industry. In addition, the valve circulation diameter can reach the size of a large gate valve or ball valve, and as its response speed is not affected by the diameter size, it can reach the response speed of a small solenoid valve. With its large flow, rapid regulating speed, long life, high temperature resistance (260 °C), and adequate safety, this valve can not only be used in seaweed equipment, but it can also be used as a regulating or switch valve in the manufacturing, power, and chemical industries, such as when in need of frequent switching and fast opening.
2.2. Control Valve Characteristics
Compared with traditional valves, the novel switch control valve has the following advantages.
In terms of its structure, the internal structure of the control valve uses plane contact. At the sealing surface, the upper and lower mills have the characteristics of wear compensation and adaptive ability (automatic center-positioning overlap) during the working process. The diameter of the valve can range from dozens of millimeters to dozens of centimeters, and since the valve core switch speed is not affected by the size of the diameter, the valve is suitable for large flow conditions.
In terms of performance, the movement of the spool is controlled by the servomotor and the reducer. The response time of the control valve is about 0.1 ms, and the switching time is 100 ms (from the last closing time to the next closing time). Because the valve uses surface contact sealing, the valve can continuously rotate in a single direction to achieve a switch; hence, compared with the traditional gate or solenoid valve, its one-way action provides a longer service life. In addition, the one-way rotation of the valve core can be achieved four times, which ensures the rapid adjustment of the valve, reduces its range of action, and improves its durability.
In terms of cost and energy consumption, there is no need to use lubricating oil or other consumables during its operation; moreover, the valve is highly stable and does not require regular maintenance. The valve is controlled by a servomotor drive. During the valve’s operation, the servomotor power is 750 W, the output torque is 3.2 N·m, the rated voltage is 220 V, and the operating voltage range is 200 V to 240 V. The servomotor works at 100 ms for 6 s and 24 min for 24 h. Tracking the current change in the servomotor shows that the current is maintained below 3.5 A for long periods (the instantaneous current increases at startup, and the current is maintained below 0.1 A at rest). Compared with traditional valves of the same caliber, the control valve has lower energy consumption.
2.3. Calculation of Flow Area
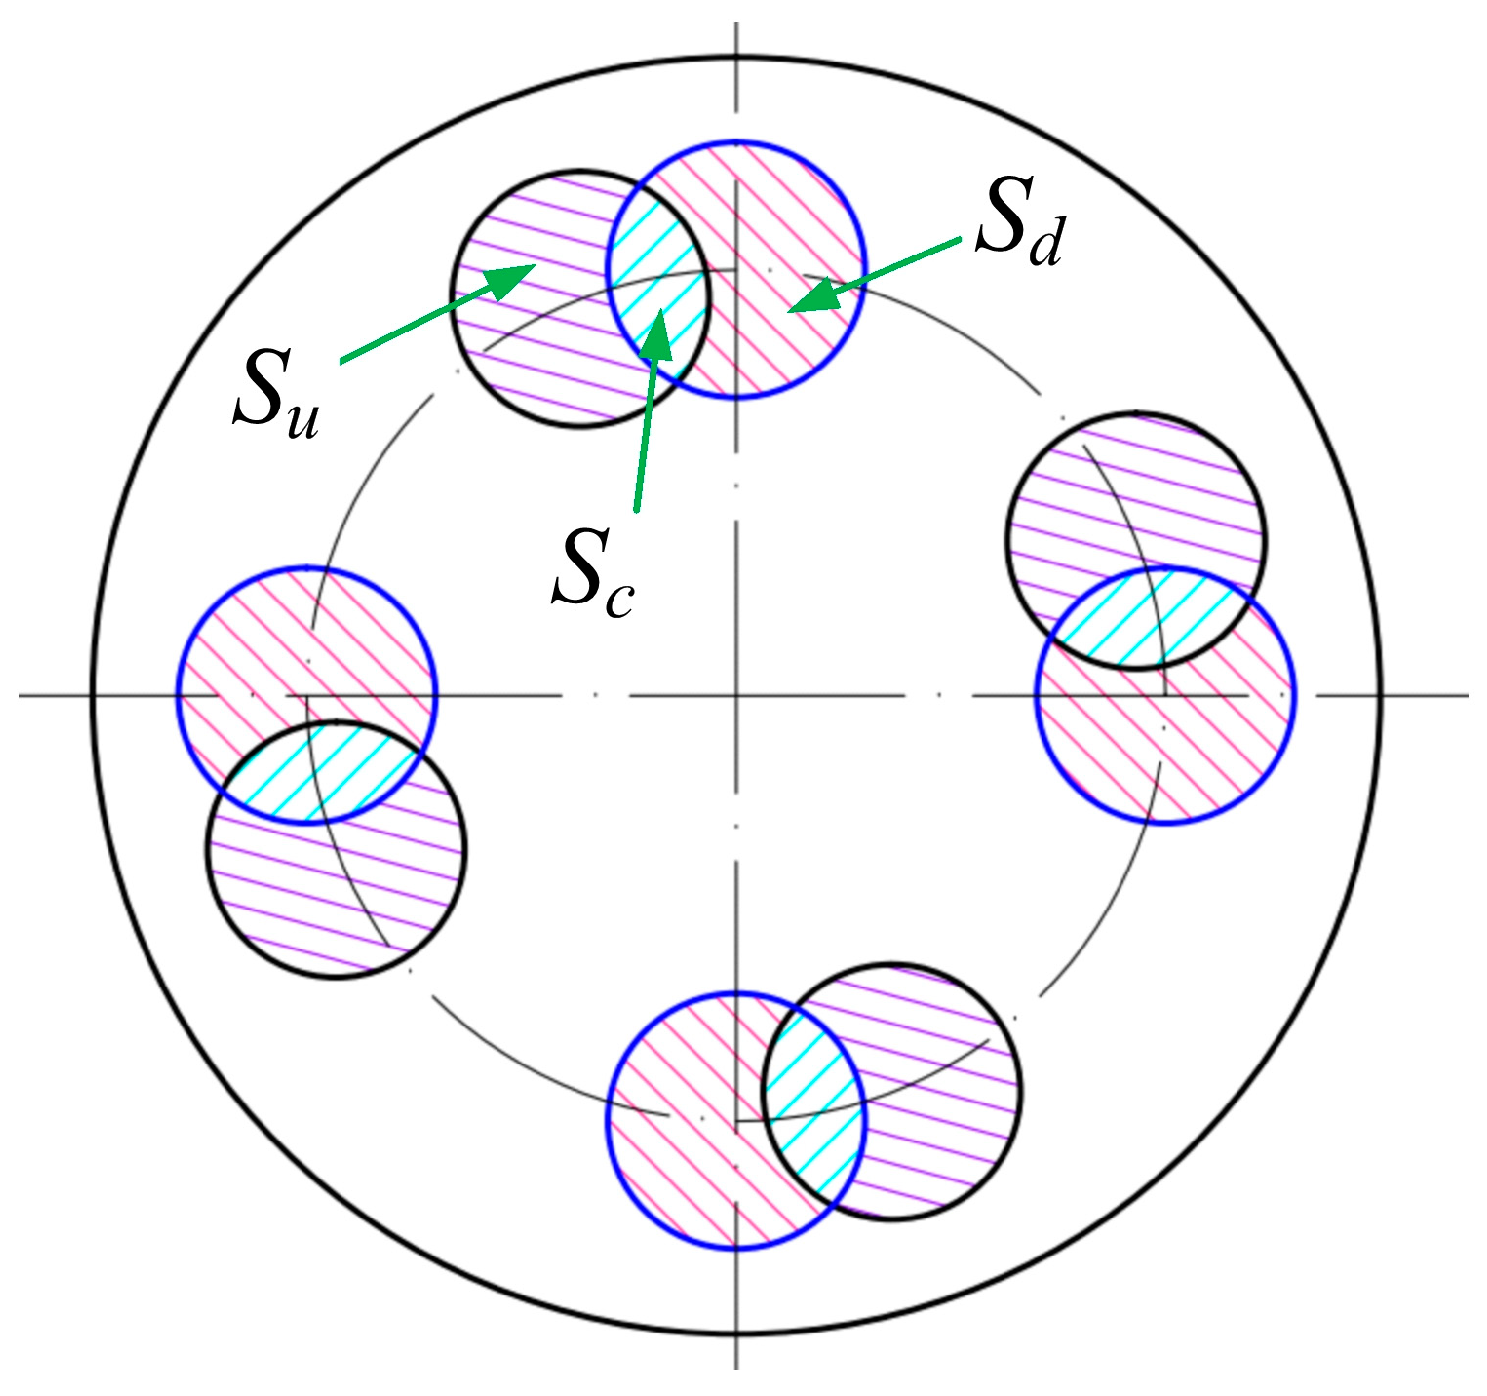
In the laver fluffing process, whether the through-holes of the upper and lower grinding plates overlap determines whether the upper and lower chambers are connected. The friction surfaces of the two grinding plates are shown in Figure 5. Among them, the small black circle and the small blue circle, respectively, represent the through-hole of the upper grinding plate and the through-hole of the lower grinding plate. is the overlapping area of the two grinding plates’ through-holes at a single middle runner, and it is also the flow area of a single middle runner orifice. and are, respectively, the nonoverlapping areas of the upper grinding piece through-hole and the lower grinding piece through-hole at a single middle flow passage. The through-hole of the lower grinding plate is distributed along the circumference and fixed, and that of the upper grinding plate rotates around the distribution center. The opening and closing of the control valve can be expressed as follows. When the value of is not equal to 0, the upper and lower chambers are connected, and the control valve is in the open state. When the value of is equal to 0, the upper and lower chambers are not connected, and the control valve is in the closed state.
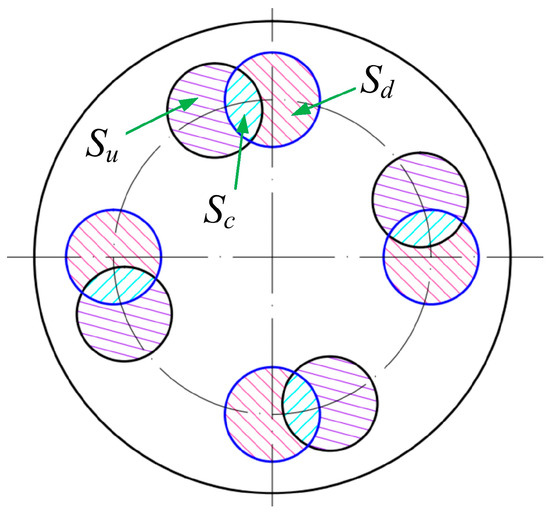
Figure 5.
Schematic diagram of overlapping areas of upper and lower grinding plates.
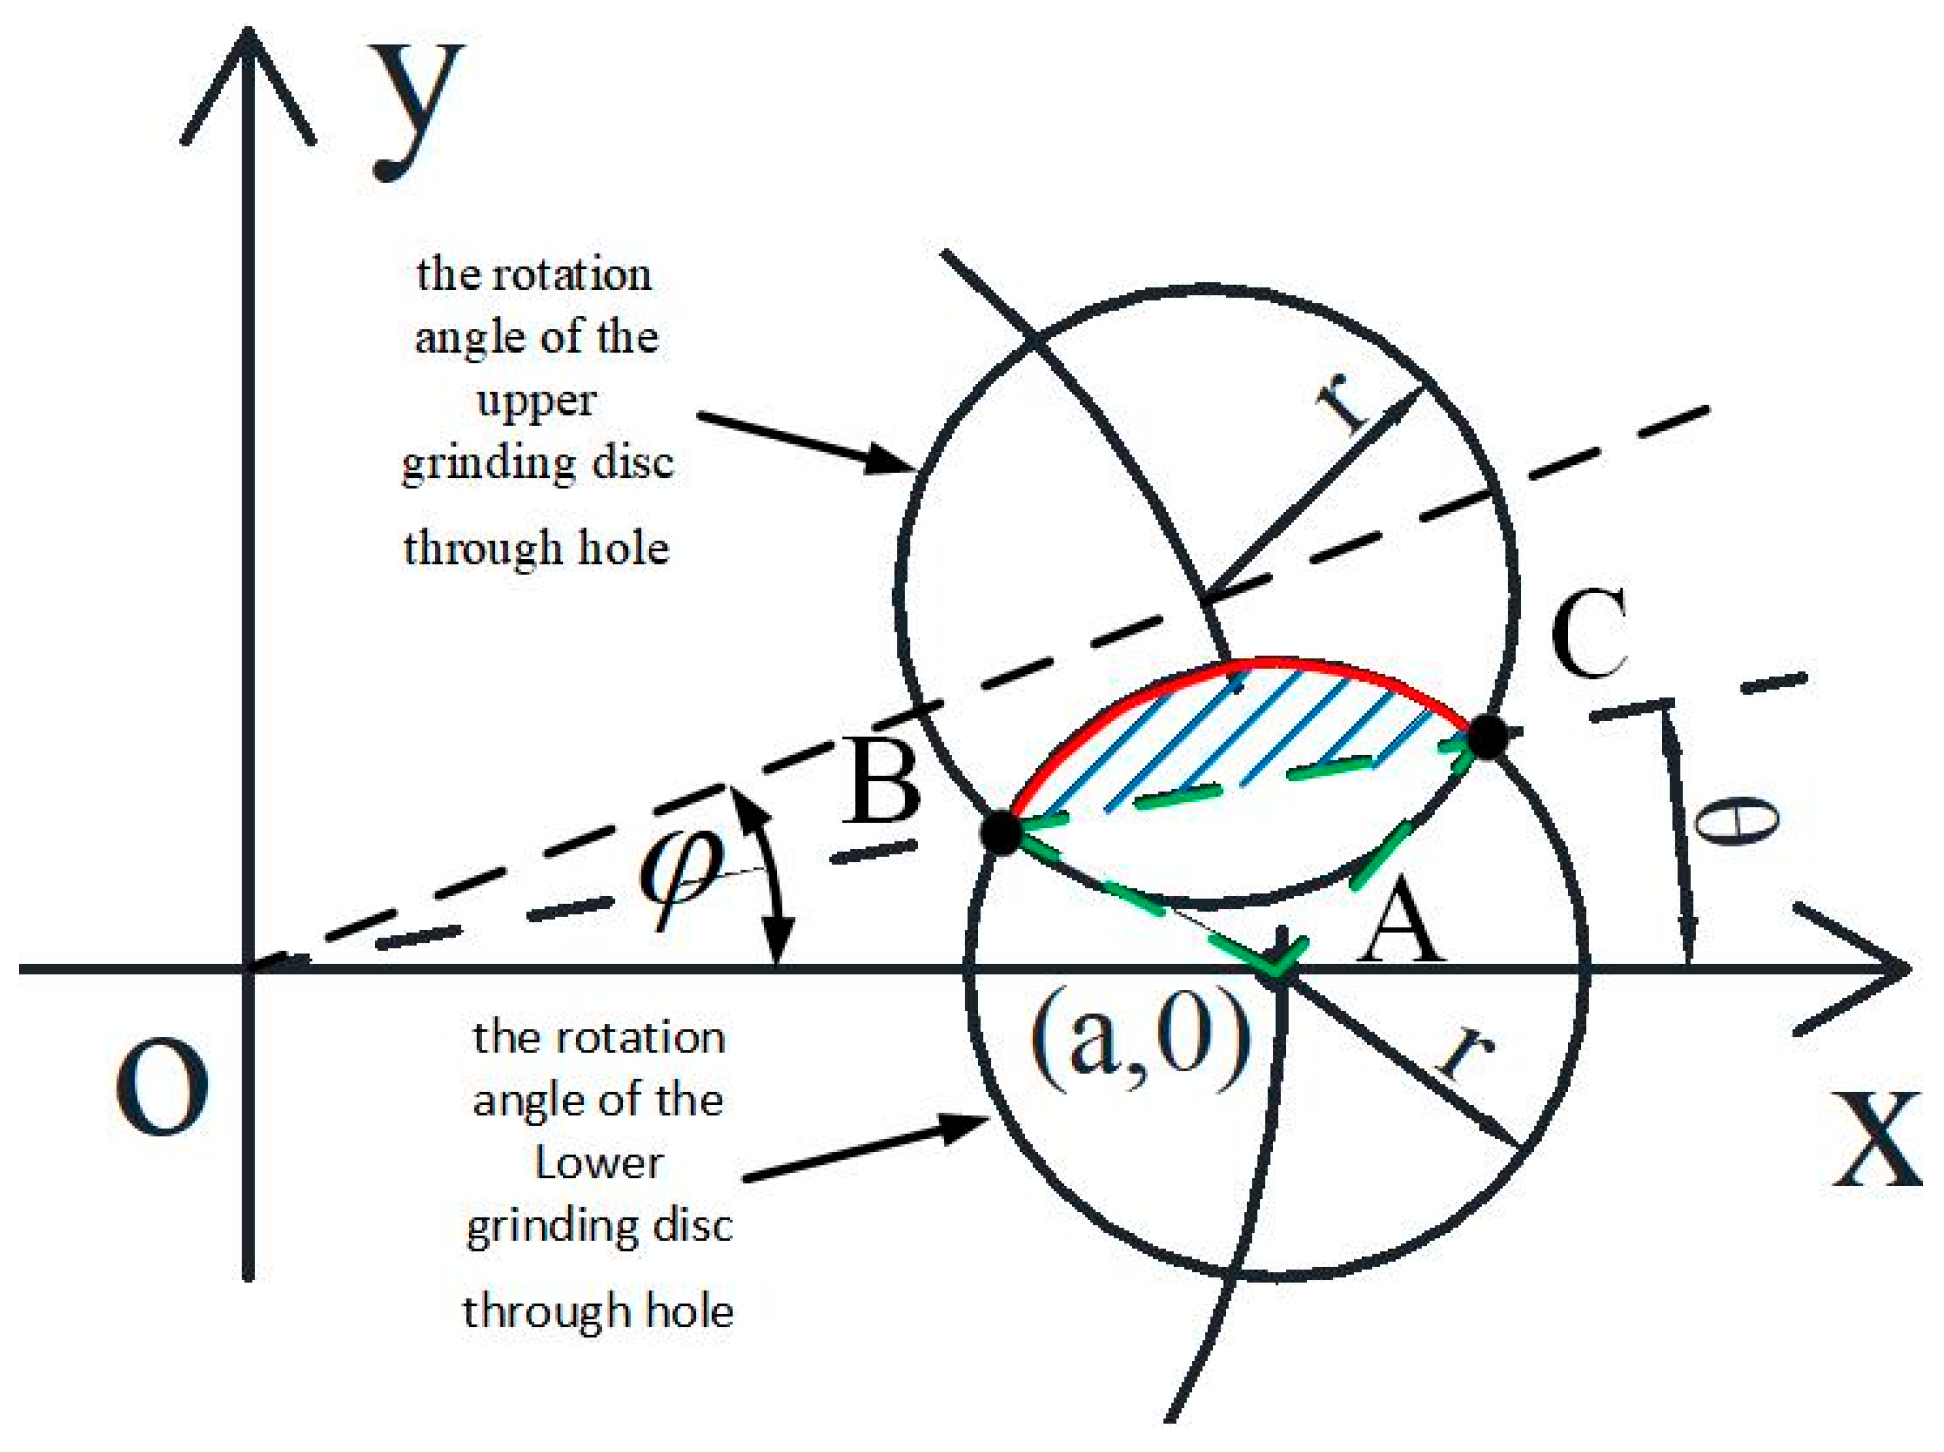
In order to calculate the flow area , a set of overlapping circles, as shown in Figure 5 (i.e., two through-holes in a single middle flow passage), were taken to establish a coordinate system, as shown in Figure 6. In the figure, A is the center of the through-hole of the lower grinding plate; its coordinate is , and the radius of the through-hole is . The angle between the dashed line passing through the origin and the intersection points B and C of the two circles (upper and lower grinding plate through-holes) and the -axis is . is the rotation angle of the upper grinding disc through-hole, and is half of , . The center of the through-hole of the upper grinding plate rotates around the origin O in a circle, and the equation of its motion trajectory is .
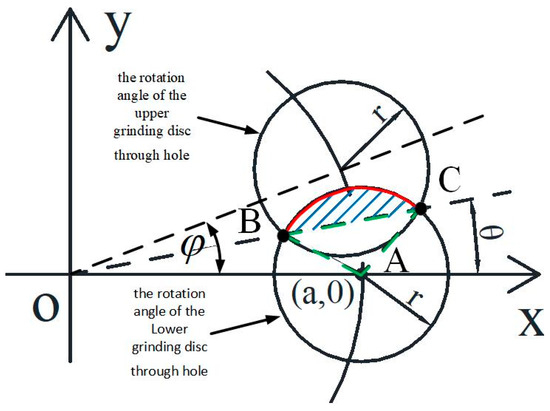
Figure 6.
Position coordinates of the two through-holes of the upper and lower grinding plates.
In Figure 6, half of the flow area of a single channel is equal to the area of sector ABC minus the area of triangle ABC , calculated using the following formula:
The circulation area of a single intermediate runner is equal to two times , and the total flow area of the middle flow channel is equal to four times . From the structural size of the control valve, it can be known that . After the parameters are put into Formula (1), Formula (1) becomes
where the value range of is (0, 17.46°), and the maximum flow area of is 2827.43 mm2.
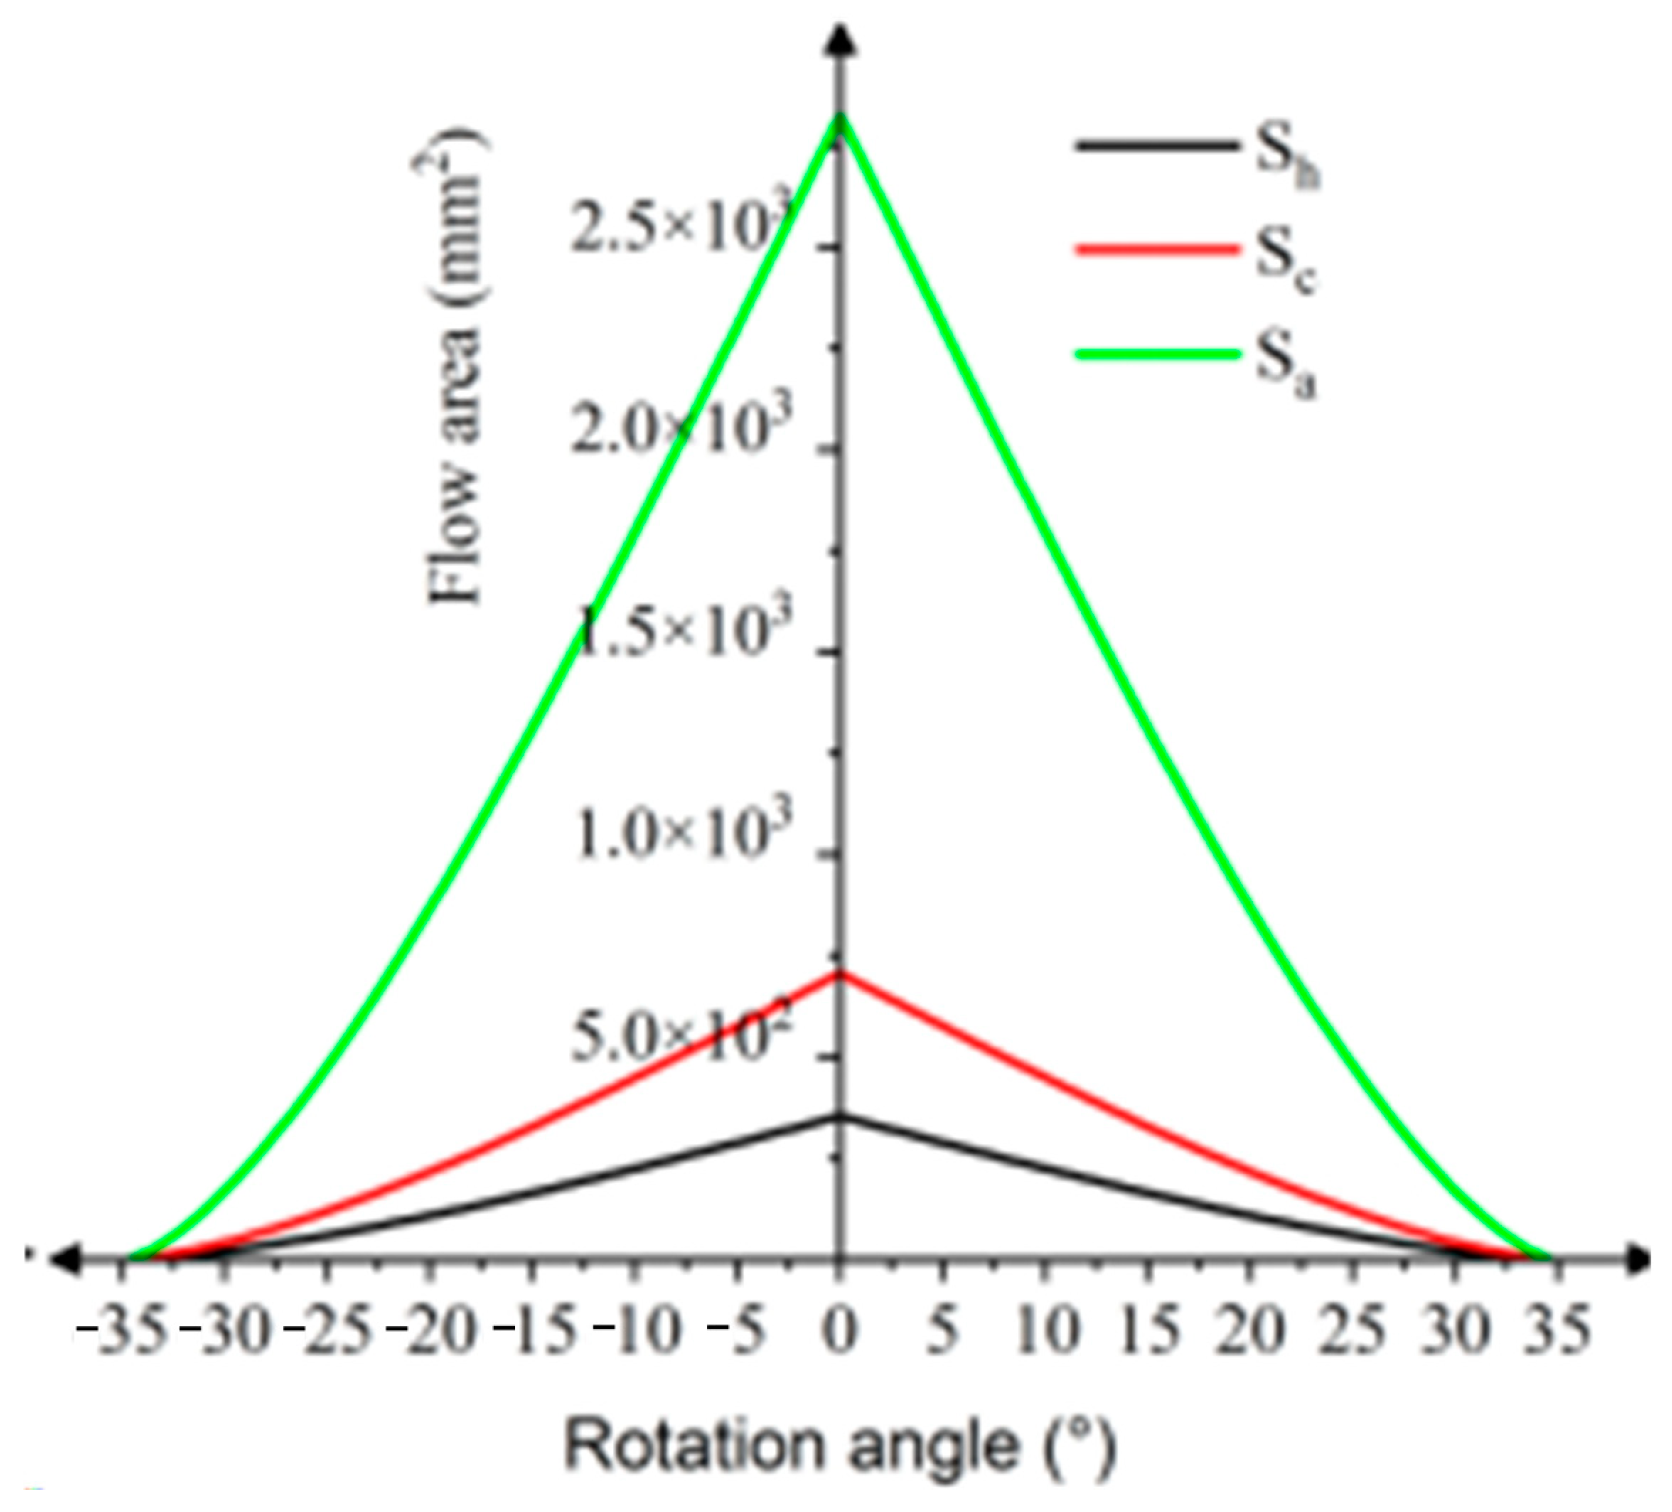
According to Formula (2) of the circulation area, circulation area is a function of the included angle , and , and the value range of is (0, 34.92°). When the through-hole of the upper grinding plate rotates counterclockwise from the shaft, that is, the rotation angle increases slowly from 0 to 34.92°, the flow area decreases from the maximum to 0, and the control valve is in the gradually closed state. When the through-hole of the upper grinding plate rotates counterclockwise from the lower side of the shaft to the shaft, that is, the rotation angle slowly increases from −34.92° to 0, the flow area increases from 0 to the maximum, and the control valve is in the gradually open state. Among them, when the rotation angle is 0, the flow area reaches the maximum and the control valve is fully opened. When the rotation angle is −34.92° or 34.92°, the flow area is 0 and the control valve is completely closed. Therefore, Formula (2) is translated into the following:
According to Formula (3), the curve of the relation between circulation area , , , and rotation angle was plotted, as shown in Figure 7. When the rotation angle gradually increases from −34.92° to 34.92°, the control valve changes from fully closed to fully open, and then from fully open to fully closed, to achieve a complete opening and closing cycle. Taking the flow area as an example, it can be seen that when the rotation angle increases from 0 to 25°, the flow area decreases with the increase in the rotation angle , which is approximately linear. When the rotation angle increases from 25° to 34.92°, the decreasing rate of the flow area gradually decreases, which is approximately parabolic.

Figure 7.
Relationship between the flow area and rotation angle of the laver fluffiness control valve.
3. Simulation Analysis of Flow Field of Laver Fluffiness Control Valve
3.1. Modeling and Meshing
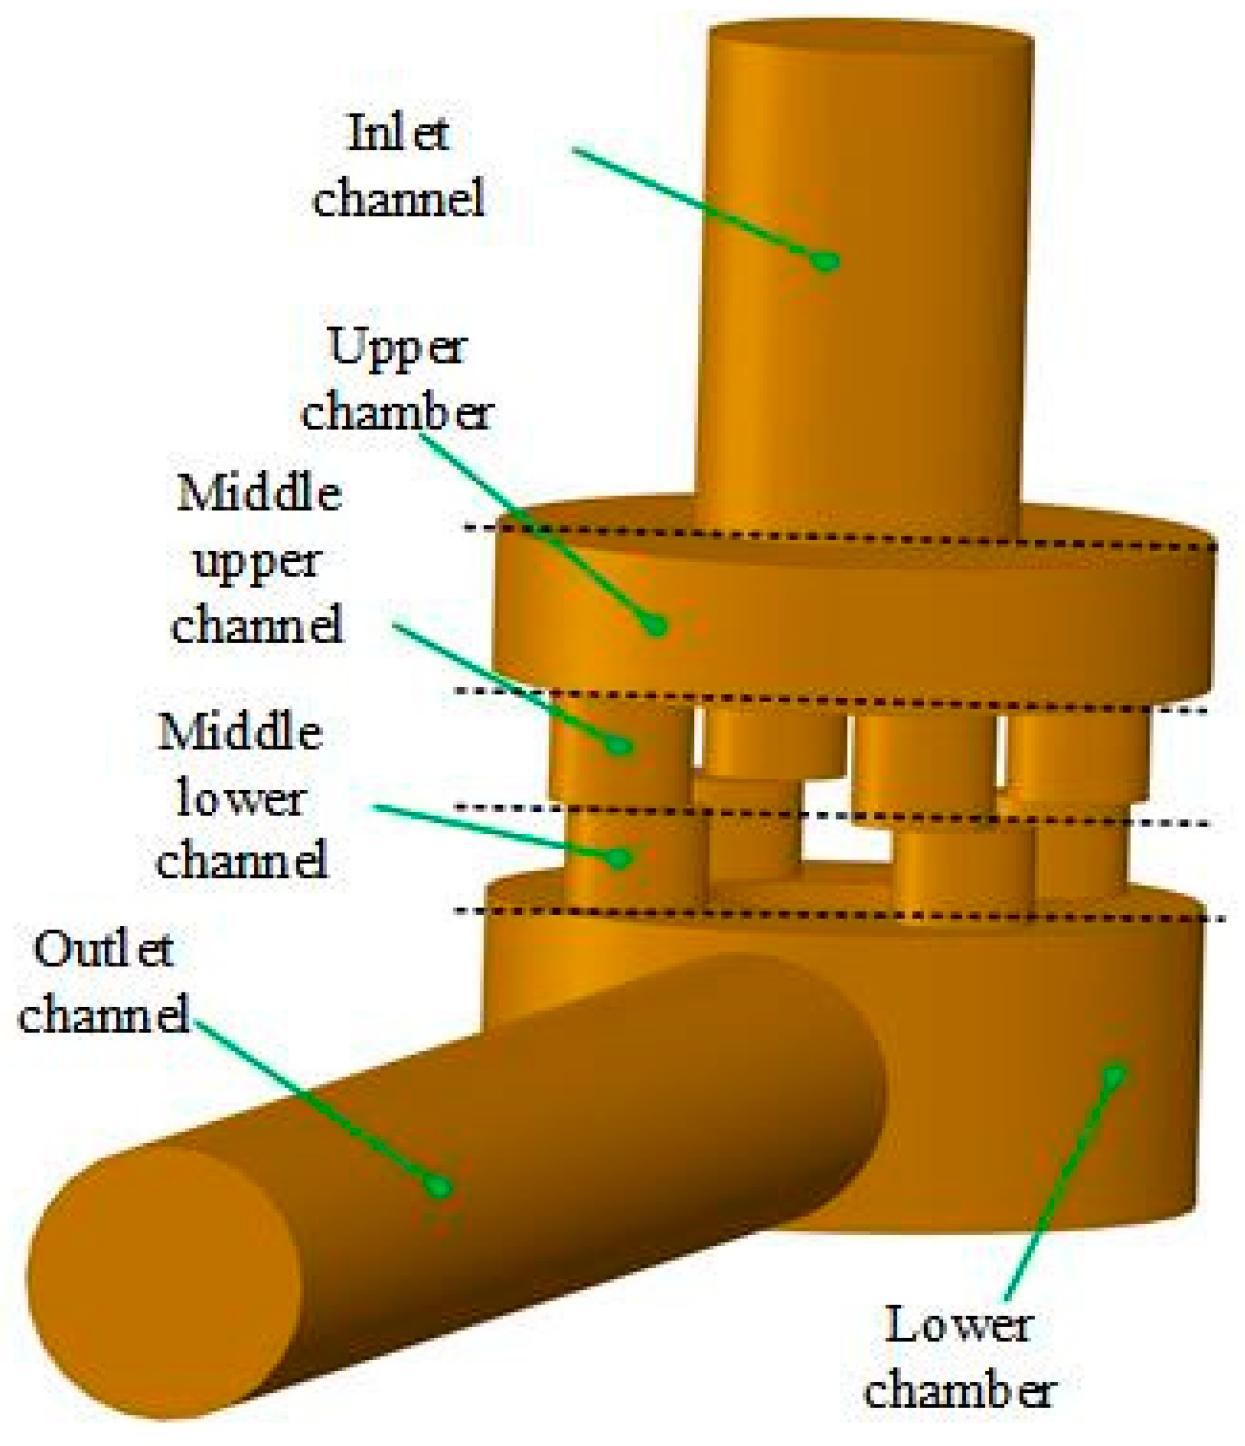
SolidWorks 2022 software was used to create a three-dimensional model of the flow field in the laver fluffiness control valve, and its structural parameters are shown in Figure 8. Among them, the inlet pipe diameter is 68 mm, the outlet pipe diameter is 60 mm, and the middle flow pipe diameter is 30 mm. To ensure the full flow of fluid, the inlet of the valve was extended by twice the diameter of the pipe, and the outlet was extended by six times the diameter of the pipe.
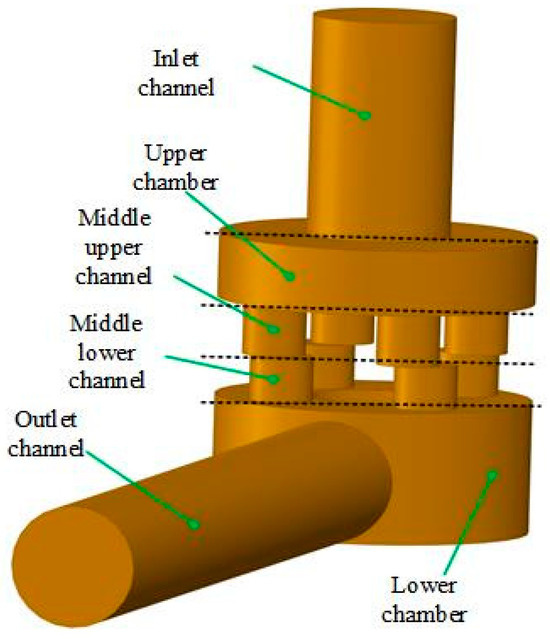
Figure 8.
Flow field model of laver fluffiness control valve.
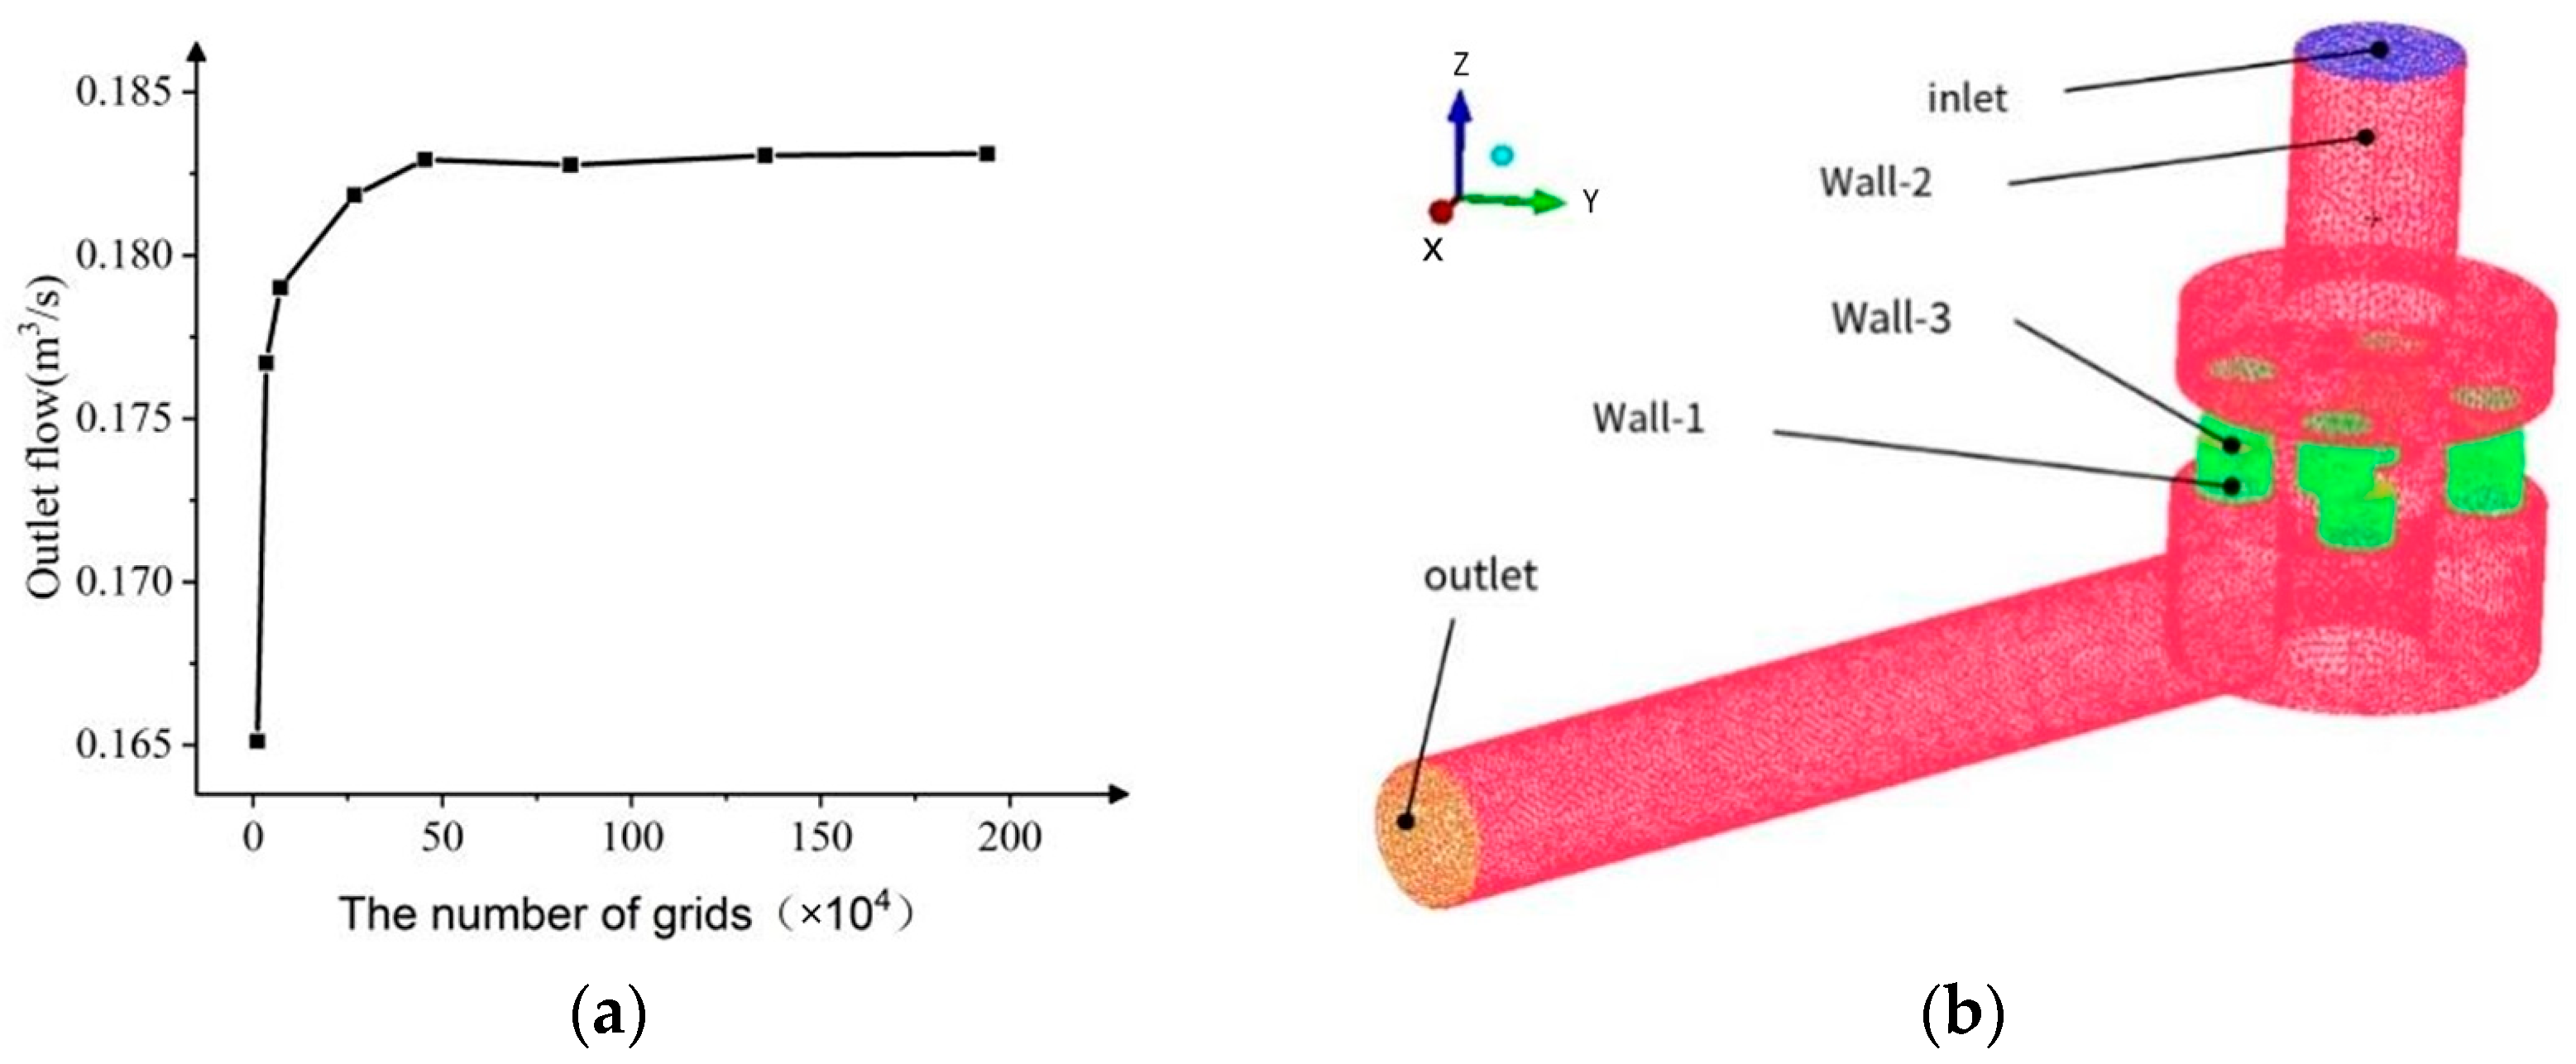
Grids were generated in ICEM and were divided using unstructured grids. In order to avoid the influence of the number of grids on the numerical calculation, grid independence verification was carried out, and the valve outlet flow rate was used as the evaluation parameter. As shown in Figure 9a, when the number of grids is greater than 450,000, the valve outlet flow does not change, so this scheme was selected as the simulation model. At the same time, through the grid quality test, the minimum orthogonal mass under the grid scheme was greater than 0.3, and the minimum angle was more than 18°, which met the grid quality requirements required for calculation. Figure 9b shows the grid model of the flow field inside the control valve.

Figure 9.
Grid independence verification and grid model: (a) grid independence verification; (b) grid model.
3.2. Setting of Boundary Conditions and Related Parameters
The CFD simulation software ANSYS Fluent was used to carry out CFD simulation calculation on the internal flow field of the control valve, and the completed grid model division was imported into Fluent for setting [18]. As the fluffing of laver is a food processing technology, its fluffiness requires high-pressure dry air. Therefore, air was selected as the fluid medium, and its density value was set to 11.69 kg/m3. The boundary condition at the entrance of the model was set as the pressure entrance, and the value was 1 MPa. The outlet boundary condition was set as the pressure outlet with a value of 0.9 MPa.
A realizable model suitable for engineering problems was selected as the turbulence model, and a standard wall function model was used. The pressure velocity coupling equation adopted the SIMPLE semi-implicit connection pressure equation [19]. During spatial discretization, the gradient difference was interpolated using the least squares method based on the unit volume; the pressure difference was in the standard format; the momentum equation was in the first-order upwind format; and the turbulent kinetic energy equation, turbulent dissipation rate equation, and energy equation were all in the second-order upwind format [20,21].
4. Analysis of Results
4.1. Control Valve Flow Regulation Characteristics
4.1.1. Relative Volume Flow Rate and Flow Coefficient of the Control Valve
The flow characteristics of a valve refer to the relationship between the relative flow rate of the medium flowing through the valve and the relative stroke. Here, the flow regulation characteristic function expression of the control valve can be expressed as [22]
where is the rotation angle of a certain opening, is the rotation angle of full opening, is the flow rate when the rotation angle is , is the maximum flow rate of the valve, represents the relative flow rate, and represents the relative angle and is also the opening degree.
The flow coefficient is an indicator for evaluating the flow capacity of the control valve, representing the flow rate of the fluid medium under a pressure difference of 1 bar. The value of is closely related to the flow area, and its expression is [23,24]
where is a transformation parameter (equal to 0.865), is the reference density of the fluid, and is the pressure difference (bar) between the valve inlet and outlet.
As the flow area at the orifice is one of the main factors affecting the flow at the outlet of a control valve, the flow area was used to divide the opening degree. Eight openings were selected as the following: 5%, 10%, 15%, 20%, 40%, 60%, 80%, and 100%. The rotation angle and flow area of the control valve under different openings were calculated, as shown in Table 1.

Table 1.
Relationship between rotation angle and flow area.
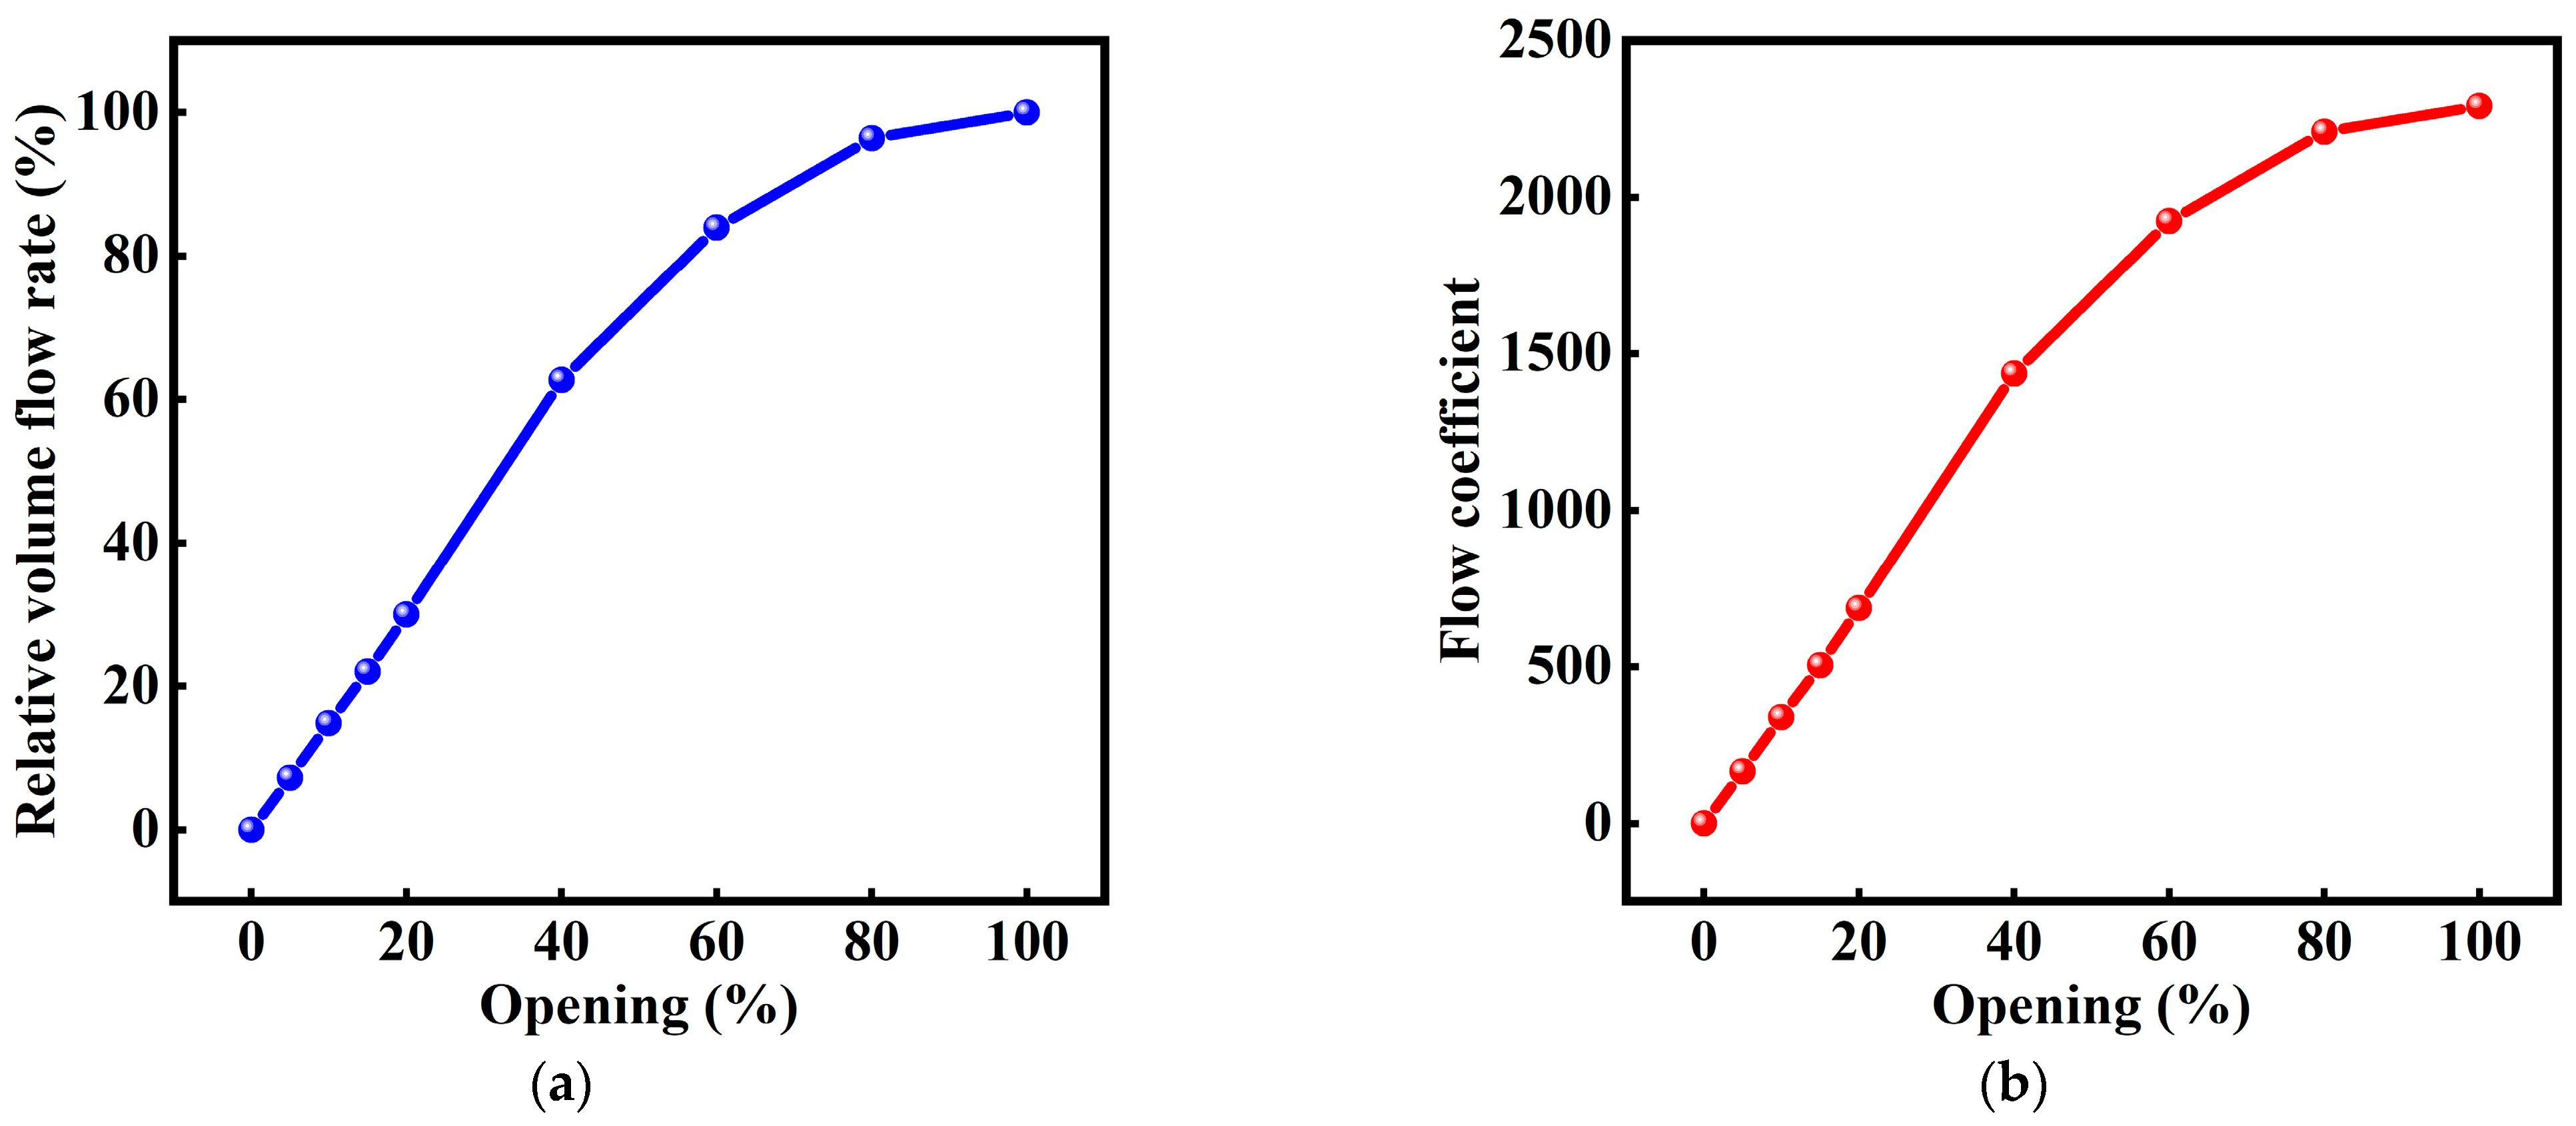
Through a numerical simulation calculation, the volume flow rate and relative volume flow rate of the control valve with different opening degrees were obtained. Due to the pressure difference between the valve inlet and outlet being set to 1 bar during the simulation calculation, the flow coefficient was further calculated based on the volume flow rate, as shown in Table 2. According to the opening and relative volume flow, the flow regulation characteristic of the control valve was represented by the relative volume flow, and the flow regulation characteristic curve was drawn, as shown in Figure 10a. According to the opening and flow coefficient, the flow coefficient curve was drawn, as shown in Figure 10b.
Table 2.
Volume flow and flow coefficient with different valve openings.
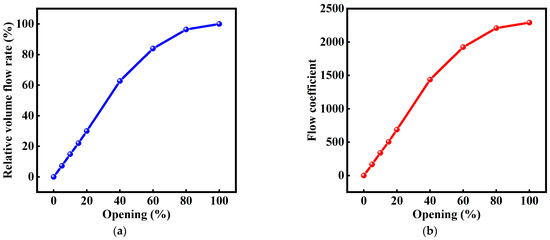
Figure 10.
Control valve flow regulation characteristic and flow coefficient curves: (a) flow regulation characteristic curve; (b) flow coefficient curve.
As can be seen from Figure 10a, when the opening is less than 40%, the relative volume flow approximately increases linearly with the increase in the opening. When the opening is greater than 40%, the relative volume flow increases approximately in a parabolic fashion, and the growth trend slows down, but the flow area increases linearly with the opening. Therefore, when the opening is greater than 40%, the influence of the total flow area on the volume flow of the control valve is weakened with the increase in the opening. When the opening is 100%, the volume flow of the control valve is 0.1831 m3/s. As shown in Figure 10b, the trend of flow coefficient variation is similar to that of relative volumetric flow rate variation. The flow coefficient rises with the increase in the valve opening. When the opening is less than 40%, the flow coefficient shows a linear growth trend. The flow coefficient is approximately parabolic when the opening is greater than 40%, enhancing the flow capacity of the valve.
4.1.2. Experimental Validation
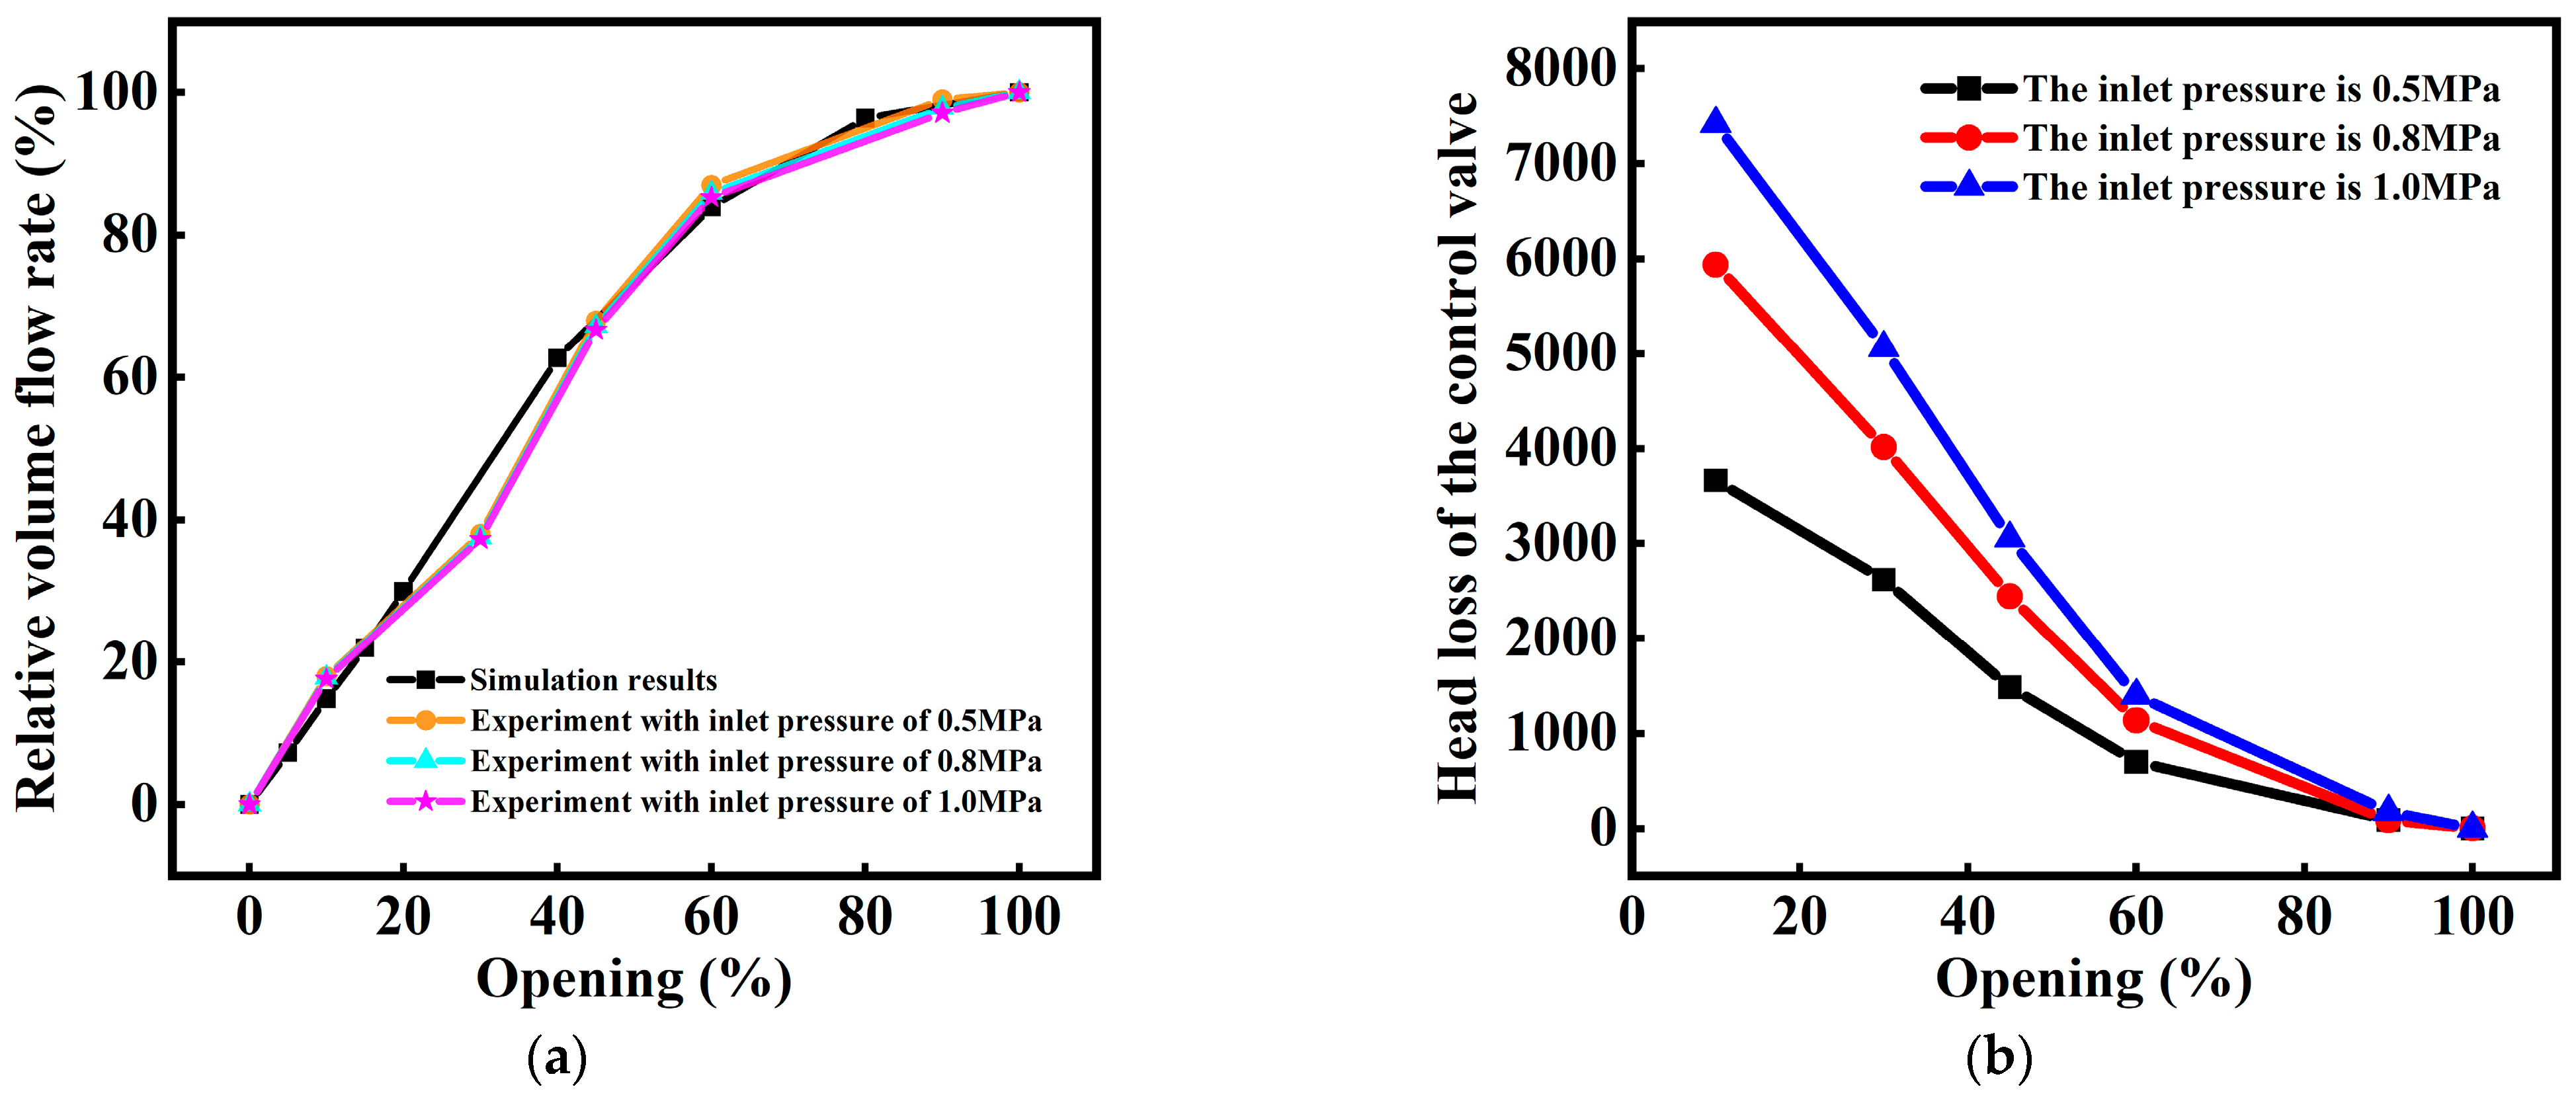
In order to validate the numerical method, the simulation results were compared to the experimental results. The experiment was conducted on the laver processing equipment shown in Figure 1. During the experiment, different inlet pressures were set for the control valve, and the volume flow rate of the valve outlet at different valve openings was measured, as shown in Table 3, Table 4 and Table 5. The experimental results and simulation results of the relative volume flow rate are shown in Figure 11a.
Table 3.
Volume flow rate obtained from experiments at different openings with a valve inlet pressure of 1 MPa.
Table 4.
Volume flow rate obtained from experiments at different openings with a valve inlet pressure of 0.8 MPa.
Table 5.
Volume flow rate obtained from experiments at different openings with a valve inlet pressure of 0.5 MPa.
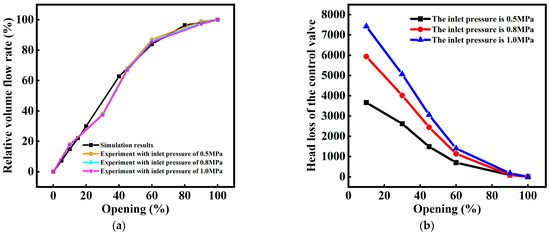
Figure 11.
Experimental validation results and control valve’s head loss: (a) comparison between experimental and simulation results for relative volume flow rate; (b) head loss curve.
From Figure 11a, it can be concluded that the simulation results are in accord with the experimental results and that the simulation is accurate and has referential value. However, when the valve opening was in the range of 20% to 40%, the simulation result was slightly larger than the experimental result. This may have been caused by simulation truncation error and assumptions such as the valve being an ideal valve that has precise right angles with sharp edges.
4.2. Head Loss of the Control Valve
The head loss of a control valve represents the pressure loss when a fluid flows through a valve, and the expression for this head loss is obtained through the Bernoulli equation [25]:
where and are the inlet and outlet pressures [Pa] of the valve, respectively, and is the gravitational acceleration.
According to the results in Table 3, Table 4 and Table 5, the head loss of the control valve was calculated, as shown in Figure 11b.
From Figure 11b, it can be seen that when the inlet pressure of the valve is 0.5 MPa, the valve core has a large head loss at the small valve opening. As the valve opening increases, the head loss shows a decreasing trend: when the opening is less than 60%, the head loss decreases quickly, while when the opening is greater than 60%, the head loss slowly decreases. As the inlet pressure of the valve increases, the head loss continuously increases at the same opening, and when the opening is small, the variation in head loss is more significant. When the inlet pressure of the valve changes to 1 MPa, the head loss sharply decreases when the valve core opening is less than 60%.
4.3. Mechanical Characteristics of the Upper and Lower Chambers of the Control Valve
4.3.1. Force on Bottom Surface of the Upper Chamber
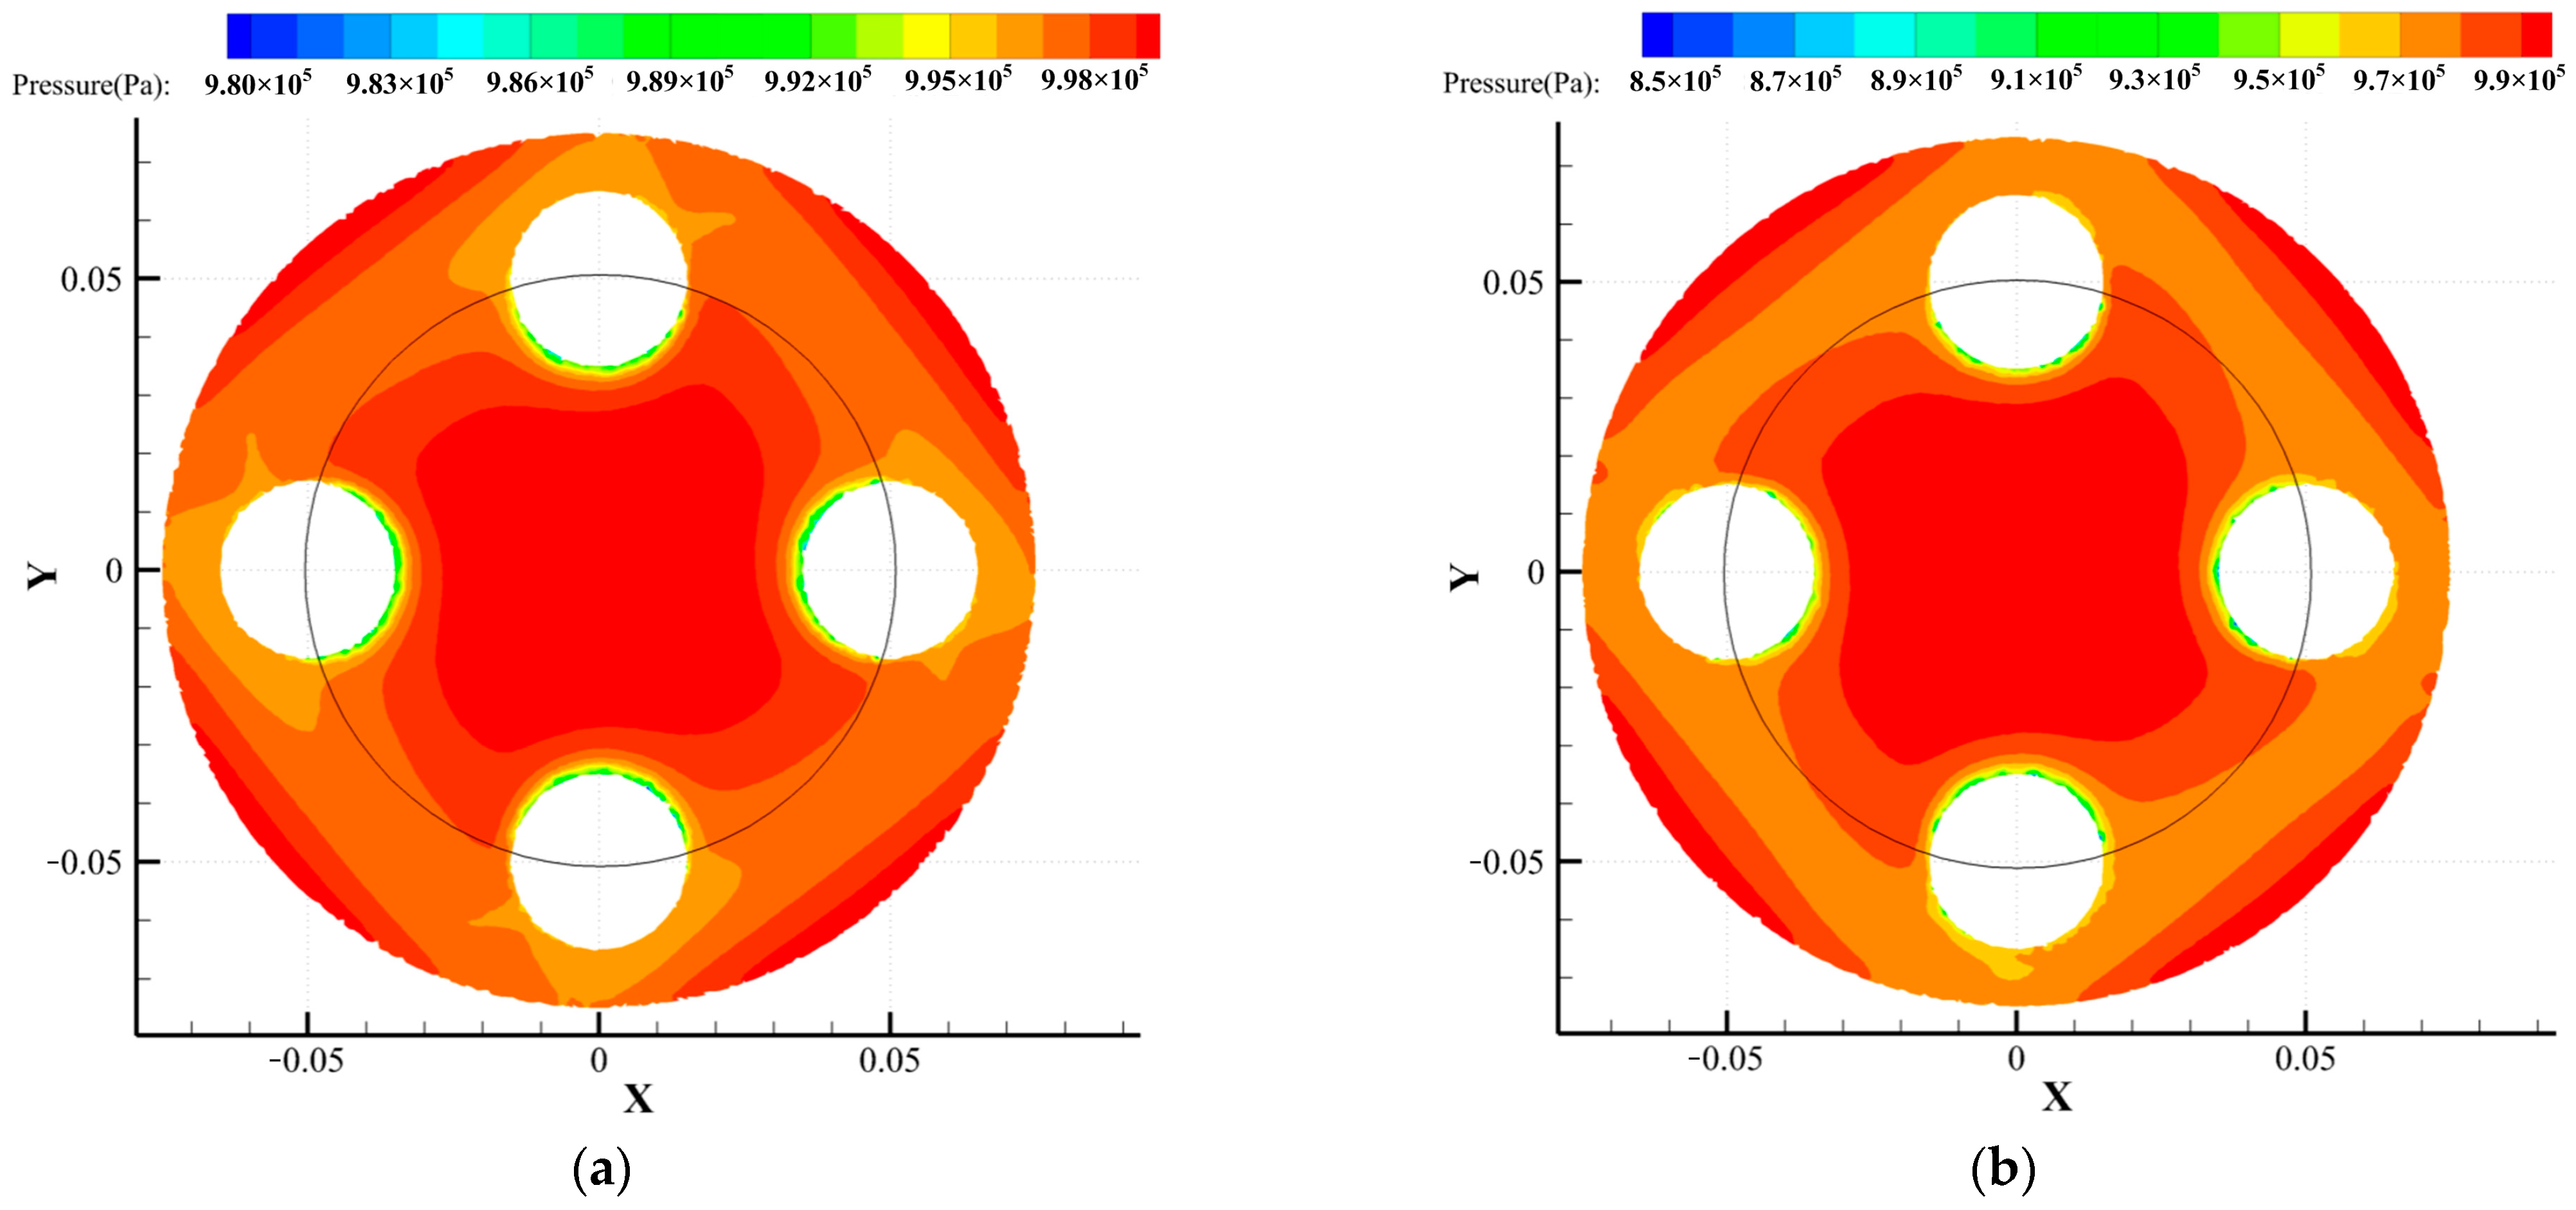
When the fluid flows through the control valve, it enters the upper chamber from the entrance and impacts the bottom surface of the upper chamber, and then flows into the lower valve chamber through the orifice. Due to the obstruction of the wall surface, it has an impact effect. The pressure contours of the upper cavity and the lower cavity wall at opening degrees of 20% and 100% were extracted, respectively, as shown in Figure 12 and Figure 13. The force changes in the wall surface of the control valve were further analyzed through the changes in pressure.
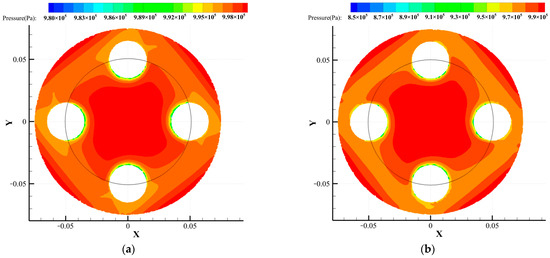
Figure 12.
Pressure cloud map of the bottom surface of the upper cavity: (a) 20%; (b) 100%.
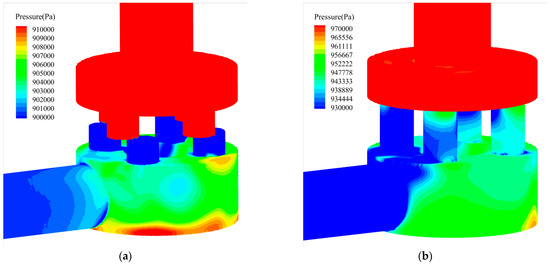
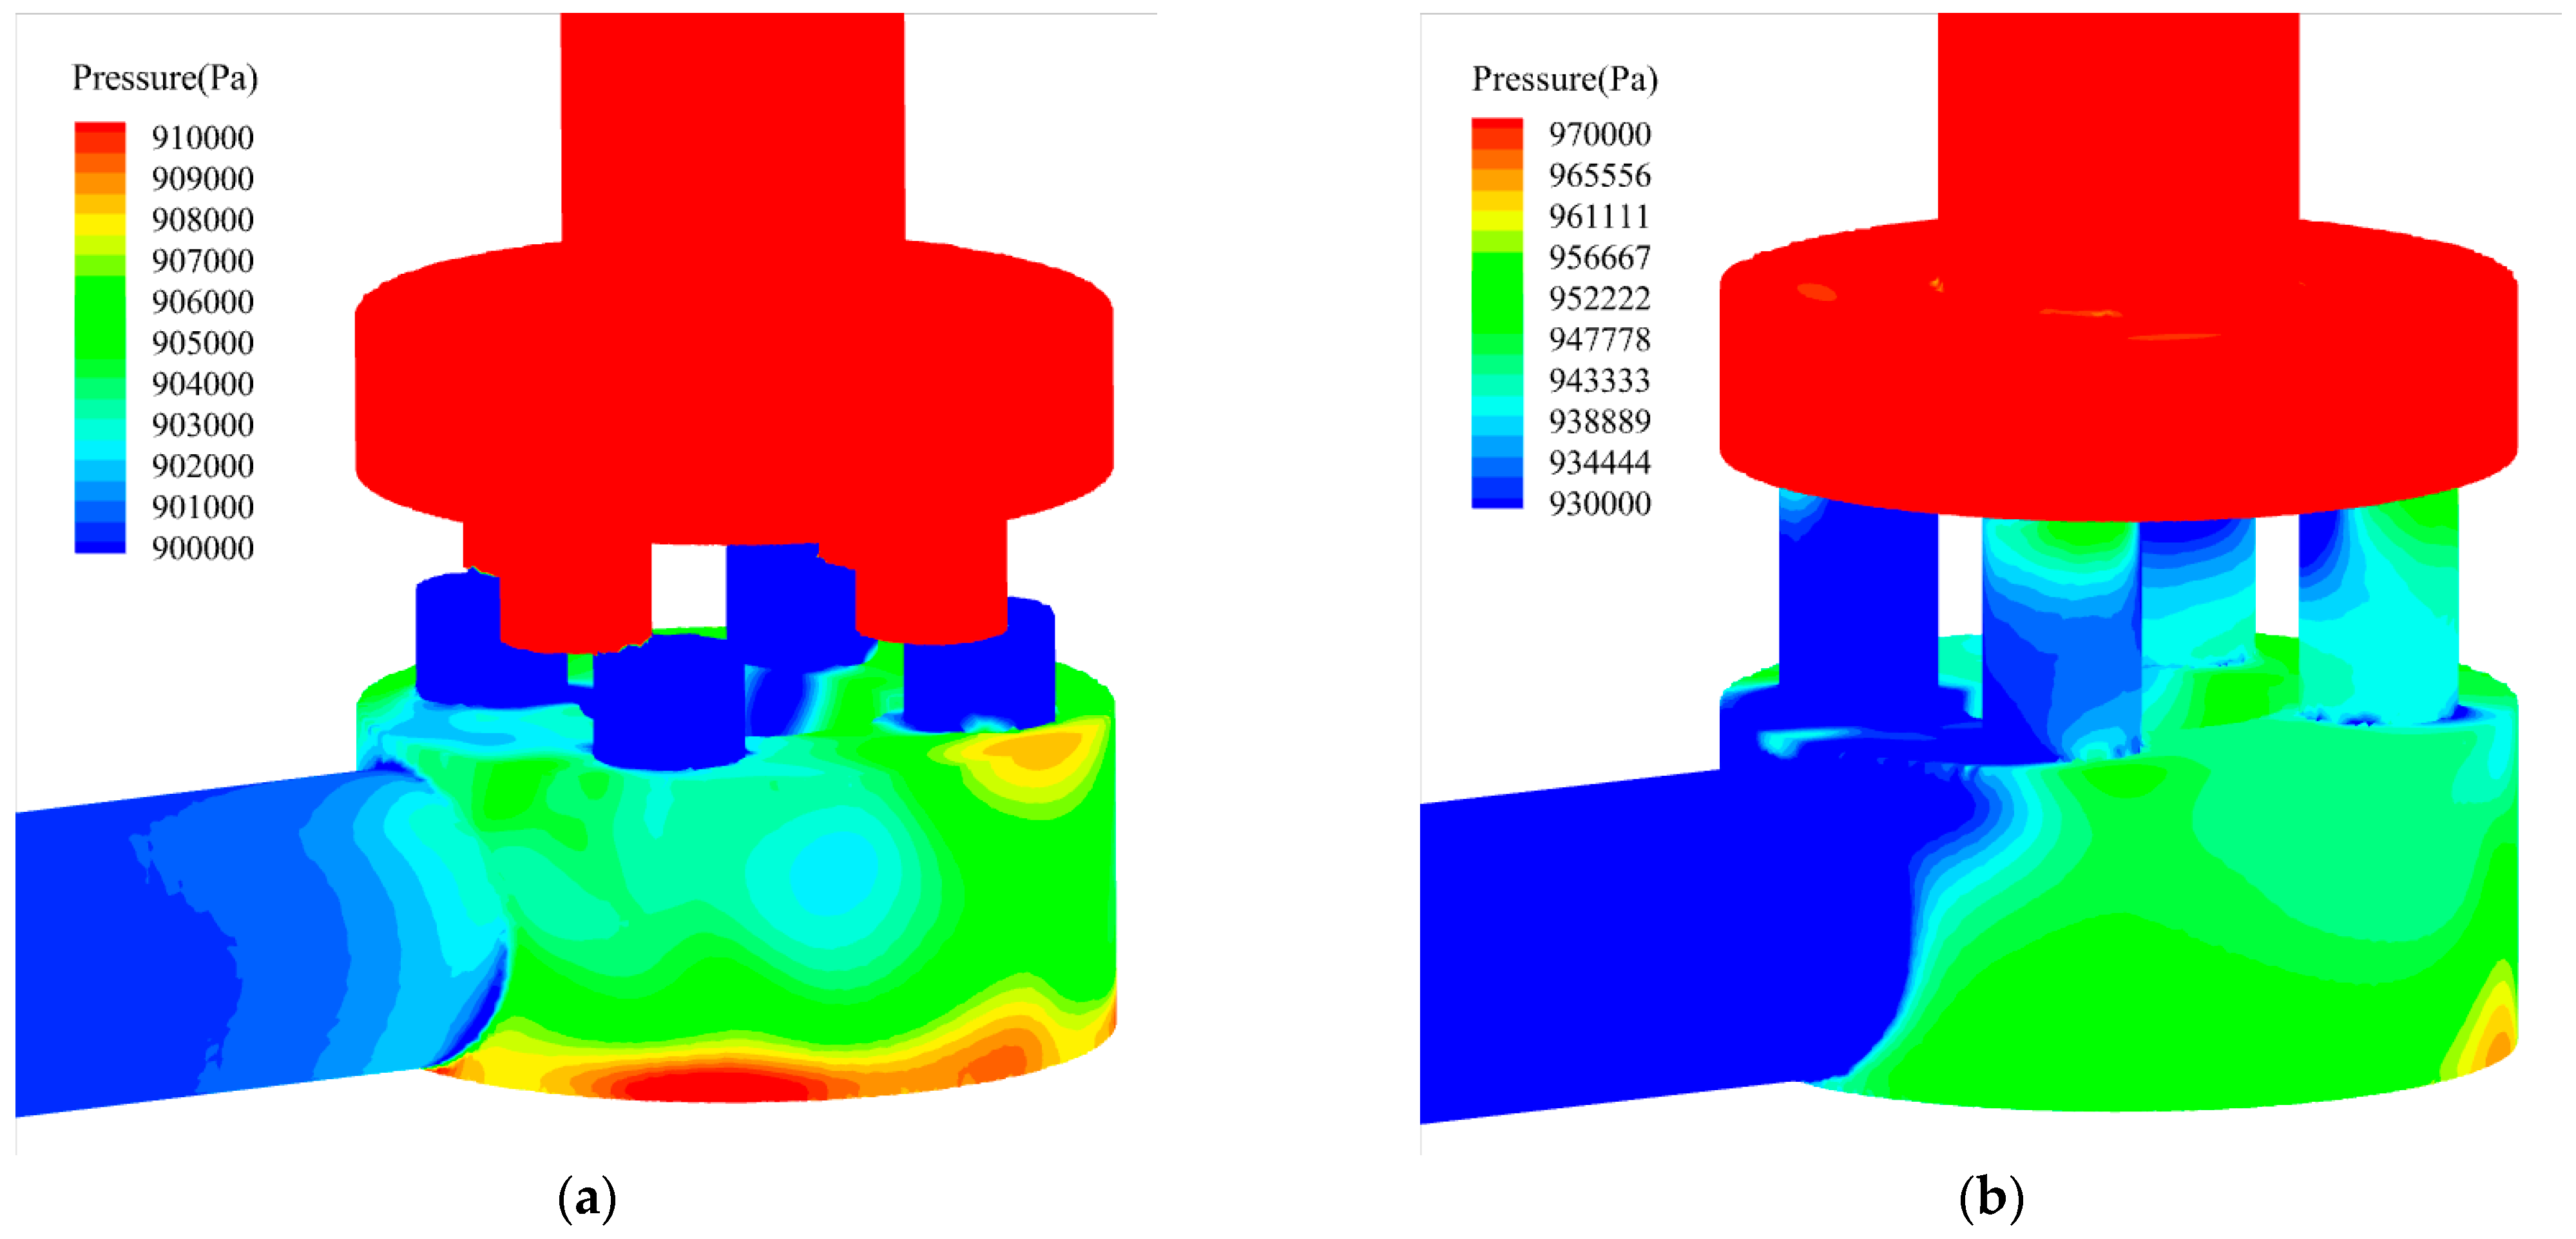
Figure 13.
Pressure cloud map of the lateral wall surface of the lower cavity: (a) 20%; (b) 100%.
As can be seen from Figure 12, the stress distribution trend of the bottom surface of the upper cavity is basically the same at 20% opening and 100% opening. The difference is that compared with 20% opening, the overall value of the pressure distribution at 100% opening shows a decreasing trend. Moreover, due to the fluid impact on the bottom surface of the lower cavity and the side wall, there is a large high-pressure area in the center of the bottom surface of the upper cavity, between the two holes and near the side wall. In addition, at the inner edge of the through-hole, there is a small low-pressure area.
4.3.2. Stress on the Wall of the Lower Cavity
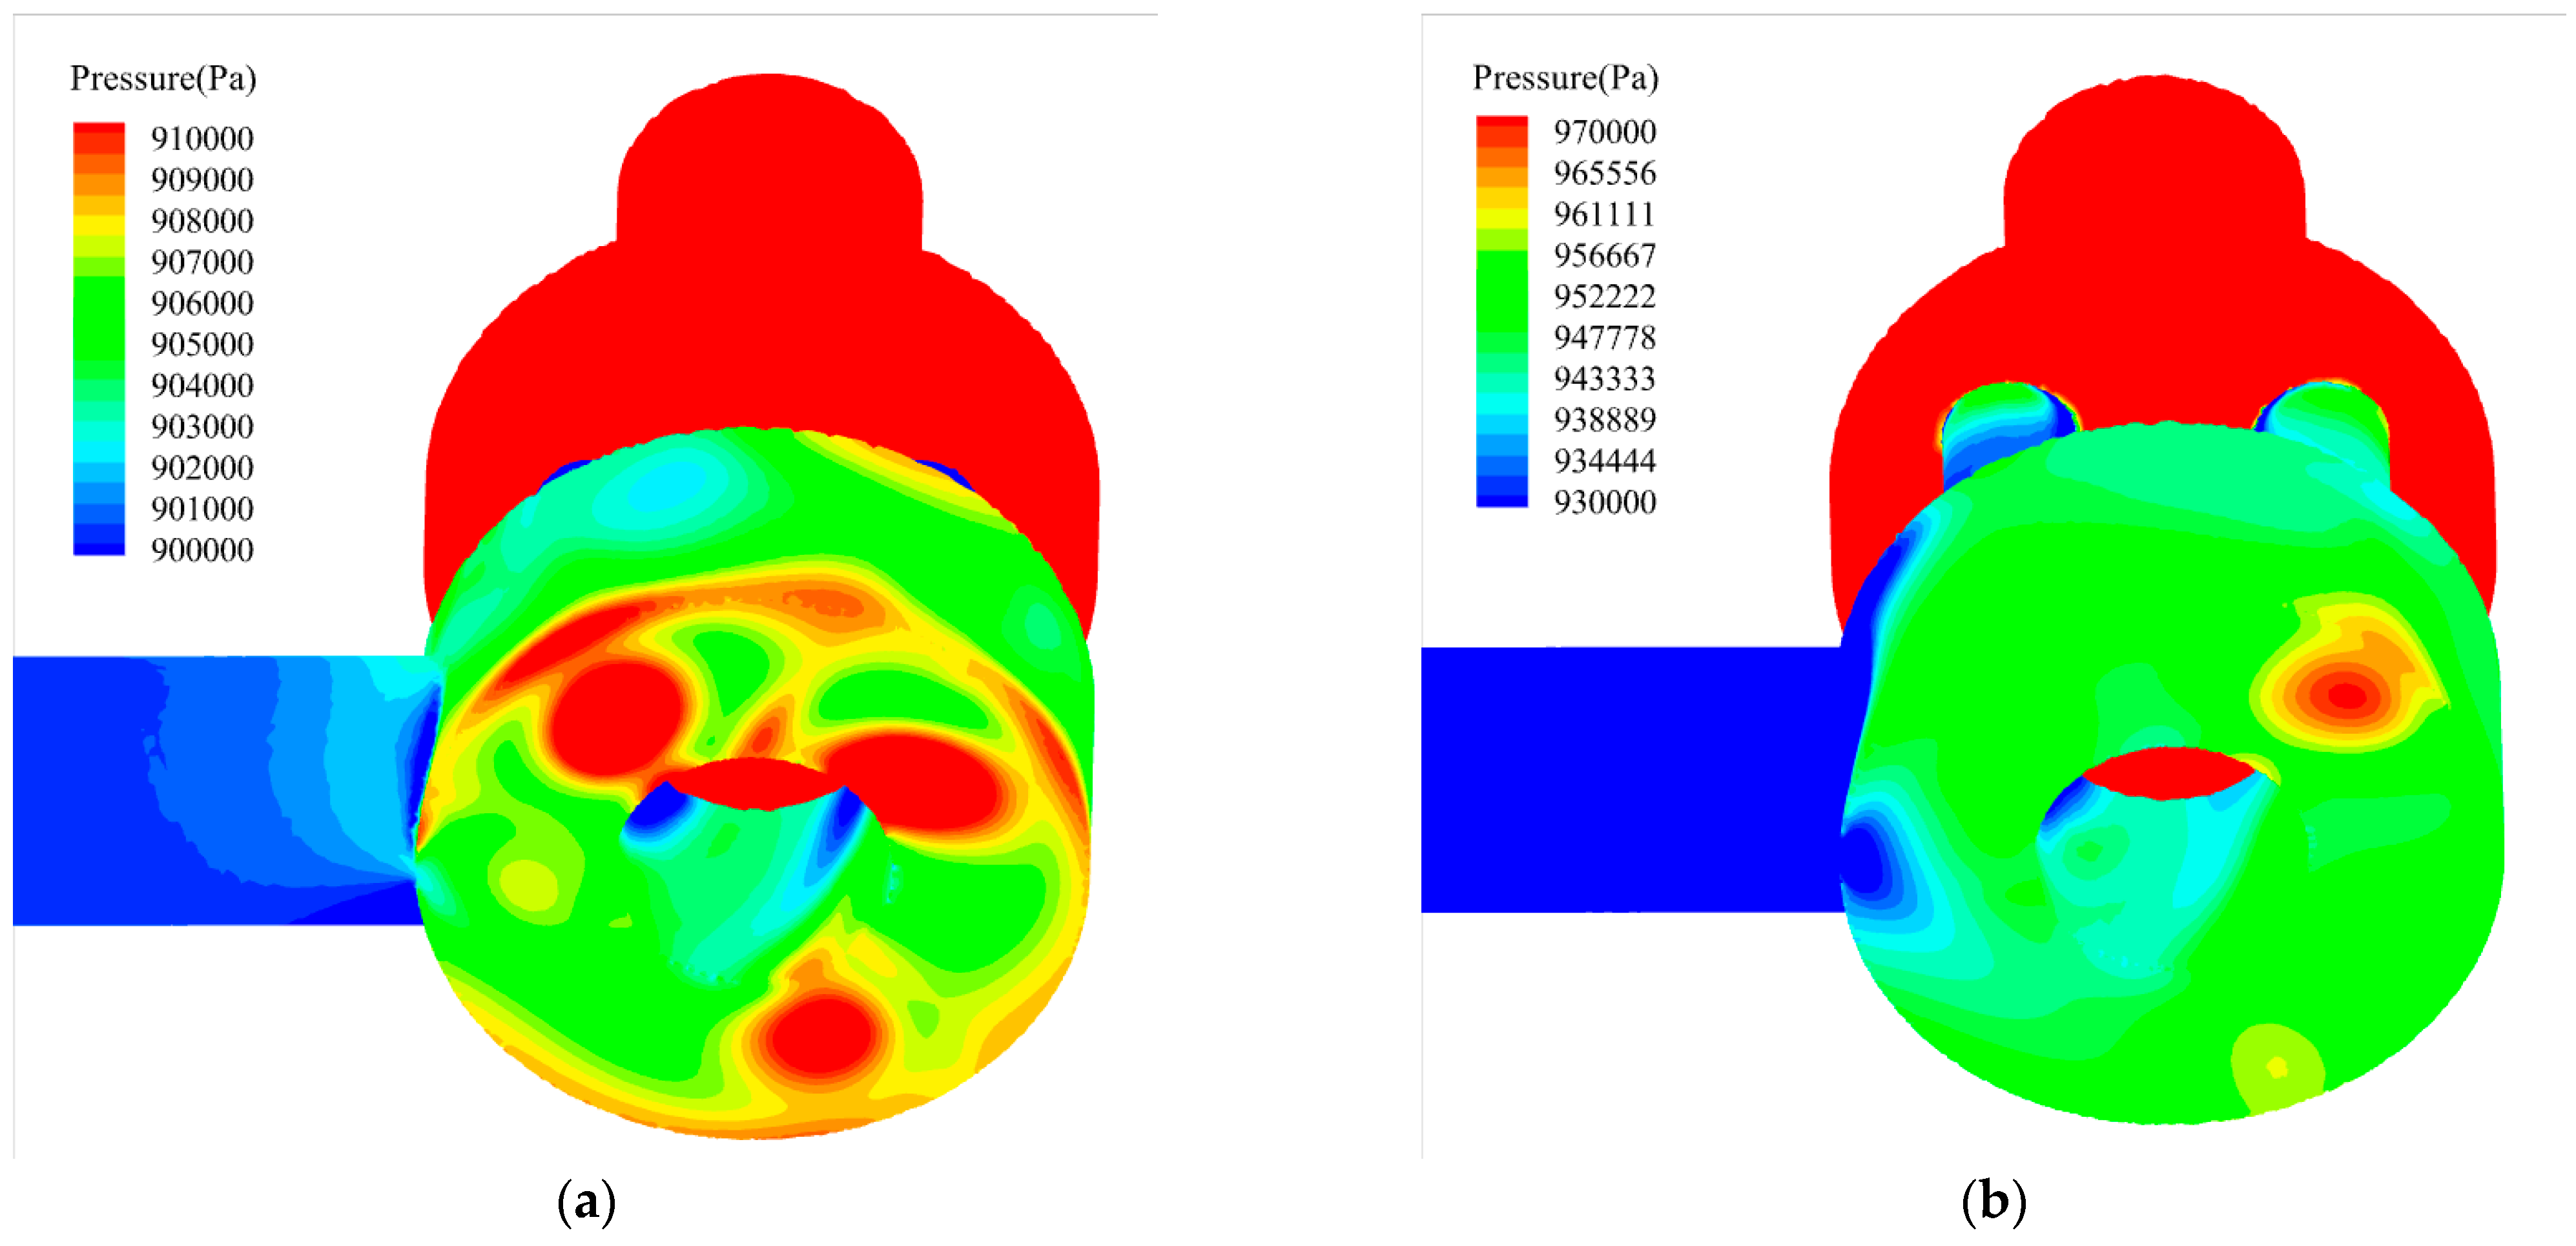
As shown in Figure 13 and Figure 14, when the opening is 20%, a jet is formed at the throttling port, which impacts the side wall and bottom surface of the lower cavity and forms a local high-pressure area at the impact position. When the opening is 100%, the jet disappears, and the main stream of each intermediate-flow channel tends to flow toward the outlet of the lower cavity, and there is a local low-pressure area at the wall of the outlet of the lower cavity. Additionally, the local high-pressure area decreases at the side and bottom of the lower cavity.

Figure 14.
Pressure cloud image of the bottom surface of the lower cavity: (a) 20%; (b) 100%.
4.4. Flow Field Analysis
In order to observe the changes in the flow field in the control valve more directly, six sections of the three-dimensional flow field were selected for analysis (as shown in Figure 15): A-A, B-B, C-C, D-D, E-E, and F-F. Section A-A is the vertical plane passing through the intersection of the upper and lower flow channels in the middle. Section B-B was taken from the symmetrical plane position of two adjacent middle flow channels. Section C-C is the horizontal plane of Z = 20 mm in the upper chamber, and sections D-D and F-F were taken from the vertical plane of the middle flow passage near and far from the outlet, respectively. Section E-E is the horizontal plane of Z = −83 mm in the lower chamber.
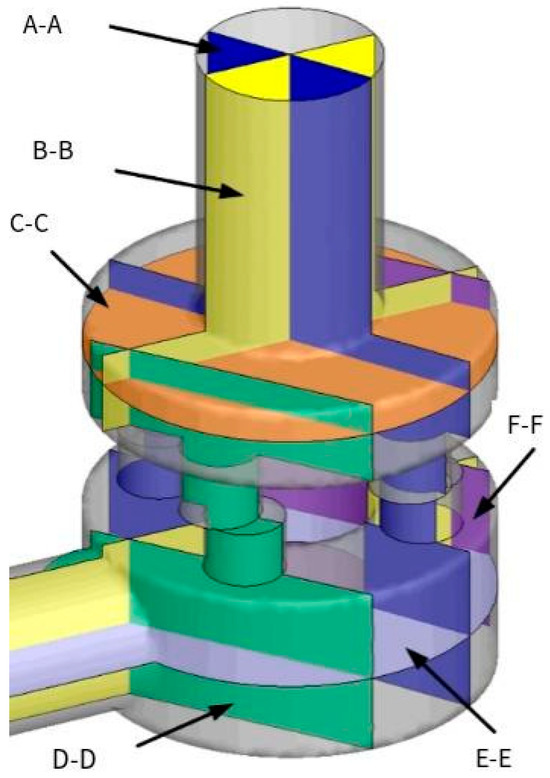
Figure 15.
Schematic diagram of the flow field section selection of the control valve.
4.4.1. Pressure Cloud Diagram
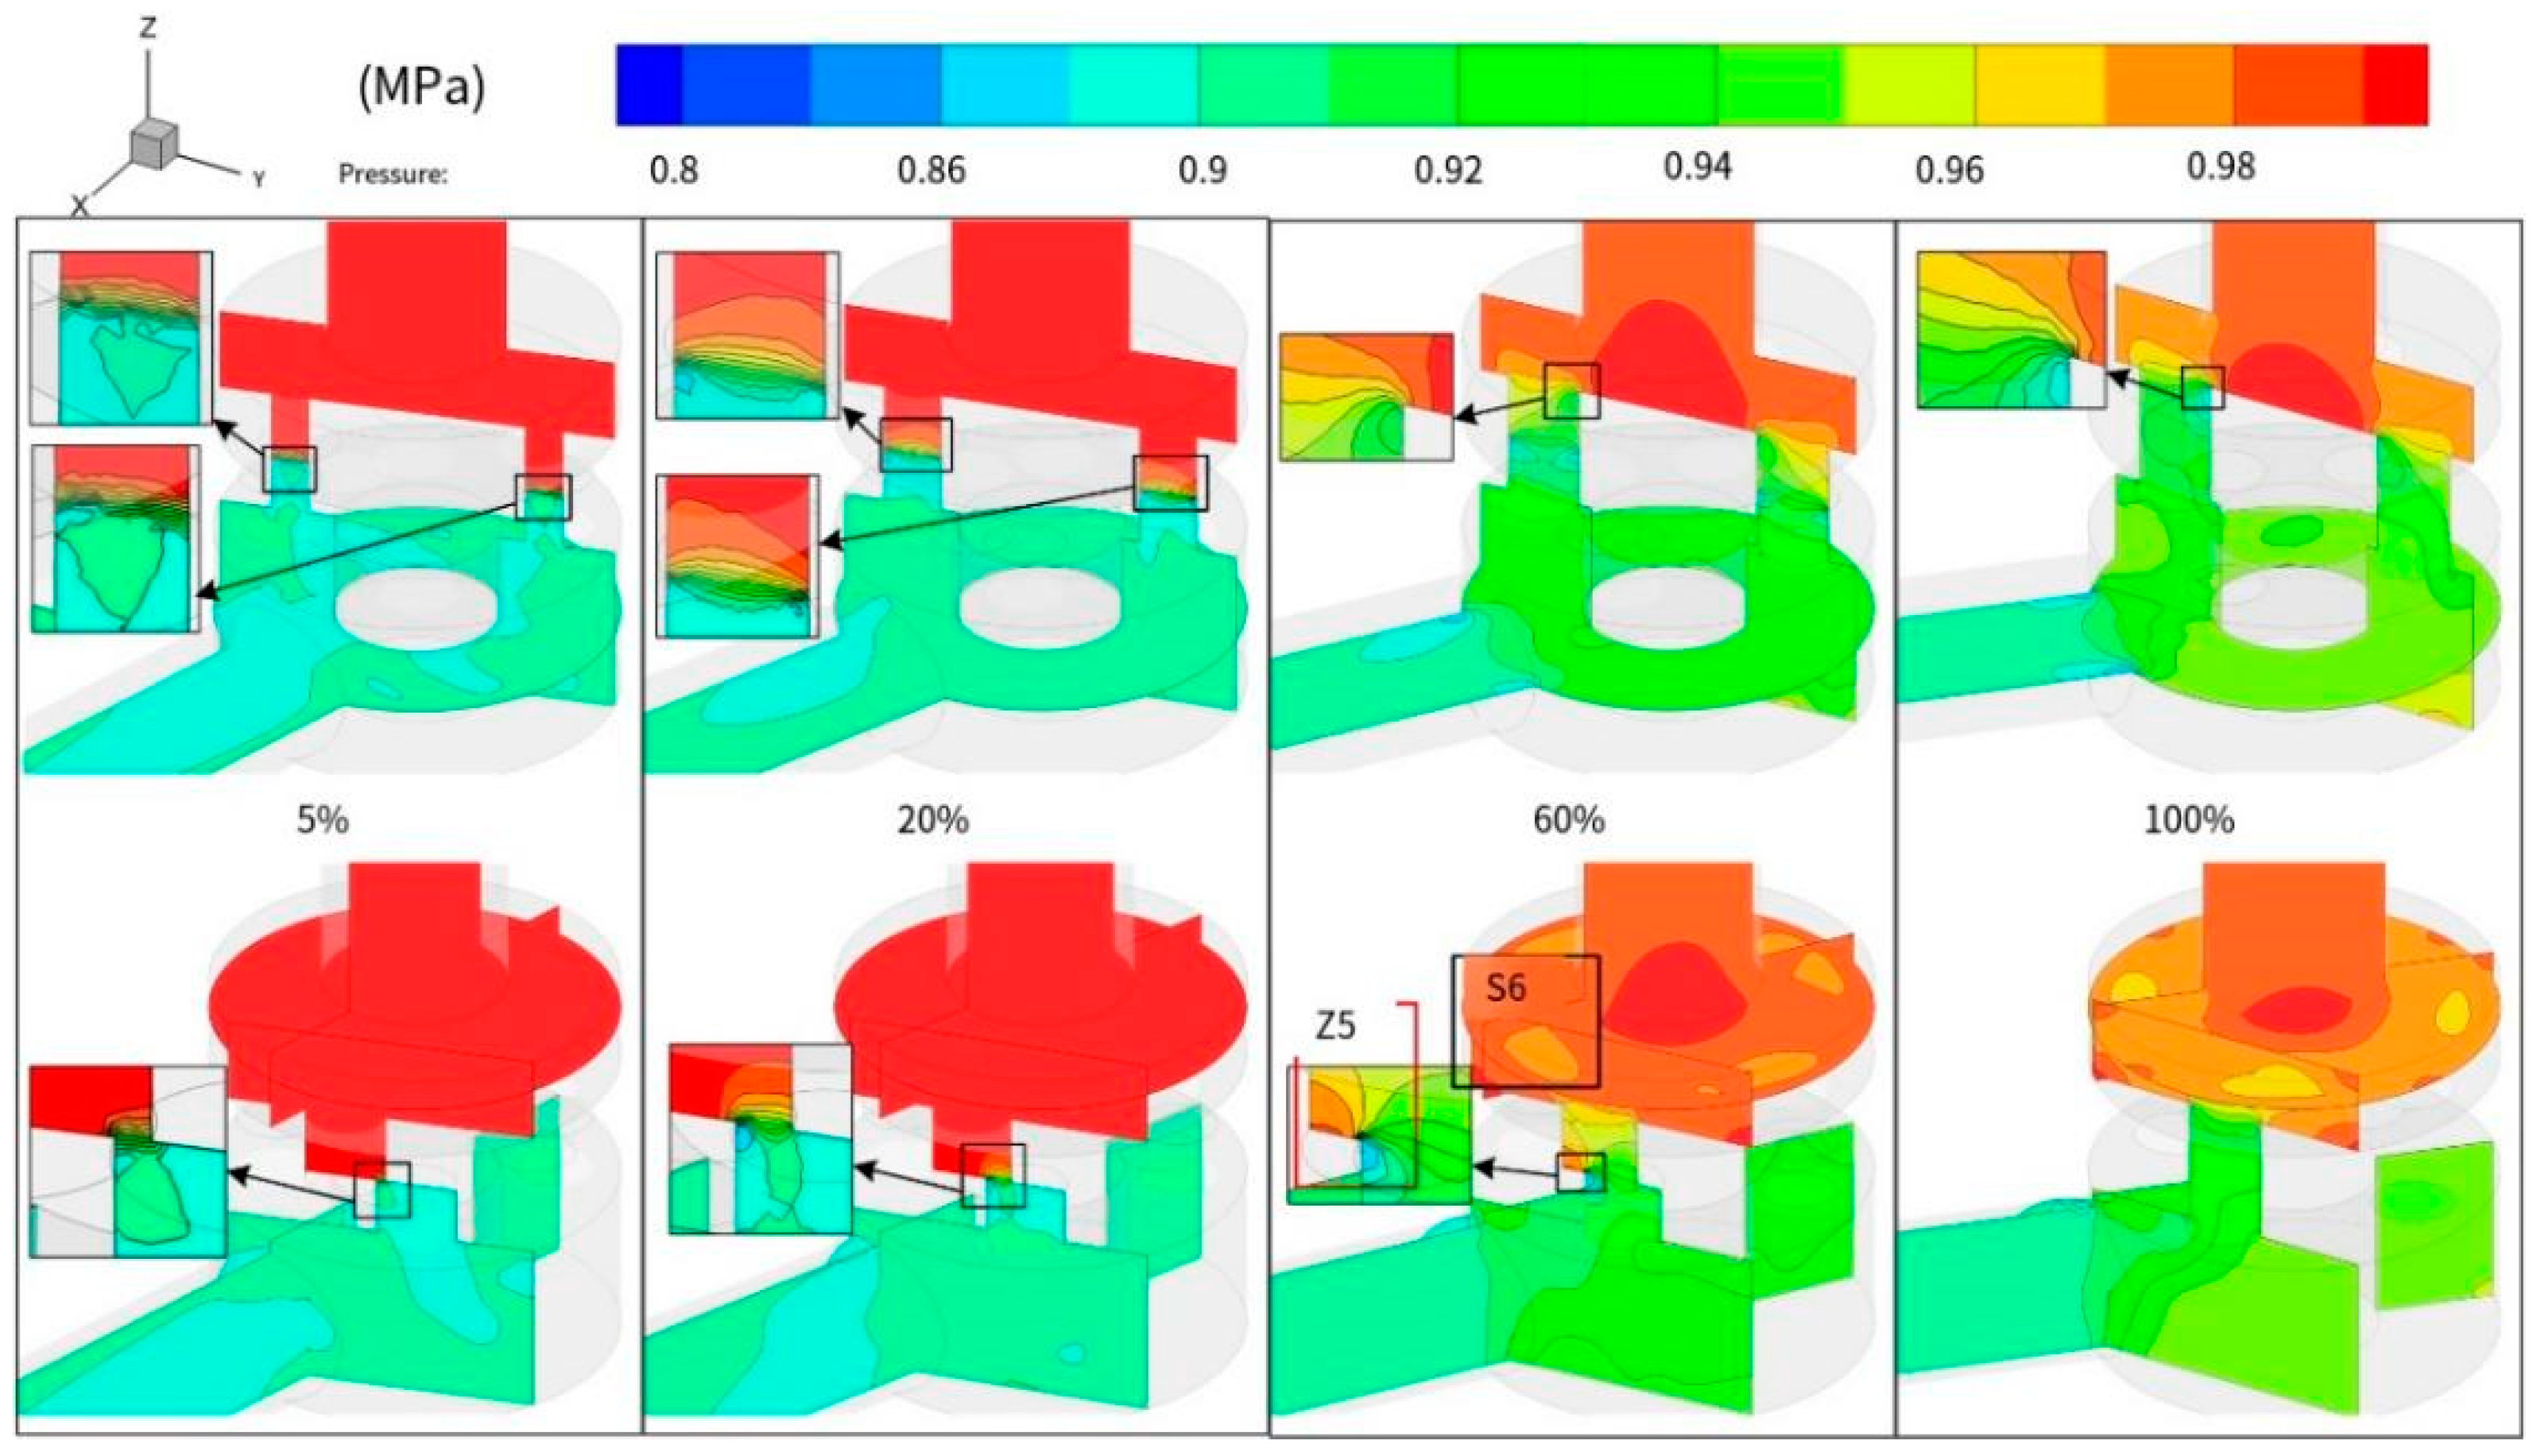
Figure 16 shows a pressure cloud diagram of the flow field in the control valve at different openings. It can be seen that due to fluid impact on the bottom surface of the upper chamber, a local high-pressure area appears in the center of the upper chamber, and with the increase in the opening, the local high-pressure area shrinks. In the area above the middle flow passage, there is a local low-pressure area (area S6), and with the increase in the opening, the pressure drops and the low-pressure area increases. When the opening is small, the pressure drop of the valve is mainly concentrated at the orifice, and the pressure gradient changes dramatically. The pressure distribution in the upper chamber is more uniform, but there is a local low-pressure area in the lower chamber due to the influence of jet flow. When the opening reaches 60%, the concentrated pressure drop area moves up and down from the position of the orifice, but it is still in the middle flow channel and its surrounding area. The concentrated pressure drop area moves up to the inner corner of the middle flow channel inlet, and as the opening increases, the pressure change tends to be gentle. There are local low-pressure areas and local high-pressure areas (area Z5) at the jet boundary of the middle channel, and as the opening increases, this area decreases. When the valve is fully open, the pressure disappears with the disappearance of the orifice. The pressure distribution in the lower chamber is centered on the middle flow passage and oriented by the flow trend and is relatively uniform. At the corner of the outlet, there is a local low-pressure area.
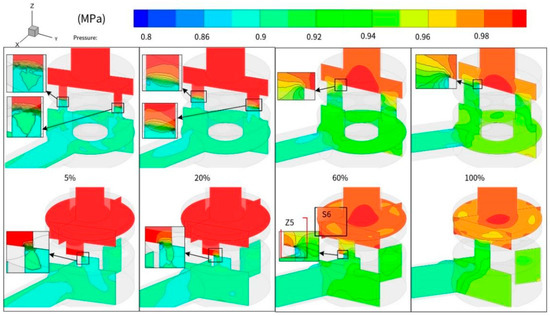
Figure 16.
Pressure cloud image at different openings.
The pressure at different heights of the upper chamber is shown in Figure 17. At the center of the upper cavity, the pressure increases with the decrease in Z, and it decreases with an increase in the radial dimension, reaching the trough at about 60 mm. In addition, when the radial size is larger than 60 mm, that is, near the side wall of the upper cavity, the pressure increases again, and the pressure near the top and bottom of the upper cavity is larger while the pressure between the two is smaller (Z = 16 mm).
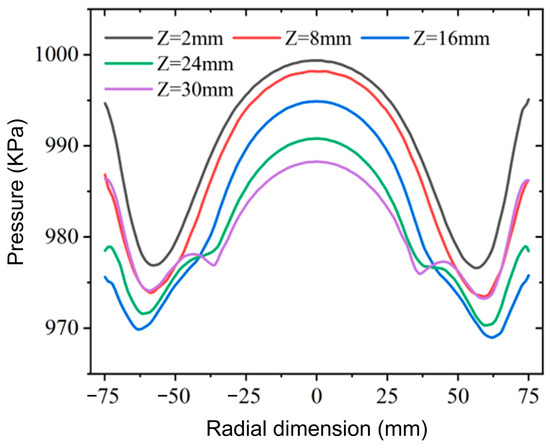
Figure 17.
Pressure changes at each height of the upper cavity.
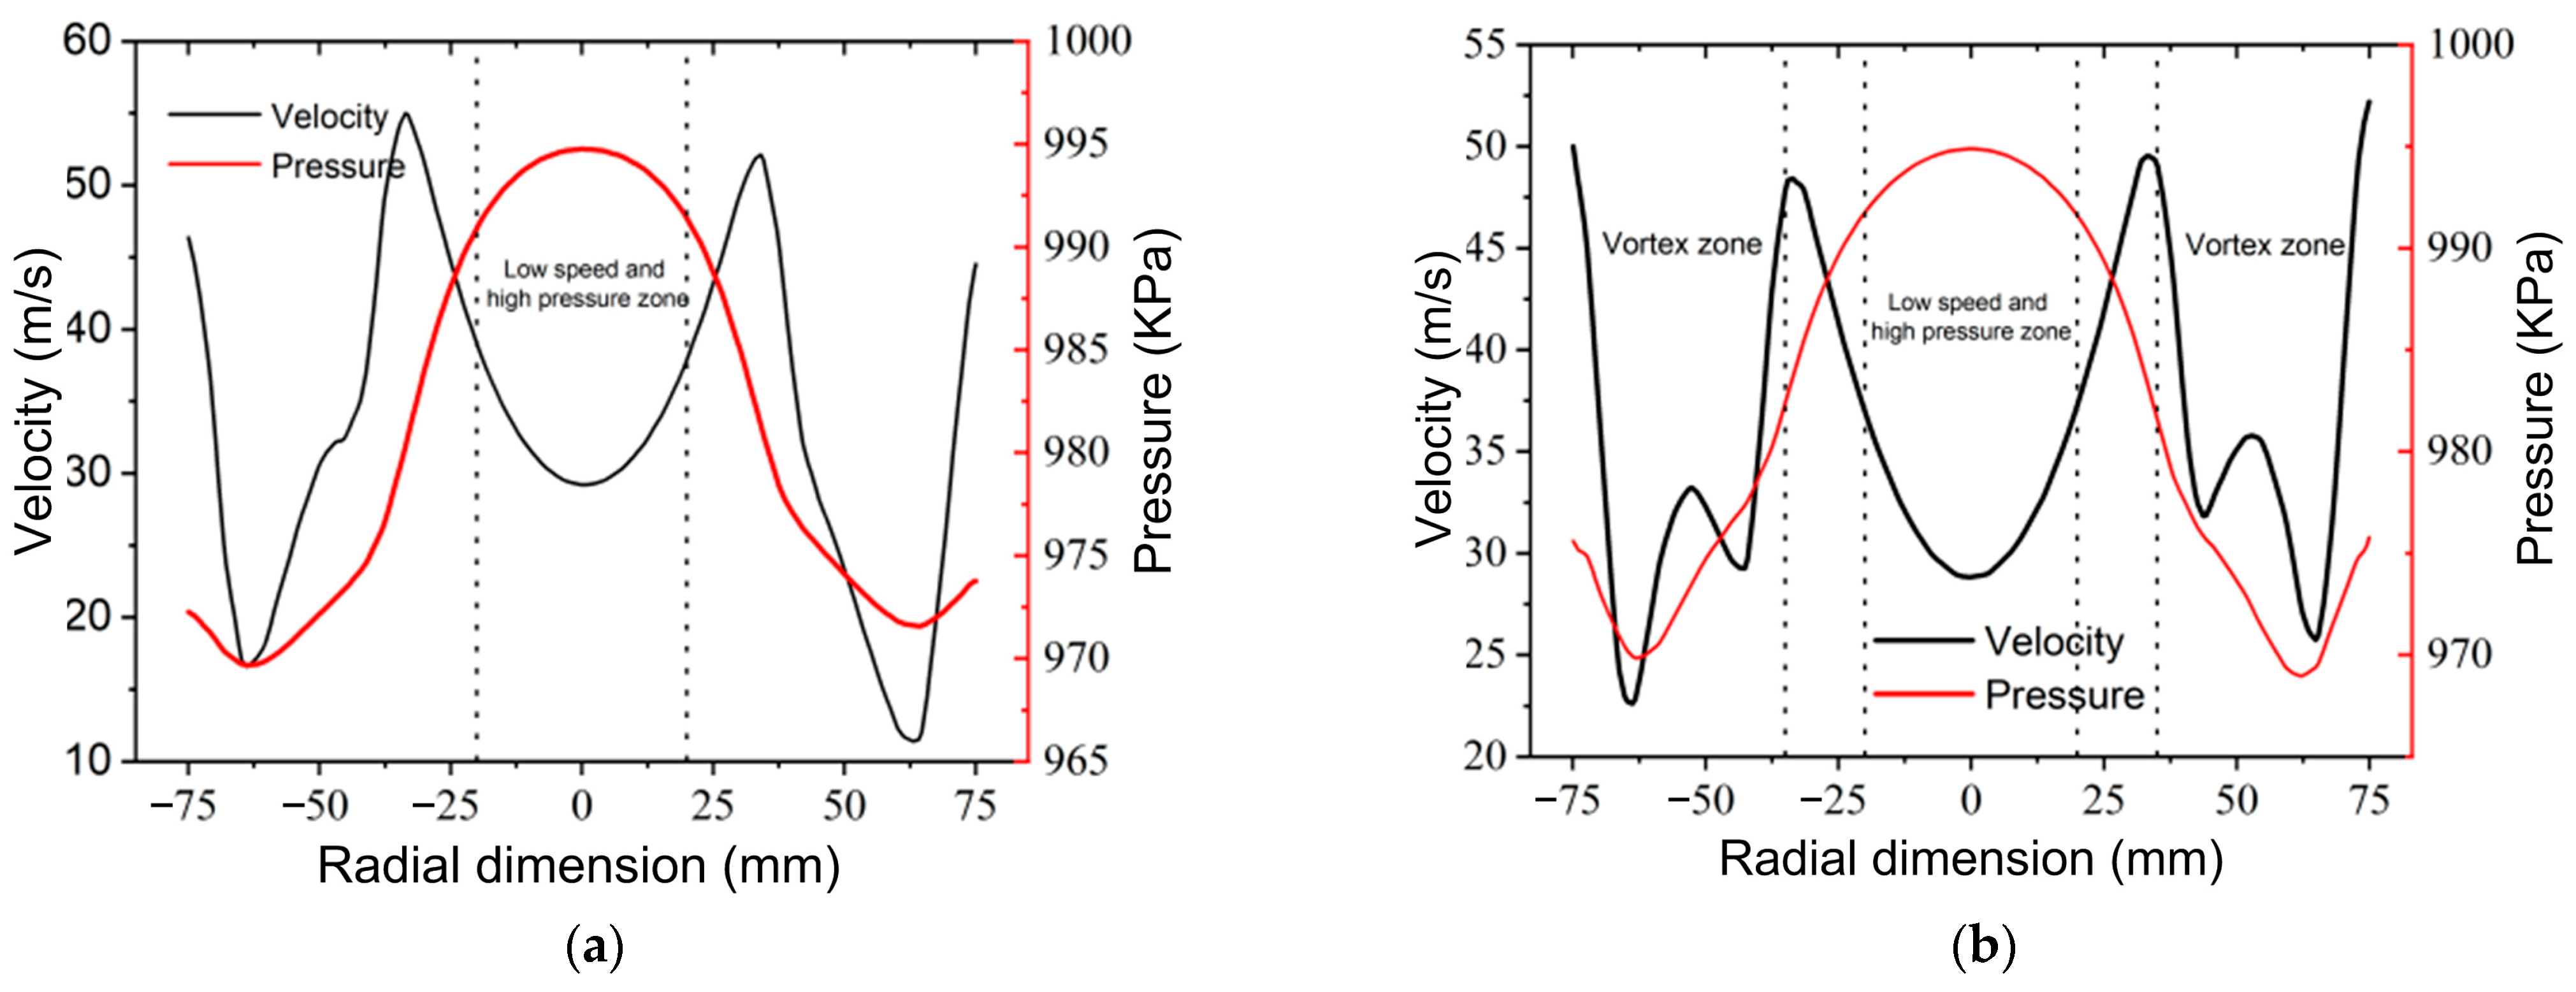
A vortex is formed between the main stream beam and the upper cavity wall, among which there are two positions: one is the area above the middle flow passage, and the other is the area between two adjacent middle flow passages in the upper cavity. The pressure and velocity distribution at Z = 16 mm for the A-A and B-B sections in the upper cavity is shown in Figure 18. In Figure 18a, the center of the middle and upper cavity is a low-speed and high-pressure area, and the variation trend of velocity and pressure is the opposite. When the radial size is approximately 37 mm, the velocity reaches the peak value, and when the radial size is approximately 63 mm, the pressure and velocity are both at the trough. As can be seen from Figure 18b, in the area between two adjacent intermediate-flow passages, due to the existence of vortices, local velocity peaks appear at a radial size of approximately 50 mm.

Figure 18.
Velocity and pressure changes along the upper cavity wall at Z = 16 mm: (a) A-A; (b) B-B.
4.4.2. Velocity Cloud Diagram
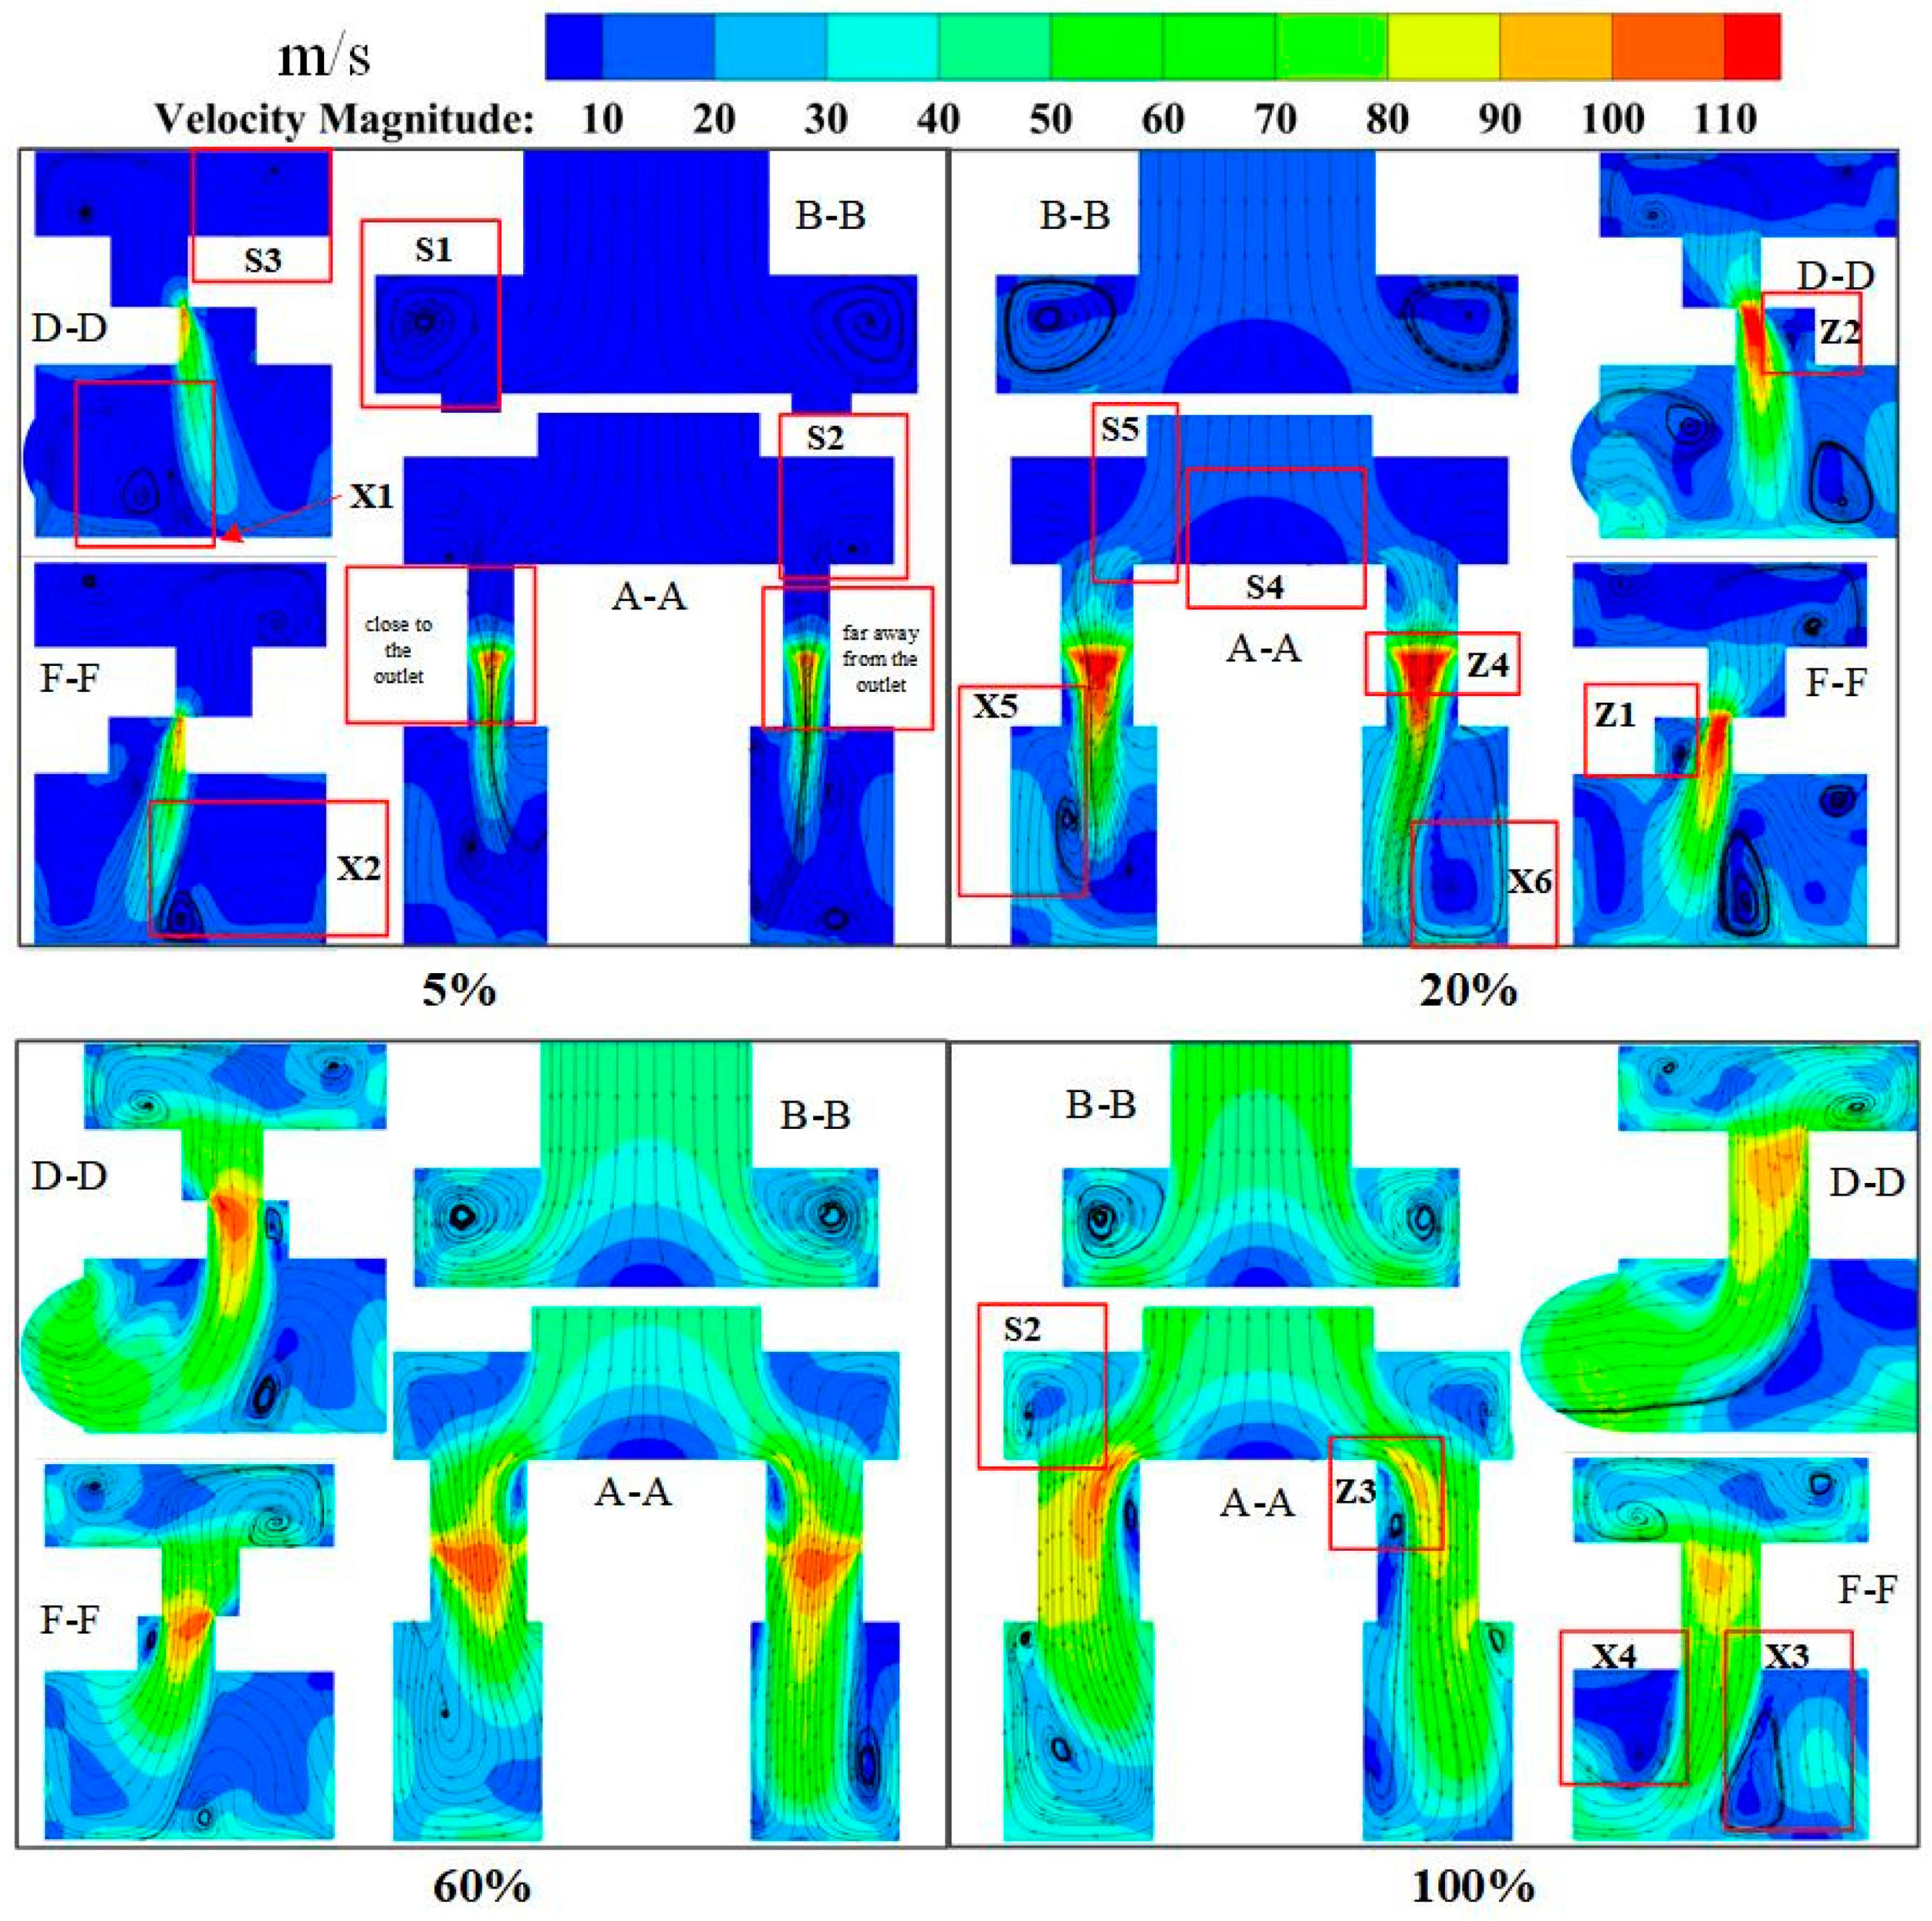
Figure 19 and Figure 20 show velocity cloud diagrams of the flow field in the valve with the control valve open and closed. The center of the bottom surface of the upper cavity is the starting point of the Z-axis, and with the increase in the opening, the flow velocity of the upper cavity and the lower cavity increases. At the center of the upper cavity, due to the impact of the fluid, a local low-speed area (area S4) is formed. With the increase in the opening, the velocity gradient changes gradually and gently, but the velocity at the center is always the smallest. In addition, with the increase in the opening, the flow velocity of the fluid that does not directly flow into the middle passage increases, and the flow tendency toward the middle passage is enhanced (area S5).
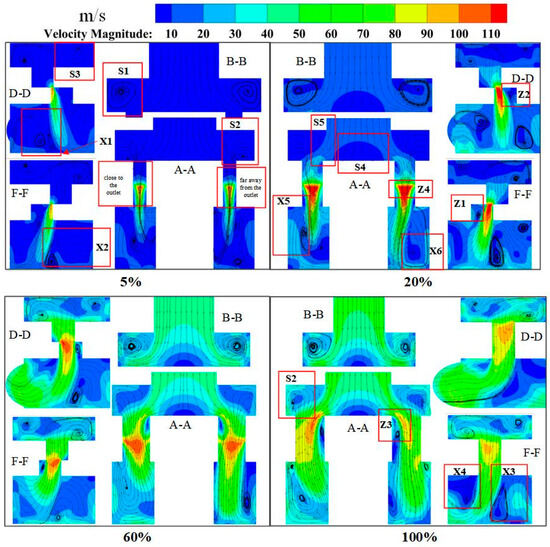
Figure 19.
Velocity flow fields corresponding to different sections in the control valve with different openings.
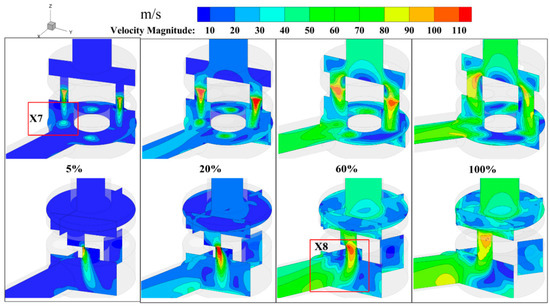
Figure 20.
Velocity cloud diagram under different openings.
With the increase in the opening, a local low-speed area appears at the inner corner of the entrance of the middle runner, and the area continues to increase (area Z3). When the opening is small, the orifice velocity gradient changes dramatically, and with the increase in the opening, the high-speed area increases, the flow rate at the center of the jet decreases, and the velocity gradient changes tend to be gradual. When the opening is greater than 60%, the flow area at the throttling orifice increases, the jet weakens, and the high-speed area becomes smaller (area Z4). When the opening reaches 100%, the orifice jet disappears, and a new velocity gradient change area (area Z3) is formed at the entrance of the middle flow passage. In the lower cavity, when the opening is small, the flow velocity of the lower cavity is significantly different from that of the surrounding flow velocity (area X7). With the increase in the opening, the velocity gradient changes gradually, and the local low-velocity area decreases.
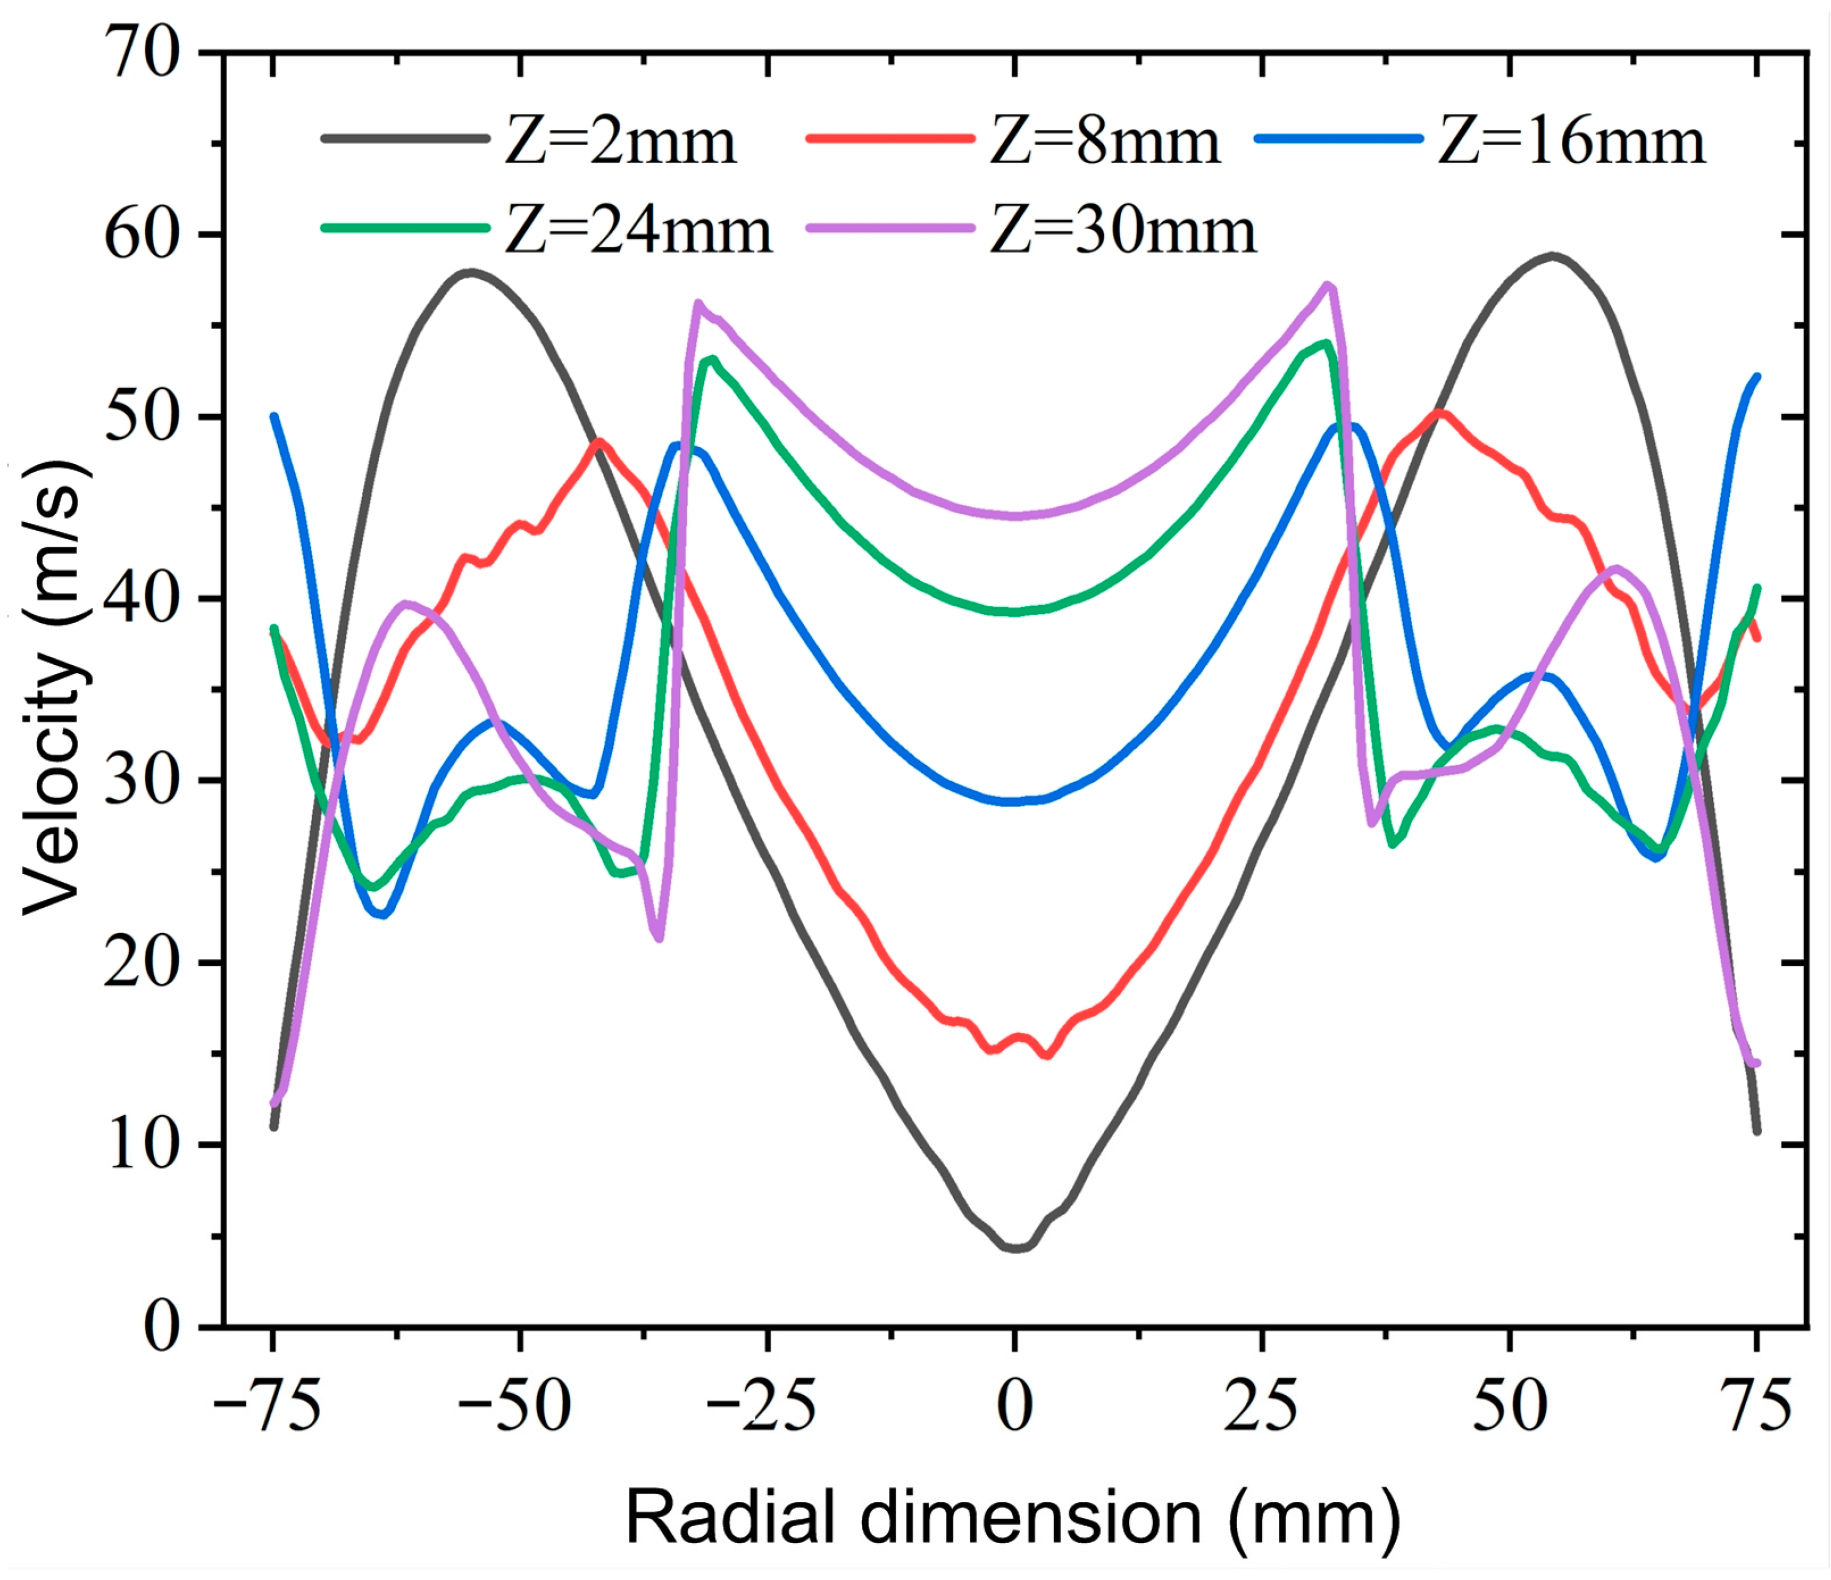
When the opening is 100%, the vortex intensity of the fluid in the upper cavity is at its maximum. Therefore, at section B-B, lines Z = 2 mm, Z = 8 mm, Z = 16 mm, Z = 24 mm, and Z = 30 mm were measured, respectively, and the velocities of each height are shown in Figure 21. The center of the upper cavity is bounded, and the velocity distribution on both sides was approximated as the radial size increased. At the same height, when the radial dimension is less than 25 mm, the velocity in the center of the upper cavity is small, but the velocity increases with the increase in the radial dimension. Moreover, with the increase in Z, the velocity of the center of the upper cavity increases, and the radial size of the peak velocity decreases. When the radial size is larger than 65 mm, that is, near the side wall of the upper cavity, it can be found that the velocity near the bottom and top surfaces of the upper cavity decreases (Z = 2 mm, Z = 30 mm), while the velocity between the two increases.
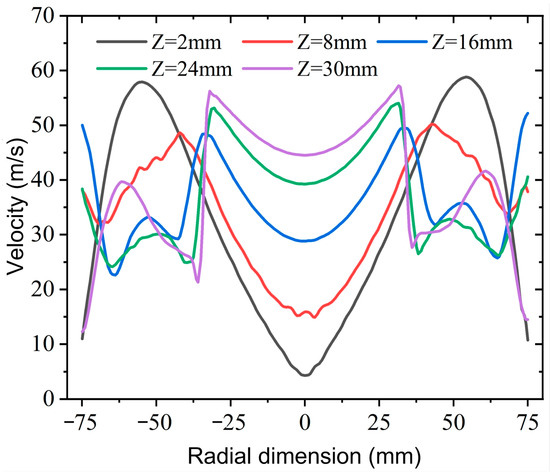
Figure 21.
Velocity distribution at each height of the upper cavity.
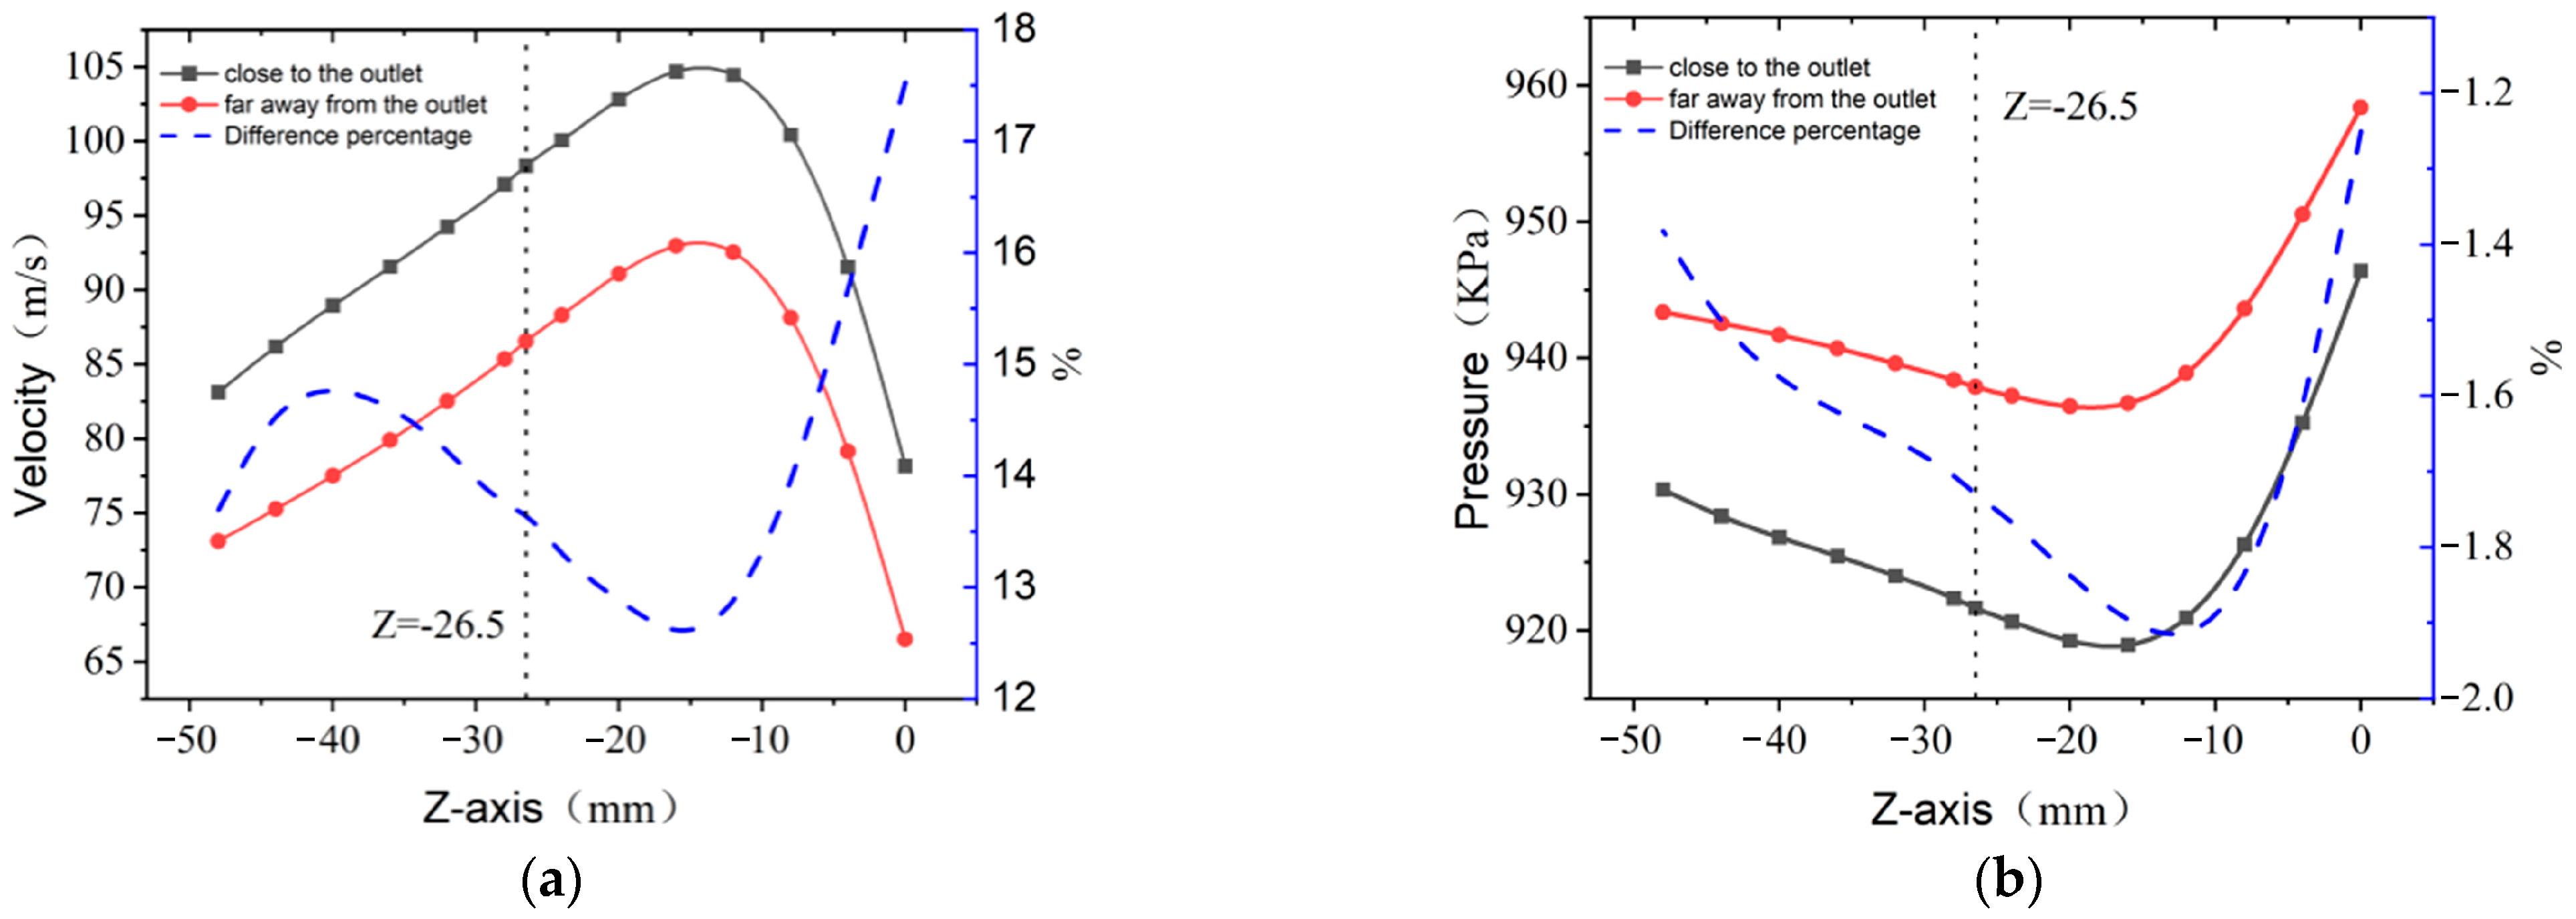
According to the distance between the middle runner and the outlet of the lower cavity, the middle runner can be divided into two types: close to the outlet and far away from the outlet. The speed and pressure of the two kinds of middle runner are different. Figure 22 shows the axis of the two middle runners (Y = 50 mm, −50 mm) in the A-A section under 100% opening. When Z is greater than −15 mm, the speed increases and the pressure decreases as Z decreases, and when Z is less than −15 mm, the speed decreases and the pressure increases with the decrease in Z. The velocity near the outlet is greater than that far away from the outlet on the whole, with the maximum velocity difference reaching 17.53% and the minimum, 12.62%. At the same time, the pressure of the two shows the opposite, with a maximum pressure difference of 1.91% and a minimum pressure difference of 1.25%.
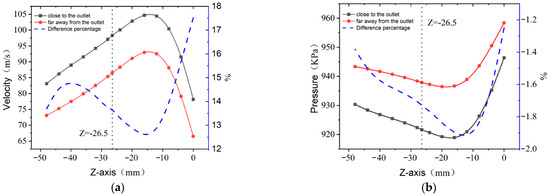
Figure 22.
Velocity and pressure changes at the center of two center flow channels: (a) velocity; (b) pressure.
4.4.3. Flow Diagram
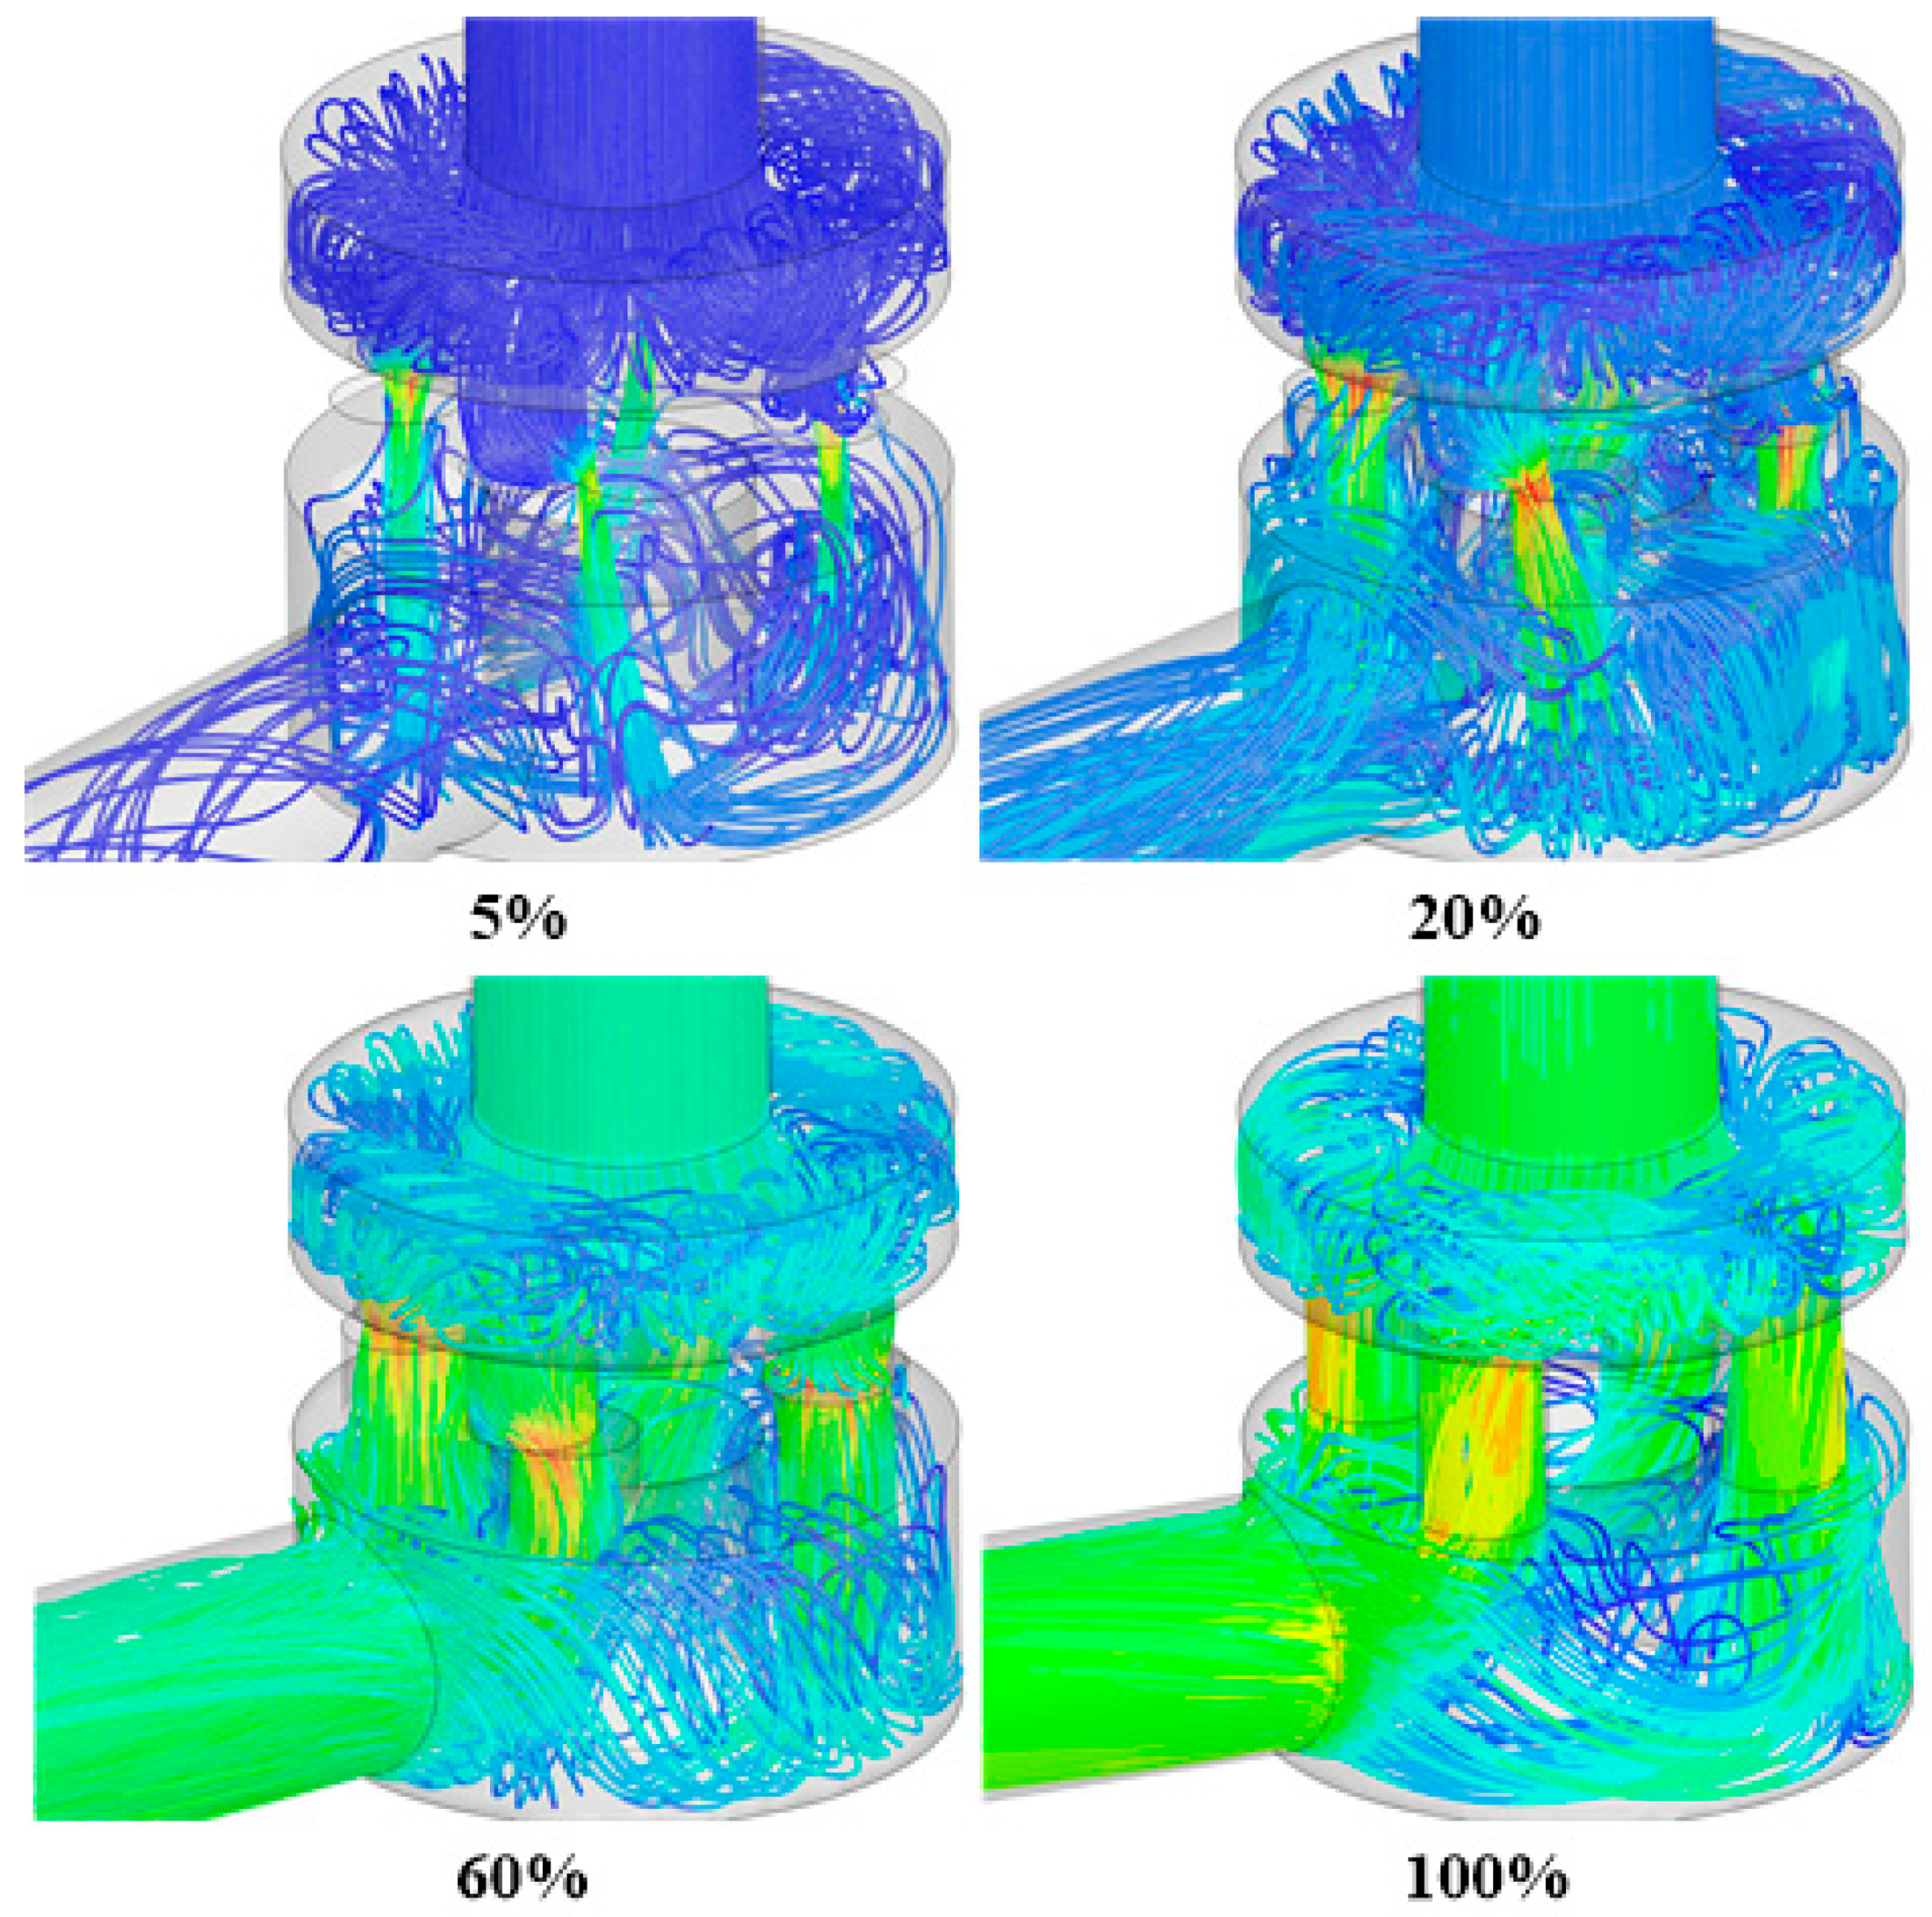
The 5% opening was selected to represent minimal opening, 20% to represent a small opening, 60% to represent a medium opening, and 100% to represent a large opening. The three-dimensional flow lines of the flow field inside the control valve under different degrees of opening are shown in Figure 23. Combining with Figure 19, it can be seen that when the valve is opened, the main flow beam impacts the bottom surface of the upper cavity and flows outward along the radial direction. The closer the fluid is to the inlet wall, the larger the deflection curvature radius. Looking outward from the center of the upper cavity in the radial direction, it can be observed that the fluid’s motion trajectory is in the shape of a “horn” and gradually becomes more obvious along the radial direction (area S4). In the upper chamber, the fluid near the middle passage directly flows into the middle passage (area S5) after its velocity direction is deflected, while the fluid between the two adjacent middle passages forms vortices (areas S1, S3) and then flows into the adjacent middle passage. With the increase in the opening, the vortex phenomenon intensifies. In addition, when the opening is small, vortices form near the bottom surface and side wall of the upper chamber, and when the opening is increased, the center of the vortex moves upward (area S2).

Figure 23.
Three-dimensional flow diagrams with different openings.
The fluid flows from the upper middle passage to the lower middle passage through the orifice. When the opening is small, because the flow area is small, a jet is formed at the orifice. With the increase in the opening, the length, width, and flow area of the orifice increase, and the jet phenomenon slows down gradually. When the valve is fully open, the jet disappears. At the inner corner of the upper middle flow passage entrance, a vortex (area Z3) gradually appears with an increase in the opening, and the vortex is the most obvious when the valve is fully open. When the opening degree is small (5%), under the influence of jet enrolling, vortices (Z1, Z2) gradually appear in the nonoverlapped area of the lower middle flow passage, and with the increase in the opening degree, these vortices are intensified. When the opening degree reaches 60%, due to the increase in the flow area of the orifice, the nonoverlapped area decreases, the vortices here weaken, and when the valve is fully open, the vortices disappear.
In the lower chamber, the fluid movement is more complex and is mainly divided into two kinds of flows: one is the direct flow to the outlet, and the other is the flow to the outlet after the circular flow path along the lower chamber. When the opening is 5%, the jet involves the surrounding fluid and forms a vortex (areas X1, X2). When the opening reaches 20%, the vortex intensifies and the vortex center moves upward. When the opening reaches 60%, the vortex weakens and the rotation center moves downward because the flow tendency of the jet beam toward the outlet is strengthened. When the opening reaches 100%, the fluid tends to flow toward the outlet and forms a new vortex (areas X3, X4). In addition, vortices always exist on both sides of the jet stream beam (areas X5 and X6), and with the increase in the opening, the flow area of the orifice outlet increases, the entrainment space shrinks, and the vortices tend to decrease.
Under the same opening degree, the jet is distributed along the circumference and has the same movement trend. When the opening degree is small, one side of the jet near the outlet tends to flow toward the outlet, while the other side flows along the annular flow channel of the lower cavity, intersects with the jet far away from the outlet, and then flows toward the outlet. With the increase in openness, all jets tend to flow toward the exit; that is, the jet near the exit directly points to the exit (area X8), and the jet far away from the exit flows along the annular flow channel of the lower chamber to the exit. In addition, when the flows converge, there is shear, vortex, and energy exchange in the fluid, resulting in energy dissipation.
5. Conclusions
The research and development of a large-flow, fast-switching control valve for the processing of fluffy laver has always been a difficult problem in the industry. This paper proposed a new type of laver fluffiness control valve, which has the advantages of a fast response speed, high stability, and long service life. The CFD method was used to analyze the flow characteristics of the control valve, the force on the valve chamber, and the performance of the flow field in the valve. The formation mechanism and evolutionary law of the flow field during the working process of the laver fluffiness control valve were expounded. The research results show the following:
- (1)
- The proposed control valve consists of a static part, a moving part, and a locking support part. The lower grinding plate is fixed onto the valve body to maintain a static state, while the upper grinding plate of the dynamic valve body can rotate relative to the lower grinding plate due to the drive of the motor. As a result, the valve’s opening or closing action is achieved through the surface contact and dynamic friction between the upper and lower grinding plates. When the through-holes of the upper grinding plate and lower grinding plate overlap each other, the upper chamber of the valve communicates with the lower chamber, thus realizing the opening of the valve. When the through-holes of the upper grinding plate and lower grinding plate are completely staggered, the upper chamber of the valve is separated from the lower chamber, and the valve is closed.
- (2)
- When the opening is less than 40%, the flow-regulating characteristics approximately linearly increase with the increase in the opening. When the opening is greater than 40%, the growth rate of the flow decreases, and the flow regulation characteristic increases approximately in a parabolic fashion, indicating that with the increase in the opening, the influence of the flow area at the orifice outlet on the flow rate of the control valve is weakened.
- (3)
- When the opening is 5%, the fluid flows into the control valve and impacts the bottom surface of the upper chamber, and the velocity direction deflects, forming a vortex. The fluid at the orifice of the middle flow passage can easily form a jet, and a vortex is formed at the middle flow passage. The jet flow beam impacts the bottom surface of the lower cavity and flows along the annular flow passage because of the movement trend of the jet, and this is accompanied by the generation of vortices. The impact, collision, and vortex of the fluid cause the energy loss of the fluid.
- (4)
- With the increase in the opening, the vortices in the upper and lower cavities are intensified, and the vortices generated by the jets in the middle flow passage are weakened. As the pressure in the upper cavity decreases, the pressure in the lower cavity increases, and the jet phenomenon at the throttling mouth gradually disappears. The main stream beam in the lower cavity gradually changes from a circular flow to a direct flow toward the outlet.
Author Contributions
Conceptualization, Y.W., J.H. and H.J.; methodology, J.H. and Y.W.; software, Y.S.; validation, H.J., Q.W. and S.Y.; resources, Y.X.; writing—original draft preparation, H.J., J.H. and Y.S.; writing—review and editing, Y.W. and Y.X.; supervision, Y.W. and J.H.; project administration, Q.W. and H.W. All authors have read and agreed to the published version of the manuscript.
Funding
This research was funded by National Natural Science Foundation of China, grant number 51875316, National Natural Science Foundation of China, grant number 52275259, National Natural Science Foundation of China, grant number 51775310, Shandong Province Natural Science Foundation of China, grant number ZR2019MEE025, and Rizhao Research Institute, Shandong University.
Data Availability Statement
The editable raw data from the measurements are available from the corresponding authors (J.H. and Y.W.) upon request. Data that supported the conclusions are contained within this paper.
Conflicts of Interest
Author Haibo Wang was employed by the company Utmost Flow Control Technology (Shandong) Company Limited. The remaining authors declare that the research was conducted in the absence of any commercial or financial relationships that could be construed as a potential conflict of interest.
References
- Gong, G.; Zhao, J.; Wang, C.; Wei, M.; Dang, T.; Deng, Y.; Sun, J.; Song, S.; Huang, L.; Wang, Z. Structural characterization and antioxidant activities of the degradation products from Porphyra haitanensis polysaccharides. Process Biochem. 2018, 74, 185–193. [Google Scholar] [CrossRef]
- Cao, J.; Wang, J.; Wang, S.; Xu, X. Porphyra Species: A Mini-Review of Its Pharmacological and Nutritional Properties. J. Med. Food. 2016, 19, 111–119. [Google Scholar] [CrossRef] [PubMed]
- Liu, Q.; Wang, Y.; Cao, M.; Pan, T.; Yang, Y.; Mao, H.; Sun, L.; Liu, G. Anti-allergic activity of R-phycocyanin from Porphyra haitanensis in antigen-sensitized mice and mast cells. Int. Immunopharmacol. 2015, 25, 465–473. [Google Scholar] [CrossRef] [PubMed]
- Tabrizi, A.S.; Asadi, M.; Xie, G.; Lorenzini, G.; Biserni, C. Computational fluid-dynamics-based analysis of a ball valve performance in the presence of cavitation. J. Eng. Thermophys. 2014, 23, 27–38. [Google Scholar] [CrossRef]
- Chern, M.; Wang, C.; Ma, C. Performance test and flow visualization of ball valve. Exp. Therm. Fluid. Sci. 2006, 31, 505–512. [Google Scholar] [CrossRef]
- Tao, J.; Lin, Z.; Ma, C.; Ye, J.; Zhu, Z.; Li, Y. An Experimental and Numerical Study of Regulating Performance and Flow Loss in a V-Port Ball Valve. J. Fluid. Eng. 2020, 142, 021207. [Google Scholar] [CrossRef]
- Campagne, R.E.; Nicodemus, R.; De Bruin, G.J.; Lohse, D. A Method for Pressure Calculation in Ball Valves Containing Bubbles. J. Fluid. Eng. 2002, 124, 765–771. [Google Scholar] [CrossRef]
- Sedghkerdar, A.; Erfaninia, A.; Nematollahi, M. 2D PIV study of flow accelerated corrosion downstream a typical industrial gate valve. Prog. Nucl. Energ. 2020, 121, 103260. [Google Scholar] [CrossRef]
- Duda, P.; Dwornicka, R. Optimization of heating and cooling operations of steam gate valve. Struct. Multidiscip. Optim. 2010, 40, 529–535. [Google Scholar] [CrossRef]
- Chen, D.; Wang, Y.; Liu, Q.; Lin, Z.; Zhu, Z.; Mao, W. Study on the eccentric jet-flow characteristics induced by the opening regulation with a gate valve. Proc. Inst. Mech. Eng. Part C J. Mech. Eng. Sci. 2021, 235, 5353–5364. [Google Scholar] [CrossRef]
- Smith, B.; Luloff, B.V. The Effect of Seat Geometry on Gate Valve Noise. J. Press. Vessel Technol. 2000, 122, 401–407. [Google Scholar] [CrossRef]
- Dong, D.; Li, X. Development of a Novel Parallel-spool Pilot Operated High-pressure Solenoid Valve with High Flow Rate and High Speed. Chin. J. Mech. Eng. 2015, 28, 369–378. [Google Scholar] [CrossRef]
- Khan, H.A.; Yun, S.; Jeong, E.; Park, J.; Choi, B. A novel design and performance evaluation technique for a spool-actuated pressure-reducing valve. Actuators 2021, 10, 232. [Google Scholar] [CrossRef]
- Hucko, S.; Krampe, H.; Schmitz, K. Evaluation of a soft sensor concept for indirect flow rate estimation in solenoid-operated spool valves. Actuators 2023, 12, 148. [Google Scholar] [CrossRef]
- Albaina, I.; Esteban, G.A.; Bidaguren, I.; Izquierdo, U. New switching gate diverter valve for large flow measurement systems. Flow Meas. Instrum. 2023, 93, 102425. [Google Scholar] [CrossRef]
- Wang, Y.; Ji, H.; Song, Y.; Wang, Q.; Xie, Y.; Huo, Z. A Porphyra Rolling Device, Automatic Rolling Device, and Porphyra Roll Processing Equipment. Patent China CN112617143A, 28 February 2023. [Google Scholar]
- Wang, Y.; Song, Y.; Wang, Q.; Ji, H.; Xie, Y. An Automatic Drying Device for Porphyra haitanensis and Its Usage Method. Patent China CN111838714A, 8 July 2022. [Google Scholar]
- Nikzad, A.; Iranshahi, D.; Ranjbaran, M. Comparative evaluation of spherical radial flow reactor, spherical axial flow reactor, and tubular reactor in ammonia production by using CFD simulation. Fuel 2023, 350, 128772. [Google Scholar] [CrossRef]
- Loubimov, G.; Kinzel, M. Onto Quantifying Unsteady Propulsion Characteristics Using Momentum and Energy Control Volume Assessments. J. Fluid. Eng. 2023, 145, 061103. [Google Scholar] [CrossRef]
- Han, J.; Xie, Y.; Wang, Y.; Wang, Q. Dynamic Simulation of a Warship Control Valve Based on a Mechanical-Electric-Fluid Cosimulation Model. Sci. Technol. Nucl. Install. 2021, 2021, 6683871. [Google Scholar] [CrossRef]
- Lv, K.; Xie, Y.D.; Wang, Y.; Sun, G. Performance investigations of a control valve with the function of energy harvesting. Energy 2021, 214, 119001. [Google Scholar] [CrossRef]
- Zhang, X.; Xie, Y.; Han, J.; Wang, Y. Design of control valve with low energy consumption based on Isight platform. Energy 2022, 239, 122328. [Google Scholar] [CrossRef]
- Malavasi, S.; Rossi, M.M.A.; Ferrarese, G. GreenValve: Hydrodynamics and applications of the control valve for energy harvesting. Urban Water J. 2018, 15, 200–209. [Google Scholar] [CrossRef]
- Iravani, M.A.; Toghraie, D.A.T.I. Design a high-pressure test system to investigate the performance characteristics of ball valves in a compressible choked flow. Measurement 2020, 151, 107200. [Google Scholar] [CrossRef]
- Zhou, Q.; Liu, L.; Zheng, C.; Xu, Z.; Wang, X. Design of valve seating buffer for electromagnetic variable valve system. Actuators 2023, 12, 19. [Google Scholar] [CrossRef]


Disclaimer/Publisher’s Note: The statements, opinions and data contained in all publications are solely those of the individual author(s) and contributor(s) and not of MDPI and/or the editor(s). MDPI and/or the editor(s) disclaim responsibility for any injury to people or property resulting from any ideas, methods, instructions or products referred to in the content. |
© 2024 by the authors. Licensee MDPI, Basel, Switzerland. This article is an open access article distributed under the terms and conditions of the Creative Commons Attribution (CC BY) license (https://creativecommons.org/licenses/by/4.0/).