Article

Research on Path Planning Technology of a Line Scanning Measurement Robot Based on the CAD Model

College of Control Science and Engineering, China University of Petroleum (East China), Qingdao 266580, China
*
Author to whom correspondence should be addressed.
Actuators 2024, 13(8), 310; https://doi.org/10.3390/act13080310
Submission received: 11 July 2024 / Revised: 2 August 2024 / Accepted: 9 August 2024 / Published: 11 August 2024
(This article belongs to the Section Control Systems)

Abstract

:
With the development of robotics and vision measurement technology, the use of robots with line laser scanners for 3D scanning and measurement of parts has become a mainstream trend in the field of industrial inspection. Traditional scanning and measuring robots mainly use the teach-in scanning method, which has unstable scanning quality and low scanning efficiency. In this paper, the adaptive sampling method for a free-form surface, which can realize the adaptive distribution of surface measurement points according to the curvature features of free-form surfaces, is proposed first. Then, integrated with the proposed adaptive sampling method, the automatic path planning method is proposed. This method consists of adaptive sampling, scanning attitude calculation based on a quaternion, scanning viewpoint planning based on viewable cones, and scan path generation based on bi-directional scanning. Based on the proposed automatic path planning method, the scanning and measuring robot can obtain complete 3D information of the surface to be measured with high measurement accuracy and efficiency. The performance index of the laser scanner can be fully reached.

1. Introduction

With the rapid development of manufacturing, free-form surfaces are widely used in the design of aircraft, automotive, and marine products. Free-form surfaces have flexible geometric features and are often used in product design to create parts with demanding surface shapes, such as impeller blades [1,2,3], airplane skins [4], and doors [5], which have complex shapes, are difficult to process, and are time-consuming to measure. A typical free-form part is shown in Figure 1. Since the manufacturing accuracy of free-form parts directly affects the actual performance of the product, quality inspection of free-form parts is an important means of ensuring the manufacturing accuracy of parts in the national defense industry and livelihood industries, and is of great significance to the development of China’s high-end manufacturing industry [6].
Non-contact measurement is a measurement method that collects geometric information on the surface of a part without directly touching the surface of the part to be measured. A common non-contact measurement device is the 3D line laser scanner, the basic principle of which is to reconstruct the surface geometry of a part by emitting laser lines from a laser to irradiate the part surface and using a sensor to receive the reflected laser lines from the part surface. The 3D line laser scanner is widely used in the field of reverse engineering and quality inspection due to its high measurement accuracy and extremely fast measurement efficiency, and a typical 3D line laser scanner is shown in Figure 2.
Since the 1980s, with the advancement of industrial robot technology, the application scenarios of industrial robots have been greatly expanded, and the installation of 3D laser scanners at the end of programmable industrial robots and the use of programmed control industrial robots to carry 3D laser scanners to complete automatic inspection of parts has become a mainstream trend in the field of industrial inspection [7,8]. Robotic 3D scanning and measuring system is shown in Figure 3.
In the scanning and measuring process, due to the complex surface morphology of the part to be measured and the constraints of the scanner measurement, it is more difficult to plan the 3D scan path of the robot, resulting in most of the scan paths of the robot applied at home and abroad being obtained by means of teach-in programming. This approach has a number of shortcomings: every time a new part is inspected, the robot needs to be taught to program, which wastes a lot of time; the scan path often depends on the operator’s experience, which makes it difficult to meet both the position and attitude requirements of the 3D scanning and measuring robot; and the teach-in programming method is prone to missing scanning data and redundant scanning data.
Therefore, scan path planning is a key step to achieve efficient automated measurement of free-form parts, and a reasonable scan path can effectively improve scan quality and scanning efficiency. Scan path planning is mainly divided into the generation of reasonable sampling points and the improvement in scan path planning algorithms. In recent years, these two aspects of the research have achieved a lot of good results.
In terms of sampling point generation, Chen et al. proposed an adaptive free-form surface sampling method based on geodesic distance (GD), which can adaptively generate the points to be measured on the free-form surface according to the geodesic distance to better characterize the degree of undulation of the surface [9]. Manoj Babu et al. proposed the Spatio Temporal Adaptive Sampling (STAS) method, which is based on partial measurements of free-form surfaces to estimate the deviation of the whole part, adaptively selecting the next region to be measured to meet predefined measurement criteria, minimizing the range of necessary part inspections, and thus reducing the inspection time of the whole part [10]. Luca Pagani considered both the regularity of sampling and the complexity of the object, and proposed an edge-based cumulative surface sampling method based on edge accumulation and integration to assign a higher sampling density to some significant features with high curvature variation [11]. Javad Zahmati et al. proposed a new hybrid sampling strategy using a particle swarm optimization method, which does not require curvature calculation, but moves all sample points to find their optimal positions via population intelligence; this method can significantly reduce the bias of the measured surface [12]. Bowen Yi et al. proposed an improved mesh-based simplified surface sampling method considering curvature constraints and edge length constraints to obtain sampling points by projecting the vertices of the simplified surface onto the original model, which can ensure sufficient sampling points for both complex and flat regions on the surface and can significantly reduce the sampling error when the sample size is small [13]. Kang Gu et al. proposed a sparse sampling strategy for free-form surfaces based on low-rank matrix complementation (LRMC). This method randomly samples uniformly distributed free-form surfaces in a right-angle coordinate system to obtain sparse sampling points, which greatly reduces the number of sampling points and greatly improves the measurement efficiency under the premise of guaranteeing accuracy [14]. A system using Gaussian process adaptive sampling was developed by Kaidi Zhang et al. Using a nonparametric GP model to reconstruct the terrain and determine the subsequent sampling locations based on the inference uncertainty estimation, experiments show that this method not only ensures the surface reconstruction accuracy, but also reduces the data redundancy and improves the work efficiency compared with the traditional raster sampling [15]. Yinhua Liu et al. proposed a coverage path planning method based on an optimal viewpoint sampling strategy, which incorporates the measurement uncertainty of key measurement points into the free-form surface detection, significantly improving the scanning accuracy [16]. Gao Feng et al. proposed an adaptive surface sampling strategy based on the bending moment theory for the differences in curvature of different regions of the blade, which can adaptively and accurately determine the distribution and number of checkpoints according to the changes in the geometric features. The experiments showed that the proposed method can effectively reduce the bias between the surface reconstruction models [17]. Boyang Zhang et al. proposed an adaptive sampling method based on the collaborative kriging method. According to the characteristics of the interpolation reconstruction method, certain feature points on the surface act as anchor points, and the distribution of other measurement points is iteratively determined in the case of the same number of measurement points. This approach can greatly reduce the reconstruction error [18].
In terms of scan path generation, Ding et al. proposed a method to generate scan paths for a single arbitrary surface by analyzing the scanning constraints of the measured surface during laser scanning. Meanwhile, by analyzing the related problems in the process of multi-surface scanning, a scan path planning method based on an arbitrary complex multi-surface is established [19]. T. Koutecky et al. proposed a new sensor planning system that automatically generates the scanning positions of the sensors based on the part model, which is applicable to sheet metal parts with reflective surfaces, and the experiments show that the proposed method saves 50–85% of the time compared to manual planning [20]. M. Morozov et al. generated scan paths via offline programming, reconstructed the part surfaces by reverse engineering, and used the swept eddy current method to complete the nondestructive testing of wing skin panels, forming a computer-aided scan path generation method for nondestructive testing of complex-shaped test-pieces [21]. Lina Li et al. developed a path planning algorithm for a 2D laser contour scanning system that satisfies the scanning constraints, which can scan the surface of the workpiece efficiently and automatically. The method divides the scanned surface into sections that satisfy multiple scanning constraints by correcting the relationship between the surface to be measured and the scanned data. In the divided scanning area, the scanner orientation is kept constant and the scan path length is approximated by minimizing the duplicated scanning area, which achieves high-efficiency measurement [22]. Jakob Ziegler et al. proposed a method for depth sensor-based target object detection and automatic trajectory generation during robot-assisted target scanning, which divides the workspace around the target object into sub-bodies, based on which a set of three-dimensional coordinate points are solved and then the final scan path is generated [23]. A. Phan et al. proposed a continuous scan path planning method for laser planar scanners mounted on industrial robots using conformal mapping to control the overlap between two neighboring scan paths, and the generated scan paths enable control of the laser beam direction and coverage rate [24]. Jinshan Wang et al. proposed an integrated mobile robot measurement system based on mobile robot scanning and stereo vision attitude tracking, which is capable of accurate non-contact 3D measurement of large and complex components [25]. Yulong Zong et al. proposed an automatic 3D scanning system based on a path planning algorithm, which can automatically calculate the effective scan path according to the CAD model of the object under test and realize the automatic stitching of the scanning data under multiple viewpoints with high scanning integrity and scanning accuracy [26]. Jing Li et al. analyzed the constraints such as scanning area range, proximity distance, and scene width angle of the tracking 3D scanner, established a mathematical model of the circular air scan path applicable to the geometric characteristics of the magazine parts, and further analyzed the change rule of the scanning stroke, robot attitude transformation times, and scanning time under the circular scan path [27].
Since most of surface measurement point sampling methods have been conducted for contact measurement devices such as CMMs, the calculated surface measurement points are usually distributed in a disorderly manner. However, according to the measurement principle of the line laser scanner, the measurement points collected by the line laser scanner are theoretically located in the same plane each time, and the disordered measurement points obtained by considering only the curvature characteristics of the surface are not applicable to the laser line scan measurement. Therefore, a suitable sampling method for surface measurement points needs to be explored for the laser line scan measurement principle.
Qi Li established a prediction model that includes scanning pose and measurement uncertainty. The method can achieve high quality inspection accuracy by iteratively optimizing the attitude angle to reduce the measurement uncertainty of the scanned area [28]. Hoon Kwon proposed a rescanning strategy algorithm by selecting the area to be rescanned and using a small number of viewpoints for viewpoint planning, while rotating and aligning the viewpoints using a rotary table, which can reduce the scanning time. Experimental results on different objects verified that the method can be applied to 3D quality inspection tasks [29]. Inhwan Dennis Lee proposed a method for generating the poses of a robotic 3D scanning system from incomplete data with a limited field of view, by inferring the object shape from the scanned portion of the data. Local confidence is evaluated for each point on the inferred shape, and scanning viewpoint planning is performed for local areas with missing 3D information to fill in the missing data of 3D information [30].
Since the viewpoint planning method based on the cone of view theory requires a cone of view for all measurement points, the number of viewpoints is high and the number of scanner attitude adjustments is high. Therefore, it is necessary to reduce the number of viewpoints on the basis of collecting all measurement points, so that the planning viewpoint can observe multiple measurement points of the surface at the same time, reduce the number of scanner attitude adjustments, and reduce the measurement uncertainty. For free-form parts with complex morphological features, a suitable viewpoint planning method needs to be explored.
This study focuses on automatic scan path planning based on a robot 3D scanning measurement system with high measurement accuracy and efficiency. The method consists of free-form surface sampling, scanning viewpoint planning, scanning attitude calculation, and scan path planning. The main innovations of the study are summarized as follows: (1) The adaptive sampling method for a free-form surface is proposed for the line laser scanner, which can realize the adaptive distribution of surface measurement points according to the curvature features of free-form surfaces. (2) The scan viewpoint arrangement method is based on the Boolean intersection calculation of multiple scan position regions on the viewpoint plane. The method proposed in this study effectively improves the scanning quality and efficiency.
This paper is organized as follows: Section 2 introduces the measuring principle of the line laser scanner and the automatic scan path planning method. Section 3 describes the experimental system and analyzes the experimental results. Finally, Section 4 presents the conclusions.

2. Materials and Methods

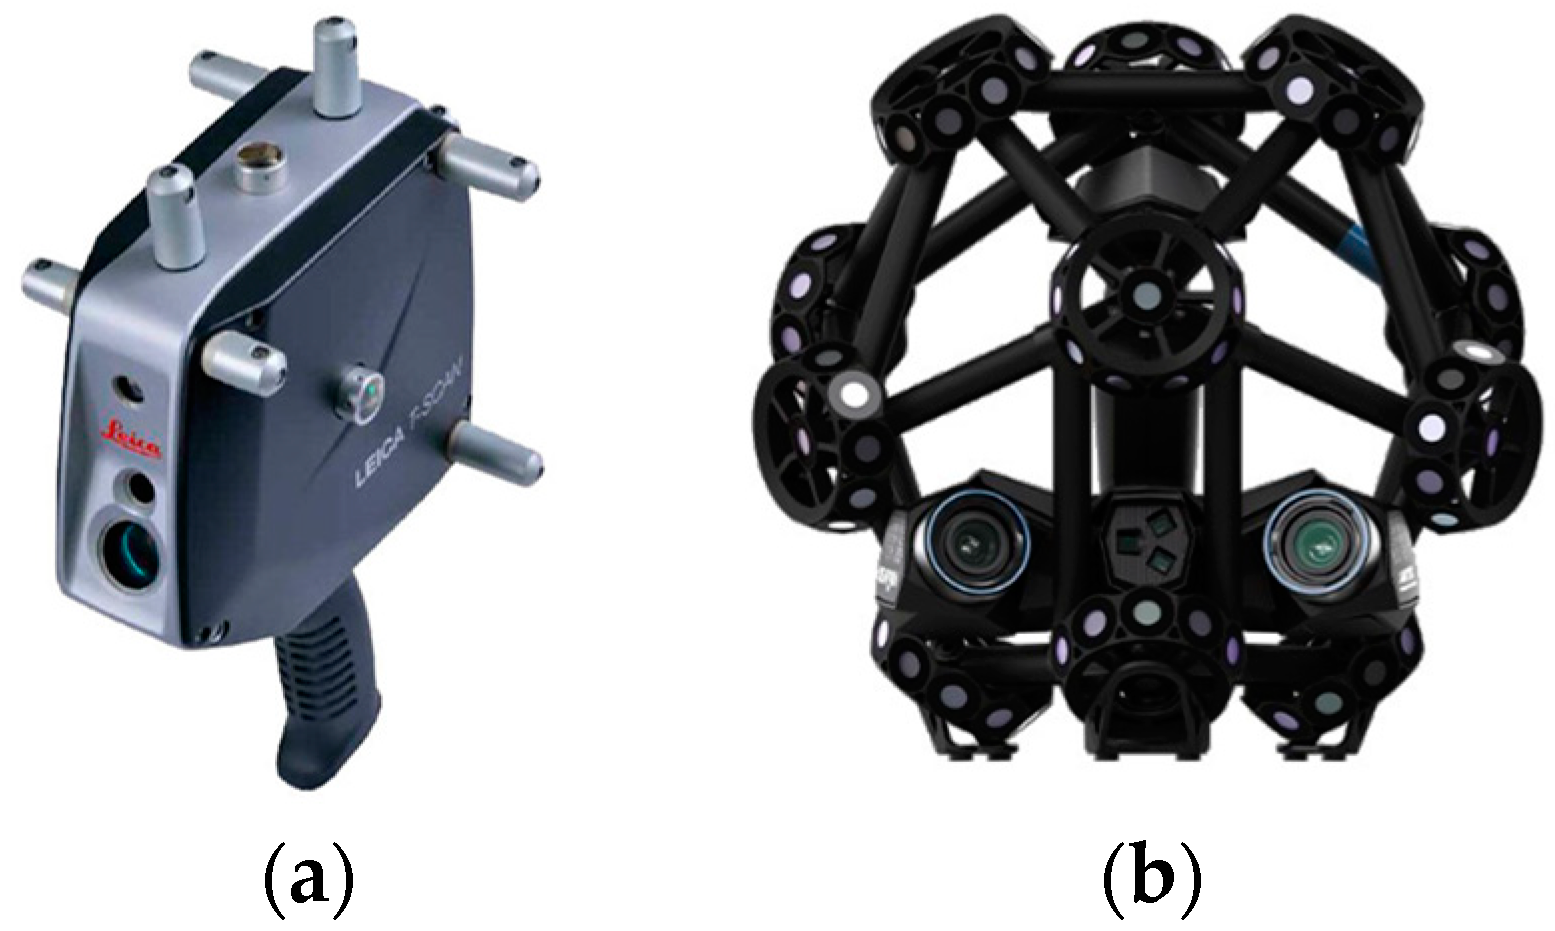
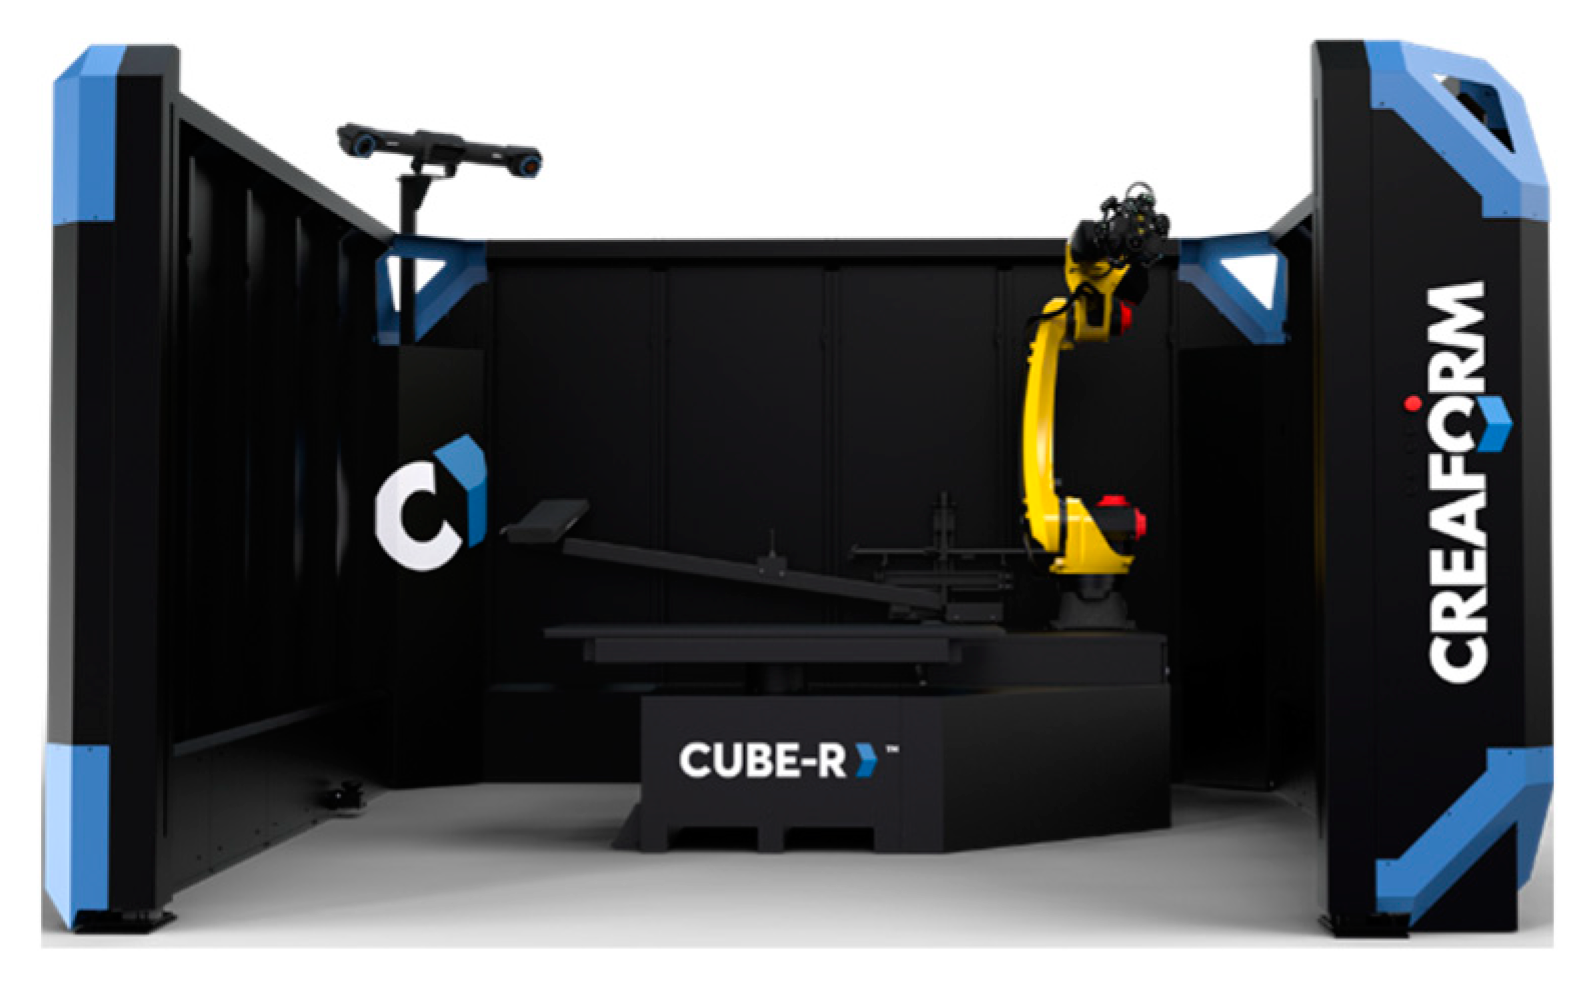
2.1. Line Laser Scanner Scanning Measurement

2.1.1. Measuring Principle of the Line Laser Scanner

The basic principle of the line laser scanner to obtain point cloud data is triangulation. Triangulation has the advantages of high acquisition accuracy, fast response time, and strong anti-interference capability, and has become the first choice for many three-dimensional measurement devices. Its measurement principle is shown in Figure 4.
During the measurement process, the laser line is emitted from the laser and directed through the converging lens onto the surface of the part to be measured. After modulating the surface of the part to be measured, the reflected laser line passes through the receiving lens to form a light spot on the vision sensor. As the height of the surface of the part to be measured is different, the position of the light spot on the vision sensor is offset accordingly. If the surface of the part to be measured is at reference surface D , the spot on the vision sensor will be at point F . If the surface of the part to be measured is higher than the reference surface at a distance of y, the spot on the vision sensor will be at point F and the spot offset on the vision sensor will be x = F F ; conversely, if the surface of the part to be measured is lower than the reference surface at a distance of y, the spot on the vision sensor will be at point F and the spot offset on the vision sensor will be x = F F . The relationship between the actual displacement of the part to be measured and the imaging displacement is shown in Equation (1):
y = a x sin β b sin α ± x sin ( α + β )
As can be seen from the above principles, the line laser scanner is able to obtain the two-dimensional height displacement distance of the points on the surface to be measured in the reference plane, and all the data obtained are based on the scanner’s local coordinate system. The measuring system is calibrated by the use of a one-dimensional calibration bar and calibration plate. The internal and external parametric errors of the two cameras of the optical tracking system and structural parameters of the scanner are thus calculated precisely; because the angle between the camera and the scanner is known, these values can be used to triangulate the spatial position of the scanner in 3D space and unify the point cloud data obtained by the scanner into the tracking system. The point cloud data acquired by the scanner are unified into the measurement coordinate system of the tracking system, and the 3D coordinates of the point cloud data under the measurement coordinate system are obtained. The point cloud data are stitched together to ensure the overall measurement accuracy of the model. The measurement system consisting of the line laser scanner and the optical tracking system is shown in Figure 5.

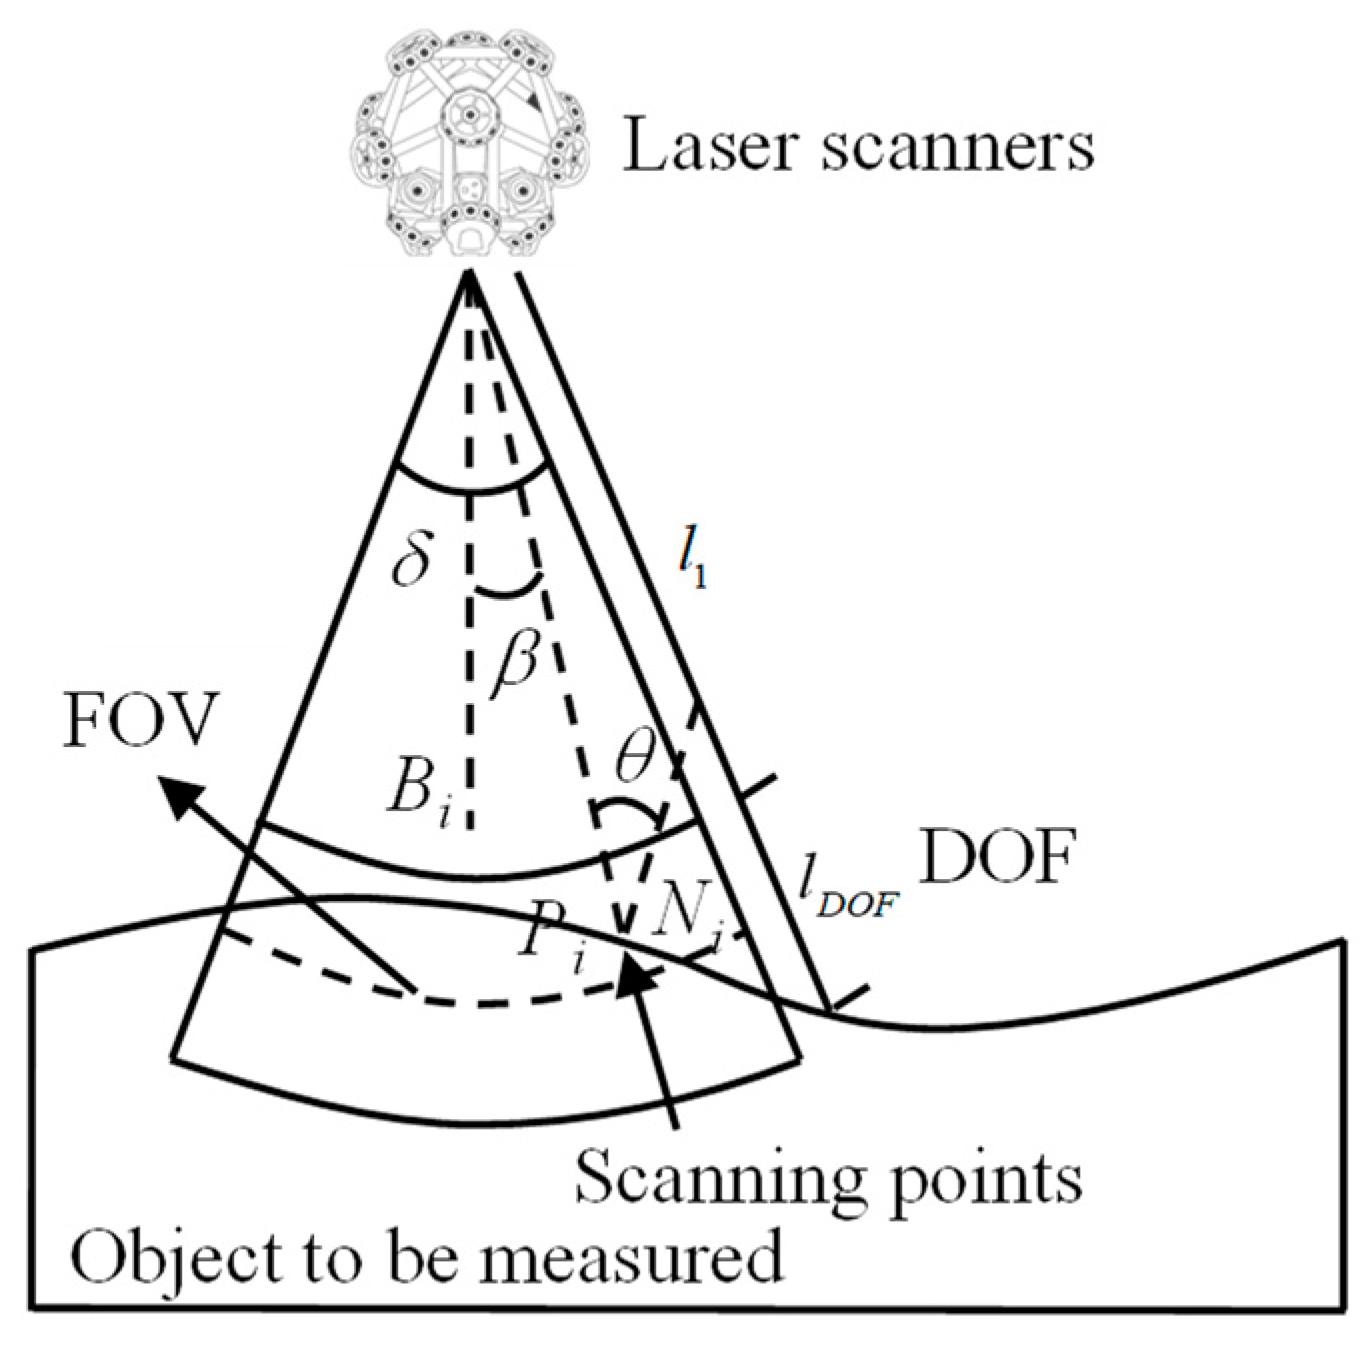
2.1.2. Measurement Constraints of the Line Laser Scanner

Due to the limitations of the measurement principle and hardware performance, there are constraints that need to be met in order to effectively collect geometric data on a surface for the line laser scanner. The line laser scanner measurement constraints include equipment constraints, environmental constraints, and material constraints. As the ambient light and the material of the part to be measured have less influence on the line laser scanner, this paper mainly considers the instrument constraints for the scanning viewpoint planning.
The instrument constraints of the scanner were analyzed and a measurement model was established, as shown in Figure 6.
P i denotes a point on the surface to be measured, N i is the unit normal vector of the surface point P i , L denotes the spatial position of the laser center point of the laser scanner, and B i denotes the angular bisector of the field of view. The measurement model is described as follows:
(1)
Measurement inclination: the angle between the inverse vector of the normal vector of the surface measurement point and the incident laser line θ . The angle θ directly determines whether the laser scanner can receive the reflected light from the surface to be measured. When θ = 0 , the maximum density of surface measurement points can be collected. In practice, θ cannot exceed the limiting threshold γ; it can be written by the following equations:
arccos d i N i γ
d i = L P i / L P i
(2)
Measuring field of view (FOV): the surface measurement point needs to lie within the field of view angle boundary line, i.e., the angle between the scan direction vector d i and vector B i is less than half the field of view angle, to ensure that the surface measurement point lies within the effective length of the laser stripe, which is subject to the following conditions:
arccos d i B i δ / 2
(3)
Measuring depth of field (DOF): the laser scanner can only guarantee the acquisition of a surface measurement point when it is within a certain distance from the surface to be measured, a distance that satisfies the following conditions:
l 1 L P i l 1 + l D O F
(4)
Optimal measurement distance: the distance at which the highest quality surface measurement points can be acquired, which is at half-field depth.
(5)
No occlusion constraint: the incident and reflected laser lines of the laser scanner need to be unobstructed. Obstruction of the incident laser line will result in the laser not being able to illuminate the surface to be measured, and obstruction of the reflected laser line will result in the vision sensor not being able to calculate the measurement point data.
(6)
Collision-free constraint: during the scanning and measuring process of the part to be measured, collisions between the laser scanner, the robot, and the part must be avoided to prevent damage of the laser scanner or the part to be measured.

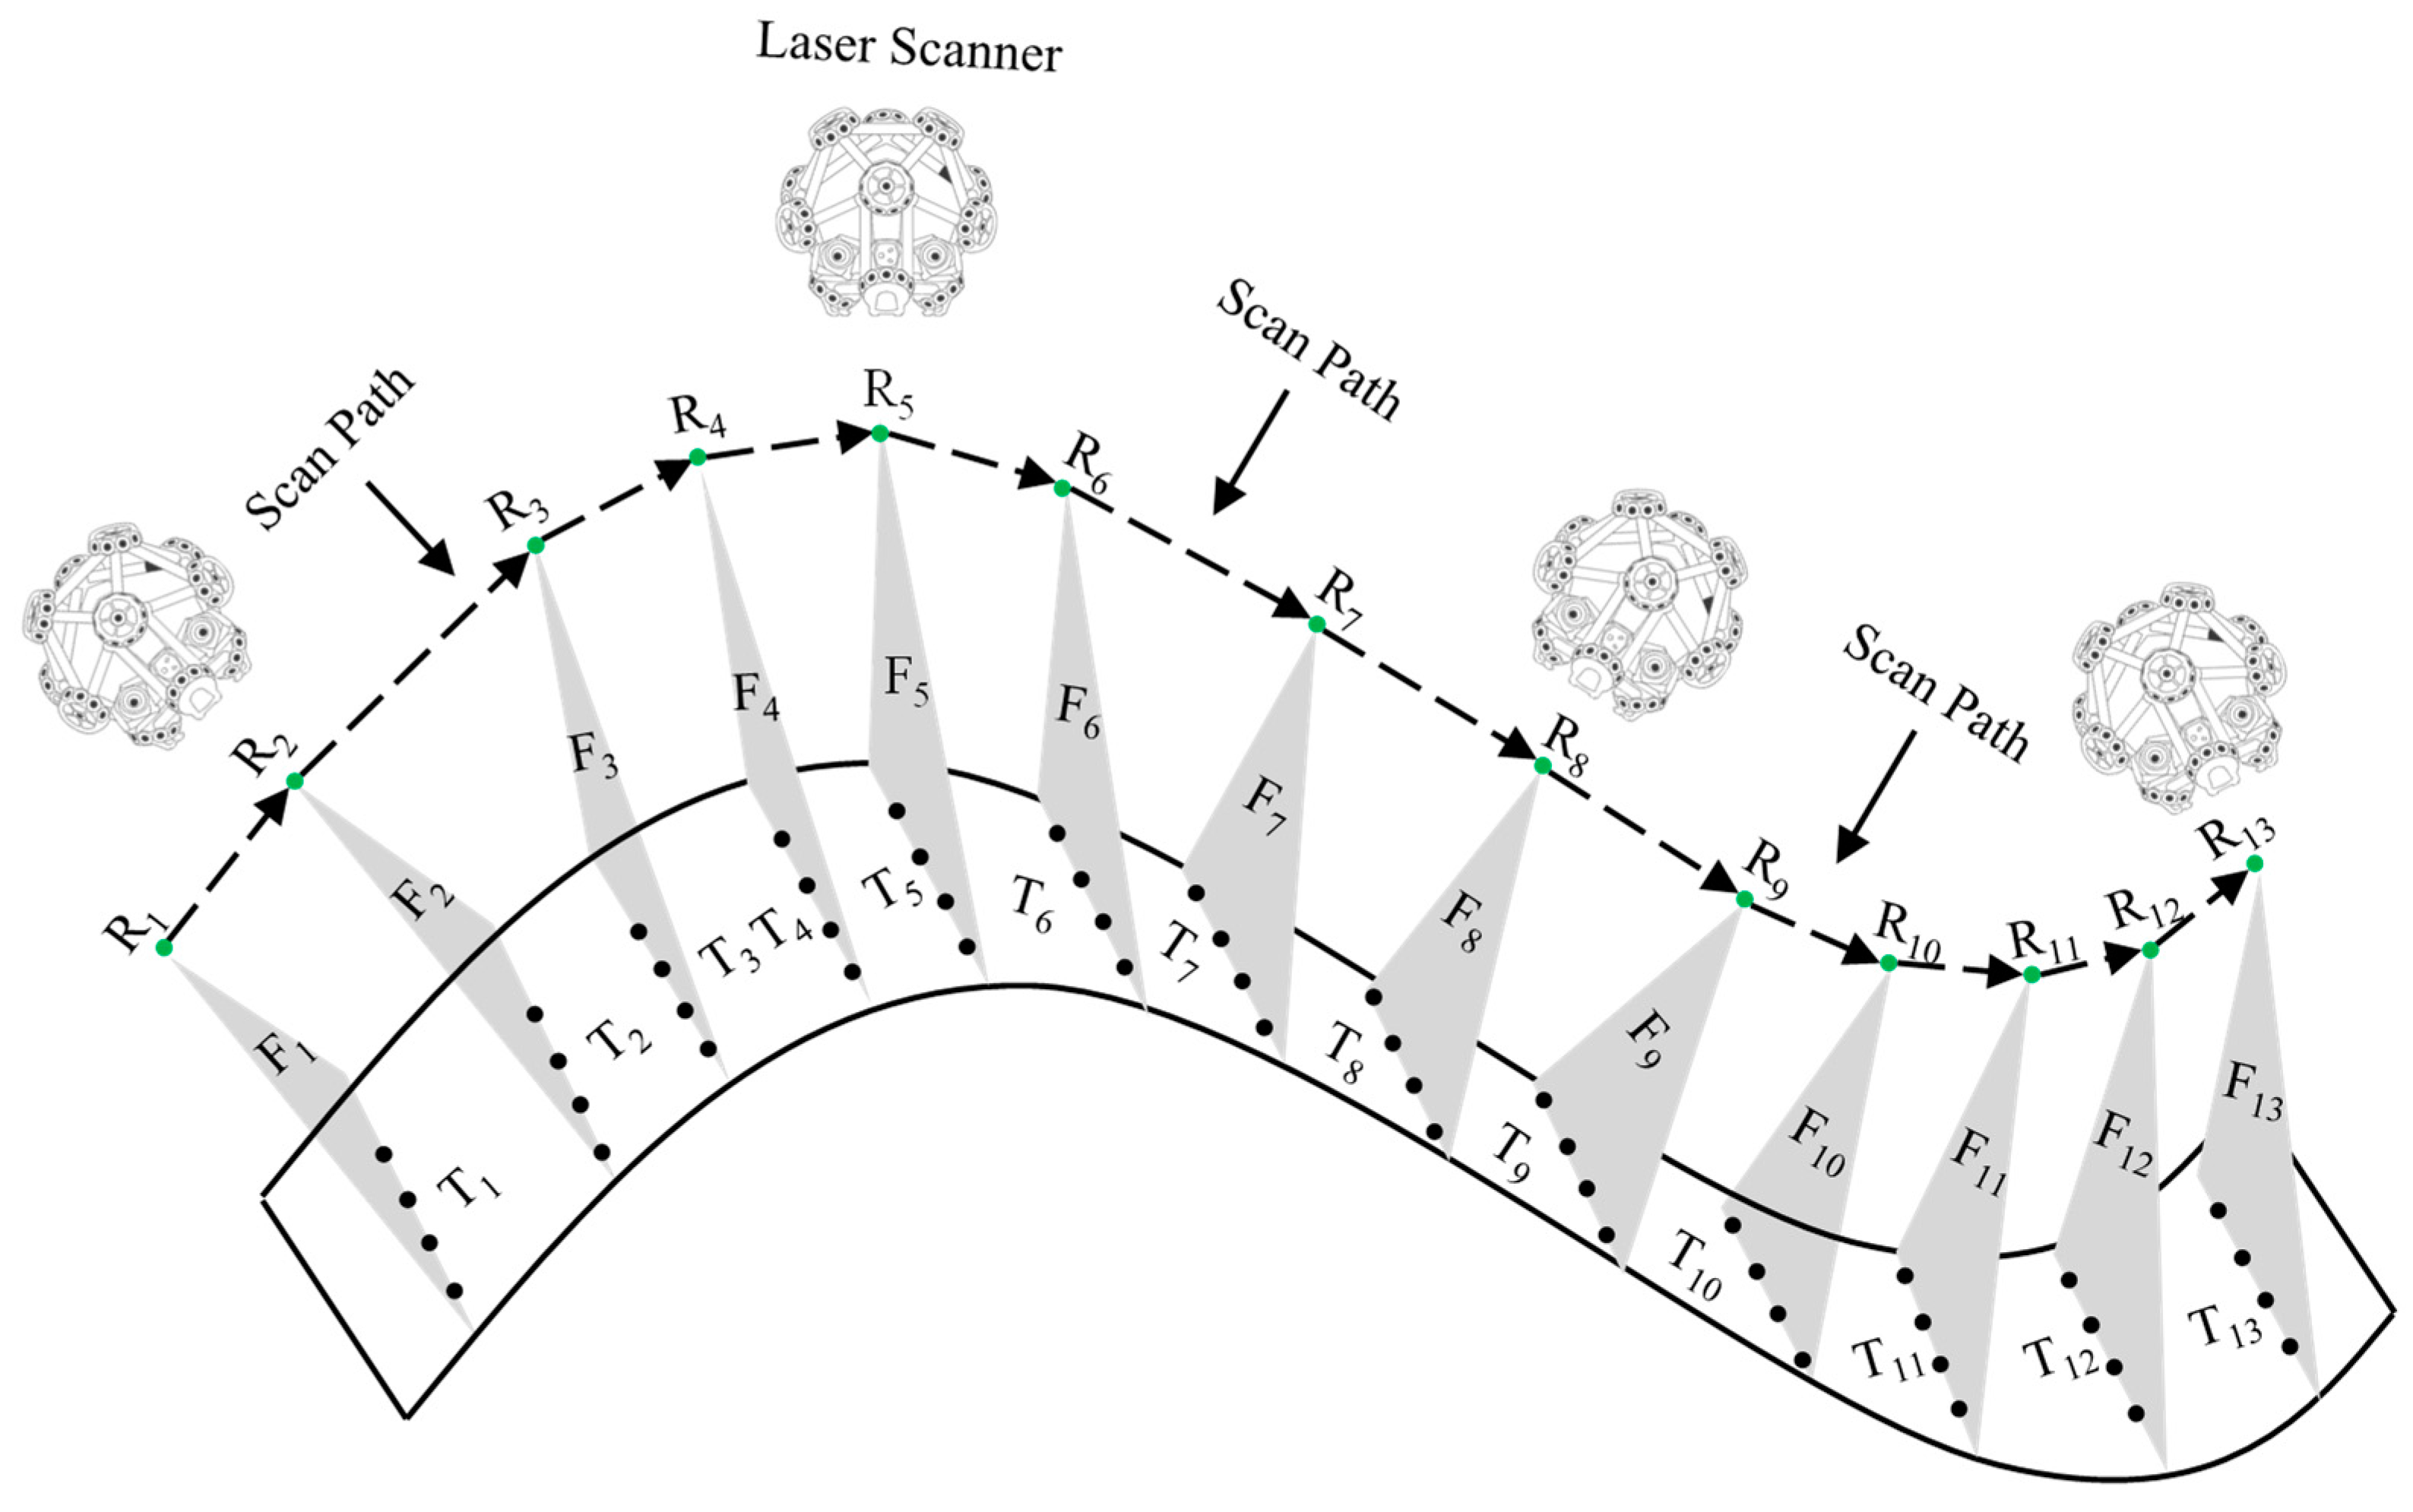
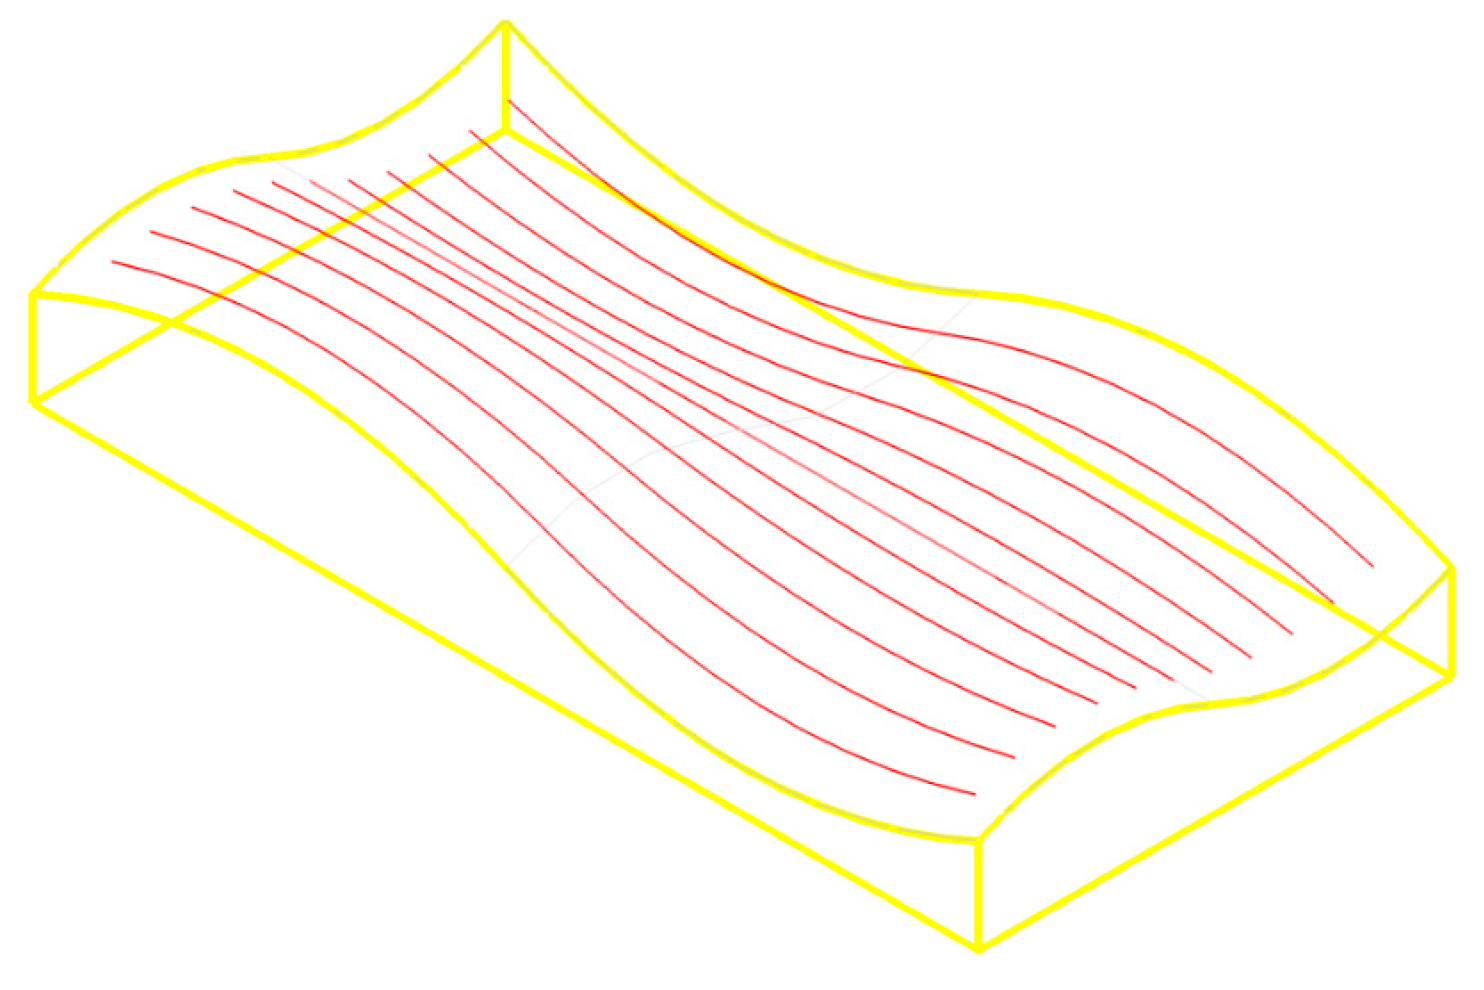
2.1.3. Line Laser Scanner Scan Path Composition

As shown in Figure 7, the laser scanner’s scan path planning consists of three main components: surface measurement points, scan viewpoints, and scan attitudes, where each scan viewpoint corresponds to a scan attitude, and the scan path is essentially the integrated result of a series of scan viewpoints and scan attitudes.
T 1 , T 2 , T 3 T 13 is the surface measurement point formed by sampling the free-form surface, where coordinates and normal vectors can be calculated; R 1 , R 2 , R 3 R 13 are the scanning viewpoints that satisfy the measurement constraints of the laser scanner; F 1 , F 2 , F 3 F 13 is the scanning attitude corresponding to the position of each scanning viewpoint. In the actual scanning measurement process, the laser scanner scans along the path from R 1 to R 2 with the F 1 scanning attitude, moves to the R 2 position, first adjusts to the   F 2 scanning attitude, and then scans along the path from R 2 to R 3 with the F 2 scanning attitude, etc. The entire scanning and measuring process is completed by moving to position R 13 . In summary, scan path planning is essentially scan viewpoint planning and scan attitude calculation.

2.2. Free-Form Scan Path Planning Method

The free-form scan path planning method consists of four steps, which are sampling of free-form surfaces, scanning viewpoint planning, scanning attitude calculation, and scan path generation.

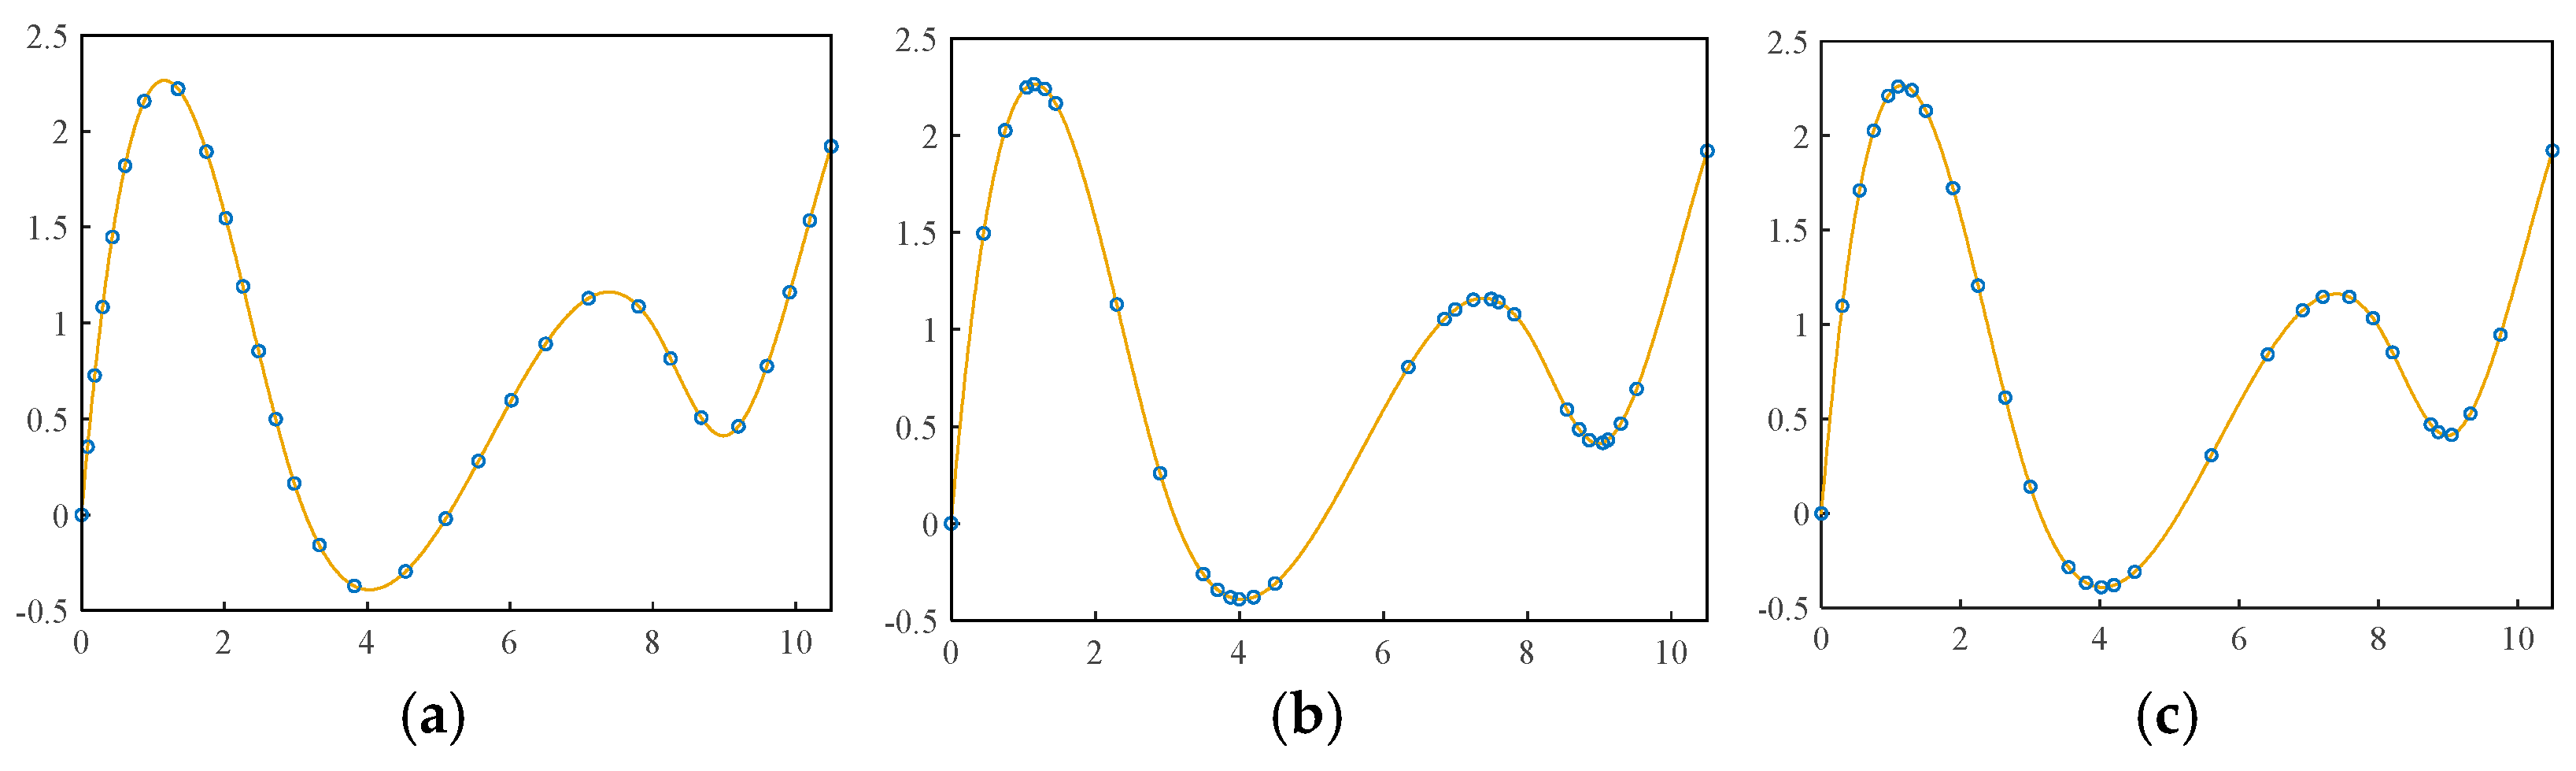
2.2.1. Adaptive Sampling Method

In order to complete the scanning measurement of free-form surfaces, the “surface-curve-point set-measurement point set” feature decomposition method can be used to discretize the free-form surface into a series of digital measurement points, and the information of the free-form surface can be replaced by the surface measurement points for subsequent calculations. Firstly, the adaptive sampling method of free curves is proposed, and based on this, the adaptive sampling method for free surfaces is proposed for the line laser scanner.

Adaptive Sampling Methods of Free Curves

The traditional sampling methods of free curves are the equal arc-length method and the equal chord-height method. For surfaces with large curvature changes, it is difficult for equal arc-length sampling to show the geometric characteristics of the areas with large curvature changes. Although equal chord-height sampling can reflect the geometric characteristics of the areas with large curvature changes, it may lead to a too dense distribution of sampling points in areas with sharp curvature changes and a too sparse distribution in areas with gentle curvature changes, which is not conducive to scanning the entire surface, and the number of iterations is too many and the sampling efficiency is too low.
The adaptive sampling method for a free-form surface is proposed. The adaptive sampling method combines the advantages of the equal chord-height sampling method and the curvature distribution method, and improves the reconstruction accuracy by setting the dynamic chord-height threshold and increasing the sampling midpoint.
First, the chord-height threshold corresponding to each sampling point is adjusted by calculating the ratio of the curvature of each sampling point to the average curvature. The chord-height threshold of the nth sampling point is set as shown in Formula (6):
h N = A K ¯ K N P h ¯ ( N = 1 , 2 , 3 )
where KN is the curvature of the nth sampling point, K ¯ is the average curvature of all sampling points, h ¯ is the average chord height of all sampling points, and A and P are optimization coefficients, which are optimized according to the overall shape of the free curve. The value of A affects the number of sampling points. The larger the value of A, the greater the chord-height threshold, and the more sampling points; the greater the p value, the denser the distribution of sampling points in the area with sharp curvature changes.
For free-form curves with a large curvature difference, in order to prevent the sparse distribution of sampling points in areas with gentle curvature change and large interpolation error, it is necessary to ensure the sampling density at places with a gentle curvature change, and set the maximum sampling spacing D, as shown in Formula (7):
D = K max K min × D ¯
where Kmax is the curvature of the sampling point with the maximum curvature, Kmin is the curvature of the sampling point with the minimum curvature, and D ¯ is the average distance between all adjacent sampling points.
The overall process of sampling points can be divided into the following three steps:
(1) Carry out equal arc-length sampling and calculate the information of all sampling points.
Set the number of sampling points as N, preliminarily sample the free curve, and calculate the information of all sampling points to be sampled, including the curvature and chord height of each sampling points, and the distance between adjacent sampling points. The curvature of the sampling point is calculated by the arc approximation method, as shown in Formula (8):
K i = L u i × L u i L u i 3
where Ki is the curvature of the free curve L(u) at u = ui.
(2) Set the optimization coefficient and calculate the dynamic chord-height threshold.
The method for setting the A value is as follows: first, limit the A value to 0.5–1.5. Because the p value has little effect on the number of sampling points, the p value can be initially set to 1. The value of A is set to 1. When K N > ( κ max / κ min ) 1 / 2 is used, it is regarded as the area with a great curvature change, and the number of areas with a great curvature change M is obtained, R = N × α%, α∈(0, 100), which is set to 10 in this method. If R < M, set R = M. Iterate the value of A until R sampling points are obtained, and finally the set value of A is obtained.
The method for setting the p value is as follows: after determining the A value, the p value can be incrementally optimized. Each iteration step of the p value is 0.01. After obtaining the p value by each increment, the curve sampling is carried out, and RMSE is selected as the interpolation error evaluation index for free curve interpolation reconstruction. The minimum optimal value of RMSE after free curve interpolation reconstruction is obtained, and the set value of p is obtained.
After setting the optimization coefficient, the dynamic chord-height threshold and the maximum sampling interval can be calculated according to Formulas (6) and (7).
(3) Increase the sampling midpoint.
In order to prevent large interpolation errors between adjacent regions with sharp curvature changes, increasing the sampling midpoint in the regions with sharp curvature changes can make the sampling points better reflect the characteristics of the regions with sharp curvature changes, so as to improve the reconstruction accuracy. The specific steps are as follows:
First, traverse all sampling points and calculate the curvature ratio Ki between all adjacent sampling points, as shown in Formula (9):
K i = K i / K i 1 i > 1 K 1 / K n i = 1
Then, arrange the curvature ratios in descending order according to the value. When Ki < 1, take the reciprocal of Ki and participate in the arrangement instead of Ki; finally, set the value of M as the curvature threshold Kth.
Traverse all sampling points and compare the size relationship between Kth and Ki, and between Kth and 1/Ki. When KiKth or Ki ≤ 1/Kth, the sampling midpoint is added in the curve segment between adjacent sampling points according to the isoparametric sampling method. Set n = n + 1 after each additional sampling point, and renumber the sampling points in sequence. Repeat the above steps until all Ki meet 1/Kth< Ki < Kth, and finally output the final sampling points.
The same sampling numbers are set, and the distributions of measuring points with different sampling methods are shown in Figure 8. The sampling points obtained by the equal arc-length method are evenly distributed and have no curvature adaptability. The equal chord-height method and the adaptive sampling method have certain curvature adaptability. However, the distribution of sampling points obtained by the equal chord-height method is not uniform, and the distribution of sampling points is too dense in the region with drastic curvature change and too sparse in the region with gentle curvature change. The distribution of sampling points obtained by adaptive sampling method is more uniform, which can ensure that the region with gentle curvature change has sufficient sampling density.

Adaptive Sampling Method for Laser Line Scan of Free-Form Surfaces

According to the “surface-curve” decomposition order, the surface needs to be discretized into a series of isoparametric lines in the direction of the guide lines. A common way to discretize the surface is to calculate the parameter values of the discrete isoparametric lines in the direction of the guide line by dividing the parameter domain in the direction of the sweep line by isoparametric or isometric divisions.
For digital measurement of free-form surfaces, discrete isoparametric lines must better reflect the surface shape in order to ensure that more surface measurement points are distributed in areas where the surface shape varies significantly. As shown in Figure 9, once the isoparametric direction is determined, one isoparametric line in the sweeping direction of the free-form surface can be adaptively discretized into a series of sampling points, and the parameter value of each sampling point is the parameter value of the discrete isoparametric line.
After discretizing the surface into a series of isoparametric lines, the isoparametric lines need to be discretized into a series of point sets according to the “curve-point set” decomposition order. Then, the surface measurement points are obtained by sampling the isoparametric lines with the adaptive sampling method of free curves mentioned above.
The free-form sampling method for laser line scanning is based on the construction of a viewpoint plane and the Boolean intersection of the viewpoint plane with the discrete isoparametric lines of the surface to obtain the surface measurement points. As shown in Figure 10, by constructing the viewpoint plane to measure the free-form surface, the movement of the viewpoint plane can be regarded as the movement of the line laser scanner, and the surface measurement points obtained from each intersection are on the viewpoint plane, which not only conforms to the working principle of the line laser scanner, but also ensures the integrity of the surface measurement.

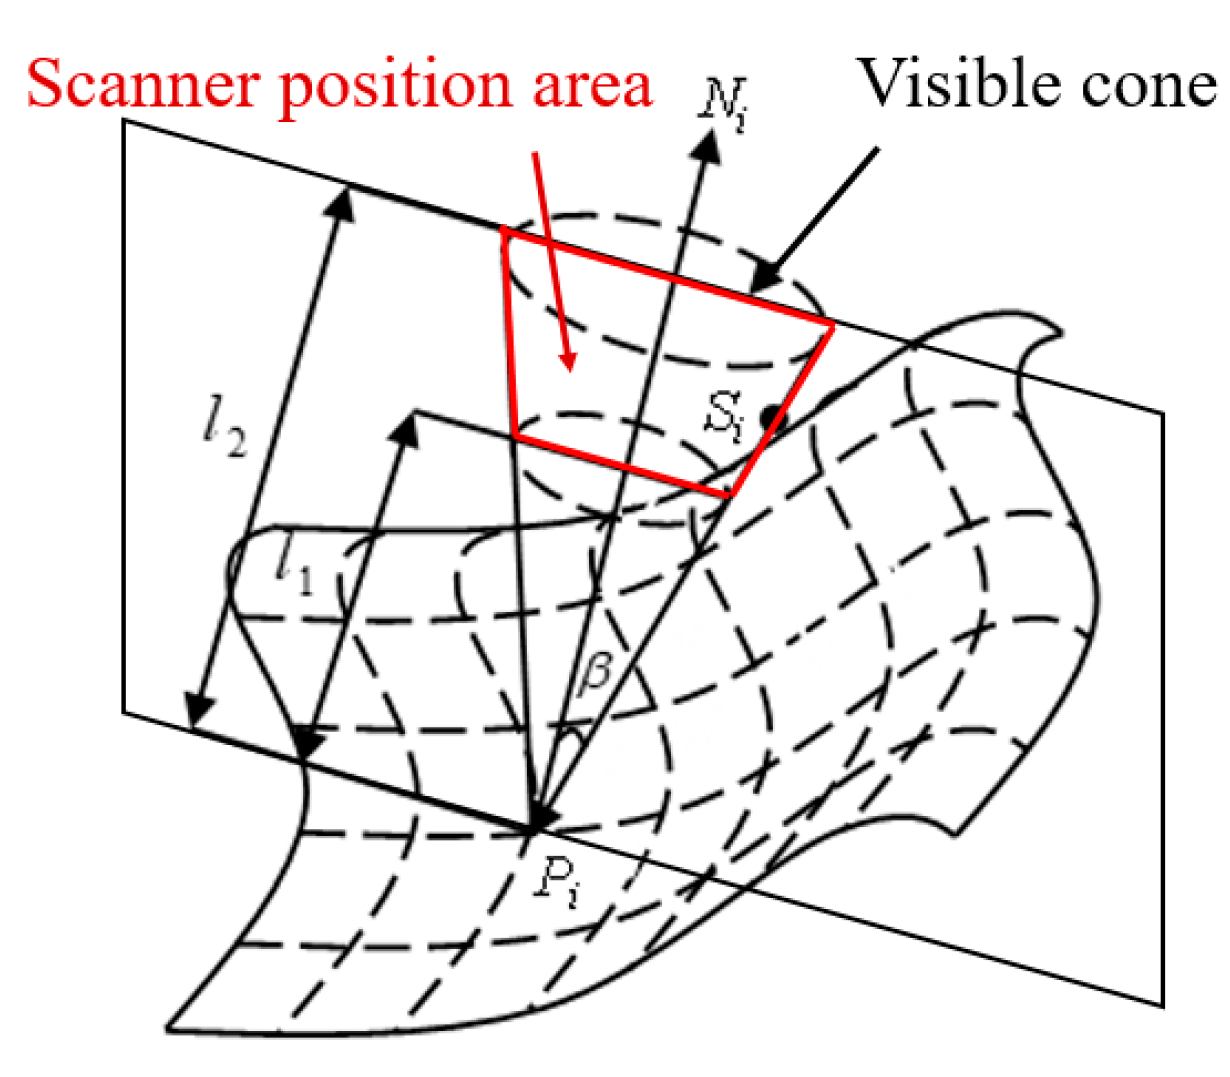
2.2.2. Scanning Viewpoint Planning Based on Viewable Cones

The concept of the viewable cone is applied to the 3D scanning process to perform the scan viewpoint calculation. As shown in Figure 11, P i is the surface measurement point, N i is the unit normal vector of P i , β is the angle between the vector P i S i and the normal vector   N i , S i is the scanning viewpoint, S i P i is the scanning direction vector, l 1 is the near depth of field distance, and l 2 is the far depth of field distance. According to the scanner measurement constraints, the set of scan direction vectors S i P i can form a cone with P i as the vertex, the unit normal vector N i as the cone axis, the depth of field l 2 as the cone height, and the measuring field of view δ as the cone angle in the visible range, called the viewable cone of the surface measurement point P i . When the scanned viewpoint S i lies within the viewable cone, the maximum angle between the vector P i S i and the normal vector N i is the measuring field of view angle δ , satisfying the measuring field of the view constraint, and when the scanned viewpoint S i lies between the near depth of field distance l 1 and the far depth of field distance l 2 , it satisfies the depth of the field constraint.
As shown in Figure 11, according to the scanning viewable cone concept, it is known that each surface measurement point corresponds to a cone table, and a trapezoidal region can be obtained by Boolean intersection of the cone table with the corresponding viewpoint plane. When the line laser scanner is located in this region, it can not only truly reflect the working principle of laser line scanning, but also satisfy the field of view constraint and the depth of field constraint of the line laser scanner.
As shown in Figure 12, starting from the intersection of the scanner position areas corresponding to adjacent surface measurement points, the optimal scan position area that meets the field of view requirements is continuously searched by a stepwise optimization method. The number of scanning viewpoints can be reduced based on the fact that all surface measurement points can be collected, so that the planned scanning viewpoints can observe multiple surface measurement points at the same time, reducing repeated scanning measurements and reducing measurement uncertainty.

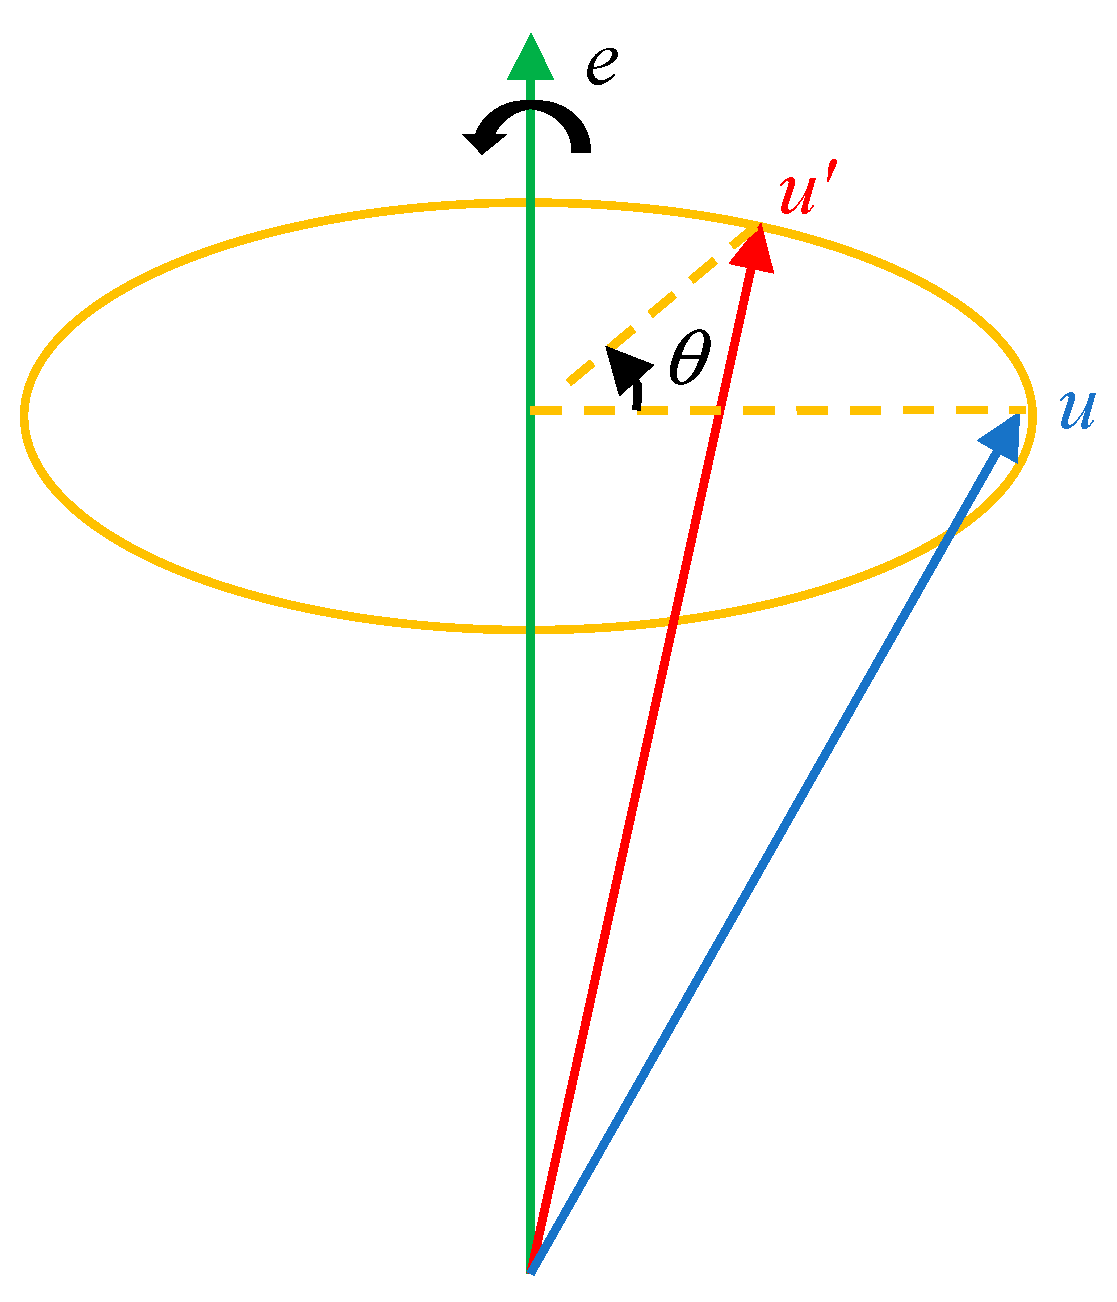
2.2.3. Quaternion-Based Scanning Attitude Calculation

According to the adaptive sampling method for laser line scanning of the free-form surface, the scanner moves in the direction of the normal vector of the viewpoint plane, which is set as the Y-axis direction of the scanner, as shown by the blue arrow in Figure 13. Based on the Boolean intersection of the visible area, four surface measurement points can be collected at the same time, where n 1 ~ n 4 represents the normal vector of the surface measurement point on the free-form surface and n 1 ~ n 4 represents the vector after   n 1 ~ n 4 is inverted. Using the scanning viewpoint position as the starting point, n 1 ~ n 4   is unitized and summed, and the final vector is the scanning direction, which is set as the Z-axis direction of the scanner, as shown by the red arrow in the figure. According to the right-handed coordinate system rule, the X-axis direction can be determined by the Y-axis direction and Z-axis direction, as shown by the green arrow in the figure.
The rotation matrix R of the scanner coordinate system with respect to the workpiece coordinate system is obtained from the three unit vectors of the scanning attitude, as shown in Equation (10):
R = r 11 r 12 r 13 r 21 r 22 r 23 r 31 r 32 r 33
As shown in Figure 14, suppose there is a unit vector rotation axis = ( x , y , z ) T that passes through the origin, and a vector u is transformed to u′ by rotating the angle θ along this rotation axis.
It can be deduced that the representation of u′ after any vector u in three-dimensional space is rotated along the unit vector e by the angle θ , as shown in Equation (11):
u = cos ( θ ) u + ( 1 cos ( θ ) ) ( e u ) e + sin ( θ ) ( e × u )
The u′ of any vector u after rotating the angle along the rotation axis e defined by the unit vector can be obtained using the quaternion multiplication method. By expressing the initial vector as a pure quaternion, and the rotation angle and rotation axis as unit quaternions, the solution of the vector u′ after rotation is shown in Equation (12):
u = Q p Q = Q p Q 1
Suppose there is a unit quaternion Q = [ a , b ] and its corresponding rotation angle is shown in Equation (13):
θ 2 = cos 1 ( a )
The axis of rotation of the rotational transformation is shown in Equation (14):
e = b sin cos 1 ( a )
According to the rotation matrix R represented by Equation (10), the quaternion is solved as shown in Equation (15):
q 0 = r 11 + r 22 + r 33 + 1 / 2 q 1 = r 32 r 23 r 32 r 23 r 11 r 22 r 33 + 1 / 2 q 2 = r 13 r 31 r 13 r 31 r 22 r 11 r 33 + 1 / 2 q 3 = r 21 r 12 r 21 r 12 r 33 r 11 r 22 + 1 / 2

2.2.4. Scan Path Generation Based on Bi-Directional Scanning

The free-form surface generally has a large curvature change, and the number of scan path segments in the annular tangent scan method is large, the scan posture adjustment frequency is high, and the scan path is more complex. Considering the number of scanning posture adjustments and the length of the scan path, it is determined that the free-form surface scan path should be a bi-directional scanning method.
As shown in Figure 15, firstly, multiple scan viewpoints on each viewpoint plane are numbered in the order from inside to outside. Then, the first scan path is created by connecting the first scan viewpoint on each viewpoint plane and the second scan viewpoint on each viewpoint plane, and the second scan path is created by connecting the N scan viewpoints on each viewpoint plane, until the Nth scan path is created by connecting the N scan viewpoints on each viewpoint plane in turn. Finally, the end scan viewpoint of the adjacent scan path is connected with the start scan viewpoint until the N scan paths are traversed, and a complete bi-directional scan path can be generated automatically.

3. Experiments and Discussions

3.1. Simulation of Scanning Measurement Processes

In this paper, a free-form surface with dimensions of 500 mm × 250 mm was used as the workpiece to be measured, and a scanning measurement path was generated based on the method proposed in this paper. The scanning and measuring process of the robot’s 3D scanning and measuring system according to the planned path was simulated based on RobotStudio 6.08 software. An ABB six-degree-of-freedom industrial robot, ABB IRB1200, was selected and MetraSCAN 3D-R was installed at the end of the robot. The C-Track optical tracking system was placed in a reasonable position to ensure that the MetraSCAN 3D-R could be detected within its working volume.
The path point reachability was simulated to check the reachability of each path point during the scanning and measuring process of the robot in RobotStudio 6.08 software, so that there was a robot joint angle inverse solution at each path point to ensure that the robot could complete the measuring task safely and reliably. The duration of the scanning and measuring process was calculated and the industrial robot motion command file of the scanning and measuring process was generated in RobotStudio 6.08 software.

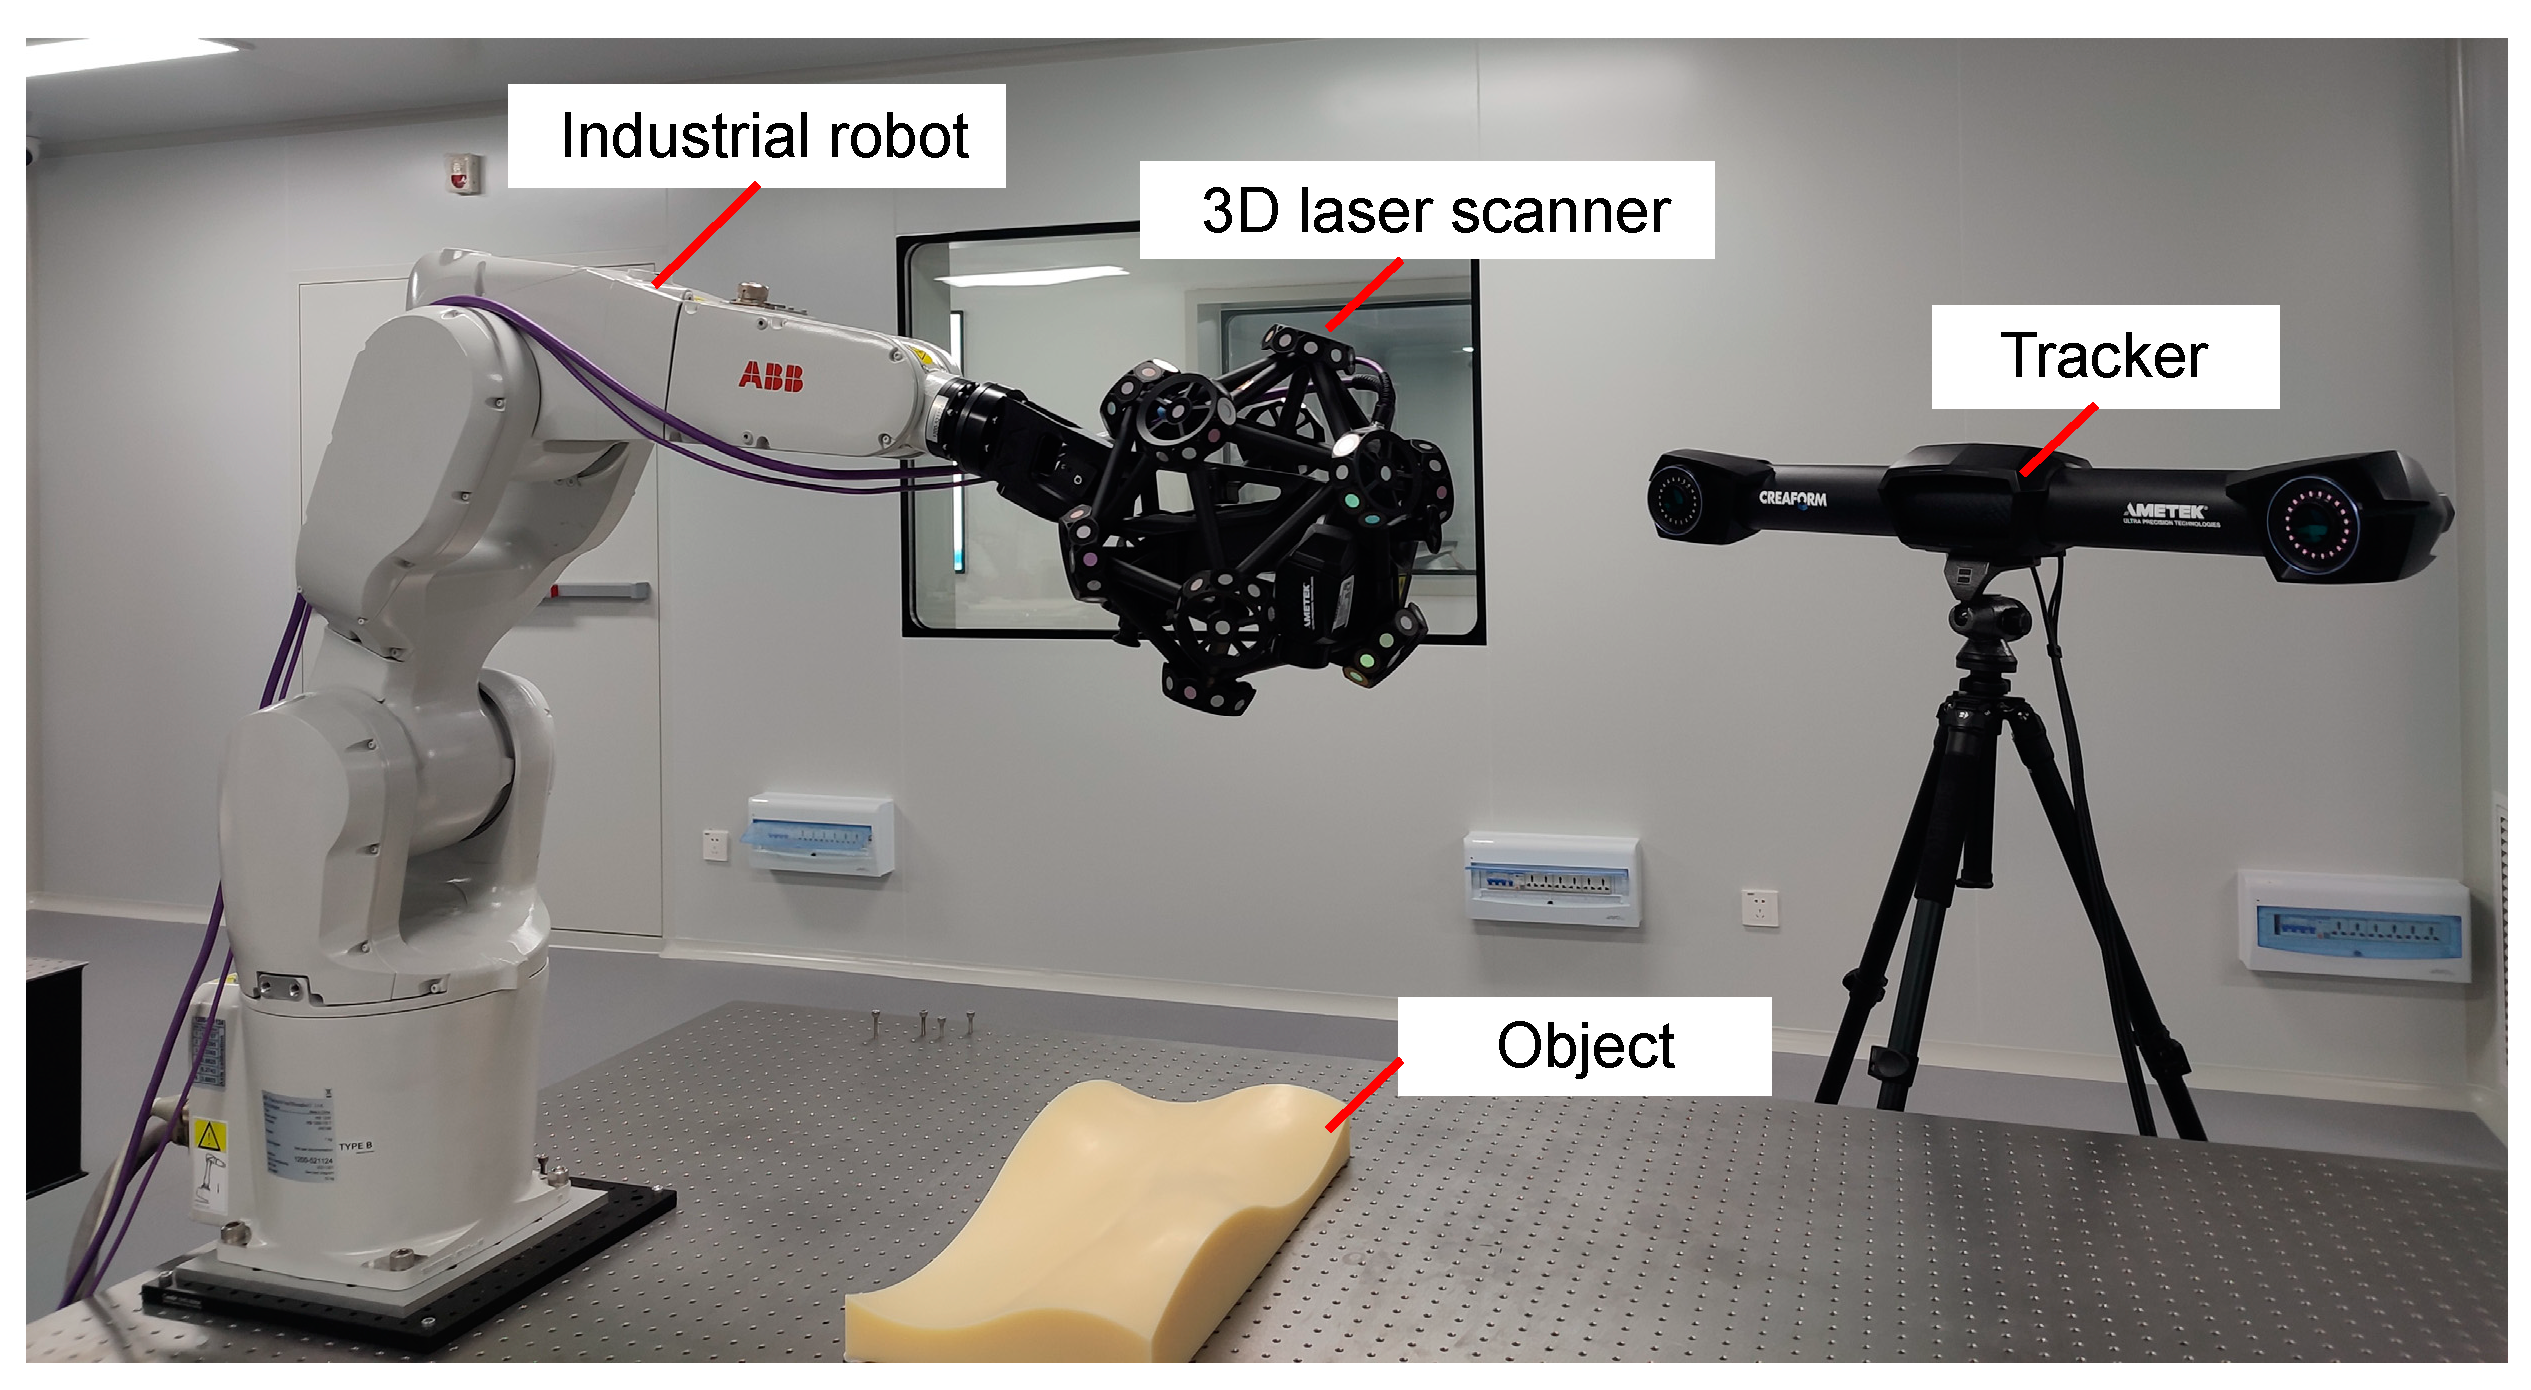
3.2. Robotic 3D Scanning and Point Cloud Reconstruction Experiments

As shown in Figure 16, the constructed experimental system consisted of an industrial robot, a 3D laser scanner, a tracker, and a free-form surface part to be measured. In order to align the object to the industrial robot, four pairs of marker points, which were the four corners of the industrial robot base and the four corners of the object base to be tested, were set, and the two-dimensional distance in the XY-direction of the four pairs of marker points in the simulation environment were obtained. Then, the industrial robot was fixed and the vernier caliper was used to measure the distance of the relevant mark points to obtain the position of the corresponding mark points on the actual optical platform. Then, the object was placed corresponding to the actual mark point position to complete the actual positioning work.
In order to reduce the impact of machining errors on the measurement accuracy judgment, the free-form surface used in the system was calibrated by the high-precision coordinate measuring machine (CMM). The measurement accuracy of the CMM is 2.1 μm, which is much higher than that of the 3D laser scanner, so the measurement data from the CMM could be used as a reference value to verify the measurement accuracy of the planned path.
The industrial robot motion command file was loaded to the industrial robot, and the industrial robot moved along the scanning measurement path generated based on the measurement method proposed in this paper. The obtained measurement results of the free-form surfaces and the measurement results of the 3D laser scanner were compared and analyzed based on Polyworks commercial software, and the above process was repeated three times to verify the stability of the measurement accuracy.
Based on the adaptive sampling method proposed in this article, the robot scanning measurement results were analyzed against the CMM’s measurement results. The CMM’s measurement results are points in 5 lines in the X-direction and 5 lines in the Y-direction, uniformly covering the free-form surface. The length of the measurement points in the X-direction was about 480.8 mm and the length in the Y-direction was about 230.4 mm. The number of all points was 1634. The CMM’s measurement results were set as standards (conventional true value), and the surface scanning error was the value difference in the Z-direction of the object of these points measured by the laser scanner and the CMM. The error distribution obtained is shown in Figure 17. It can be seen that the maximum deviations are 0.066 mm, 0.078 mm, and 0.069 mm, respectively. The standard deviations are 0.020 mm, 0.023 mm, and 0.022 mm. From the measurement results, it can be seen that the maximum error of the accuracy of the scanning measurement path generated based on the method proposed in this paper is within the accuracy range of the 3D laser scanner, which indicates that the generated scanning measurement path is guaranteed by the measurement accuracy of the 3D laser scanner.
Contrast experiments were carried out. The free-form sampling methods were the equal arc-length sampling method, equal chord-height sampling method, and GD method [9]. Except for the free-form sampling method, the steps (scanning viewpoint planning and scanning attitude calculation) were the same. The experimental results are listed in Table 1.
The experimental and simulation measuring times are almost the same. The difference may be caused by the actual operating states of the industrial robot, such as running speed varying in a small range. The scanning measurement accuracy proposed in this paper is significantly improved compared to the equal arc-length sampling method and the equal chord-height sampling method, especially in the maximum deviation aspect. This improvement can be attributed to the adaptive scanning strategy, which concentrates sampling points in regions with a high probability of deviation, thereby enhancing scanning accuracy. The proposed method achieves over four times higher scanning efficiency while also slightly improving accuracy compared to the GD method. This increased efficiency is due to a smaller number of sampling points and the bi-directional linear scanning strategy.

4. Conclusions

An adaptive sampling method for a free-form surface is proposed for a line laser scanner, which can realize the adaptive distribution of surface measurement points according to the curvature features of free-form surfaces. The sampling method overcomes the disadvantages of low precision by using the arc-length sampling method and equal chord-height sampling method, and further improves the scanning efficiency.
Integrated with the proposed adaptive sampling method, the automatic path planning method is proposed. This method consists of adaptive sampling, scanning attitude calculation based on a quaternion, scanning viewpoint planning based on viewable cones, and scan path generation based on bi-directional scanning. Based on the proposed automatic path planning method, the scanning and measuring robot can obtain complete 3D information of the surface to be measured with high measurement accuracy and efficiency.
Future work will focus on the following aspects: (1) exploring the effectiveness of the algorithm proposed in this paper for larger free-form surface measurements; (2) developing a more robust method to reduce computational complexity and enhance the real-time performance of the algorithm; and (3) preparing workpieces and applying the proposed method in actual industrial environments to assess the measurement effect.

Author Contributions

Methodology, H.J. and L.Y.; investigation, all authors; writing—original draft, H.J.; writing—review and editing, H.J., H.C. and L.Y.; validation, H.C.; experimental implementation, C.C.; formal analysis, Y.L.; data analysis, R.G.; software development, Y.H.; funding acquisition, L.Y. All authors have read and agreed to the published version of the manuscript.

Funding

This research was funded by the National Key Research and Development Program of China (2022YFF0705700), the National Natural Science Foundation of China (51927811), the Taishan Scholar Program of Shandong Province in China (tstp20230614 and tsqnz20221124) and the Young Elite Scientists Sponsorship Program by CAST (2022QNRC001).

Data Availability Statement

Data available on request due to restrictions, e.g., privacy or ethical.

Conflicts of Interest

The authors declare no conflicts of interest.

References

  1. Wang, Z.; Yin, M.; Ou, D.; Xie, L.; Liu, H.; Yin, G. Optical Measurement Method for Blade Profiles Based on Blade Self-Features. IEEE Trans. Ind. Electron. 2022, 69, 2067–2076. [Google Scholar] [CrossRef]
  2. Yang, S.; Jiang, X.; Xu, S.; Wang, X. Information theory based probabilistic approach to blade damage detection of turbomachine using sensor data. IEEE Trans. Ind. Electron. 2020, 67, 10887–10896. [Google Scholar] [CrossRef]
  3. Li, W.L.; Wang, G.; Zhang, G.; Li, Q.D.; Yin, Z.P. Interferencefree inspection path generation for impeller blades using an on-machine probe. IEEE/ASME Trans. Mechatron. 2017, 22, 1218–1226. [Google Scholar] [CrossRef]
  4. Bi, Q.; Huang, N.; Zhang, S.; Shuai, C.; Wang, Y. Adaptive machining for curved contour on deformed large skin based on on-machine measurement and isometric mapping. Int. J. Mach. Tools Manuf. 2019, 136, 34–44. [Google Scholar] [CrossRef]
  5. Glorieux, E.; Franciosa, P.; Ceglarek, D. Coverage path planning with targetted viewpoint sampling for robotic free-form surface inspection. Robot. Comput.-Integr. Manuf. 2020, 61, 101843. [Google Scholar] [CrossRef]
  6. Liu, Y.; Zhao, W.; Sun, R.; Yue, X. Optimal path planning for automated dimensional inspection of free-form surfaces. J. Manuf. Syst. 2020, 56, 84–92. [Google Scholar] [CrossRef]
  7. Gopinath, V.; Johansen, K.; Derelöv, M.; Gustafsson, Å.; Axelsson, S. Safe collaborative assembly on a continuously moving line with large industrial robots. Robot. Comput.-Integr. Manuf. 2021, 67, 102048. [Google Scholar] [CrossRef]
  8. Wang, J.; Gong, Z.; Tao, B.; Yin, Z. A 3-D reconstruction method for large freeform surfaces based on mobile robotic measurement and global optimization. IEEE Trans. Instrum. Meas. 2022, 71, 5006809. [Google Scholar] [CrossRef]
  9. Chen, C.; Jia, H.; Lu, Y.; Zhang, X.; Chen, H.; Yu, L. An Adaptive Hybrid Sampling Method for Free-Form Surfaces Based on Geodesic Distance. Sensors 2023, 23, 3224. [Google Scholar] [CrossRef]
  10. Babu, A.; Manoj, B.; Pasquale Franciosa, C.; Dariusz Ceglarek, D. Spatio-Temporal Adaptive Sampling for effective coverage measurement planning during quality inspection of free form surfaces using robotic 3D optical scanner. J. Manuf. Syst. 2019, 53, 93–108. [Google Scholar] [CrossRef]
  11. Pagani, L.A.; Scott, P.J.B. Curvature based sampling of curves and surfaces. Comput. Aided Geom. Des. 2018, 59, 32–48. [Google Scholar] [CrossRef]
  12. Zahmati, J.A.; Amirabadi, H.B.; Mehrad, V.C. A hybrid measurement sampling method for accurate inspection of geometric errors on freeform surfaces. Measurement 2018, 122, 155–167. [Google Scholar] [CrossRef]
  13. Yi, B.; Qiao, F.; Huang, N.; Wang, X.; Wu, S.; Biermann, D. Adaptive sampling point planning for free-form surface inspection under multi-geometric constraints. Precis. Eng. 2021, 72, 95–101. [Google Scholar] [CrossRef]
  14. Gu, K.; Chen, S.; You, X.; Li, Y.; Cui, J.; Wang, Y.; Liu, J. Sparse sampling and reconstruction for freeform surface based on low-rank matrix completion. Surf. Topogr. Metrol. Prop. 2021, 9, 045053. [Google Scholar] [CrossRef]
  15. Zhang, K.; Wang, W.; Zhao, B.; Chen, Y. A three-dimensional surface measurement system implemented with Gaussian process based adaptive sampling. Precis. Eng. 2021, 72, 595–603. [Google Scholar] [CrossRef]
  16. Liu, Y.; Zhao, W.; Liu, H.; Wang, Y.; Yue, X. Coverage Path Planning for Robotic Quality Inspection With Control on Measurement Uncertainty. IEEE/ASME Trans. Mechatron. 2022, 27, 3482–3493. [Google Scholar] [CrossRef]
  17. Feng, G.; Ziyue, P.; Xutao, Z.; Yan, L.; Jihao, D. An adaptive sampling method for accurate measurement of aeroengine blades. Measurement 2021, 173, 108531. [Google Scholar] [CrossRef]
  18. Zhang, B.; Feng, P.; Sun, Z.; Cheng, X.; Zeng, L.; Fan, C. Efficient sampling method based on co-kriging for free-form surface measurement. Precis. Eng. 2023, 84, 136–147. [Google Scholar] [CrossRef]
  19. Ding, L.J.; Dai, S.G.; Mu, P.A. CAD-based path planning for 3D laser scanning of complex surface. Procedia Comput. Sci. 2016, 92, 526–535. [Google Scholar] [CrossRef]
  20. Koutecký, T.; Paloušek, D.; Brandejs, J. Sensor planning system for fringe projection scanning of sheet metal parts. Measurement 2016, 94, 60–70. [Google Scholar] [CrossRef]
  21. Morozov, M.; Pierce, S.G.; MacLeod, C.N.; Mineo, C.; Summan, R. Off-line scan path planning for robotic NDT. Measurement 2018, 122, 284–290. [Google Scholar] [CrossRef]
  22. Li, L.; Xu, D.; Niu, L.; Lan, Y.; Xiong, X. A path planning method for a surface inspection system based on two-dimensional laser profile scanner. Int. J. Adv. Robot. Syst. 2019, 16, 1729881419862463. [Google Scholar] [CrossRef]
  23. Ziegler, J.; Gattringer, H.; Kaserer, D.; Müller, A. Automated, depth sensor based object detection and path planning for robot-aided 3d scanning. In Advances in Service and Industrial Robotics: Proceedings of the 26th International Conference on Robotics in Alpe-Adria-Danube Region, Poitiers, France, 21–23 June 2017; Springer: Cham, Switzerland, 2017. [Google Scholar]
  24. Phan, N.D.M.; Quinsat, Y.; Lavernhe, S.; Lartigue, C. Path planning of a laser-scanner with the control of overlap for 3d part inspection. Procedia Cirp 2018, 67, 392–397. [Google Scholar] [CrossRef]
  25. Wang, J.; Tao, B.; Gong, Z.; Yu, S.; Yin, Z. A mobile robotic measurement system for large-scale complex components based on optical scanning and visual tracking. Robot. Comput.-Integr. Manuf. 2021, 67, 102010. [Google Scholar] [CrossRef]
  26. Zong, Y.; Liang, J.; Pai, W.; Ye, M.; Ren, M.; Zhao, J.; Tang, Z.; Zhang, J. A high-efficiency and high-precision automatic 3D scanning system for industrial parts based on a scanning path planning algorithm. Opt. Lasers Eng. 2022, 158, 107176. [Google Scholar] [CrossRef]
  27. Li, J.; Wang, M.; Qu, L.; Lv, G. Research on Three-Dimensional Scanning Path Planning of Casing Parts Based on Industrial Robot. Appl. Sci. 2023, 13, 6162. [Google Scholar] [CrossRef]
  28. Li, Q.; Huang, X.; Li, S. A laser scanning posture optimization method to reduce the measurement uncertainty of large complex surface parts. Meas. Sci. Technol. 2019, 30, 105203. [Google Scholar] [CrossRef]
  29. Kwon, H.; Na, M.; Song, J.B. Rescan strategy for time efficient view and path planning in automated inspection system. Int. J. Precis. Eng. Manuf. 2019, 20, 1747–1756. [Google Scholar] [CrossRef]
  30. Lee, I.D.; Seo, J.H.; Kim, Y.M.; Choi, J.; Han, S.; Yoo, B. Automatic pose generation for robotic 3D scanning of mechanical parts. IEEE Trans. Robot. 2020, 36, 1219–1238. [Google Scholar] [CrossRef]
Figure 1. Typical free-form parts. (a) Integral leaf disc; (b) turbine blades.
Actuators 13 00310 g001
Figure 2. Line laser scanner. (a) Monocular line laser scanner; (b) Binocular line laser scanner.
Actuators 13 00310 g002
Figure 3. Robotic 3D scanning and measuring system R-Series.
Actuators 13 00310 g003
Figure 4. Triangulation measurement principle.
Actuators 13 00310 g004
Figure 5. Three-dimensional scanning measurement principle of the measuring system.
Actuators 13 00310 g005
Figure 6. Measurement constraints of line laser scanner.
Actuators 13 00310 g006
Figure 7. Scan path composition.
Actuators 13 00310 g007
Figure 8. The distribution of measuring points with different sampling methods. (a) Equal arc-length method; (b) equal chord-height method; (c) adaptive sampling method proposed in this paper.
Actuators 13 00310 g008
Figure 9. Curved discrete isoparametric lines.
Actuators 13 00310 g009
Figure 10. Diagram of the distribution of viewpoint planes.
Actuators 13 00310 g010
Figure 11. Scanning visible cone and scanner position area.
Actuators 13 00310 g011
Figure 12. Scanning viewpoint calculation.
Actuators 13 00310 g012
Figure 13. Scanning attitude calculation.
Actuators 13 00310 g013
Figure 14. Axial angle representation coordinate system transformation.
Actuators 13 00310 g014
Figure 15. Diagram of path calculation.
Actuators 13 00310 g015
Figure 16. On-site measurement scene of the robotic 3D scanning and measuring system.
Actuators 13 00310 g016
Figure 17. Comparison of 3D errors between scanned measurements and standards. (a) Comparison of measurement errors from the first robotic scanning; (b) comparison of measurement errors from the second robotic scanning; (c) comparison of measurement errors from the third robotic scanning.
Actuators 13 00310 g017
Table 1. Comparative experiment results of different path planning methods.
Proposed MethodEqual Arc-Length Sampling MethodEqual Chord-Height Sampling MethodGD Method
Simulation measuring time30.02 s33.26 s30.29 s137.57 s
Experimental measuring time32.52 s30.85 s30.83 s140.71 s
Maximum deviation0.071 mm0.130 mm0.096 mm0.075 mm
standard deviation0.022 mm0.028 mm0.026 mm0.024 mm
Disclaimer/Publisher’s Note: The statements, opinions and data contained in all publications are solely those of the individual author(s) and contributor(s) and not of MDPI and/or the editor(s). MDPI and/or the editor(s) disclaim responsibility for any injury to people or property resulting from any ideas, methods, instructions or products referred to in the content.

