Article

Load Torque Component Extraction and Analysis of Ultra-High-Speed Electric Air Compressors for Fuel Cell Vehicles

1
School of Intelligent Manufacturing, Weifang University of Science and Technology, Weifang 262700, China
2
School of Automotive Engineering, Shandong Jiaotong University, Jinan 250357, China
3
School of Automotive and Traffic Engineering, Jiangsu University, Zhenjiang 212013, China
4
College of Mechanical and Vehicle Engineering, Chongqing University, Chongqing 400044, China
*
Authors to whom correspondence should be addressed.
Actuators 2024, 13(8), 320; https://doi.org/10.3390/act13080320
Submission received: 17 July 2024 / Revised: 14 August 2024 / Accepted: 20 August 2024 / Published: 21 August 2024

Abstract

:
An ultra-high-speed electric air compressor (UHSEAC) generates a load torque component during operation, leading to unstable output. As air passes through the UHSEAC, the air density changes significantly, resulting in increased uneven distribution. This causes rapid changes in gas parameters, making them difficult to extract. Consequently, the behavior of load torque component variations under ultra-high-speed operating conditions (UHSOC) remains unclear. The influence of UHSOC on the load torque component has not been studied. In this article, the fluid model of the UHSEAC is established and verified, and the load torque component is extracted based on this model. The influence of speed and torque on the load torque component under UHSOC is then studied. The results show that the frequency of the load torque component increases by 14.29% as the speed increases from 70,000 rpm to 90,000 rpm. Additionally, as the torque increases from 1.3 Nm to 1.7 Nm, the amplitude of the load torque component increases by 69.56%. These findings provide valuable guidance for future scholars seeking to optimize UHSEAC design to reduce load torque components.

1. Introduction

An ultra-high-speed electric air compressor (UHSEAC) has excellent air flow and pressure ratio, which makes it an excellent choice for high-power fuel cells [1,2,3]. The impeller is the core component of the UHSEAC, which has a complex geometric appearance [4,5]. When the impeller rotates, the change of collision position between airflow and impeller will bring about the change in the collision angle [6,7]. Furthermore, the resultant force on the impeller changes, resulting in a load torque component [8]. The output of an UHSEAC is unstable, which affects the output response performance of the fuel cell [9,10]. The output instability of an UHSEAC is mainly caused by the irregular change in the load torque component. Aiming at this irregular change, it is the premise of UHSEAC stability control to explore the interpretability of the load torque component.
Extracting the UHSEAC load torque component is the premise of load torque component research. The working medium has a great influence on the load torque component of rotating machinery such as UHSEACs [11,12,13]. Previous researchers have conducted a lot of research on the load torque component of rotating machinery working in solid and liquid media. Lei et al. [14] extracted the load torque component of a hydraulic turbine operating in liquid by mathematical modeling and analyzed its time domain characteristics. Sheng et al. [15] extracted the load torque component of a coal mining machine operating in a solid coal seam and found that the load torque component triggers complex high-frequency vibration behavior. Burella et al. [16] used experimental data to extract the load torque component of an icebreaker operating in ice to improve the stability of the icebreaker. Liquids and solids are difficult to compress because of their small molecular gaps [17,18]. Its physical properties basically do not change during the operating process. The working medium of the UHSEAC is gas, and it is pressurized [19]. During the operating process, the gas density will change greatly [20,21], and the gas density is directly related to the force on the impeller. This brings a new problem, that gas parameters change rapidly and are difficult to extract.
Based on the extraction results of the load torque component, the characteristics of the load torque component can be further studied. Due to the lack of load torque component extraction methods for electric air compressors, current scholars can only analyze the change in the load torque component from the change in the output instability of electric air compressors. Tao et al. [22] investigated the effect of the number of vane channels on the flow stability of a centrifugal pump impeller by means of non-stationary flow simulations. Fu et al. [23] investigated the effect of the tongue angle of the worm shell on the output pressure stability of a fuel cell air compressor on the basis of hydrodynamic analysis. Wang et al. [24] found that flow deformation is induced at the impeller inlet due to the influence of the curved section of the interstage piping, resulting in an unstable compressor output. They all study the influence of mechanical parameters of electric air compressors with speeds below 50,000 rpm, but the UHSEAC faces operating conditions with speeds above 70,000 rpm. At ultra-high-speed operating conditions (UHSOC), the collision between airflow and impeller intensifies, and the size and direction of force change frequently, and the output of the UHSEAC becomes more and more unstable. It is particularly urgent to clarify the load torque component change under UHSOC.
The main innovations of this article are as follows:
(1)
Considering the uneven distribution of gas density in the UHSEAC, the fluid model of the UHSEAC is established, the energy variation of the UHSEAC is analyzed, and the load torque component is extracted.
(2)
By selecting the working speed and torque of the UHSEAC, the control single variable method is used to analyze the influence of speed and torque on the UHSEAC, and the variation law of the load torque component under UHSOC is revealed.
The structure of this article is shown in Figure 1. This article is organized as follows: In Section 2, the UHSEAC fluid model is introduced and verified by the experimental platform. Section 3 introduces the extraction of the load torque component of the UHSEAC. Section 4 analyzes the variation law of the torque component characteristics of the load. Section 5 summarizes this article and points out the future research direction.

2. Modeling and Verification

2.1. Fluid Model

The UHSEAC structure is shown in Figure 2, which is mainly composed of volute, impeller, elbow, drive motor, air bearing, end cover, and other components [25,26,27,28]. The two-stage pressurization mode is adopted, that is, the air is pressurized by the first-stage impeller (FSI) and then pressurized again by the second-stage impeller (SSI).
There is no internal compression process in the ultra-high speed electric compressor, but the rotation of the impeller changes the state of gas flow to increase the gas pressure. The fluid model is used to describe the air pressurization process in UHSEAC. The object of study in this paper is compressible air with heat transfer, and the main consideration is the conversion of kinetic and internal energy of air. The model is simplified to consist of mass conservation equation, momentum conservation equation, and energy conservation equation [29,30,31]. The expression of the mass conservation equation is as follows:
ρ t + ( ρ u ) x + ( ρ v ) y + ( ρ w ) z = 0
where, t is time, s. ρ is the density, kg/m3. u is the component of the velocity vector in the x direction, m/s. v is the component of the velocity vector in the y direction, m/s. w is the component of the velocity vector in the z direction, m/s.
The expression of the momentum conservation equation is as follows:
( ρ u ) t + div ( ρ u u ) = p x + τ x x x + τ y x y + τ z x z + F x ( ρ v ) t + div ( ρ v u ) = p y + τ x y x + τ y y y + τ z y z + F y ( ρ w ) t + div ( ρ w u ) = p z + τ x z x + τ y z y + τ z z z + F z
where p is the pressure acting on the volume of the element, Pa. τxy, τyz, τzx, etc., refer to the various components of the viscous stress on the volume of the micro-element due to the viscous action of molecules, Pa. Fx, Fy, Fz are forces on the volume of the element, N.
The expression of the energy conservation equation is as follows:
( ρ T ) t + div ( ρ u T ) = div k c p gradT + S T
where T is temperature, K. cp is the specified pressure specific heat capacity, J/(kg·K). k is turbulent kinetic energy, J. ST is the dissipative term of viscosity.
In setting up the physical model, the dynamic viscosity of air is set to be 1.853 × 10⁻⁵ Pa·s, the specific heat of air is set to be 1005 J/kg·K, and the thermal conductivity of air can be kept at a default of 0.0260305 W/m·K. The physical model used is shown in Table 1.

2.2. Experimental Verification

To build an experimental platform for the external characteristics of the UHSEAC, the platform is mainly composed of the UHSEAC (as shown in Table 2), controller, air filter, electromagnetic backpressure valve, gas detection straight pipe, industrial water chiller, etc. The equipped sensors include temperature sensors, pressure sensors, flow pressure difference sensors.
The physical photos of the experimental platform are shown in Figure 3. The air filter is connected with the air inlet of the UHSEAC. The air outlet of the UHSEAC is connected with the gas detection straight pipe. The gas detection straight pipe is connected with the electromagnetic backpressure valve. The power of the UHSEAC controller is provided by a high-voltage DC power supply. The sensor is powered by a low-voltage DC power supply. An industrial water chiller is used for the UHSEAC cooling.
The experiment was carried out according to the following steps:
(1)
Adjust the opening of the back pressure valve to 36% (known to be greater than the surge opening of the UHSEAC), open the data sending window of the upper computer software, and send the target speed;
(2)
Set the sensor acquisition period to 20 ms in the upper computer software, and start data reading after the speed of the air compressor is stable;
(3)
The inlet and outlet pressures and flow rates collected during the experiment are saved in the computer;
(4)
Continue to set the next target speed and repeat the above steps.
The rated speed of the UHSEAC used in this study is 80,000 rpm, with common operating speeds ranging from 70,000 rpm to 90,000 rpm. Therefore, 70,000 rpm, 80,000 rpm, and 90,000 rpm were selected as the experimental speeds.
The air flow and outlet pressure data from the UHSEAC’s external characteristic experiments at speeds of 70,000 rpm, 80,000 rpm, and 90,000 rpm at a backpressure valve opening setting of 36% were extracted, and the same boundary conditions used in the experiments were applied in the STAR CCM+2210 software. Finally, the experimental data were compared with the simulation results as shown in Figure 4. The maximum error between simulation results and experimental results is 1.0%. The accuracy of the model is verified by meeting the requirement of error range. Table 3 shows the simulation data of air flow rate and outlet pressure fluctuation at the experimental speed.

3. Load Torque Component Extraction

There is a difference between the actual torque and the ideal torque of the UHSEAC, which is the load torque component. In order to simplify the analysis, the following assumptions are made for the load torque component equation within an acceptable range [32,33]: (1) the fluid in UHSEAC is continuous; (2) impeller and runner walls are rigid walls. Their physical shapes do not change with the change in force. Therefore, the load torque component equation of UHSEAC is as follows:
Δ T L = T L T L
where ΔTL is the load torque component of the UHSEAC, N·m. TL * is the actual torque of UHSEAC, N·m. TL is the ideal torque of the UHSEAC, N·m.
The energy output by the actual torque is equal to the sum of the energy obtained by the gas flowing through the UHSEAC in unit time and the energy lost in unit time. The energy obtained by gas flowing through the UHSEAC includes gas compression energy, gravitational potential energy, and gas kinetic energy [34,35,36]. The expression of this equation is as follows:
π n T L 30 = p 2 S 2 ν 2 p 1 S 1 ν 1 + g Q Z 2 Z 1 + Q ν 2 2 ν 1 2 2 + P hyd
where n is the impeller speed of UHSEAC, rpm. p1 and p2 are the inlet and outlet gas pressures, Pa. S1 and S2 are the cross-sectional areas of entrances and exits, m2. ν1 and ν2 are the inlet and outlet gas velocities, m/s. g is the acceleration of gravity, m/s2. Q is the mass flow, kg/s. Z1 and Z2 are the heights of gas inlet and outlet, m. Phyd is the energy lost by gas flowing through UHSEAC per unit time, W.
Among them, the energy lost by gas flowing through the UHSEAC per unit time can be divided into impeller inlet impact loss, gas leakage loss, wheel resistance loss, and friction loss [37,38,39]. The impeller inlet impact loss is a part of energy loss caused by the collision between airflow and impeller at impeller inlet, and its loss is closely related to airflow incident direction, airflow speed, and the impeller rotation speed of the UHSEAC.
The geometrical relationship between velocity triangles in a FSI. The impact loss power P11 at the inlet of the FSI and the impact loss power P12 at the inlet of the SSI are derived as follows:
P 11 = Q w c 2 2 = Q 2 sin α 1 + β 1 + mod 2 π b 6 nt π D 1 sin α 1 sin β 1 + mod 2 π b 6 nt Q π D 1 60 n 2
P 12 = Q w c 2 2 = Q 2 sin α 2 + β 2 + mod 2 π b 6 nt π D 2 sin α 2 sin β 2 + mod 2 π b 6 nt Q π D 2 60 n 2
where α1 is the inflow angle of the FSI, deg. α2 is the inflow angle of the secondary impeller, deg. β1 is the installation angle of the FSI, deg; β2 is the installation angle of the SSI, deg. b is the number of impeller blades. D1 is the nominal diameter of the FSI of UHSEAC, m. D2 is the nominal diameter of the SSI of UHSEAC, m. h is the diameter of impeller shaft, m.
The leakage of gas from a high pressure area to a low pressure area caused by pressure difference is the main reason for gas energy loss. The gas energy loss can be expressed as follows:
P L = λ c π n T L 30
where λc is the loss coefficient, indicating the ratio of air leakage flow to total flow.
The wheel resistance loss refers to the work performed by the impeller to overcome the friction resistance moment. The wheel resistance loss power can be expressed as follows:
P d f = β d f π n T L 30
where βdf is the wheel resistance loss coefficient.
The friction loss is due to the friction between gas and the wall of volute flow passage and between gas flow layers with different flow rates. The friction loss power can be expressed as follows:
P f r i = λ l c 2 2 d h Q
where λ is the friction resistance coefficient, which is related to the flow Reynolds number and the relative roughness of the volute wall. l is the length of process or average streamline, m. dh is the average equivalent diameter of the volute flow passage, m. c is the average airflow velocity in the volute channel, m/s.
Finally, the load torque component equation of UHSEAC is obtained:
Δ T L = a 1 Q 3 n + a 2 Q 2 + a 3 Q n + a 4 Q n + a 5 n 9550 P n
where P is the power of UHSEAC, kW. The coefficient a1 is expressed as follows:
a 1 = 15 π sin 2 α 1 + β 1 + mod 2 π b 6 nt π 2 D 1 2 sin 2 α 1 sin 2 β 1 + mod 2 π b 6 nt + sin 2 α 2 + β 2 + mod 2 π b 6 nt π 2 D 2 2 sin 2 α 2 sin 2 β 2 + mod 2 π b 6 nt
The expression of coefficient a2 is
a 2 = 15 π sin α 1 + β 1 + mod 2 π b 6 nt 60 sin α 1 sin β 1 + mod 2 π b 6 nt + sin α 2 + β 2 + mod 2 π b 6 nt 60 sin α 2 sin β 2 + mod 2 π b 6 nt
The expression of coefficient a3 is
a 3 = 1 + λ c 30 π v 2 2 v 1 2 2 + g Z 2 Z 1 + λ l c 2 2 d h 30 π
The expression of coefficient a4 is
a 4 = 54000 π D 1 2 + D 2 2
The expression of coefficient a5 is
a 5 = 1 + λ c 30 π p 2 S 2 ν 2 p 1 S 1 ν 1
The specific parameters of the UHSEAC load torque component are shown in Table 4.

4. Load Torque Component Analysis

4.1. Speed Characteristic

In order to explore the influence of UHSOC on the load torque component, firstly, the flow field of the UHSEAC is simulated to obtain the internal gas parameters. Then, the load torque component is calculated based on this extraction.
The speed of the UHSEAC selects three specific speeds used for experimental verification in the second section. Based on these experimental results, the boundary conditions for the fluid simulation were established, with the inlet pressure set at 101.325 kPa. The inlet temperature was 290.15 K. The outlet mass flow rate and temperature were set to experimental parameters. The turbulence model selected was k-omega turbulence. The time solver was changed to implicit unsteady. The time step was selected as the time required for the impeller to rotate 1°, which was 2.381 × 10⁻⁶ s, 2.083 × 10⁻⁶ s, and 1.852 × 10⁻⁶ s, respectively. To ensure calculation accuracy and speed, steady-state calculations were first performed. After the convergence of calculations, the physical model was adjusted for transient calculations of the impeller rotating three times.
The simulation result is shown in Figure 5. The first row is the pressure contour of the FSI, and the second row is the pressure contour of the SSI. Each column represents a different speed. The surface pressure of the impeller is symmetrically distributed. From the entrance to the exit of the impeller blade, the pressure gradually increases, without sudden pressure changes. The maximum pressure is reached at the outermost edge of the impeller blade. At the positions marked by red circles in the figure, the pressure at the leading edge of the impeller is significantly higher than that of nearby locations under different speeds. With a constant torque, the higher the speed, the smaller the pressure difference between the leading edge of the impeller and its surrounding areas.
From the inlet to the outlet of the impeller edge, the reason for the pressure from small to large is that at the back end of the impeller, the diameter of the impeller becomes larger, the linear velocity of the gas becomes larger, and the force acting on the impeller also becomes larger. The higher the speed under constant torque, the greater the power of the UHSEAC, and the smaller the inlet mass flow rate. The smaller the impact of air flow on the leading edge of the impeller, the smaller the load torque component. And because the airflow pressure and speed of the SSI entrance are higher than that of the FSI entrance, the pressure contrast of the leading edge of the SSI is more obvious than that of the FSI.
The load torque component is derived from the simulation results, as depicted in Figure 6. The first graph illustrates the time variation of the load torque component under three different speeds, while the second graph shows the frequency domain of the load torque component. At a speed of 70,000 rpm, the main frequency of the load torque component is 15,166 Hz, with a primary frequency amplitude of 0.033 N·m. A harmonic of this main frequency is also observed at 30,333 Hz with an amplitude of 0.014 N·m. At 80,000 rpm, the main frequency of the load torque component shifts to 17,333 Hz, with a primary amplitude of 0.028 N·m, and a harmonic at 34,666 Hz with an amplitude of 0.011 N·m. When the speed increases to 90,000 rpm, the main frequency is 19,500 Hz, with a primary amplitude of 0.023 N·m and a harmonic at 39,000 Hz with an amplitude of 0.0073 N·m.
It can be seen that the load torque component time of a cycle is not the same at different speeds. With the increase in speed, the pulsation period and amplitude of load torque component become smaller and smaller. This is consistent with the results derived from the load torque component model. The main frequency of the load torque component is the blade inlet impact frequency. Under the same torque, the higher the speed, the larger the frequency of the load torque component, the smaller the value.

4.2. Torque Characteristic

The idea of exploring the influence of torque change on load torque component amplitude is similar to that of speed change on load torque component amplitude analysis. In the simulation, the UHSEAC speed was kept unchanged at 80,000 rpm. The outlet pressure and mass flow were changed to make the torque reach the preset values of 1.3 N·m, 1.5 N·m, and 1.7 N m. the simulation results of the load torque component under these three different torques are obtained. The solver and turbulence model selection are consistent with the setting when the speed changes, and the boundary condition is modified as follows: the impeller speed is 80,000 rpm. The time step is selected as the time required for the impeller to rotate 1°, which is 2.083 × 10⁻⁶ s.
The pressure cloud image of the FSI and SSI of the UHSEAC obtained by simulation is shown in Figure 7. Pressure cloud image of the FSI. The second stage is the pressure cloud image of the SSI. Under the three different torques, the surface pressure of the impeller changes evenly from the inlet to the outlet pressure, and there is no sudden change in pressure. The pressure is slightly higher in the red circle than in the surrounding area. The higher the torque, the greater the impeller surface pressure. The surface pressure of the SSI is higher than that of the FSI on average.
The place marked by the red circle in Figure 8 is the leading edge of the impeller, where the pressure is slightly higher than the surrounding position due to the impact of air flow. The leading edge of the SSI is brighter and more obvious than that of the FSI. This is because the secondary airflow speed and pressure of the UHSEAC are higher.
The load torque component is extracted according to the simulation results, as shown in Figure 8. The first line is the load torque component time variation diagram under three torques, and the second line is the frequency domain diagram of the load torque component. The main frequency of the load torque component under three different torques is 17,333 Hz. The frequency doubling is 34,666 Hz. The load torque component amplitude is 0.023 N·m when the torque is 1.3 N·m. The load torque component amplitude is 0.028 N·m when the torque is 1.5 N·m. The amplitude of load torque component at torque 1.7 N·m is 0.039 N·m.
It can be seen that the time of load torque component passing through a cycle is the same at the same speed. It shows that the speed is the main factor affecting the load torque component frequency, the speed does not change the load torque component frequency, and the amplitude gradually expands with the increase in torque.

5. Conclusions

Based on the law of conservation of energy, this article constructs a load torque component model that considers energy losses due to impeller inlet impact loss, gas leakage loss, wheel resistance loss, and friction loss. The article analyzes the impact of key parameter changes in the UHSEAC on the load torque component. The conclusions can be summarized as follows:
(1)
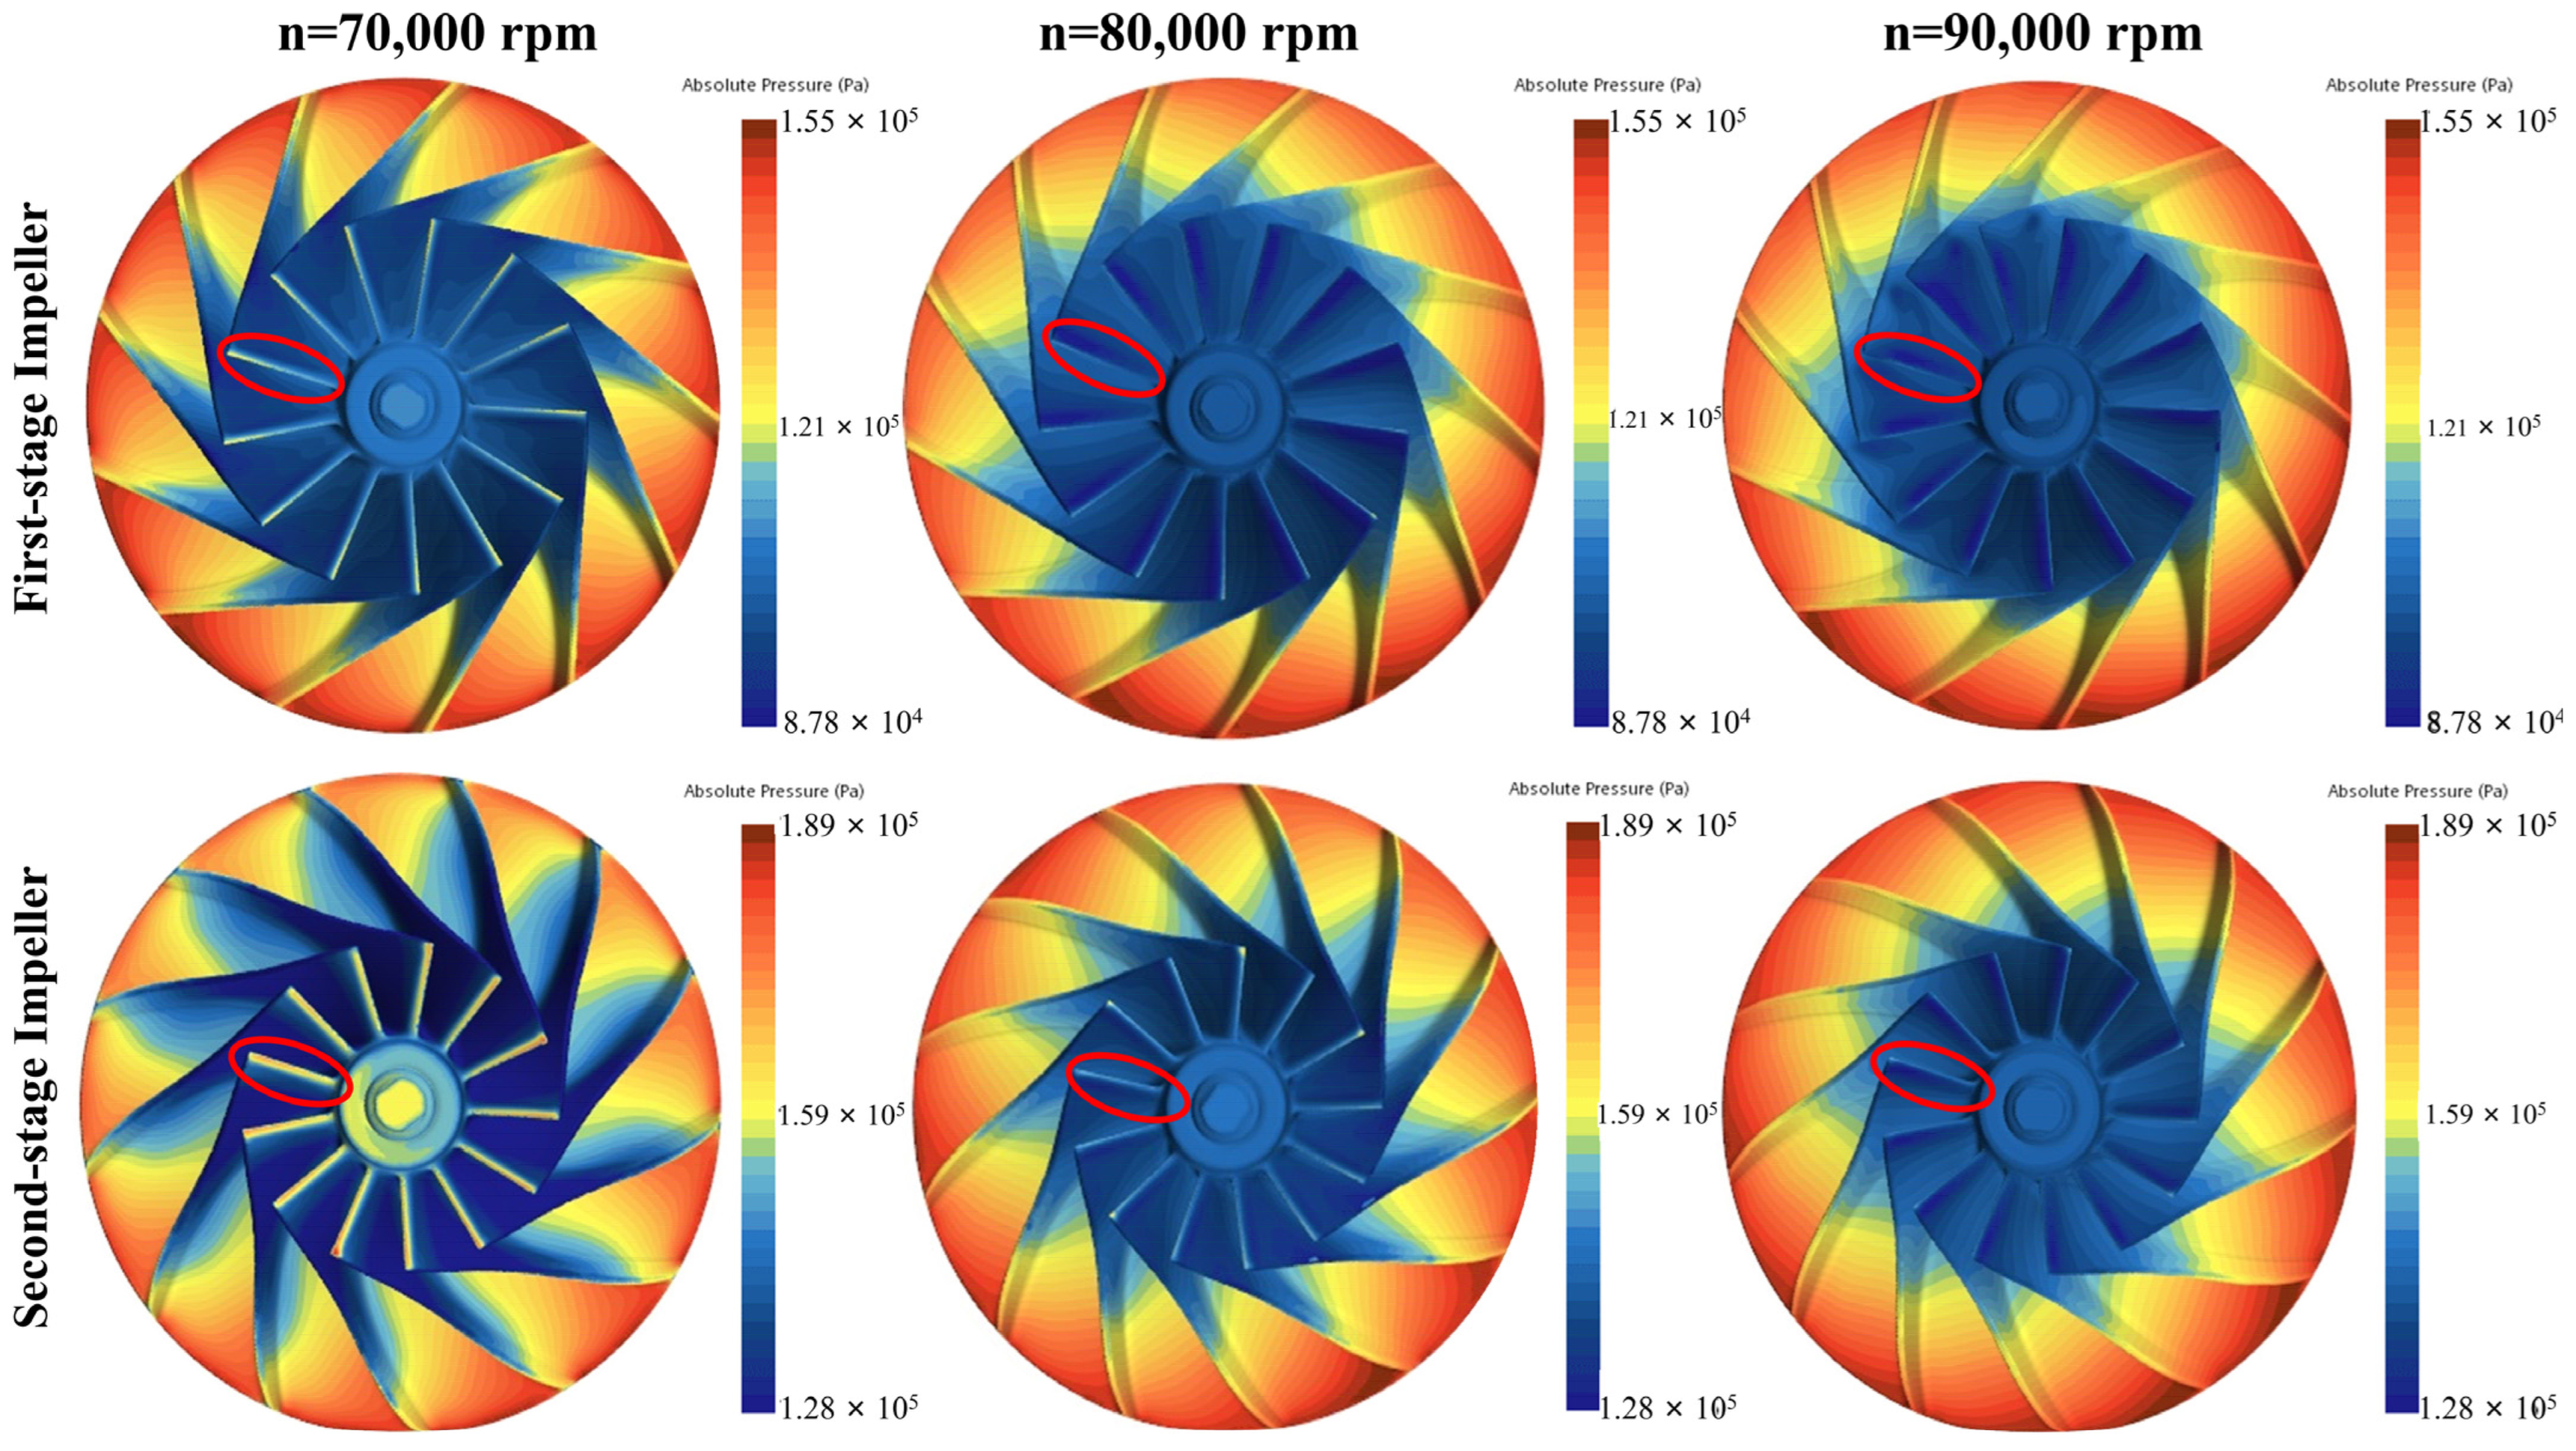
Under constant torque, as the speed of the UHSEAC increases, the inlet mass flow rate decreases. This weakens the airflow impact on the impeller’s leading edge, reducing the pressure difference and consequently decreasing the amplitude of the load torque component. At 70,000 rpm, the inlet mass flow is the highest, with a load torque component amplitude of 0.033 N·m and a frequency of 15,166 Hz. At 90,000 rpm, the inlet mass flow is the lowest, resulting in a load torque component amplitude of 0.023 N·m and a frequency of 17,333 Hz. This shows that with increasing speed under UHSOC, the amplitude of load torque component decreases while the frequency increases.
(2)
Under constant speed, as the torque of the UHSEAC increases, the inlet mass flow rate increases. This intensifies the airflow impact on the impeller’s leading edge, creating a larger pressure difference and consequently increasing the amplitude of the load torque component. When the torque is 1.3 N·m, the inlet mass flow rate is the smallest, resulting in a load torque component amplitude of 0.023 N·m and a frequency of 17,333 Hz. When the torque is 1.7 N·m, the inlet mass flow rate is the largest, resulting in a load torque component amplitude of 0.039 N·m and the same frequency of 17,333 Hz. This shows that with increasing torque under UHSOC, the amplitude of load torque component increases while the frequency remains unchanged.
The analysis of key parameter changes in the UHSEAC that affect load torque component in this article provides guidance for future design efforts to reduce load torque component in UHSEACs.

Author Contributions

Conceptualization, J.Z. (Jiaming Zhou) and X.S.; Methodology, J.Z. (Jiaming Zhou) and X.S.; Software, J.Z. (Jinming Zhang) and D.H.; Validation, J.Z. (Jiaming Zhou), J.Z. (Jinming Zhang) and F.Y.; Formal analysis, C.Z.; Investigation, D.H.; Resources, J.Z. and X.S.; Data curation, Y.L.; Writing—original draft, X.S.; Writing—review & editing, J.Z.; Visualization, J.Z. (Jinming Zhang) and F.Y.; Supervision, Y.L.; Project administration, F.Y.; Funding acquisition, F.Y. All authors have read and agreed to the published version of the manuscript.

Funding

This work is supported by Weifang University of Science and Technology High-level Talent Research Start-up Fund Project (KJRC2023001), and Weifang Institute of Science and Technology 2023 school-level project (2023KJ02&2023KJ03).

Data Availability Statement

The data presented in this study are available on request from the corresponding author. The data are not publicly available due to third-party confidentiality agreement restrictions.

Conflicts of Interest

The authors declare no conflict of interest.

References

  1. Hu, D.; Hou, W.; Xiang, C.; Lu, D.; Yang, Q.; Li, J.; Wang, J. Waste heat utilization performance verification of Heat Exchanger Only Thermal Management System for fuel cell vehicle. J. Clean. Prod. 2023, 428, 139479. [Google Scholar] [CrossRef]
  2. Li, Y.; Pei, P.; Ma, Z.; Ren, P.; Huang, H. Analysis of air compression, progress of compressor and control for optimal energy efficiency in proton exchange membrane fuel cell. Renew. Sustain. Energy Rev. 2020, 133, 110304. [Google Scholar] [CrossRef]
  3. Jia, C.; He, H.; Zhou, J.; Li, K.; Li, J.; Wei, Z. A performance degradation prediction model for PEMFC based on bi-directional long short-term memory and multi-head self-attention mechanism. Int. J. Hydrogen Energy 2024, 60, 133–146. [Google Scholar] [CrossRef]
  4. Jiao, K.; Sun, H.; Li, X.; Wu, H.; Krivitzky, E.; Schram, T.; Larosiliere, L.M. Numerical simulation of air flow through turbocharger compressors with dual volute design. Appl. Energy 2009, 86, 2494–2506. [Google Scholar] [CrossRef]
  5. Zhang, Y.; Xu, S.; Wan, Y. Performance improvement of centrifugal compressors for fuel cell vehicles using the aerodynamic optimization and data mining methods. Int. J. Hydrogen Energy 2020, 45, 11276–11286. [Google Scholar] [CrossRef]
  6. Ahsan, N.; Al Rashid, A.; Zaidi, A.A.; Imran, R.; Qadir, S.A. Performance analysis of hydrogen fuel cell with two-stage turbo compressor for automotive applications. Energy Rep. 2021, 7, 2635–2646. [Google Scholar] [CrossRef]
  7. Hou, J.; Yang, M.; Ke, C.; Zhang, J. Control logics and strategies for air supply in PEM fuel cell engines. Appl. Energy 2020, 269, 115059. [Google Scholar] [CrossRef]
  8. Simons, S.; Hinchliff, M.; White, B.; Talabisco, G.C.; Kurz, R.; Ji, M. Compressor System Design and Analysis. In Compression Machinery for Oil and Gas; Gulf Professional Publishing: Houston, TX, USA, 2019; pp. 427–447. [Google Scholar]
  9. Fu, J.; Wang, H.; Sun, X.; Bao, H.; Wang, X.; Liu, J. Multi-objective optimization for impeller structure parameters of fuel cell air compressor using linear-based boosting model and reference vector guided evolutionary algorithm. Appl. Energy 2024, 363, 123057. [Google Scholar] [CrossRef]
  10. Handschuh, P.; Dobrica, M.; Çokşen, A.; Wiedmann, G. Turbo Compressors for the Cathode and Anode Supply of Fuel Cells. MTZ Worldw. 2022, 83, 66–71. [Google Scholar] [CrossRef]
  11. Zhao, Y.; Liu, Y.; Liu, G.; Yang, Q.; Li, L.; Gao, Z. Air and hydrogen supply systems and equipment for PEM fuel cells: A review. Int. J. Green Energy 2022, 19, 331–348. [Google Scholar] [CrossRef]
  12. Schröter, J.; Graf, T.; Frank, D.; Bauer, C.; Kallo, J.; Willich, C. Influence of pressure losses on compressor performance in a pressurized fuel cell air supply system for airplane applications. Int. J. Hydrogen Energy 2021, 46, 21151–21159. [Google Scholar] [CrossRef]
  13. Deng, Z.; Chen, Q.; Zhang, L.; Fu, Z. Data driven NARMAX modeling for PEMFC air compressor. Int. J. Hydrogen Energy 2020, 45, 20321–20328. [Google Scholar] [CrossRef]
  14. Lei, L.; Li, F.; Xu, B.; Egusquiza, M.; Luo, X.; Zhang, J.; Egusquiza, E.; Chen, D.; Jiang, W.; Patelli, E. Time-frequency domain characteristics analysis of a hydro-turbine governor system considering vortex rope excitation. Renew. Energy 2022, 183, 172–187. [Google Scholar] [CrossRef]
  15. Sheng, L.; Li, W.; Jiang, S.; Chen, J.; Liu, A. Nonlinear torsional vibration analysis of motor rotor system in shearer semi-direct drive cutting unit under electromagnetic and load torque component. Nonlinear Dyn. 2019, 96, 1677–1691. [Google Scholar] [CrossRef]
  16. Burella, G.; Moro, L.; Oldford, D. Analysis and validation of a procedure for a lumped model of Polar Class ship shafting systems for transient torsional vibrations. J. Mar. Sci. Technol. 2018, 23, 633–646. [Google Scholar] [CrossRef]
  17. Xu, B.; Zhang, J.; Egusquiza, M.; Chen, D.; Li, F.; Behrens, P.; Egusquiza, E. A review of dynamic models and stability analysis for a hydro-turbine governing system. Renew. Sustain. Energy Rev. 2021, 144, 110880. [Google Scholar] [CrossRef]
  18. Zhao, L.; Zhen, T.; Liu, X.; Bo, X. Simulation analysis of load characteristic of thin seam shearer drum. J. Syst. Simul. 2020, 27, 3102–3108. [Google Scholar]
  19. Tanaka, S.; Nagumo, K.; Yamamoto, M.; Chiba, H.; Yoshida, K.; Okano, R. Fuel cell system for Honda CLARITY fuel cell. ETransportation 2020, 3, 100046. [Google Scholar] [CrossRef]
  20. Shu, M.; Yang, B.; Yang, M.; Martinez-Botas, R.F.; Deng, K. Investigation on the unsteadiness of centrifugal compressor exposed to pulsating backpressure. Proc. Inst. Mech. Eng. Part D J. Automob. Eng. 2021, 235, 2212–2225. [Google Scholar] [CrossRef]
  21. Tao, R.; Wang, Z. Comparative modeling and analysis of the flow asymmetricity in a centrifugal pump impeller at partial load. Proc. Inst. Mech. Eng. Part A J. Power Energy 2020, 234, 237–247. [Google Scholar] [CrossRef]
  22. Fu, J.; Wang, H.; Bao, H.; Sun, X.; Liu, J. Multi-parameter optimization for the performance of the fuel cell air compressor based on computational fluid dynamics analysis at part load. Therm. Sci. Eng. Prog. 2023, 44, 102057. [Google Scholar] [CrossRef]
  23. Wang, H.; Yang, D.; Zhu, Z.; Zhang, H.; Zhang, Q. Effect of Interstage Pipeline on the Performance of Two-Stage Centrifugal Compressors for Automotive Hydrogen Fuel Cells. Appl. Sci. 2022, 13, 503. [Google Scholar] [CrossRef]
  24. Li, W.; Feng, G. Design and experimental study of centrifugal compressor in fuel cell vehicle. Mechanics 2021, 27, 52–61. [Google Scholar] [CrossRef]
  25. Hu, D.; Wang, Y.; Li, J.; Wang, J.; Yang, Q. Energy saving control of waste heat utilization subsystem for fuel cell vehicle. IEEE Trans. Transp. Electrif. 2023, 10, 1. [Google Scholar] [CrossRef]
  26. Zhou, S.; Jin, J.; Wei, Y. Research on online diagnosis method of fuel cell centrifugal air compressor surge fault. Energies 2021, 14, 3071. [Google Scholar] [CrossRef]
  27. Chen, H.; Liu, Z.; Ye, X.; Yi, L.; Xu, S.; Zhang, T. Air flow and pressure optimization for air supply in proton exchange membrane fuel cell system. Energy 2022, 238, 121949. [Google Scholar] [CrossRef]
  28. Alizadeh, H.; Jahangir, M.H.; Ghasempour, R. CFD-based improvement of Savonius type hydrokinetic turbine using optimized barrier at the low-speed flows. Ocean Eng. 2020, 202, 107178. [Google Scholar] [CrossRef]
  29. Liu, Y.; Zhao, Y.; Yang, Q.; Liu, G.; Li, L.; Gao, Z. Performance study of centrifugal air compressor for proton exchange membrane fuel cell systems. Energy Sci. Eng. 2022, 10, 208–218. [Google Scholar] [CrossRef]
  30. Shi, T.; Huang, H.; Peng, X.; Feng, J.; Guo, Y. Experimental study on the static and dynamic performances of gas foil bearings for the centrifugal air compressor used in fuel cell vehicles. Int. J. Energy Res. 2022, 46, 4417–4433. [Google Scholar] [CrossRef]
  31. Tempiam, A.; Kachapongkun, P.; Rattanadecho, P.; Prommas, R. Experimental investigation of vortex tube for reduction air inlet of a reciprocating air compressor. Case Stud. Therm. Eng. 2020, 19, 100617. [Google Scholar] [CrossRef]
  32. Zou, Z.; Xu, P.; Fu, C. An evaluation model for wall heat transfer effects on micro centrifugal compressors and its application in aerodynamic design. Appl. Therm. Eng. 2024, 236, 121554. [Google Scholar] [CrossRef]
  33. Liu, Z.; Li, Z.; Xie, D.; Wu, H. Unsteady characteristic and flow mechanism of a scroll compressor in small-scale compressed air energy storage system. J. Energy Storage 2022, 51, 104368. [Google Scholar] [CrossRef]
  34. Gouda, E.M.; Benaouicha, M.; Neu, T.; Fan, Y.; Luo, L. Flow and heat transfer characteristics of air compression in a liquid piston for compressed air energy storage. Energy 2022, 254, 124305. [Google Scholar] [CrossRef]
  35. Khaljani, M.; Vennard, A.; Harrison, J.; Surplus, D.; Murphy, A.; Mahmoudi, Y. Experimental and modelling analysis of efficiency enhancement in a liquid piston gas compressor using metal plate inserts for compressed air energy storage application. J. Energy Storage 2021, 43, 103240. [Google Scholar] [CrossRef]
  36. Kan, K.; Xu, Z.; Chen, H.; Xu, H.; Zheng, Y.; Zhou, D.; Muhirwa, A.; Maxime, B. Energy loss mechanisms of transition from pump mode to turbine mode of an axial-flow pump under bidirectional conditions. Energy 2022, 257, 124630. [Google Scholar] [CrossRef]
  37. Zheng, S.; Wei, M.; Song, P.; Hu, C.; Tian, R. Thermodynamics and flow unsteadiness analysis of trans-critical CO2 in a scroll compressor for mobile heat pump air-conditioning system. Appl. Therm. Eng. 2020, 175, 115368. [Google Scholar] [CrossRef]
  38. Bacak, A.; Pınarbaşı, A.; Dalkılıç, A.S. An experimental study on the determination of a hermetic reciprocating compressor’s discharge and suction losses. Proc. Inst. Mech. Eng. Part E J. Process Mech. Eng. 2024, 238, 1330–1344. [Google Scholar] [CrossRef]
  39. Kan, K.; Zhang, Q.; Xu, Z.; Zheng, Y.; Gao, Q.; Shen, L. Energy loss mechanism due to tip leakage flow of axial flow pump as turbine under various operating conditions. Energy 2022, 255, 124532. [Google Scholar] [CrossRef]
Figure 1. Structure of the article.
Actuators 13 00320 g001
Figure 2. UHSEAC structure.
Actuators 13 00320 g002
Figure 3. Experimental platform of UHSEAC.
Actuators 13 00320 g003
Figure 4. Simulation and experimental comparison of air flow rate and outlet pressure.
Actuators 13 00320 g004
Figure 5. Impeller surface pressure at 70,000 rpm, 80,000 rpm, and 90,000 rpm.
Actuators 13 00320 g005
Figure 6. Load torque component at 70,000 rpm, 80,000 rpm, and 90,000 rpm.
Actuators 13 00320 g006
Figure 7. Impeller surface pressure under torques of 1.3 N·m, 1.5 N·m and 1.7 N·m.
Actuators 13 00320 g007
Figure 8. Load torque component at torque of 1.3 N·m, 1.5 N·m, and 1.7 N·m.
Actuators 13 00320 g008
Table 1. Fluid model physical setup.
ContentModel
State equationIdeal gas
EnergySeparation energy
TimeUnsteady
RapidsK-omega turbulence
Table 2. Parameters of UHSEAC.
ParameterValueUnit
Rated power22kW
Rated voltage380V
Rated speed80,000rpm
Pole pairs1
Number of slots24
Stator inner diameter36.85mm
Stator outer diameter82mm
Stator length70mm
Stacking Coefficient0.85
Rotor inner diameter5.85mm
Rotor outer diameter35.85mm
Rotor shaft length70mm
Magnet thickness6mm
Magnet span60
Table 3. Air flow rate and outlet pressure fluctuations at experimental speeds.
ConditionParameterSpeed (rpm)ValueFrequencyMaximum Amplitude
fixed outlet pressureair flow rate70,00079.241 g/s15,166 Hz0.362 g/s
80,00092.690 g/s17,333 Hz0.460 g/s
90,000111.071 g/s19,500 Hz0.612 g/s
fixed air flow rateoutlet pressure70,000203.488 kPa15,166 Hz0.920 kPa
80,000248.402 kPa17,333 Hz1.240 kPa
90,000305.534 kPa19,500 Hz1.681 kPa
Table 4. Formula parameters.
ParameterValueUnit
Cross-sectional areas of entrance, S12.132 × 10−3m2
Cross-sectional areas of exit, S21.479 × 10−3m2
Heights of gas inlet, Z10m
Heights of gas outlet, Z20.101m
Installation angle of the FSI, β140deg
Installation angle of the SSI, β254deg
Nominal diameter of the FSI, D17.598 × 10−2m2
Nominal diameter of the SSI, D27.250 × 10−2m2
Loss coefficient, λc1.500 × 10−2
Wheel resistance loss coefficient, βdf2.000 × 10−2
Friction resistance coefficient, λ1.900 × 10⁻²
Average equivalent diameter of the volute flow passage, dh4.531 × 10−2m
Length of process, l0.384m
Number of impeller blades, b13
Disclaimer/Publisher’s Note: The statements, opinions and data contained in all publications are solely those of the individual author(s) and contributor(s) and not of MDPI and/or the editor(s). MDPI and/or the editor(s) disclaim responsibility for any injury to people or property resulting from any ideas, methods, instructions or products referred to in the content.

