Abstract
This paper provides a comprehensive analysis of the electric-drive-wheel (EDW) with idler gear. From the perspective of automotive engineering, the EDW is an integrated execution unit that combines the function of powertrain and suspension. As a result, the research on EDW involves the intersection of multiple disciplines. The evolution of idler gear configuration requires some geometric constraints. Under this premise, the longitudinal and vertical dynamic characteristics of the system were studied, respectively. There are several factors that influence the system performance, such as the gear parameters, the position of the electric motor, and the suspension K&C value. The principles of each parameter on the output indicators were studied, with an optimized plan and simulation comparison to check the correctness of theory. In the end, the prototype was equipped with a test bench, covering a wide range of working operations to examine the expected performance of EDW design. The step response test of the EDW result showed a balanced performance in transmission smoothness and responsiveness agility.
1. Introduction
The electric-drive-wheel (EDW) is a promising propulsion technology for electric vehicle, which can realize independent control and power output of every single wheel. The EDW has a short transmission chain and fast response speed, which significantly improves the vehicle’s maneuverability [1]. In this field, extensive research has been conducted worldwide. According to the power transmission path, the typical EDW can be divided into two schemes: one is direct-drive EDW, and the other is speed-reduce EDW [2]. For the direct-drive EDW, it usually takes an electric motor with an inner stator to be fixed on the housing and an outer motor rotor to drive the wheel directly. The rotation speed of motor rotor is exactly the wheel speed, which is usually under 1600 rpm due to the coefficient constraints between the tire and road. For example, the Protean Electric Ltd. developed the Pd16 and Pd18 series products [3]. And the Elaphe Propulsion Technologies developed the S400, M1100, and LEV products [4]. They are all typical direct-drive EDWs of different power classes. The advantage of direct-drive EDW is in space compactness, for the system integrates the motor, invertor, and brake system together. However, the EDW works in a wide range of working points with consistency, which poses challenges for the system output characteristic. The IWM (in-wheel-motor) has constraints in electromagnetic materials and structure, which makes it difficult to balance the efficiency and performance of low speed and high speed. For example, when the vehicle is accelerating or climbing at a low speed, a large current is generated in the IWM and invertor constantly, which poses challenges for the durability of the permanent magnet and power electronics. When the loading current exceeds a certain threshold, the motor efficiency and torque output smoothness will suffer [5]. On the other hand, the speed-reduce EDW can adopt a PMSM (permanent magnet synchronous motor) with high-speed capability. The motor speed can be more than 10,000 rpm, which contributes to a higher torque density of the EDW system. With the speed reducer to adjust the high efficiency range of the electric motor, the speed-reduce EDW can cover the variable demand of the vehicle [6,7]. As a result, it becomes a promising technical solution. A typical speed-reduce EDW was developed by Schaeffler Group, which is named E-Wheel Drive. It adopts an electric motor with a maximum power of 25 kW. And with a planetary gear reducer, the system output is up to 700 Nm, which significantly expands the output range of the system [8]. In addition to the traditional mechanical geared-motor systems, Coaxial Magnetic Gear (CMG) has attracted increasing attention in recent years, which can offer the advantages of light weight, compact size, and low-speed high-torque operation. Linni Jian and K. T. Chau proposed an integrated Halbach-magnetic-geared permanent-magnet (PM) motor as an IWM [9]. Yujun Shi and Jin Wei proposed a novel dual-permanent-magnet-excited (DPME) machine, which employed CMG, electromagnetic clutch, and two sets of permanent magnets (PMs) to achieve power splitting [10]. Reference [11] proposed a novel DPME machine with a flux strengthening effect. Reference [12] studied the magnetic torque interaction among the modulating ring and two rotors. We can see that CMG is a promising technology in EDW, which will take time to be developed and industrialized in the future. In this paper, we developed a novel speed-reduce EDW with idler gear. We based this EDW on the traditional planetary gear configuration and evolved it further to be a novel idler gear configuration, which could achieve a higher transmission ratio. When under the same constraints of space, the novel speed-reduce EDW proposed in this paper has the advantage of higher torque density than the traditional speed-reduce configuration. At the same time, the challenges of transmission shock and negative effect of un-sprung mass also come alone, which should be improved by specific parameter optimization of the system.
From the perspective of automotive engineering, the EDW is an integrated execution unit that combines the function of the powertrain and suspension [13,14]. In this sense, the performance of EDW should be studied comprehensively from different dimensions, which is crucial for the parameter design and optimization. However, the real design challenge exists in the constrains that interact and affect each other. As a result, it is usually impossible to obtain the optimal parameter solution for a certain performance. Instead, the design goal is to find a balance between various requirements under some certain constraints. So, it is significant to conduct a comprehensive analysis to evaluate how each parameter affects the performance in different dimensions. The core requirement of system longitudinal performance is power transmission smoothness, with the dynamic characteristics valued by gears meshing and load-sharing performance [15,16,17]. At the same time, the system vertical performance is related to vehicle ride comfort. There are core indicators such as vehicle body acceleration and wheel dynamic load that can be theoretically calculated by the dynamic model and differential equations [18,19,20]. Finally, the EDW design should consider three dimensions: light weight, transmission smoothness, and ride comfort. At the premise of geometric constraints, the engineering design is supposed to find a balance between the three.
2. Research Objective
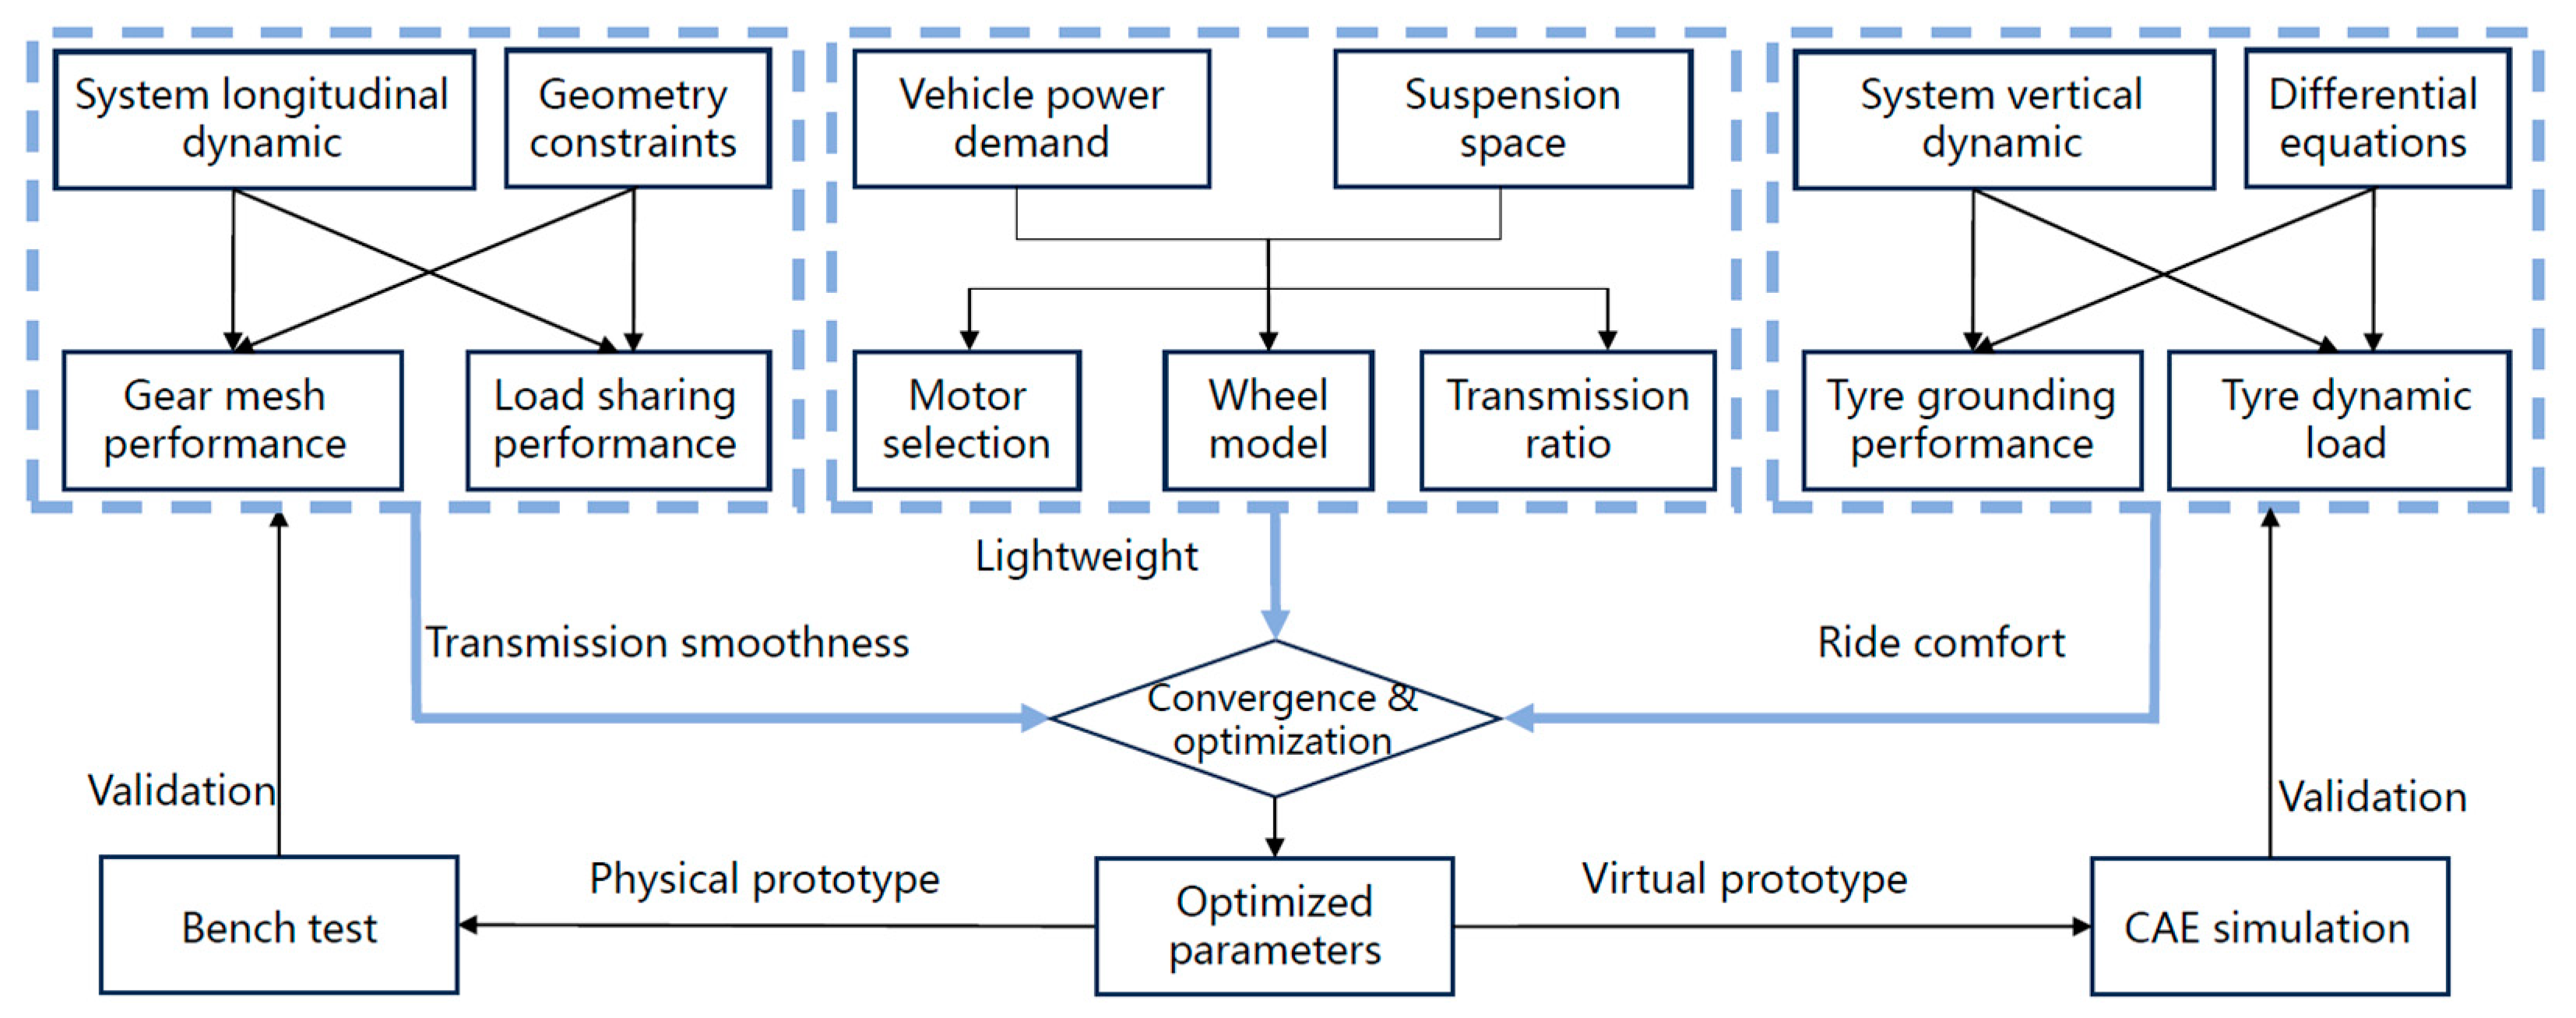
The EDWs are mounted on the chassis to meet the vehicle’s power requirements. When we set the EDW as research objective, we are seeking for indicators of output performance. For a given EDW design, the output performance of EDW has a direct impact on the dynamic performance of the vehicle. When the vehicle is driving, EDW works as propulsion machine and suspension system at the same time, so the EDW research involves an intersection of multiple disciplines [21,22]. For example, the longitudinal dynamic characteristics of EDW are carried out under geometric constraints, which involves gear-meshing performance and load-sharing performance. In addition, the vertical dynamic characteristics of EDW are related to vehicle ride comfort. Usually, differential equations are established to study tire grounding characteristics and wheel dynamic loads. For these complex working conditions, it is necessary to model and analyze them one by one and study the principle of how each parameter works in the system. A virtual prototype was built for the CAE simulation, and a physical prototype was made for the bench test, both of which were analyzed to validate the theoretical principles. The overall flowchart of research process above is presented in Figure 1.
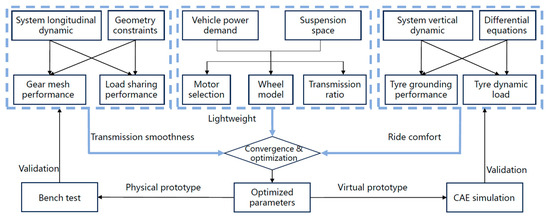
Figure 1.
Overall research flowchart. The blue boxes represent Transmission smoothness, Lightweight, Ride comfort respectively, as the words in the figure. The arrows means based on A we can get B, where the arrow is from A to B.
2.1. Basic Structure
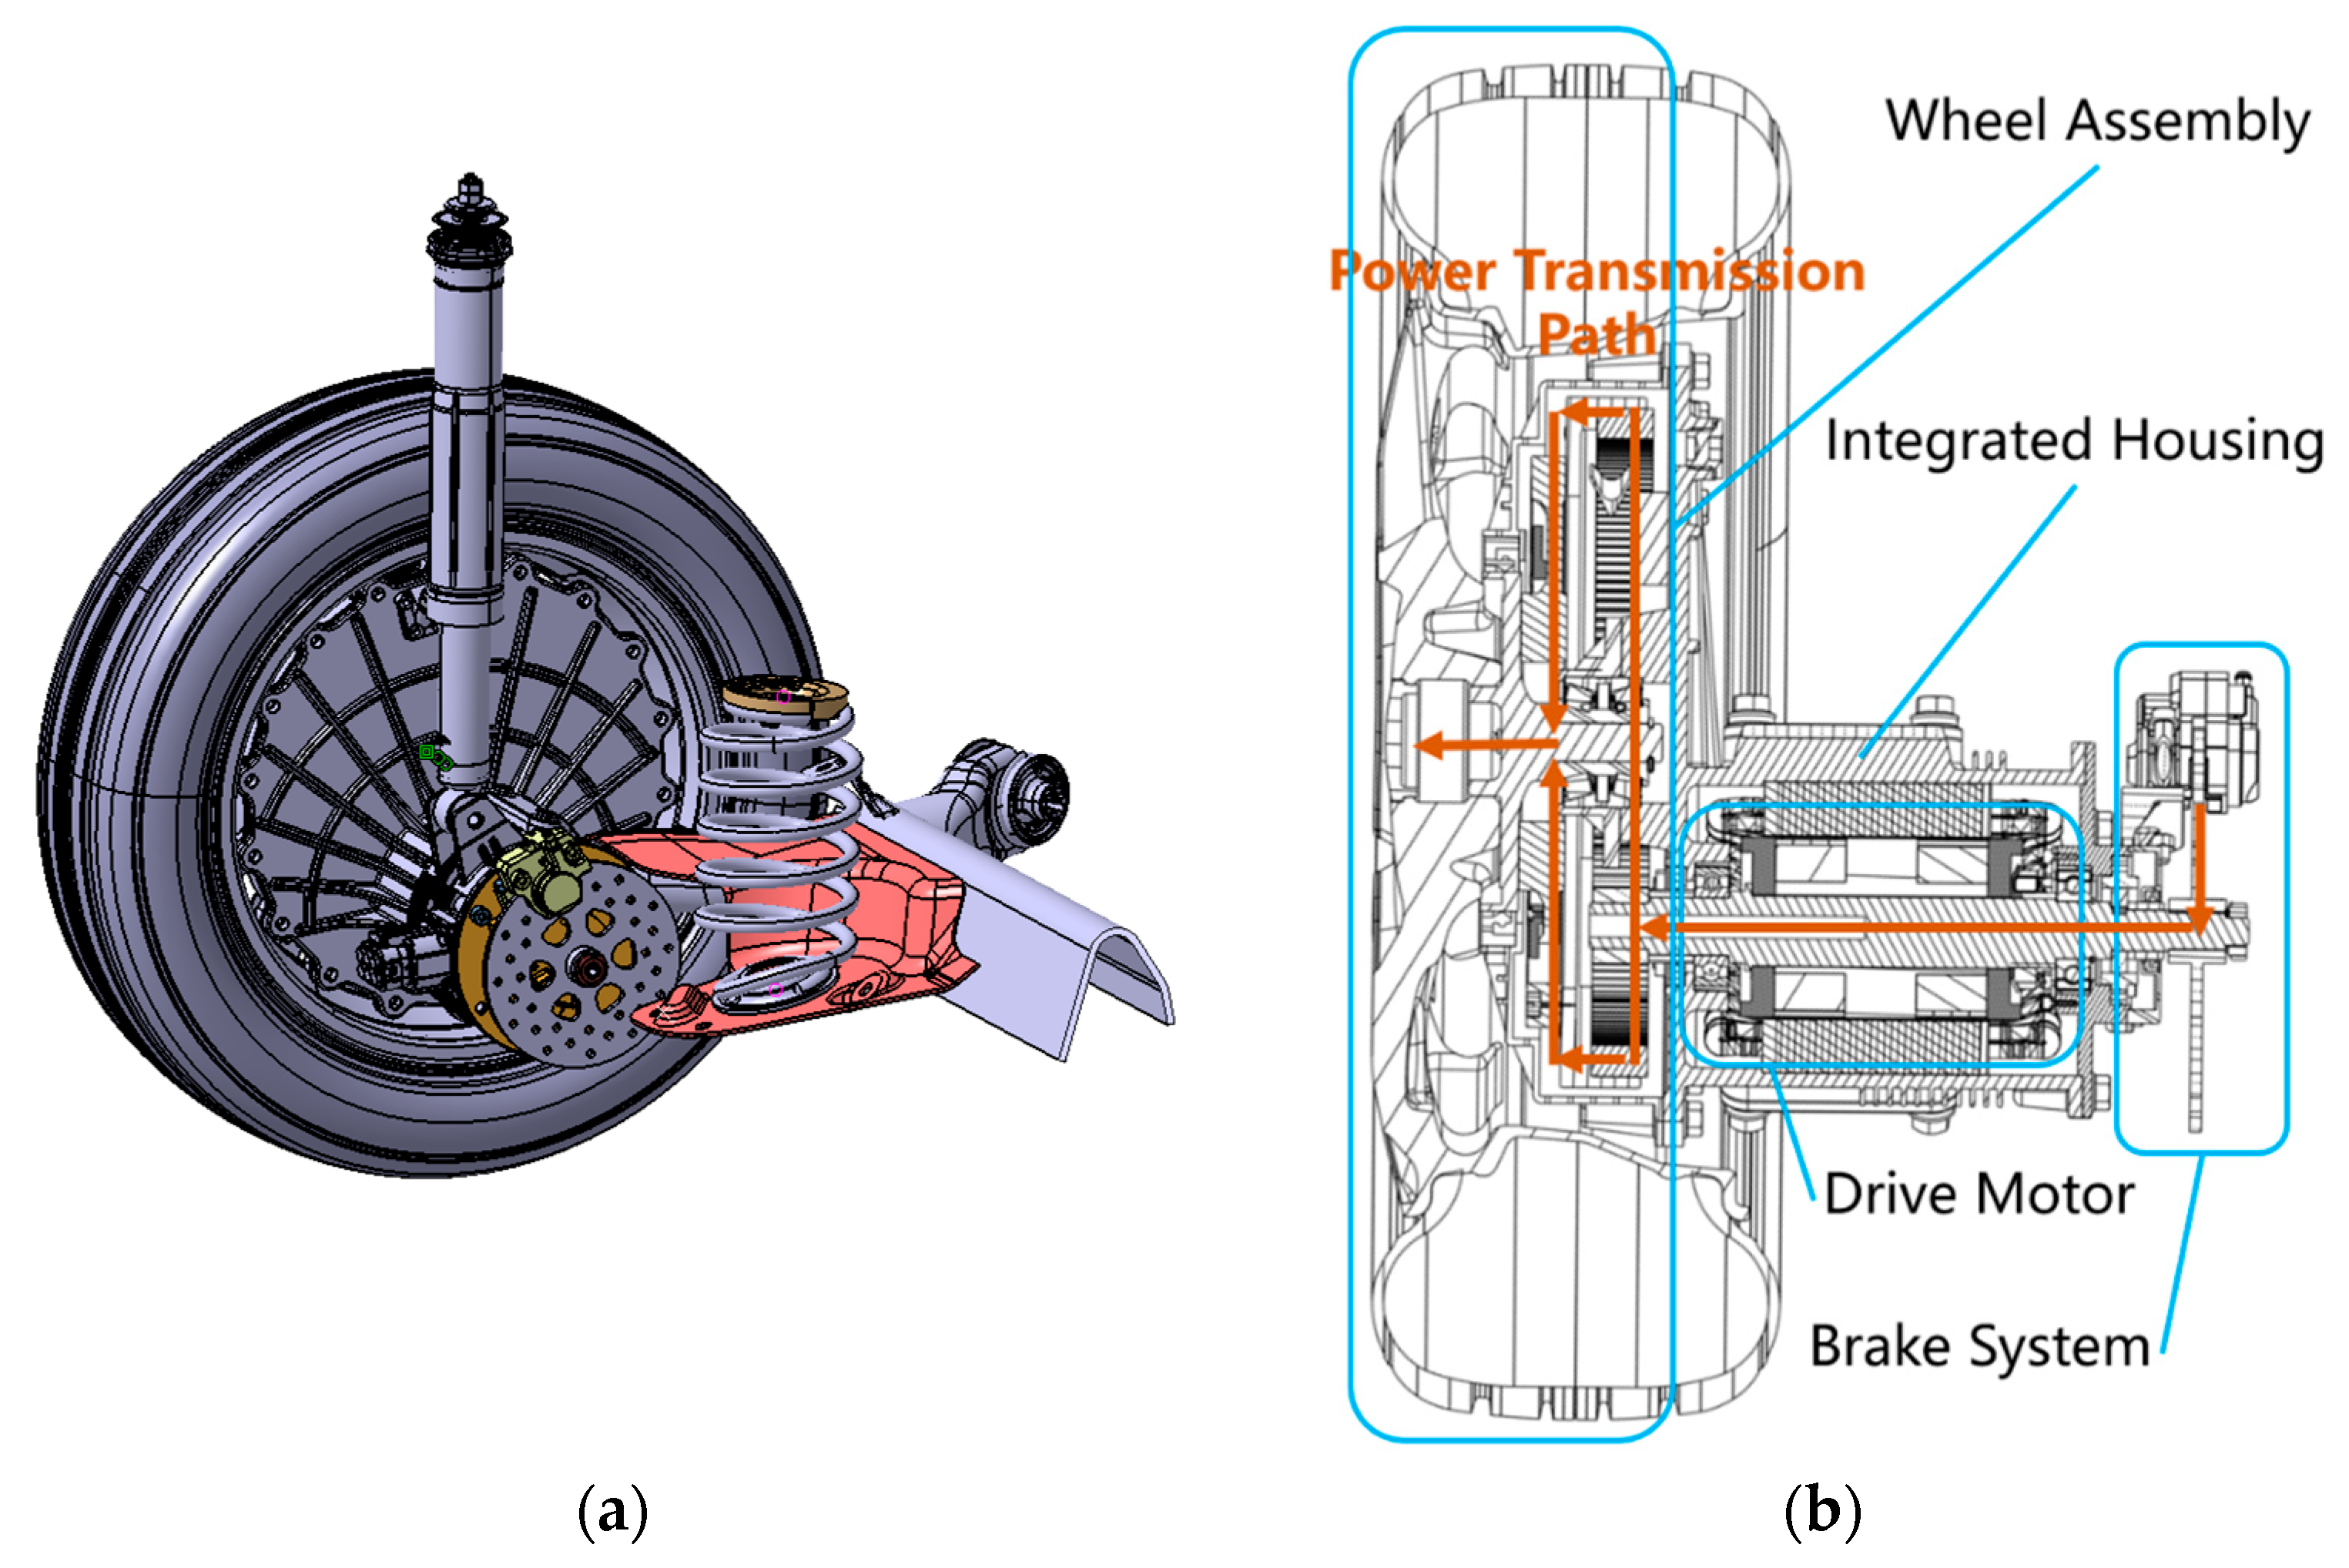
The basic structure of an electric wheel with idler gear configuration includes a wheel assembly, a drive motor, a transmission system, and a brake system, all of which are installed on an integrated housing. Figure 2 presents the appearance of an EDW and power transmission path inside. We can see the driving motor biased at the wheel center position, and two idler gears are arranged symmetrically. When the vehicle is driving, the motor gear transmits the motor torque, then meshes with the two idler gears are simultaneously, and ultimately drives the wheels [23].

Figure 2.
Basic structure of the EDW. (a) EDW appearance. (b) Power transmission path.
The parameters and relevant information of the vehicle equipped with the EDW are summarized in Table 1. A permanent magnet synchronous motor was selected as the power source to meet the power requirements, and the transmission system and integration design will be discussed in detail below.

Table 1.
Parameters of the DDEV and EDW.
2.2. Configuration Evolution
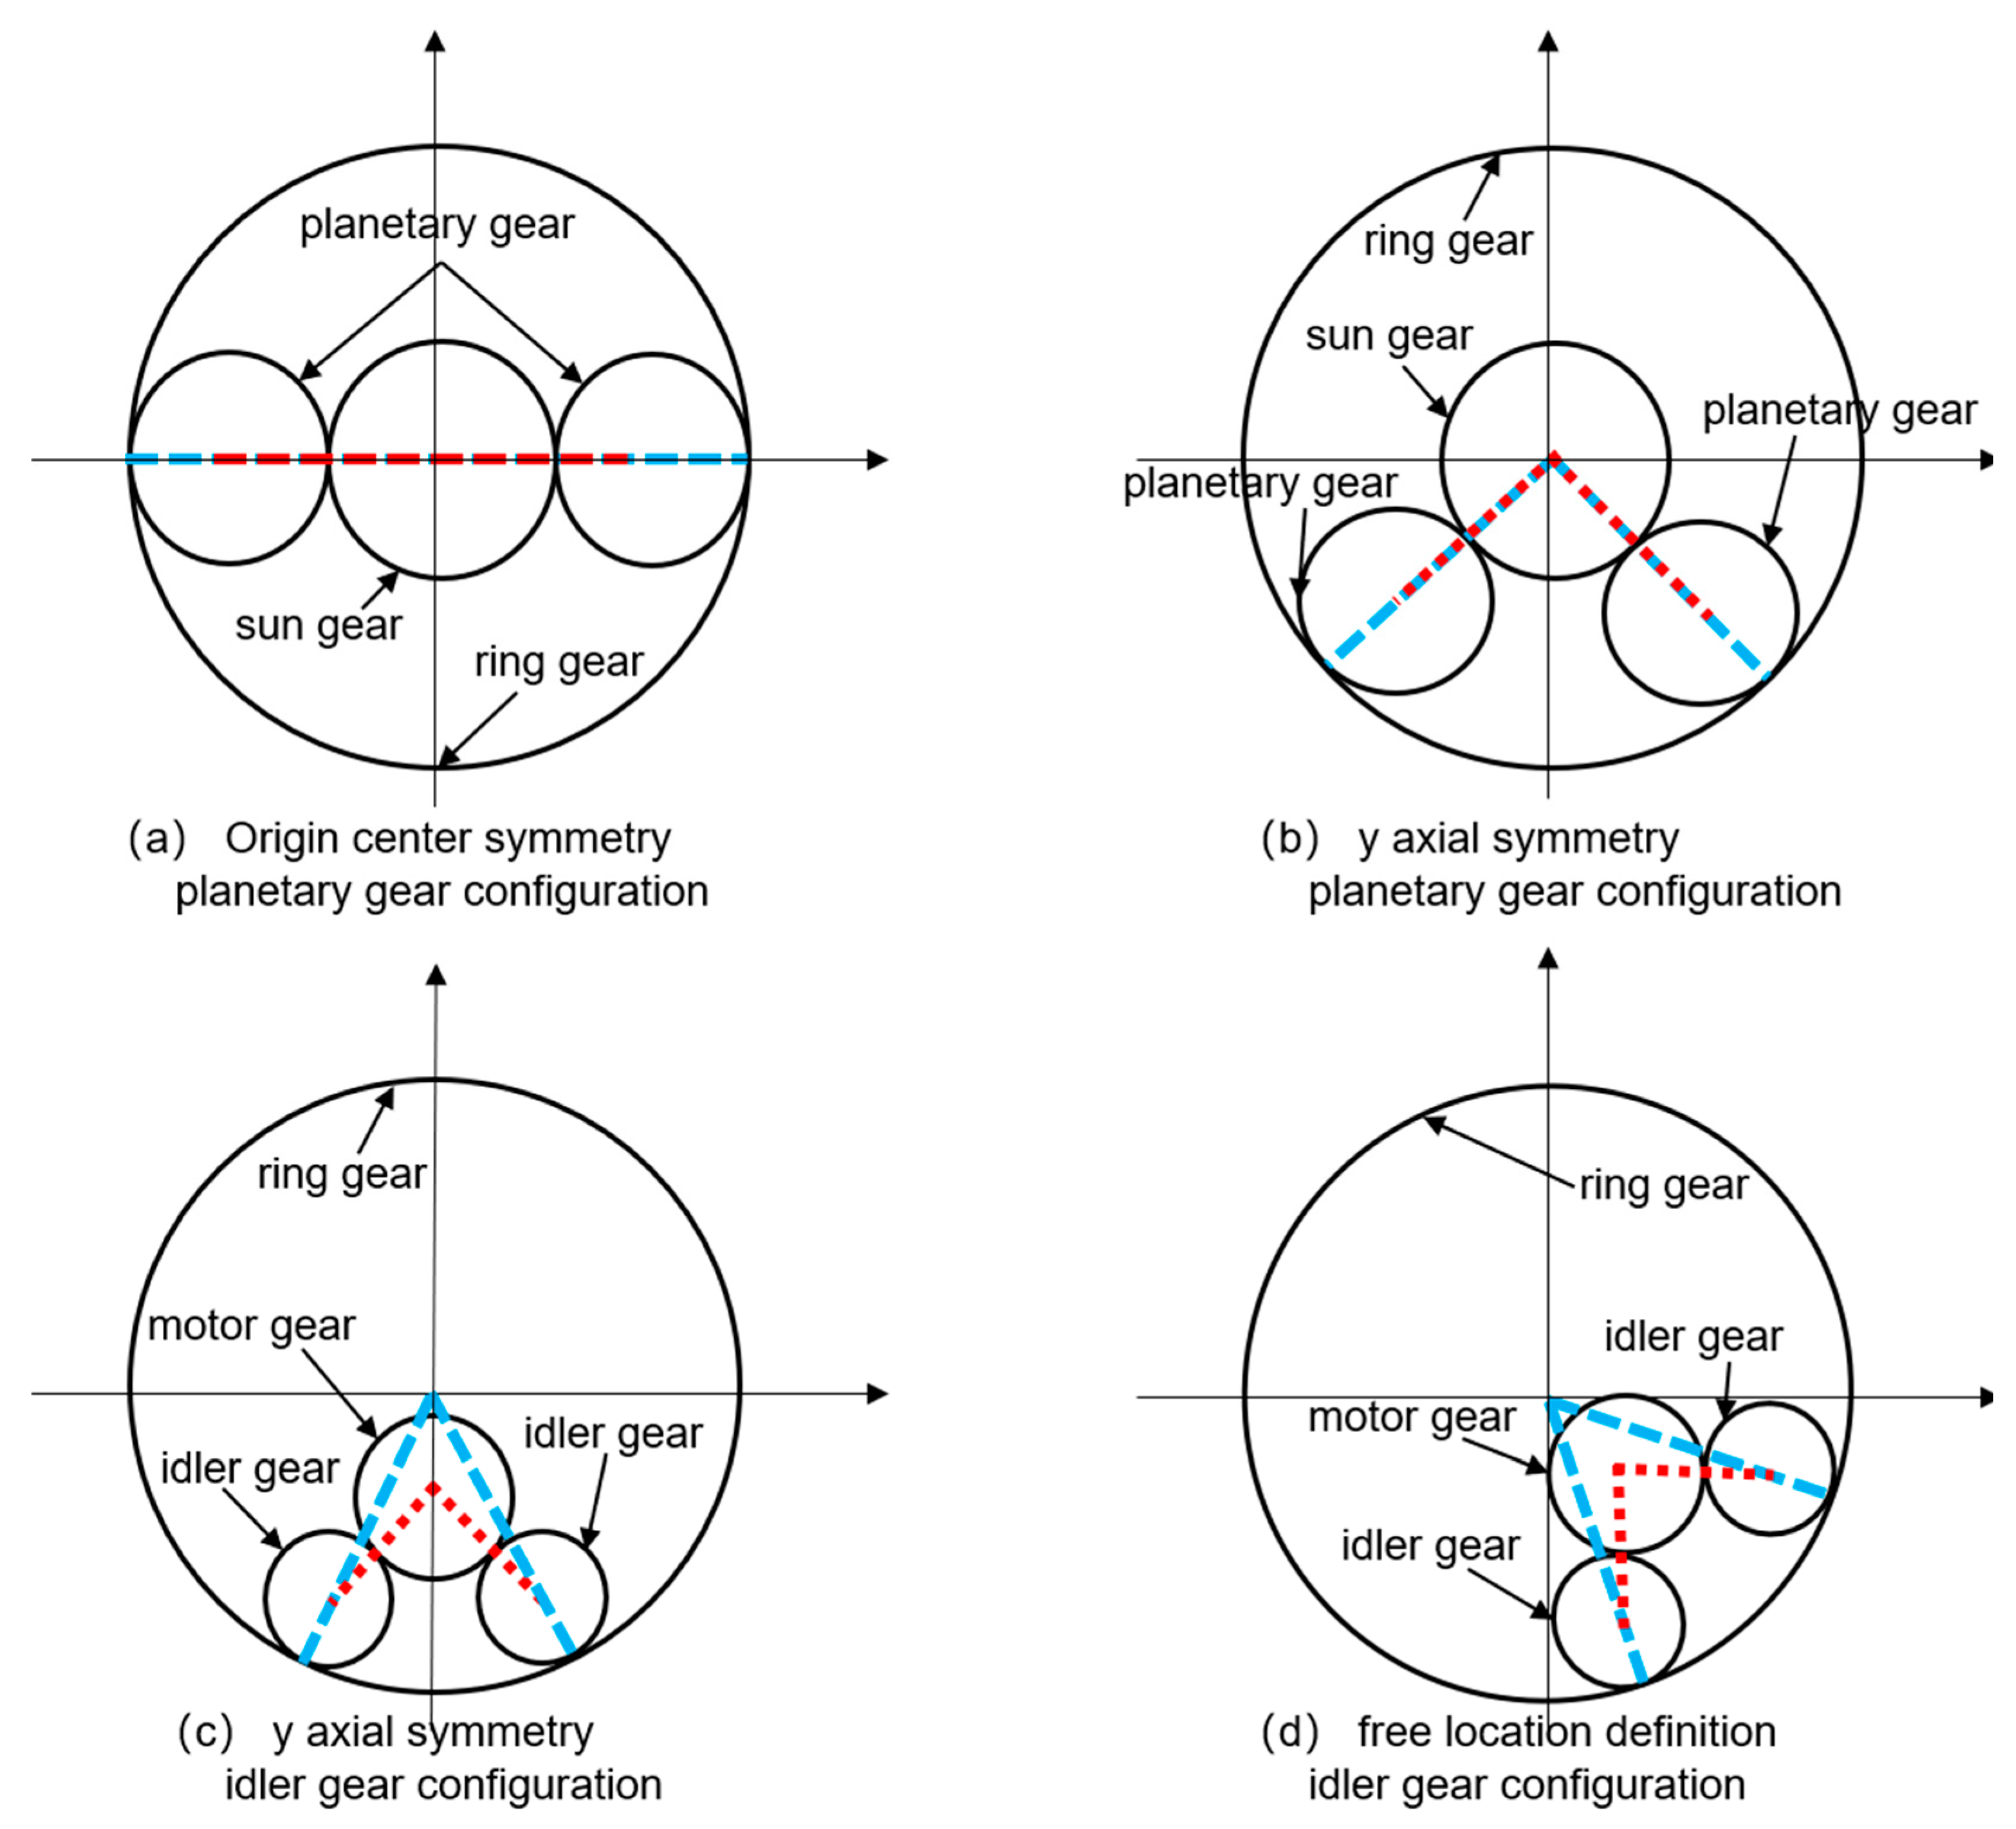
For a single row planetary gear transmission mechanism, there are usually three solutions to achieve the function of reducing speed and increasing torque: (1) sun gear input/planetary carrier output/ring gear fixation; (2) sun gear input/ring gear output/planetary carrier fixation; (3) planetary carrier input/gear output/sun gear fixation. Among the three, under the same space constraints, scheme (2) can achieve the maximum transmission ratio, which is beneficial for improving the torque density of the system [24]. Moreover, the evolutionary configuration of scheme (2) can also achieve more performance improvements by targeted parameter optimization. Figure 3 shows the process of configuration evolution. For the convenience of analysis, we set the number of planetary gears in the initial state to 2. The planetary gears were symmetrically arranged on the x-axis, and the centerlines of all gears were connected in a straight line, as shown in Figure 3a. When the center of the planetary gear deviated from the x-axis and was symmetrically arranged in the third and fourth quadrants, the connecting lines of each gear center formed a symmetrical intersection angle, as shown in Figure 3b. From Figure 3b, the sun gear was offset along the y-axis by a certain distance, resulting in Figure 3c. At this stage, the sun gear was no longer in the symmetrical center position, so the sun gear was converted into a motor gear, and the planetary gear was converted into an idler gear. At this stage, the connecting lines of each gear center formed a concave quadrilateral. Figure 3d is based on Figure 3c, in which the motor gear and idler gear were rotated by a certain angle together. Figure 3d allows for the free definition of the motor gear position. Their corresponding relationships have also become parameter variables that can be optimized.
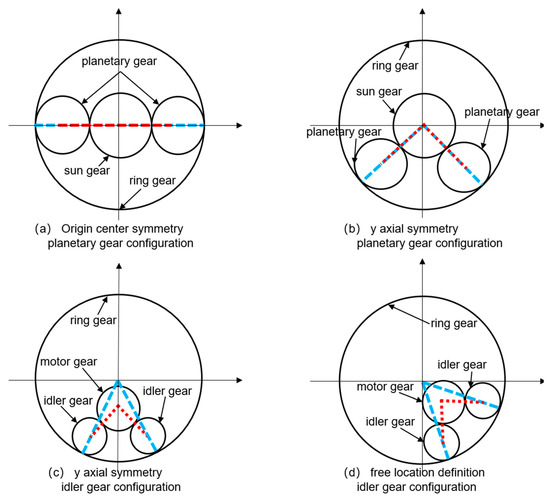
Figure 3.
Evolution of transmission system configuration. The red line represents the center line and angular displacement generated by the external meshing between the motor gear and the idler gear. The blue line represents the center line and angular displacement generated by the internal meshing between the idler gear and the ring gear.
2.3. Constraint Conditions
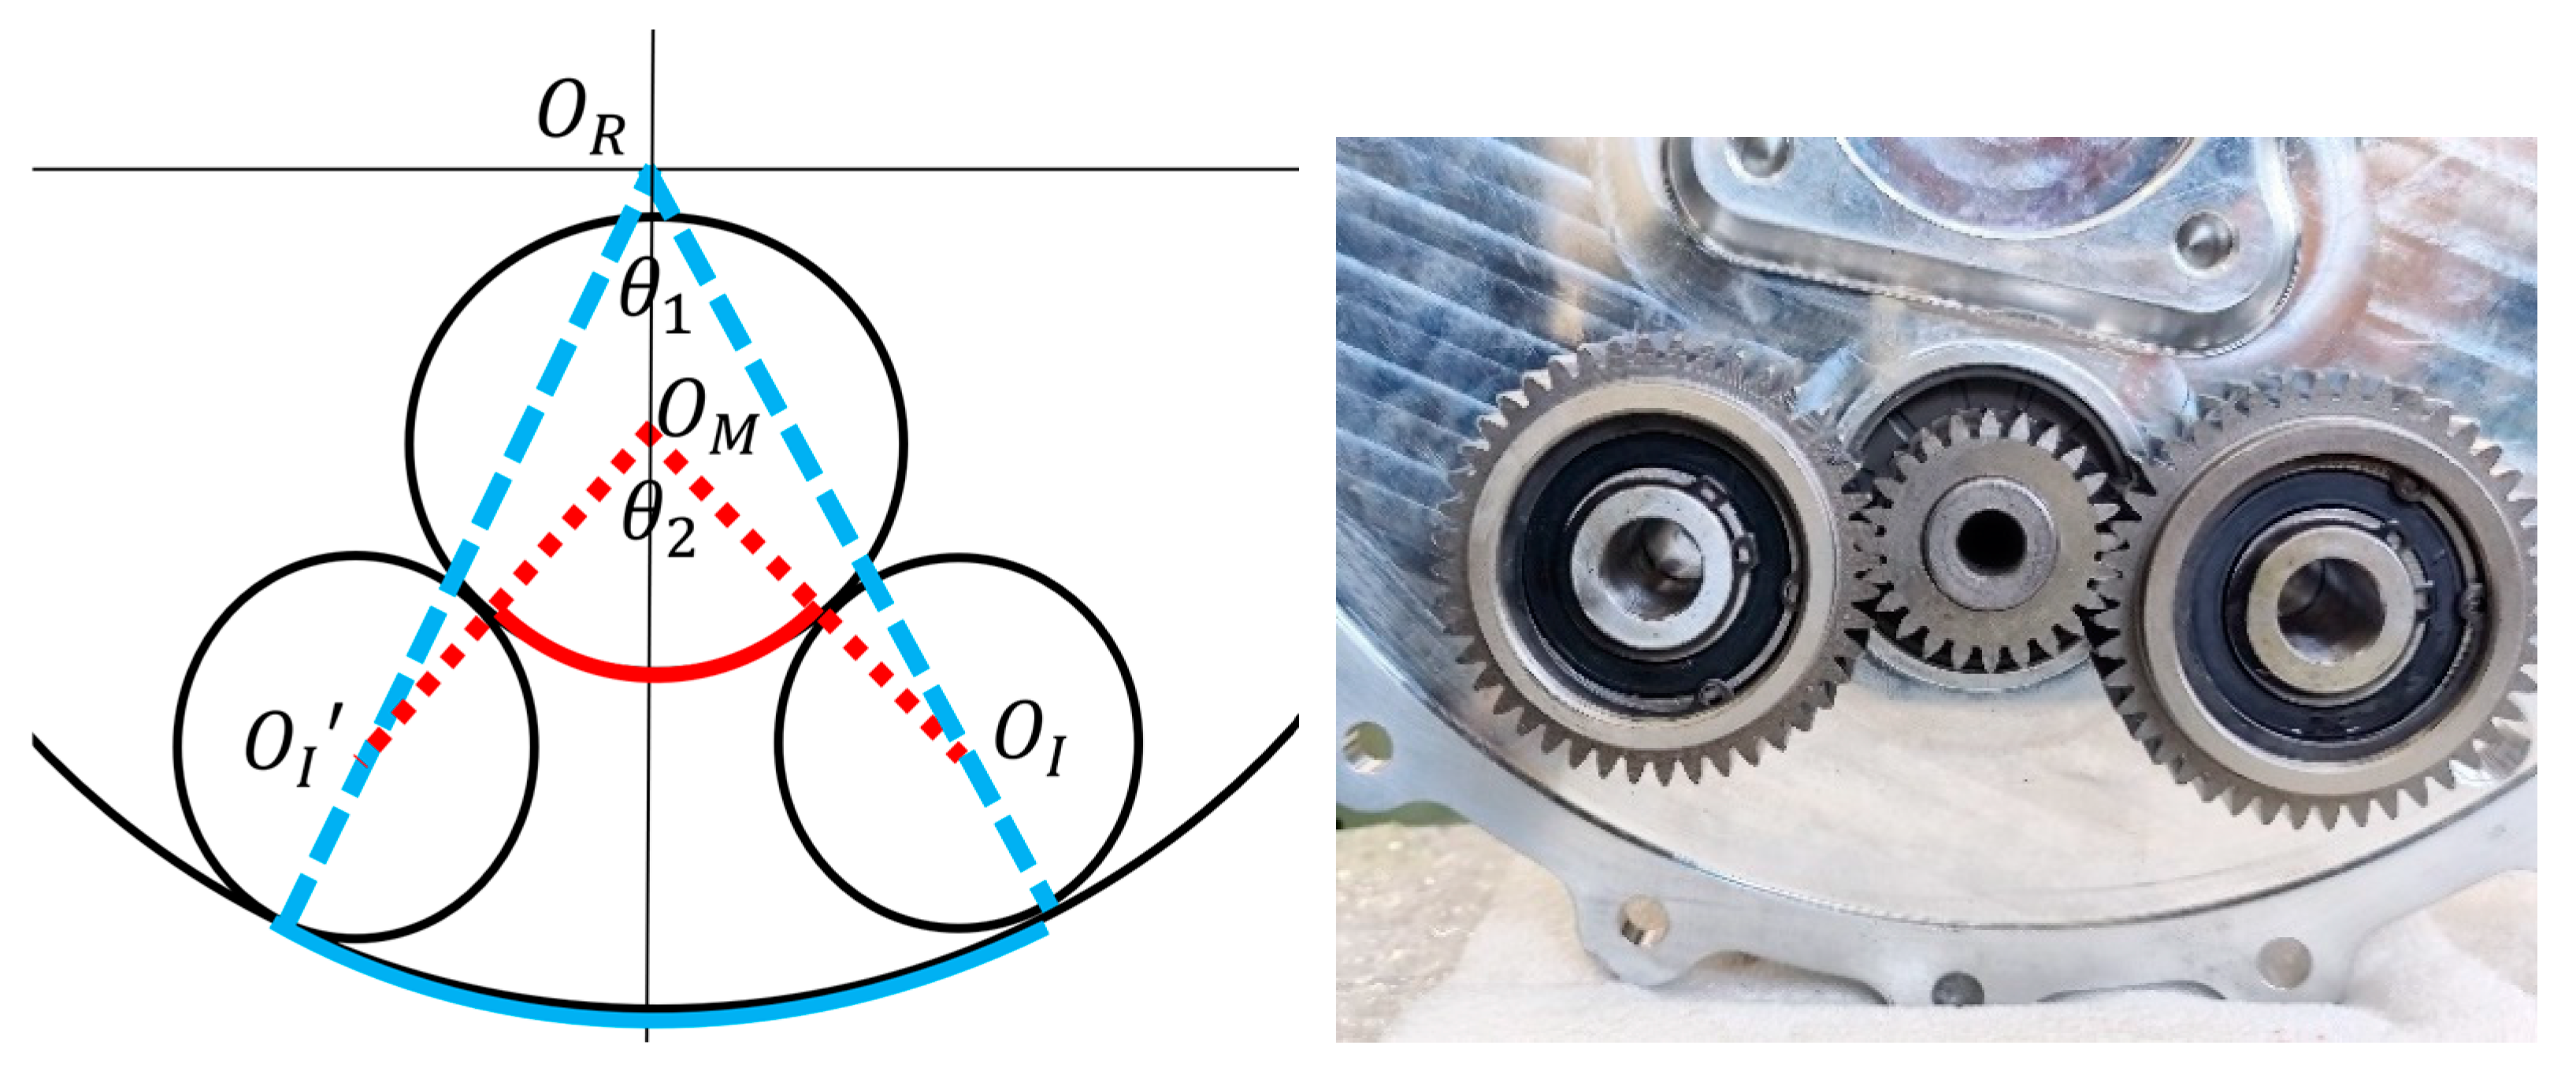
To ensure the basic function of idler-gear transmission, geometry constraints come as priority. Take the partial view in Figure 4 as an example to illustrate the geometric relationship under meshing constraints. Among them, is the center of the motor gear. is the center of the ring gear. and are the centers of the two idler gears respectively. is the intersection angle of the connecting line and . is the intersection angle of the connecting line and .

Figure 4.
Meshing state of the idler gear. The red line represents the center line and angular displacement generated by the external meshing between the motor gear and the idler gear. The blue line represents the center line and angular displacement generated by the internal meshing between the idler gear and the ring gear.
For spur gears, knowing that
In a geometrical relationship, we can see that the forms a concave quadrilateral. Specifically, the length can be calculated as
When the electric-drive-wheel works, the motor gear rotates with the idler gear and ring gear simultaneously. The arc length contained by the motor gear in (red curve in Figure 4) can be calculated as
Similarly, the arc length contained by the ring gear in (blue curve in Figure 4) can be calculated as
To ensure the gear mesh simultaneously, the gap of generated arc length should be an integer, which can be expressed as
The value of Z reflects the periodic variation of the meshing phase between the internal and external meshing of the idler gear [25].
In addition to the geometric relationships mentioned above, the gear parameters also need to satisfy a series of constraint conditions. For a standard 15-inch passenger car wheel, considering the housing thickness and installation space, the large diameter of the gear ring needs to meet the requirement (7):
To ensure meshing stiffness and processability, the single-sided wall thickness between the tip diameter and major diameter of the ring gear needs to meet the requirement (8)
Last but not least, the contact fatigue strength and root bending strength of gears must be guaranteed. There are already many existing studies in this area [26,27]. Due to limited space, they will not be repeated here.
3. Longitudinal Characteristic Analysis
The EDW adopts an idler gear configuration, with the motor gear connected to motor rotor shaft. The motor gear transmits power by meshing with two idler gears symmetrically arranged. The two idler gears simultaneously mesh with the ring gear. The ring gear is connected to the wheel rim, ultimately driving the vehicle. In this transmission system, a coordinate system is established with the center of the ring gear as the origin. All components only rotate on their own center line without revolving, and the transmission ratio of the entire system is calculated as following
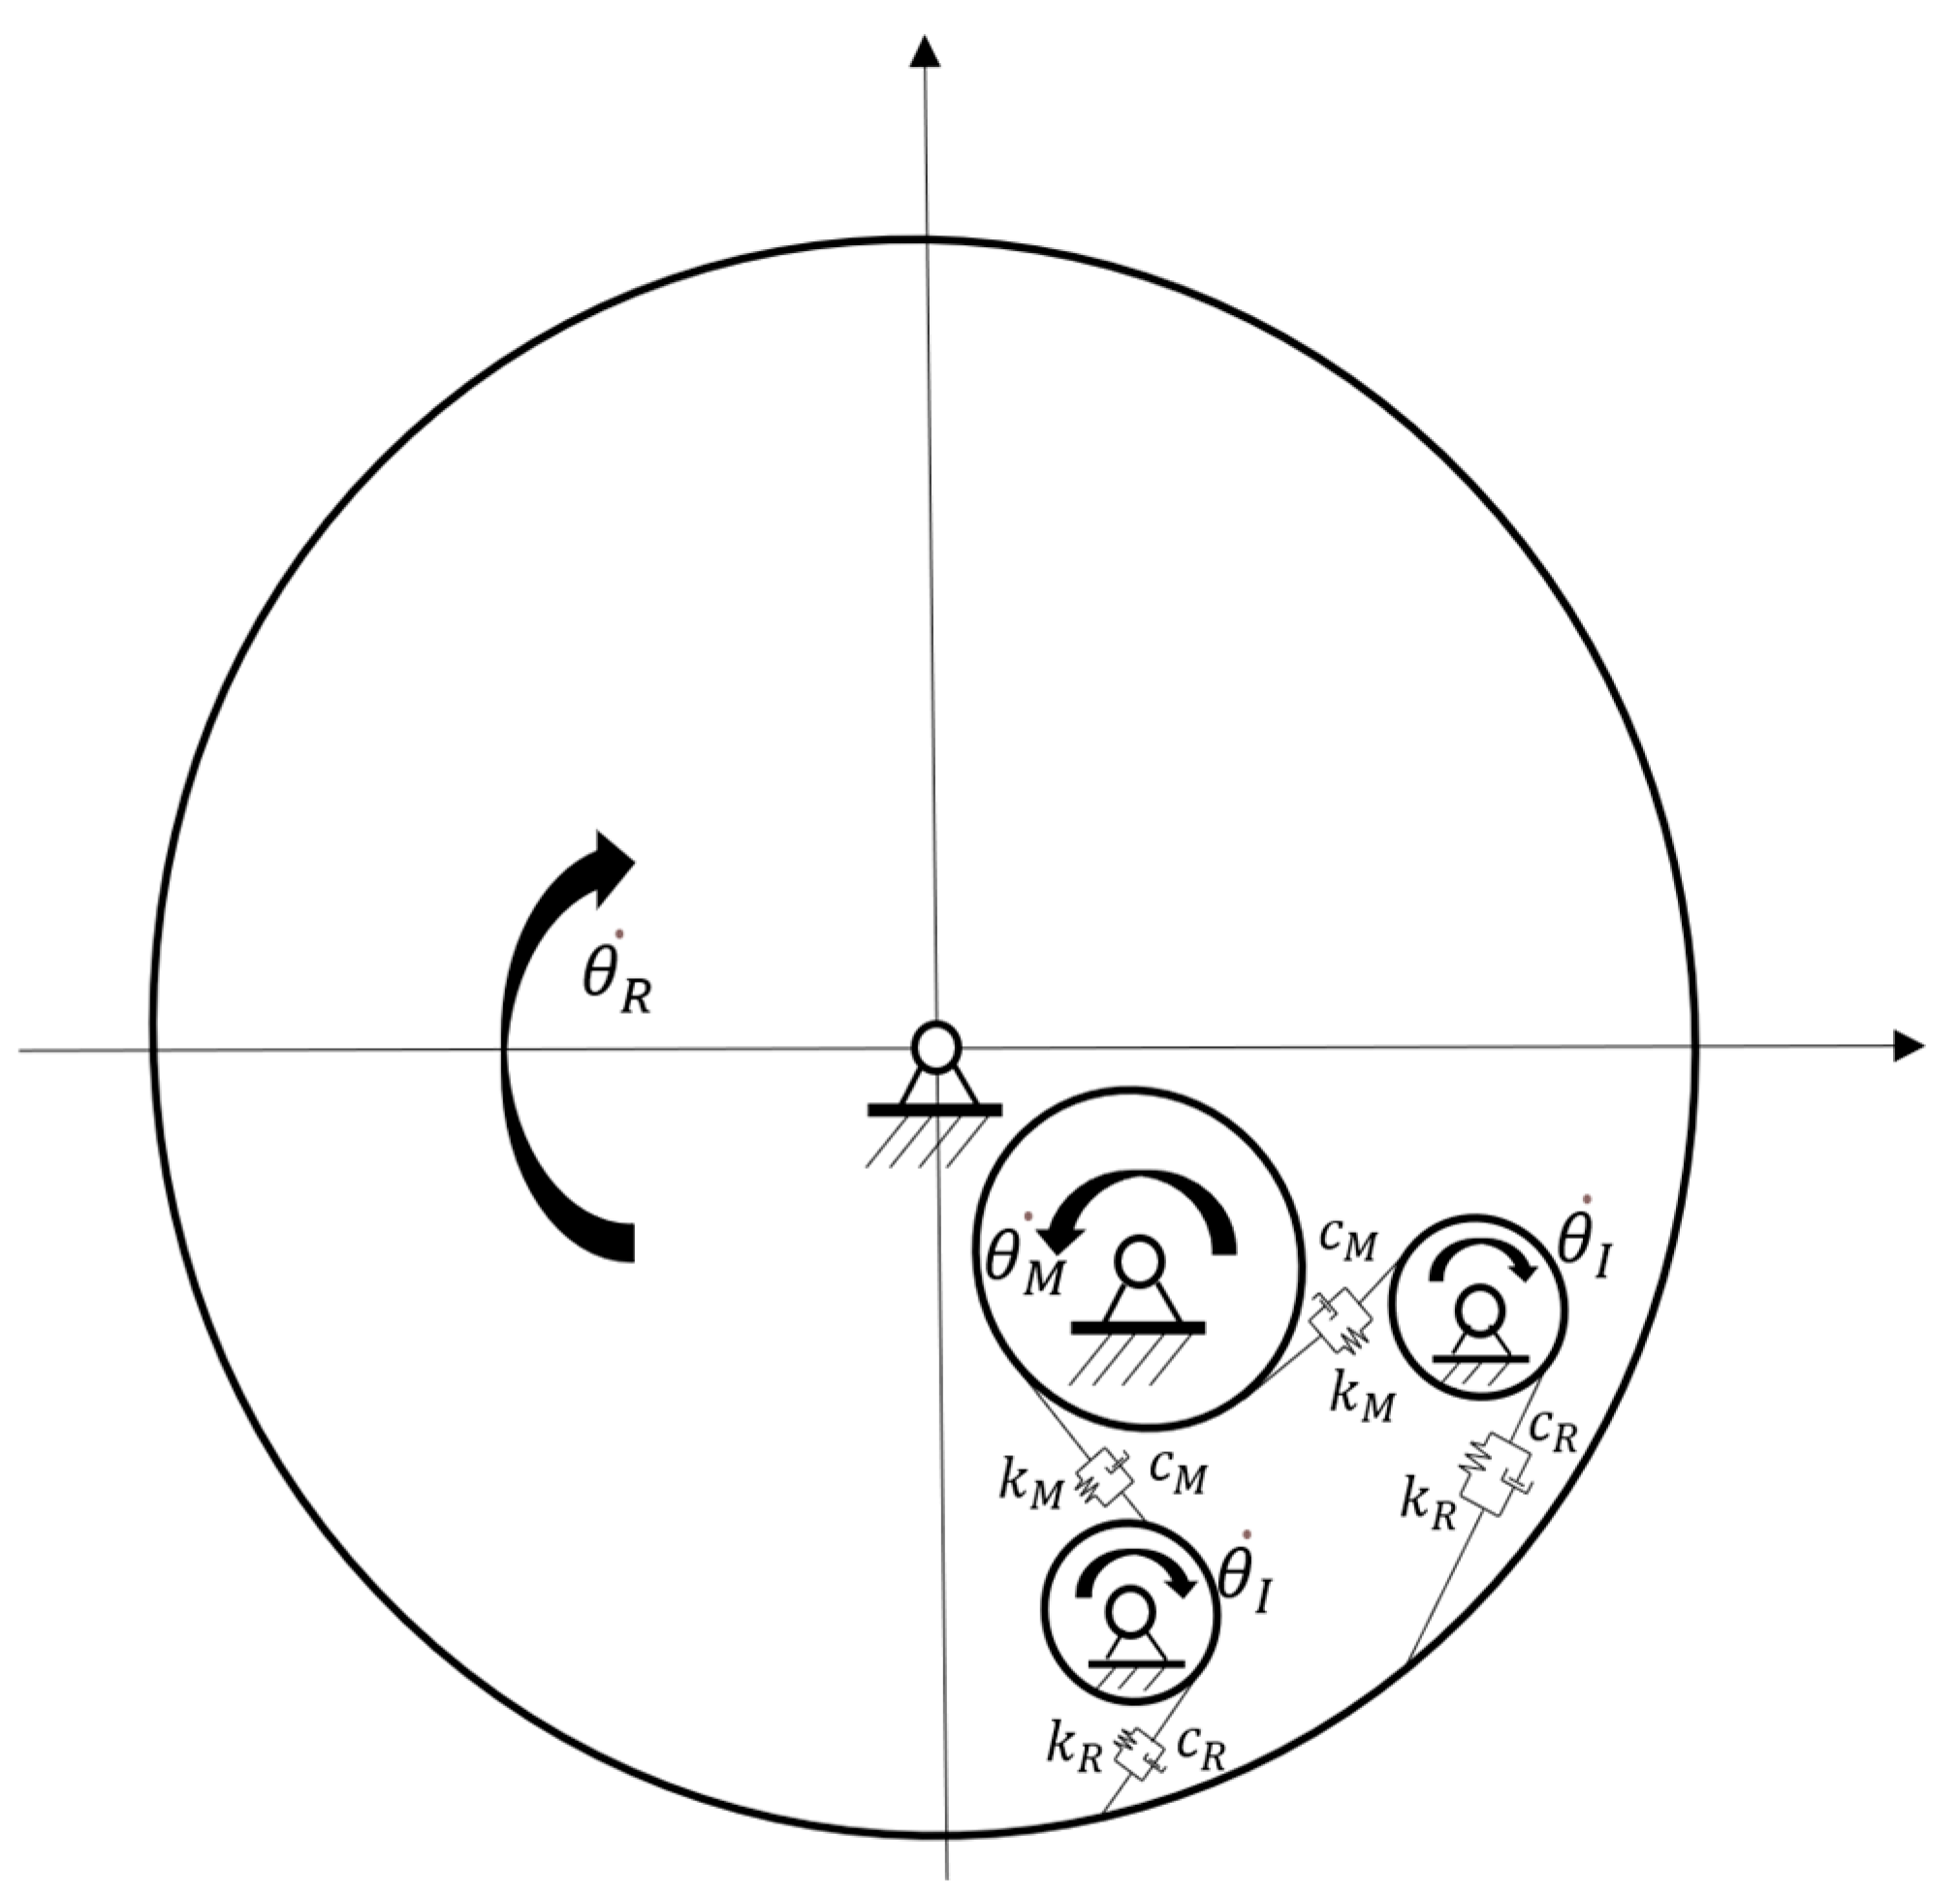
In the formula, represents the system input speed. represents the speed of the motor gear. represents the system output speed. represents the speed of the ring gear. The idler gear in this case uses spur gears, and each gear does not generate axial force during rotation. Adopting the method of concentrated mass modeling, the various components in the system are simplified as rigid bodies with concentrated mass. We assumed rigid bodies are all connected to each other through spring damping, without considering frictional losses. The system modeling is shown in Figure 5. Among them, represents the speed of the idler gear. The idler gear and motor gear are in external meshing, with an equivalent stiffness of and an equivalent damping of . The idler gear and ring gear are in internal meshing, with equivalent stiffness of and equivalent damping of .
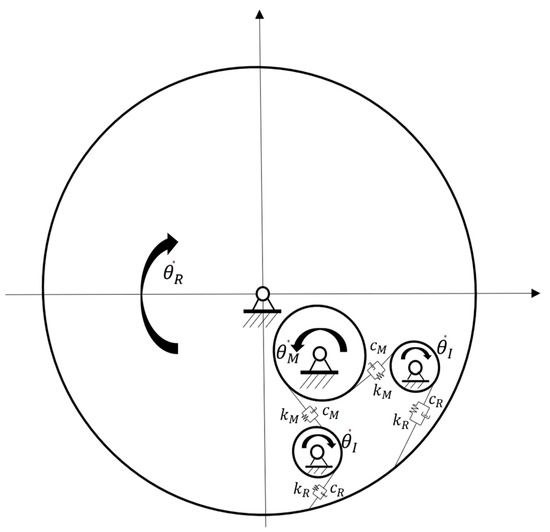
Figure 5.
Modeling of a longitudinal power system for the EDW.
3.1. Power System Model
In the design phase, we assumed that the motor has an ideal uniform air gap state without machining and assembly errors. The motor rotor can be simplified as a torsion spring with weak damping characteristics [28], with the dynamic equation described in (14):
In the formula, is the moment of inertia of the motor rotor; is the motor speed (the motor is fixed to the motor gear with a spline); is the output torque of the motor; ; and are the equivalent torsional stiffness and damping of the motor rotor, respectively. and are the front and rear rotation angles of the motor rotor, respectively.
The various components in the idler gear transmission mechanism are simplified as rigid bodies with concentrated mass. They are connected to each other through spring damping, whose values are determined by the meshing stiffness. The meshing stiffness of gears refers to the relationship between force and displacement at the contact point, which is related to the material properties, geometric shape, manufacturing accuracy, and lubrication conditions of the gears [29]. In the design phase, we use the Ishikawa method to analyze the meshing stiffness of gears, and the meshing between gears can be equivalent to spring damping [30,31,32]. In this way, the gear pair is simplified as a cantilever beam fixed to the gear base. We assumed that the teeth are in uniform contact on the reference circle node. The expression for meshing stiffness is shown in (15):
In the formula, is the elastic modulus of the gear material, is the tooth height, is the length of the meshing contact line, is the distance from the tooth tip circle to the dangerous section, and is the tooth width. When the gear rotates, the number of meshing teeth periodically changes, causing to also vary with time.
Take the meshing damping coefficient as a constant of 0.07, and combine it with Equation (11) to obtain the meshing damping Equation (16):
In the formula, m1 and m2 represent the mass of the driving gear and driven gear, respectively. In this way, the gear meshing force at a certain moment can be expressed as:
In the formula, is the meshing force between the motor gear and the idler gear, and is the relative meshing displacement between the motor gear and the idler gear. They are externally meshing. is the meshing force between the idler gear and the ring gear, and is the relative meshing displacement between the idler gear and the ring gear. They are internally meshing.
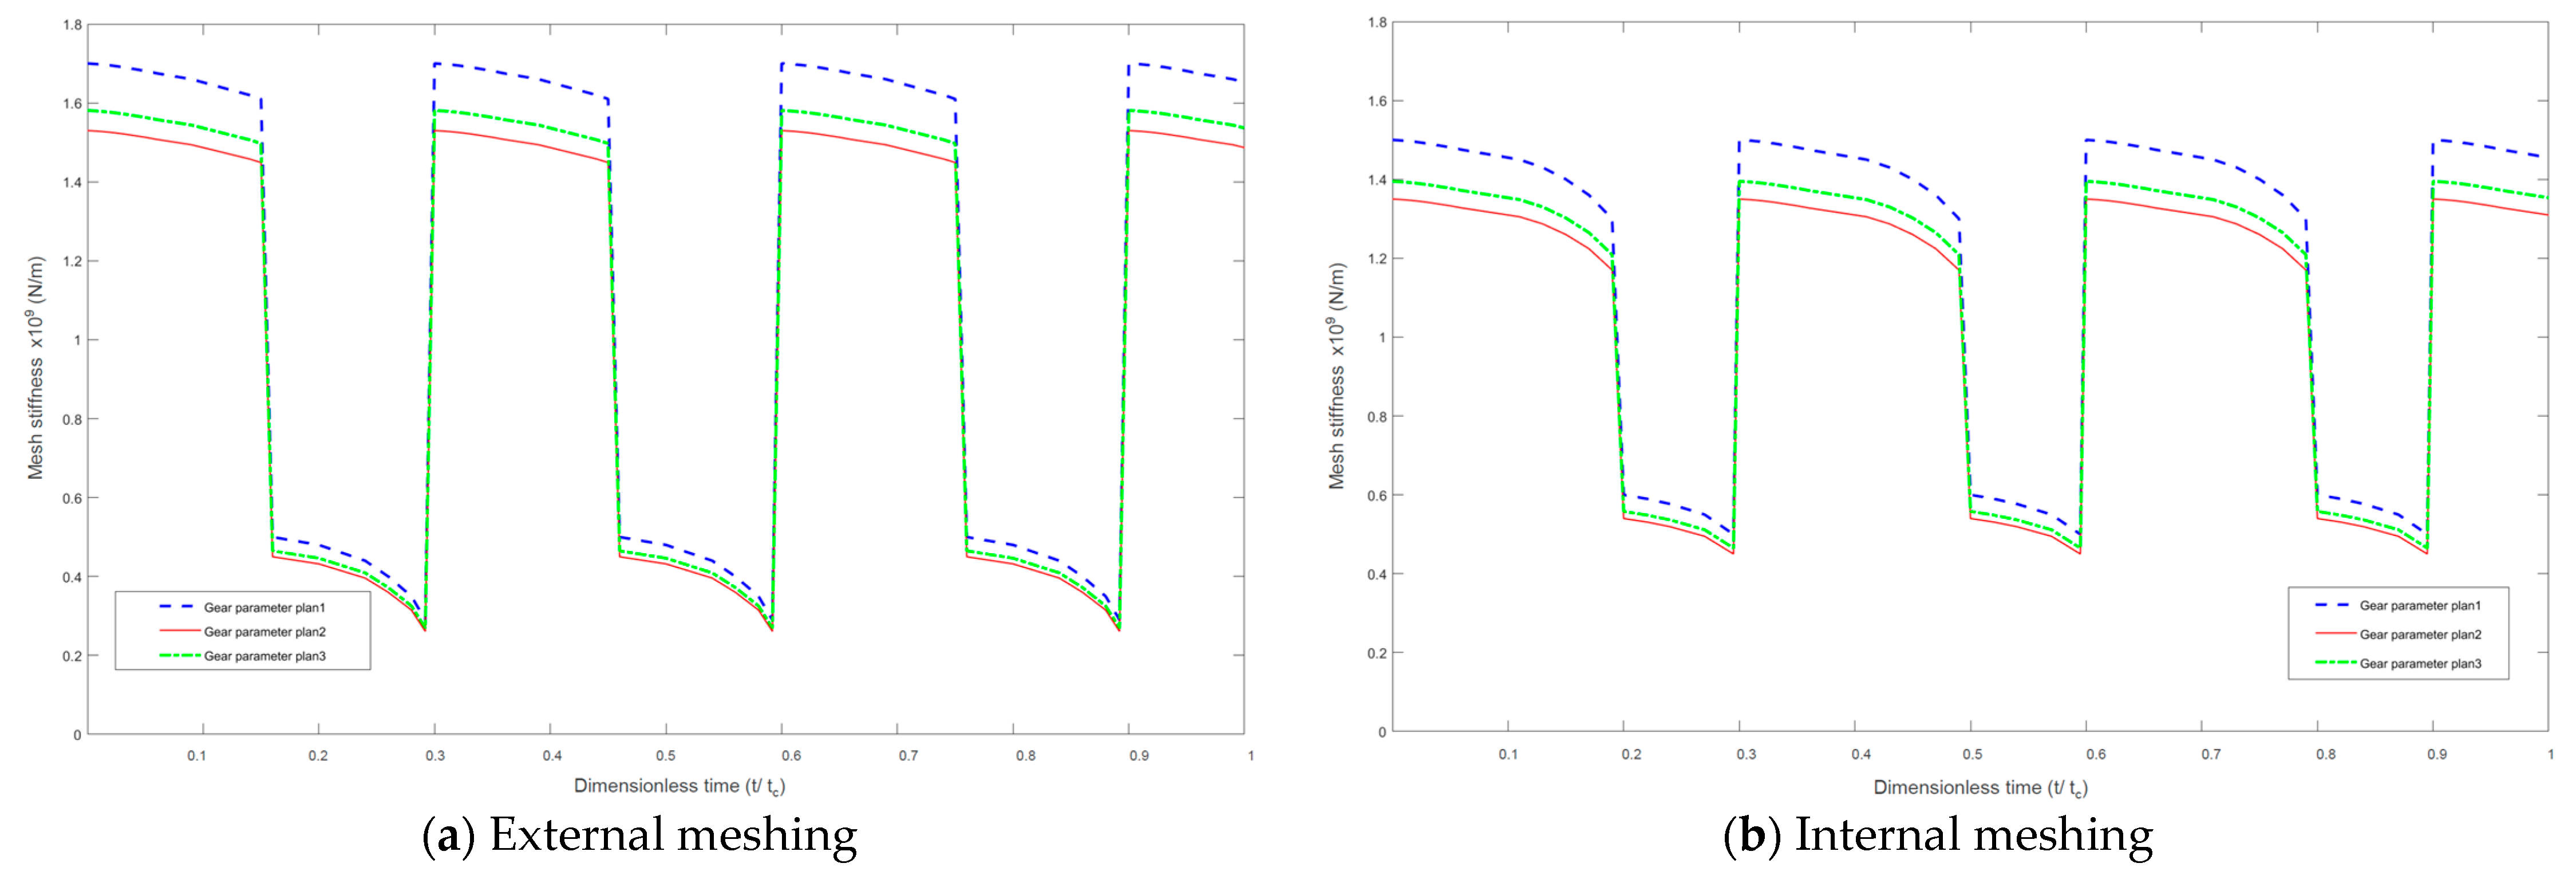
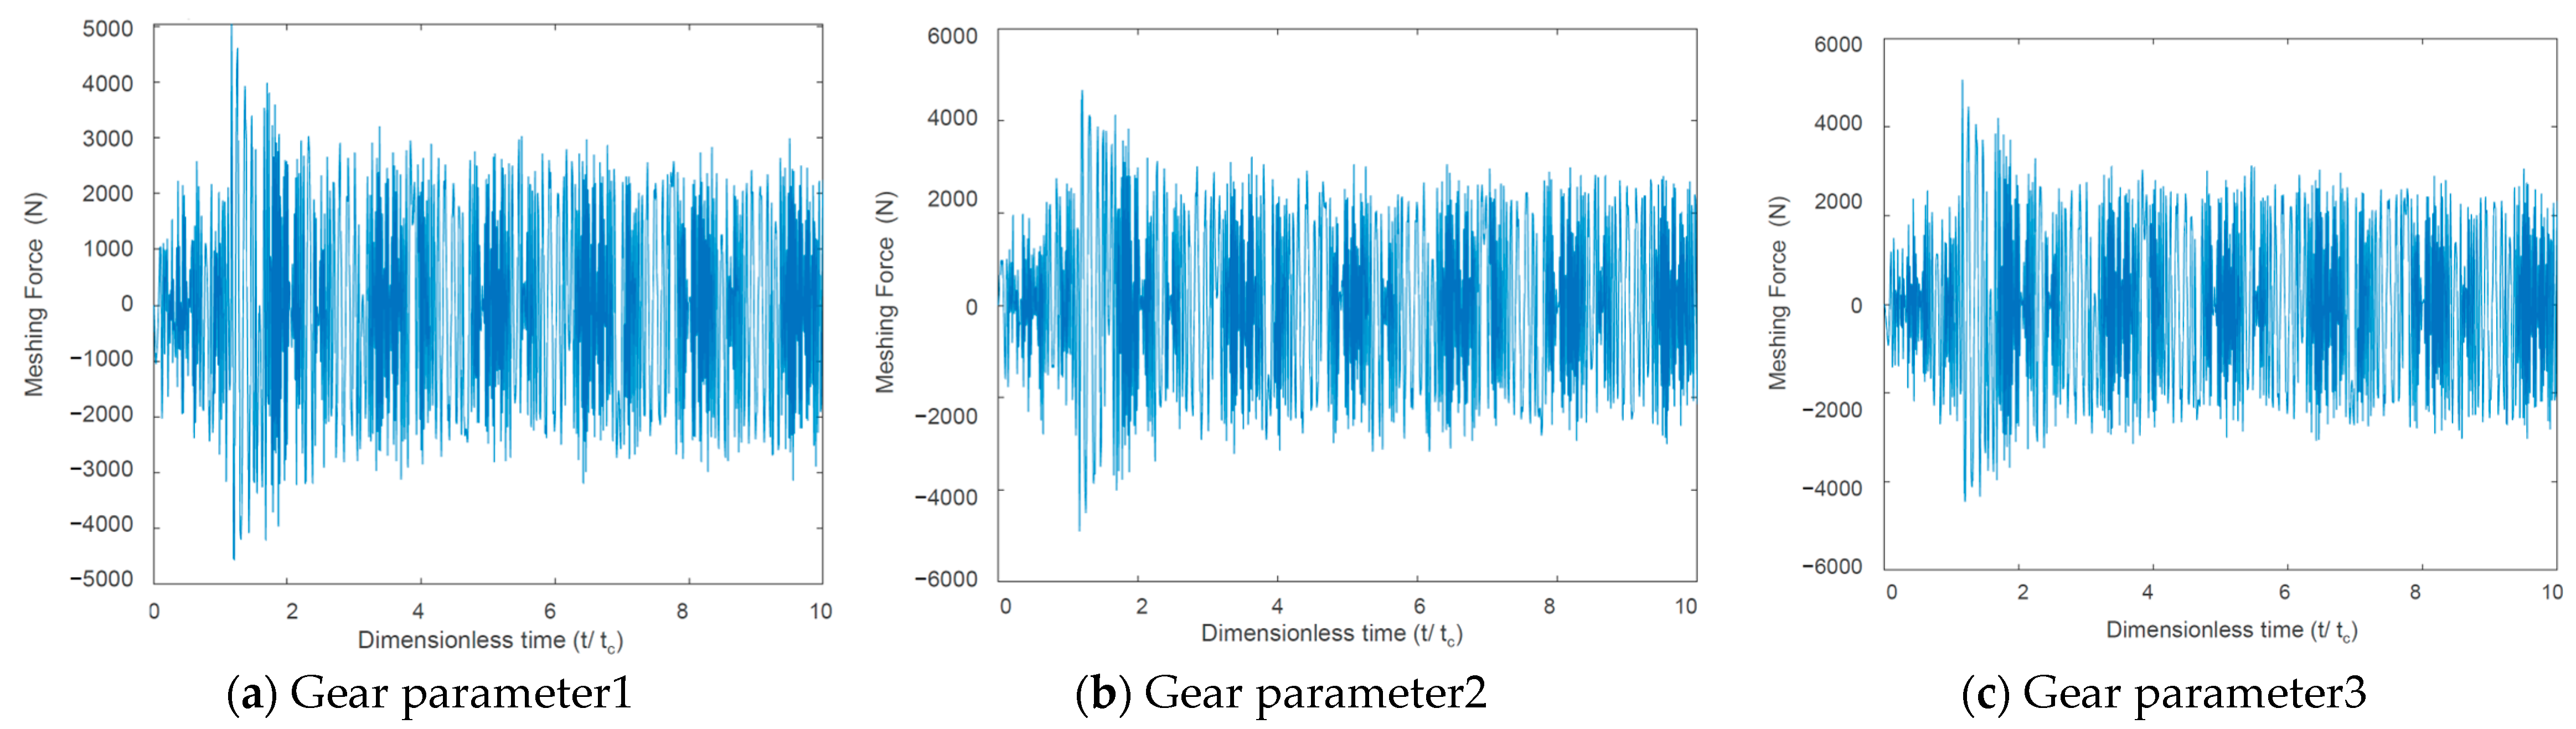
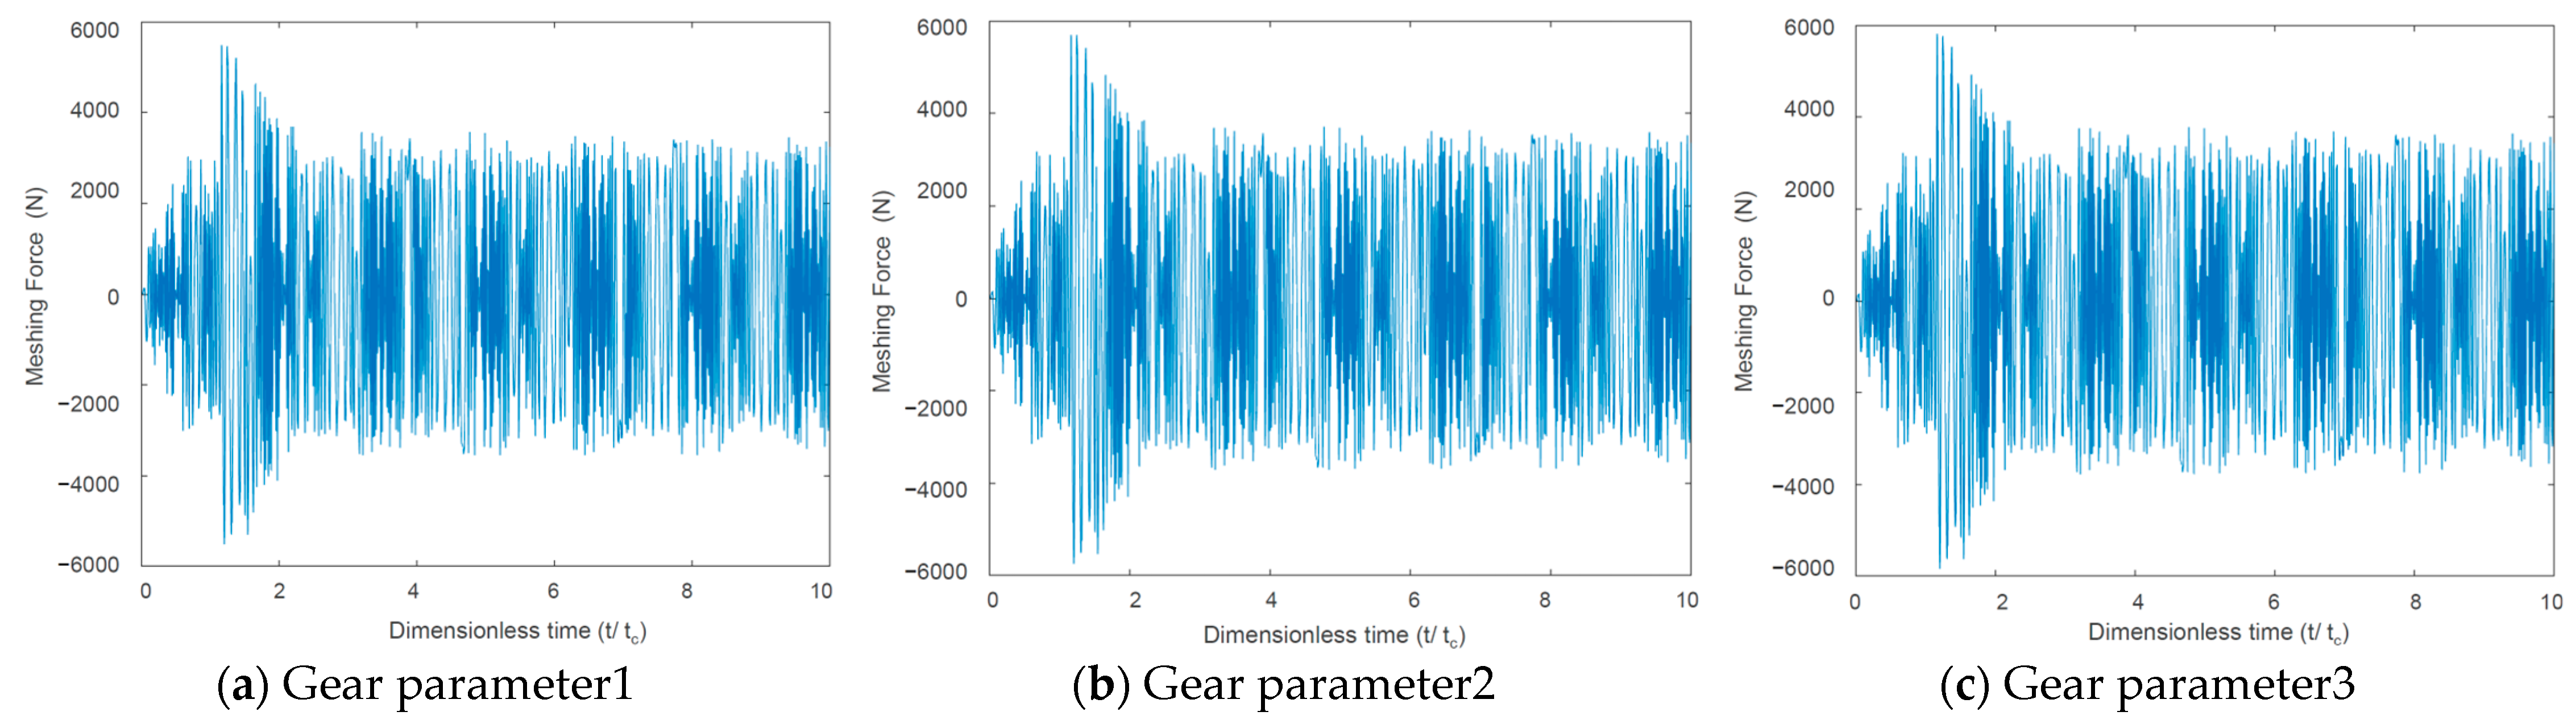
On the premise of satisfying the geometric constraints of the idler gear, we defined three sets of gear parameters for simulation analysis, namely plan1, plan2, and plan3. The gear parameters are shown in Table 2. The simulation results of meshing stiffness and meshing force are shown in Figure 6, Figure 7 and Figure 8 respectively.
Table 2.
Gear parameters of plan1, plan2, and plan3.
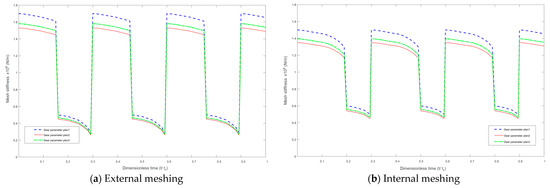
Figure 6.
Gear meshing stiffness.

Figure 7.
Idler gear–motor gear external meshing force.
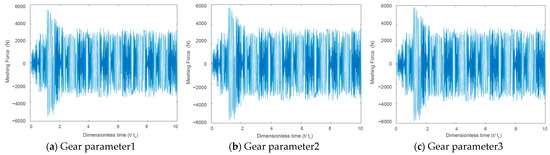
Figure 8.
Idler gear–gear ring internal meshing force.
3.2. Load-Sharing Performance
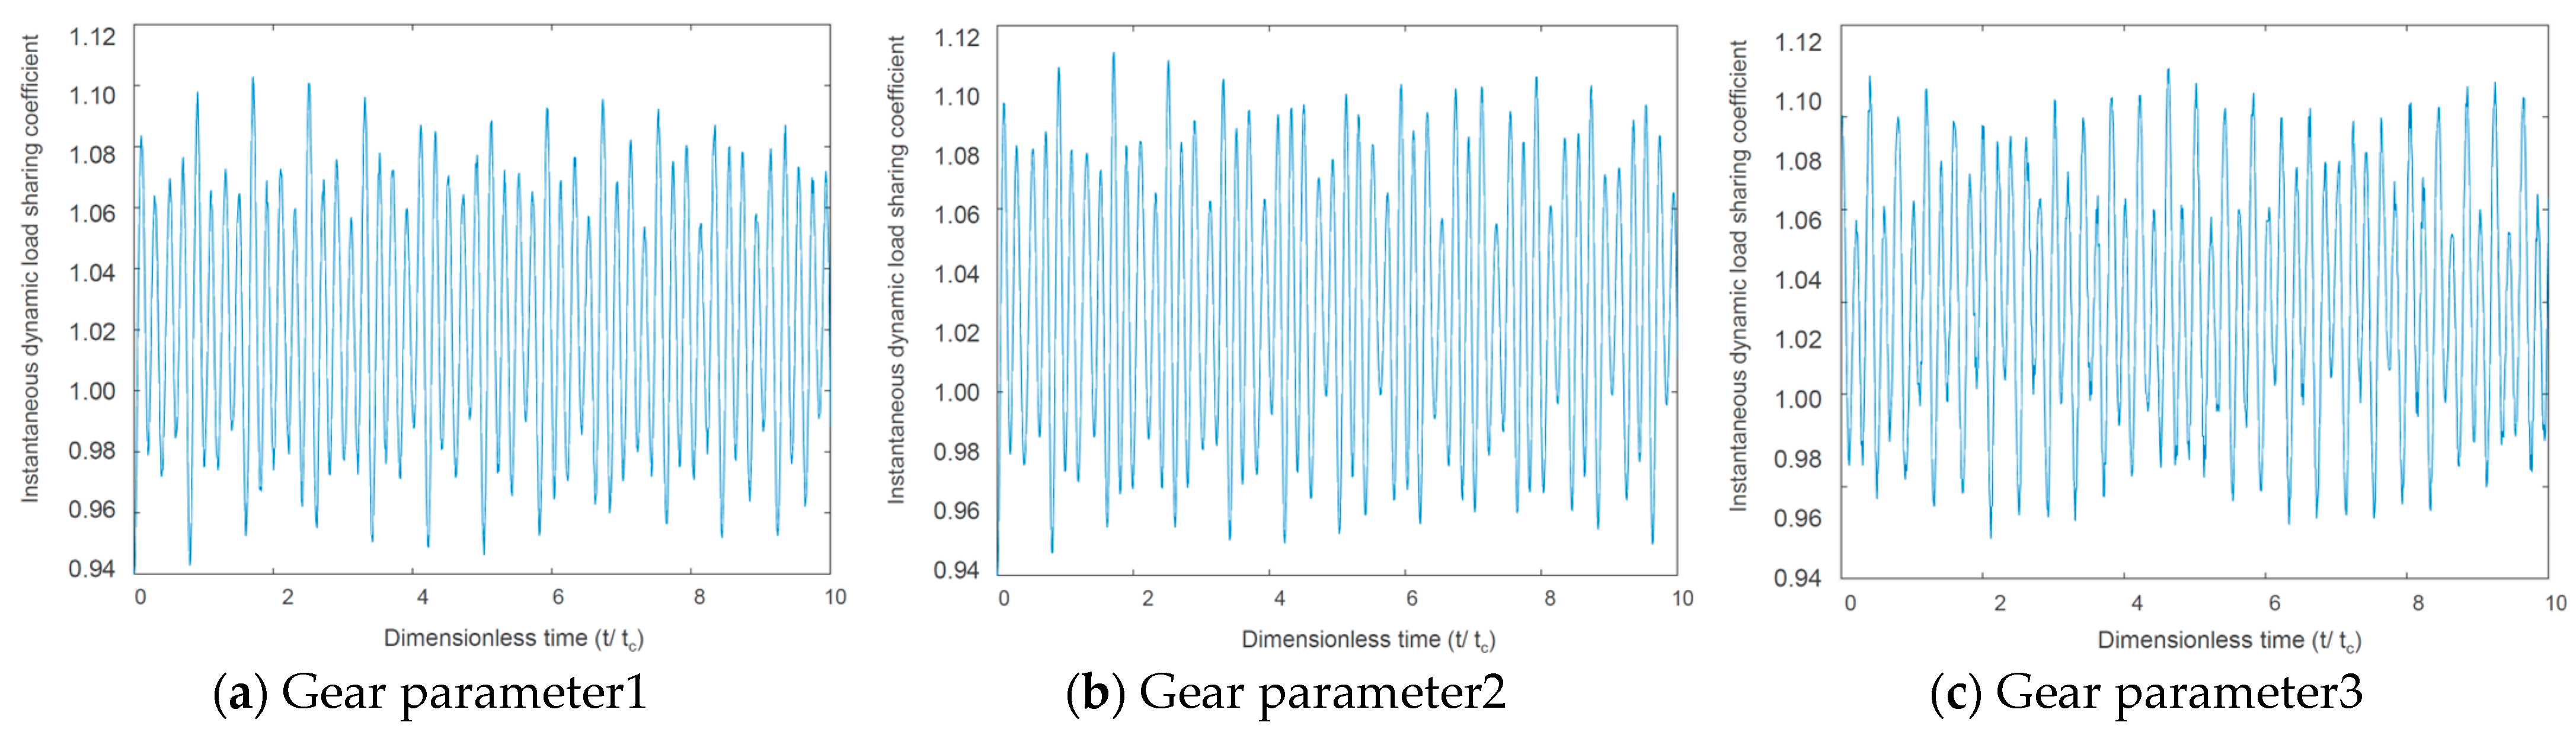
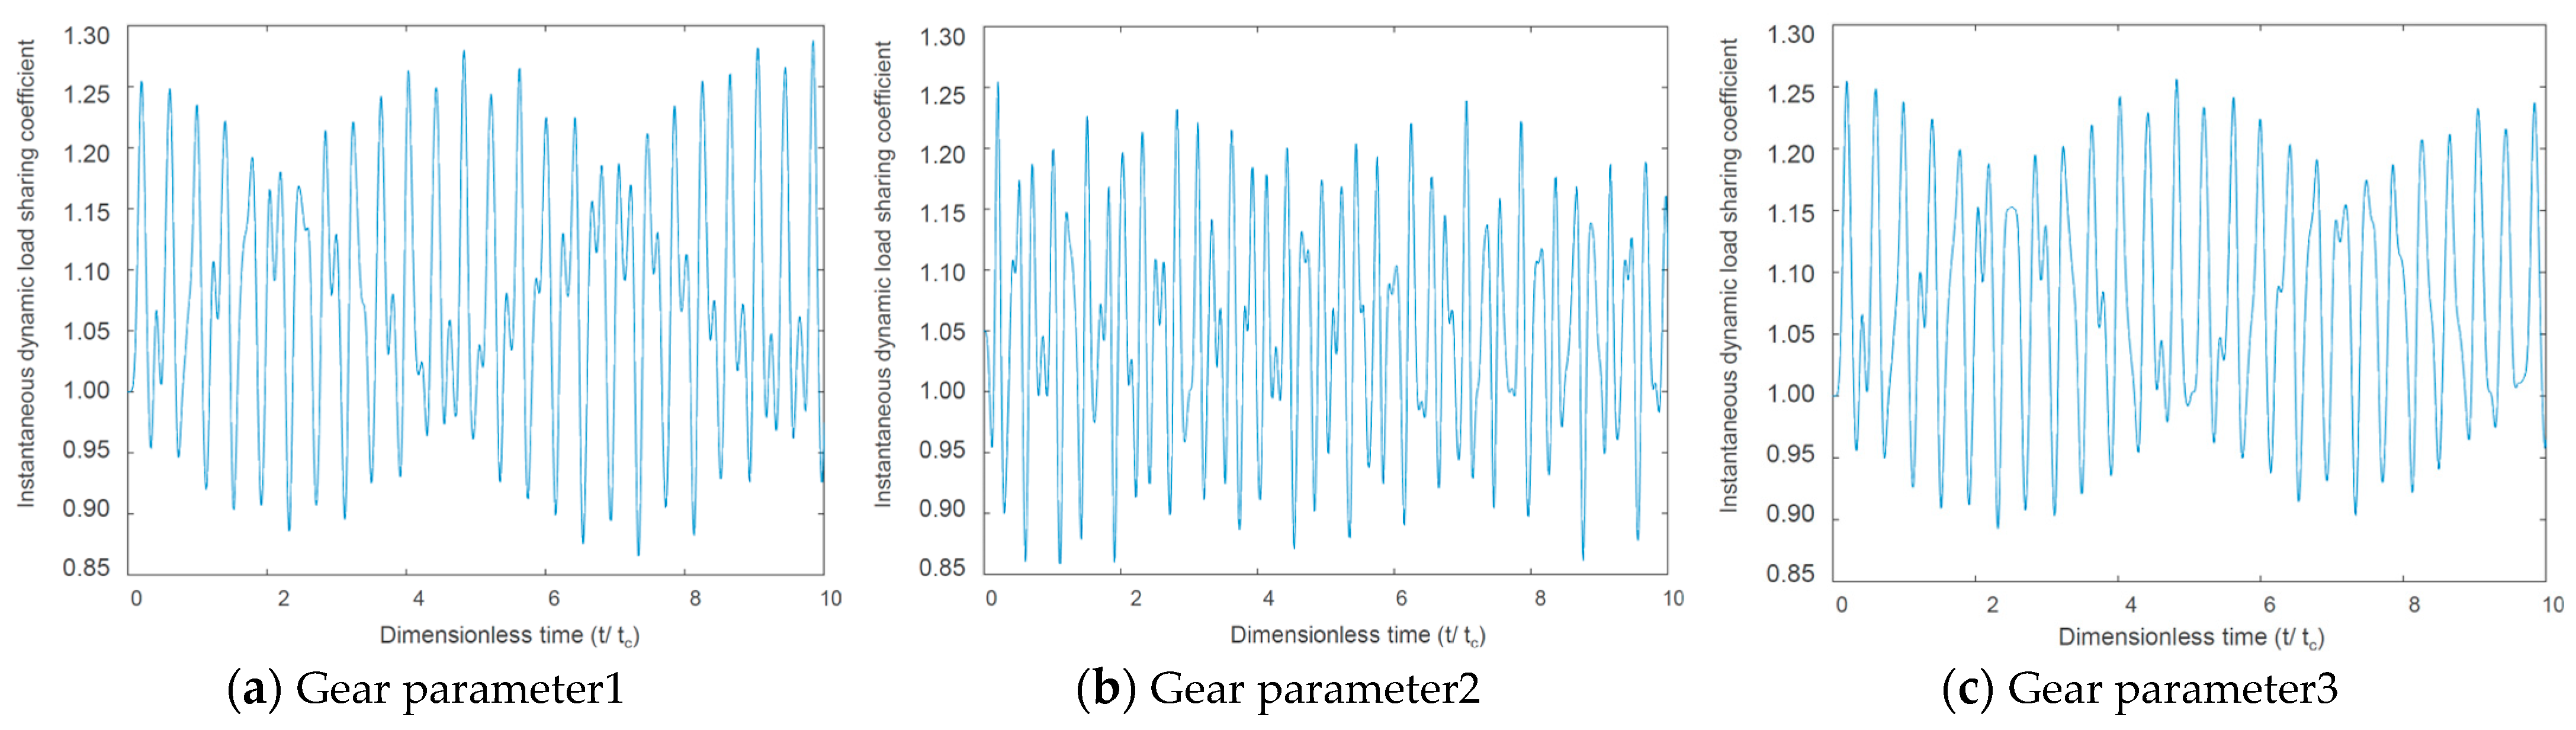
During the working process of the transmission system, the load distribution of gears is defined as the load sharing performance. The load-sharing coefficient is introduced to describe the load sharing characteristics. At a certain moment, the instantaneous dynamic load-sharing coefficient of the meshing gear pair refers to the ratio of the instantaneous dynamic meshing force to its mean [33], described as Equation (18):
In Equation (18), and are the instantaneous meshing forces between a certain idler gear and the motor gear/ring gear, respectively. Obviously, the instantaneous dynamic average load coefficient is a positive number fluctuating around 1. The closer its value is to 1, the smoother the fluctuation of dynamic meshing force is, which results in a better load-sharing performance of the transmission system.
The static load-sharing coefficient of the system is defined as the maximum fluctuation of the system dynamic load sharing coefficient in one operating cycle [34]. The external and internal meshing coefficient are, respectively, expressed in Equation (19):
The external and internal meshing force load-sharing characteristic simulations are shown in Figure 9 and Figure 10. According to the simulation results, we can see that under the premise of idler gear meshing, the smaller the gear modulus was, the better its load sharing characteristics were, and the smoother the power transmission was. However, an extremely small modulus will reduce the gear strength and is constrained by gear manufacturing process conditions. Therefore, when engineering design and development, it is necessary to find a balance.
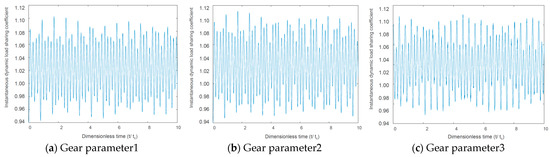
Figure 9.
Idler gear–motor gear external meshing force load-sharing characteristic.
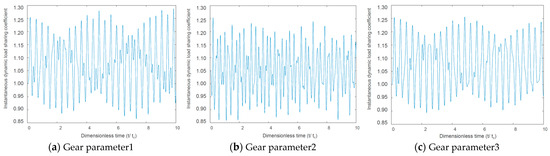
Figure 10.
Idler gear–gear ring internal meshing force load-sharing characteristic.
4. Vertical Characteristic Analysis
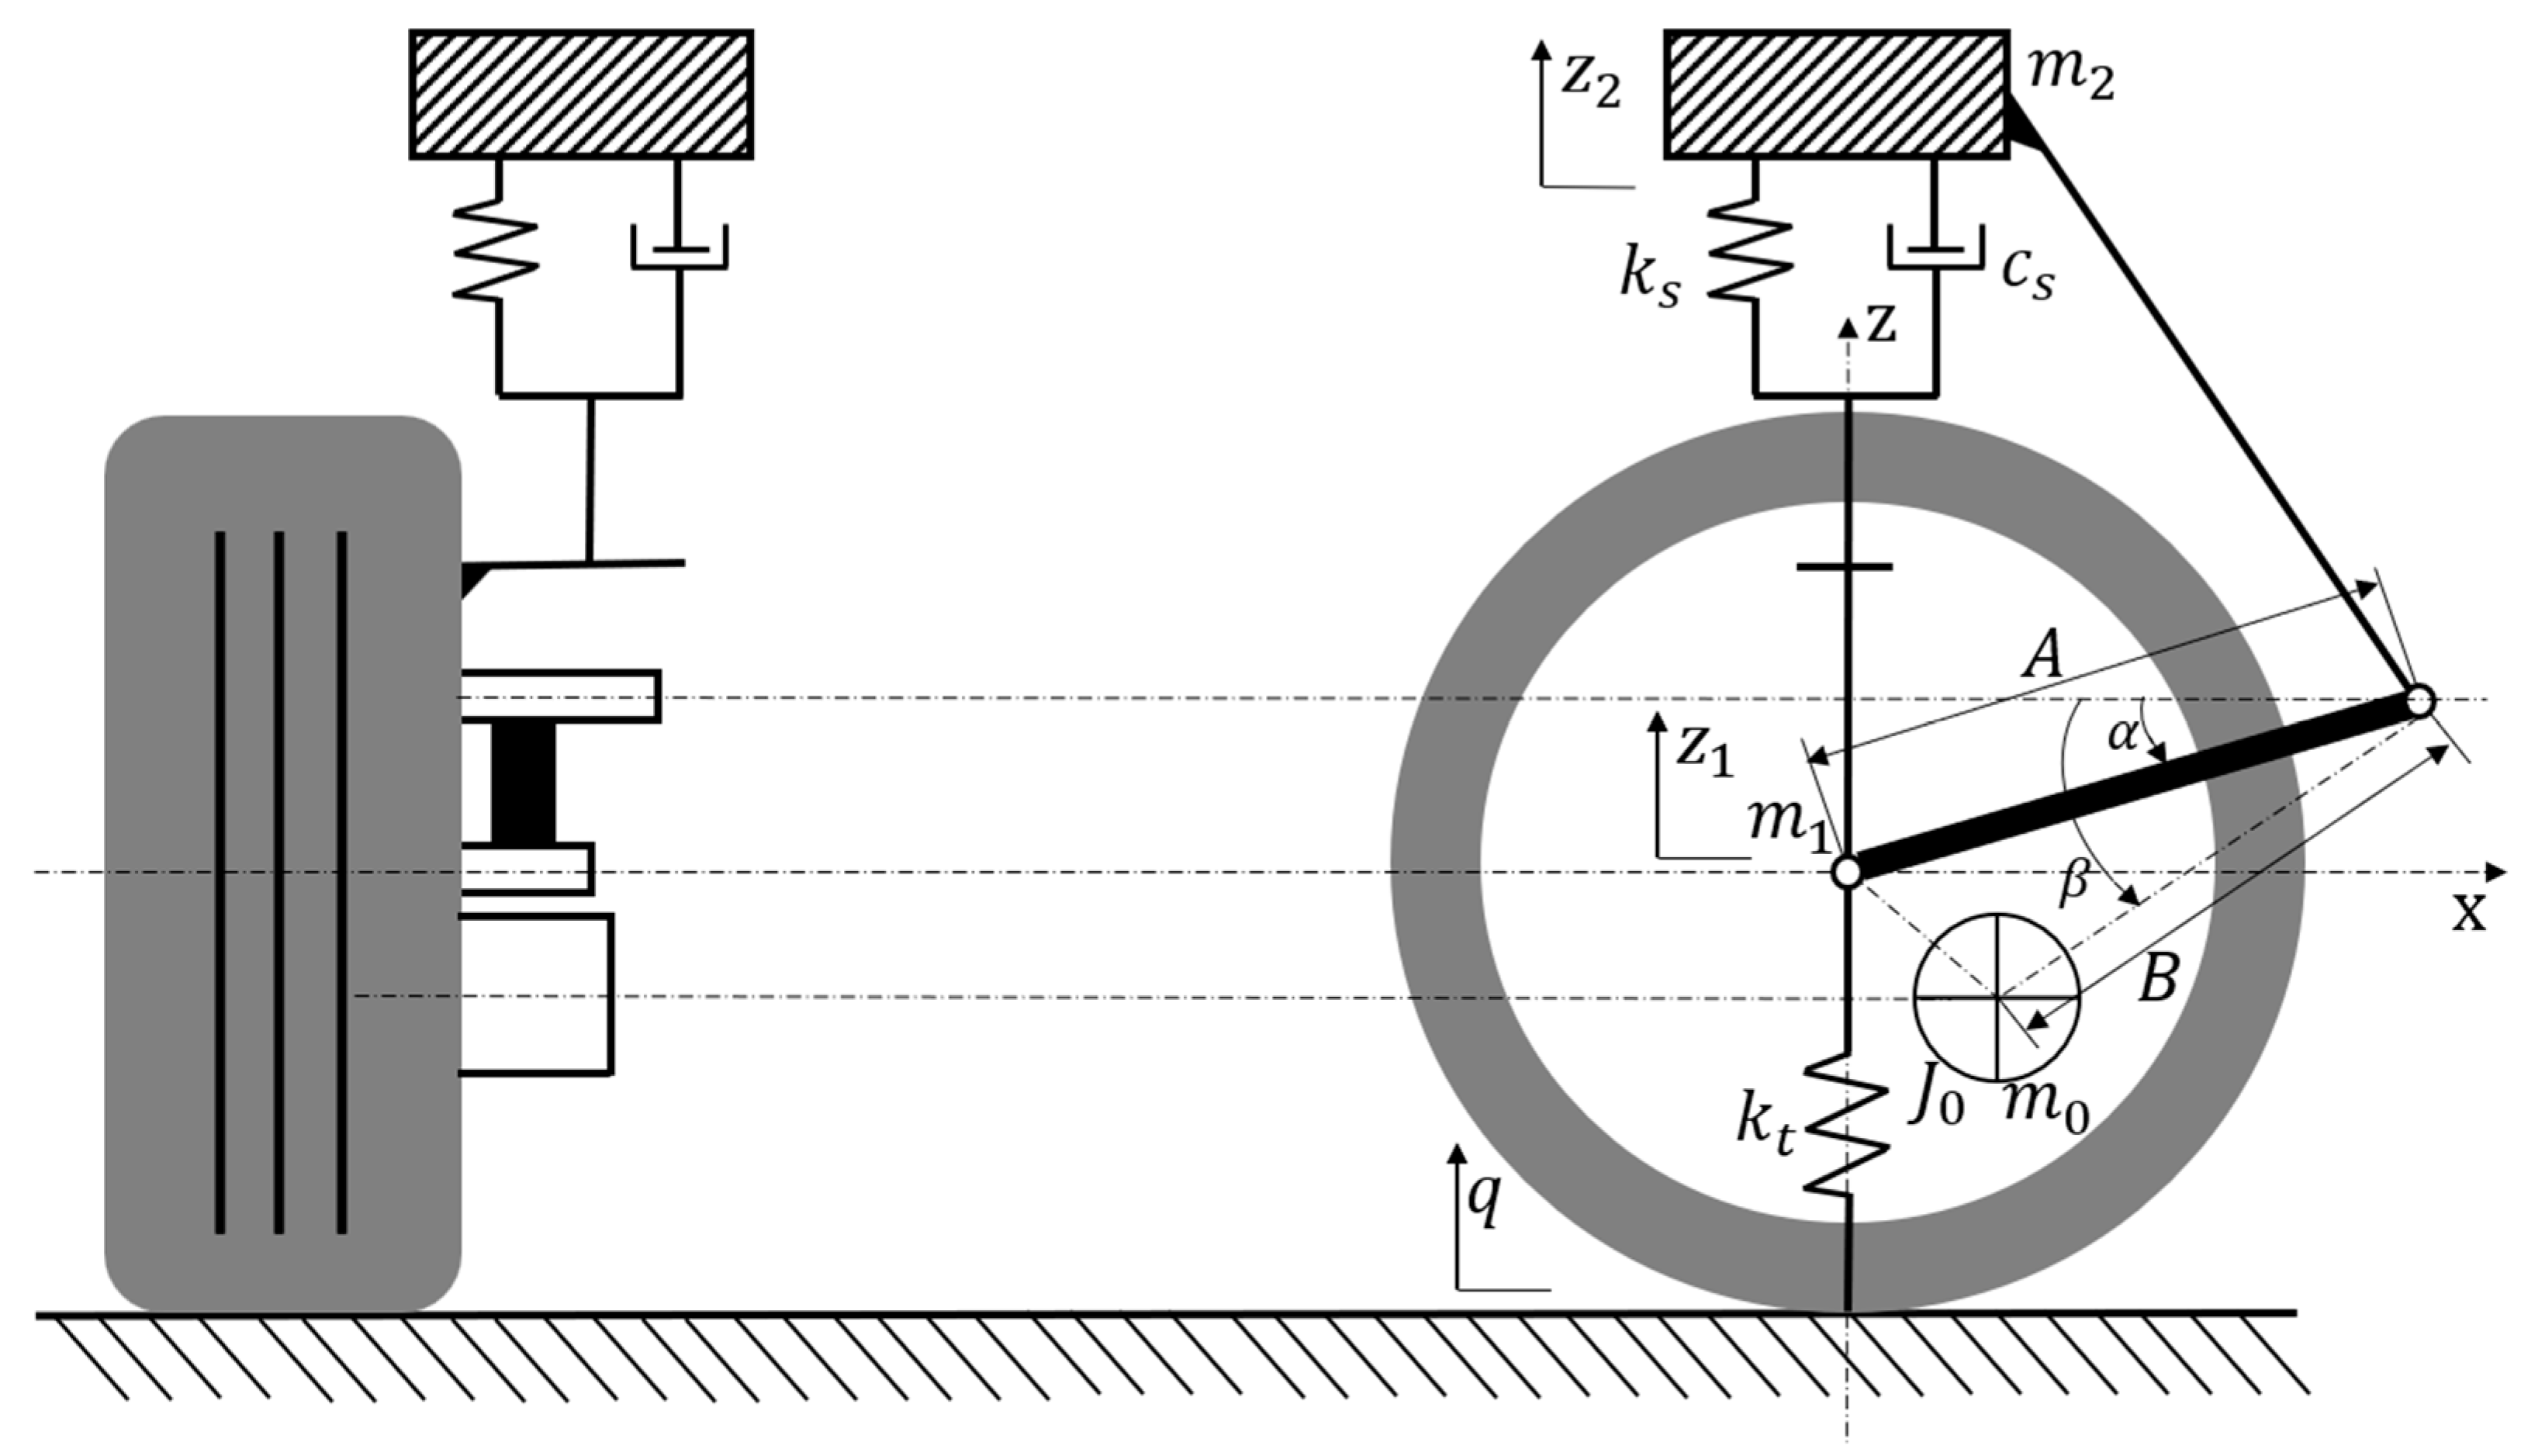
In vertical analysis, we assume that the vehicle is symmetrical along the longitudinal axis, the roughness functions of left and right road surfaces are the same, and the mass distribution coefficient of front and rear suspensions is 1. Then, the vehicle vibration model can be simplified as a 1/4 vehicle body vibration model of 2-DOF (degree of freedom) in the vertical direction [35]. The EDW model is shown in Figure 11. As the position of the motor is not concentric with the wheel, the position of the motor center of mass has a certain impact on the vertical performance. Relevant variables are introduced for modeling and analysis. Among them, is 1/4 of the body mass and only undergoes vertical vibration. is the mass of the wheel assembly, and is the mass of the motor assembly. The length of the swing arm from the wheel center to the suspension hinge point is , and the length of the swing arm from the motor center of mass to the suspension hinge point is . is the rotation angle of the swing arm relative to the horizontal line at the initial static equilibrium position, is the rotation angle of the motor center of mass relative to the horizontal line at the initial static equilibrium position, and is the moment of inertia of the motor passing through its own center of mass and parallel to the swing center axis of the swing arm. When the vehicle is driving, the swing arm bounces up and down around the hinge point; thus, the relative rotation angle is . The equivalent suspension stiffness is , the equivalent suspension damping coefficient is , and the wheel stiffness is .

Figure 11.
Vertical vibration modeling of the 2-DOF system.
4.1. Vertical Vibration Model
The swinging arm bounces up and down around the vehicle’s hinge point. The Lagrange equation is used to establish the differential equation for system motion.
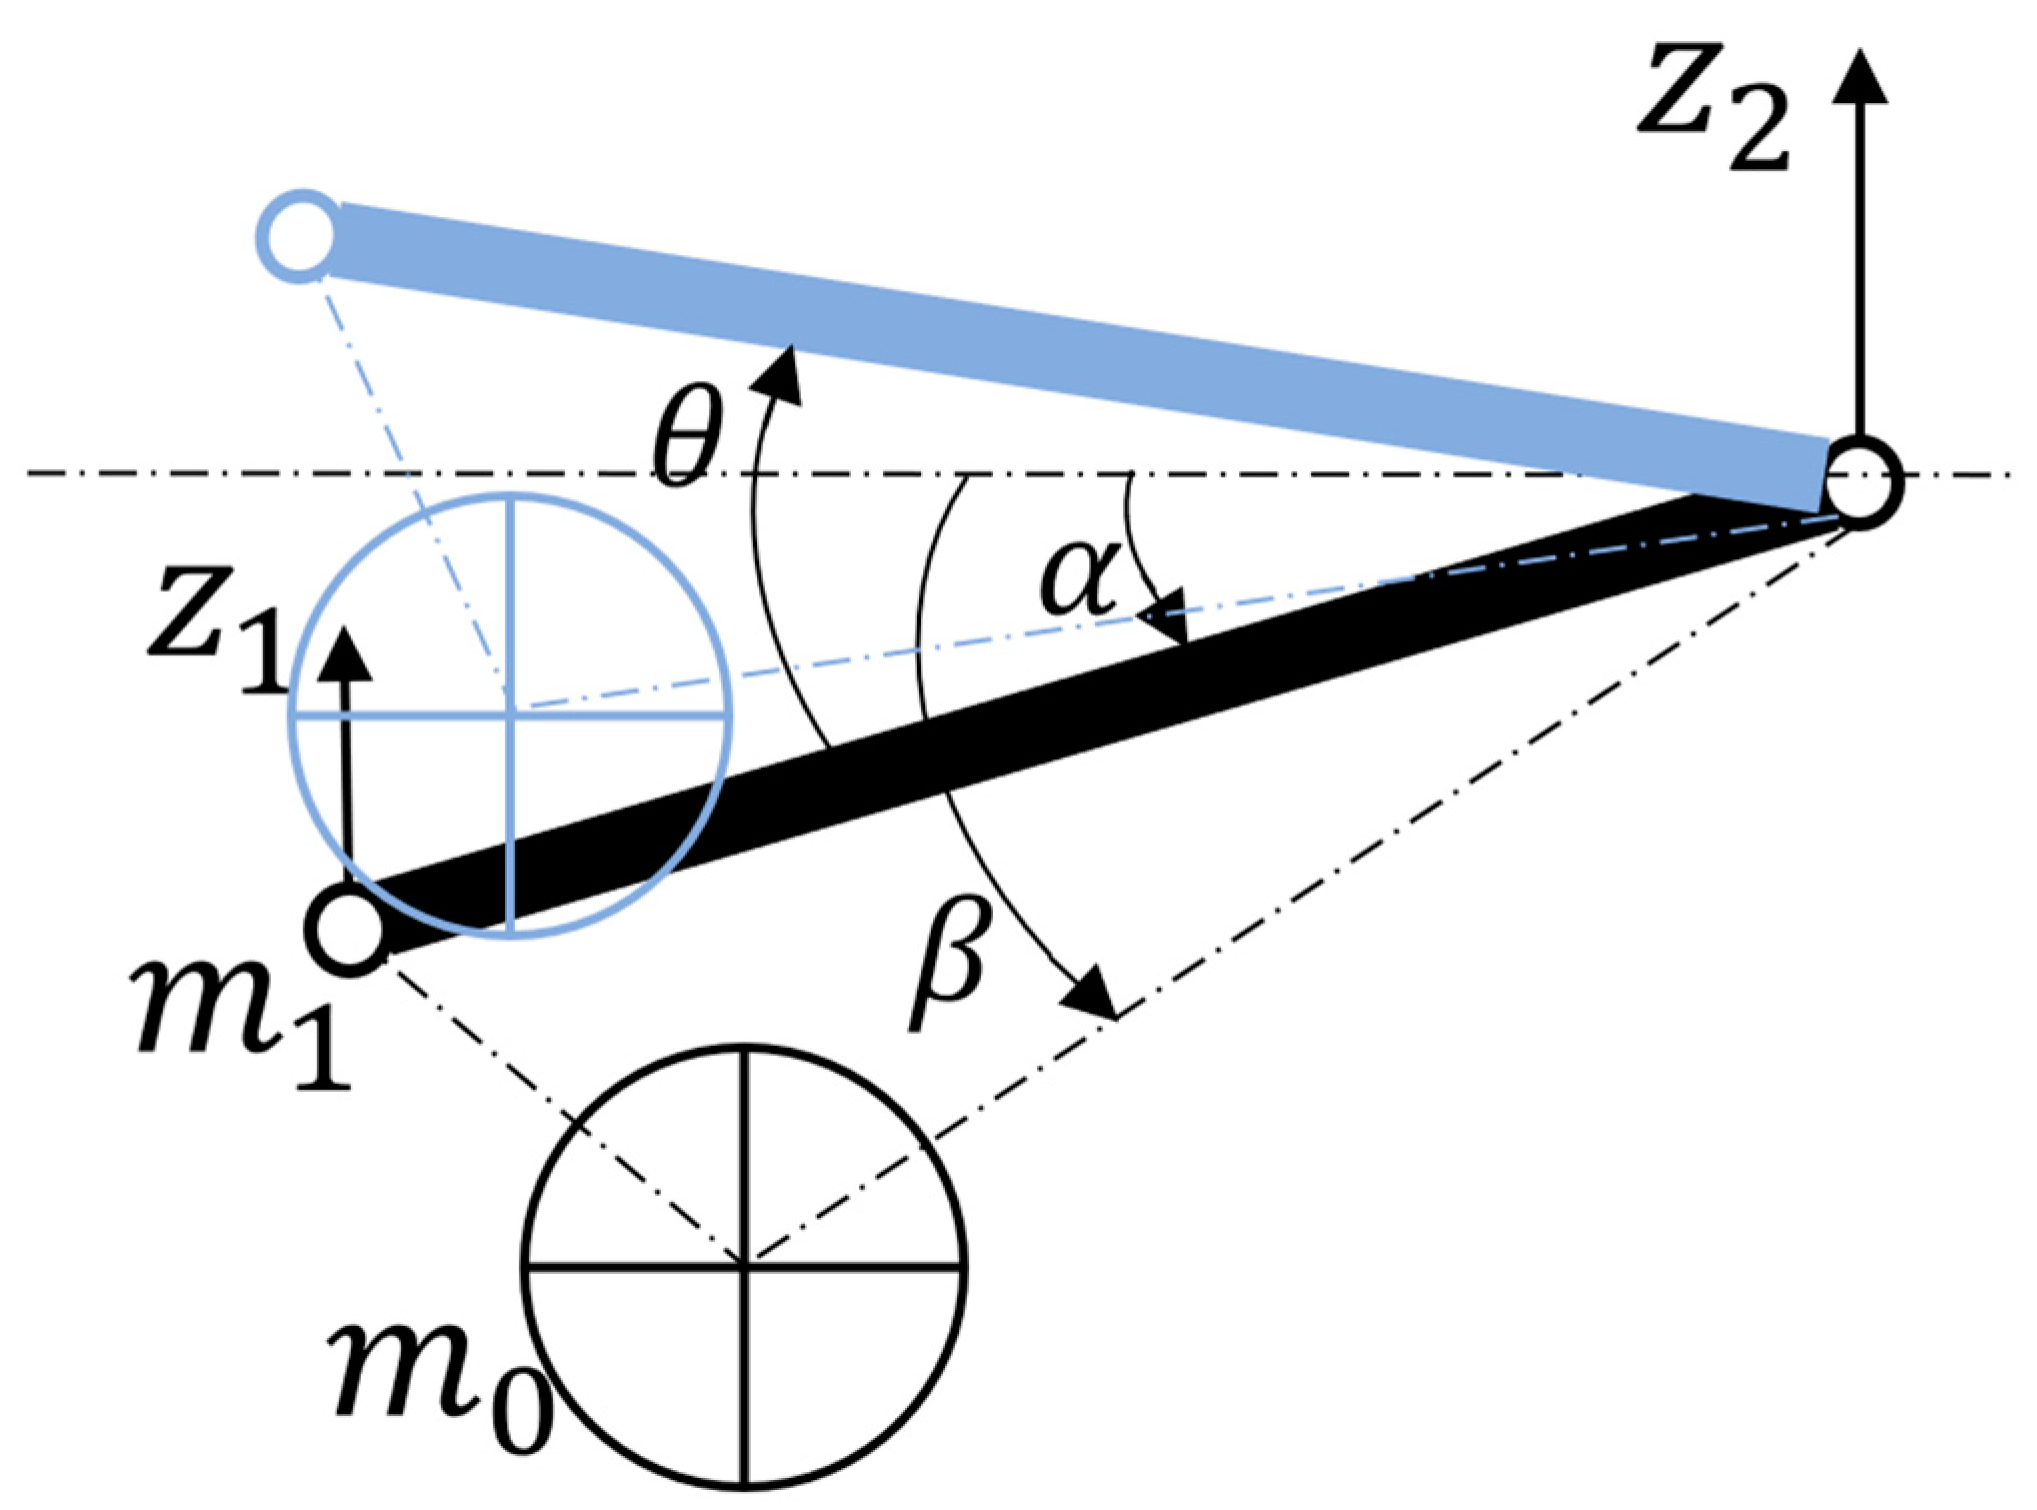
The dynamic analysis of the system reflects the state of the wheel bouncing up and down along the hinge point of the suspension arm, as shown in Figure 12. The system has two degrees of freedom. Take the and as the generalized coordinate. The expressions for the kinetic energy, potential energy, and dissipated energy of the entire system can be obtained [36].

Figure 12.
Generalized coordinate system.
Among them, is the absolute speed of the wheel, and is the absolute speed of the motor. Decompose and horizontally and vertically, respectively:
By substituting (20) and (21) into Equation (17), we can obtain
Assuming that the coordinates of the center of mass of motor relative to the center of wheel are (), the triangle corresponding to the length of has the following geometric relationship:
Assume two temporary generalized coordinates are and . Substituting Equations (22) and (23) into Equation (20) yields the mass matrix of generalized coordinates
Convert the above generalized coordinates and into generalized coordinates and . The relationship between , and and is as follows
Obtain the coordinate transformation matrix
By taking the second-order derivative, the relationship between two sets of generalized coordinate accelerations can be obtained in Equations (31) and (32).
Therefore, the mass matrix under generalized coordinates and is
Still taking and as generalized coordinates, the stiffness matrix and damping matrix of the system can be obtained by substituting Equations (22) and (23) into (20), respectively
The generalized force of the system is the road surface excitation, and the vertical input through the wheels can be expressed as (36)
Therefore, the differential equation of the system is
Perform Laplace transform on Equation (37) and substitute to obtain the transfer function of input displacement and output displacement
The amplitude frequency characteristics of vehicle acceleration on road input :
The amplitude frequency characteristics of the road surface under the relative dynamic load of the wheels on road input :
From this, the amplitude frequency characteristics of the vehicle acceleration and relative dynamic load of the wheels can be obtained when the motor is arranged at different positions of the wheel.
4.2. Dynamic Analysis
Based on the discussed vertical model of the system, a dynamic simulation was performed to study the influence of motor position on performance indicators. We assumed the road model as filtered white noise and a vehicle speed of 10 and simulated on a C-level road surface. We took , , and we set the upper limit of the integration frequency to 1000 Hz. The expression for calculating the power spectral density of the road surface was [37]:
The position parameter of the motor was the swing arm length from the motor center of mass to the suspension hinge point, with a variation range of 0~1 m. The angle of the motor center of mass relative to the horizontal line at the initial static equilibrium position varied from −90° to 90°. The reason we set such a wide range was to theoretically analyze the impact of motor position as broadly as possible. However, it was impossible to fully cover the theoretical scope during engineering design. The installation process and motion interference of the actual situation must be considered. Simulation parameters of the system are shown in Table 3.
Table 3.
Simulation parameters of EDW vertical performance.
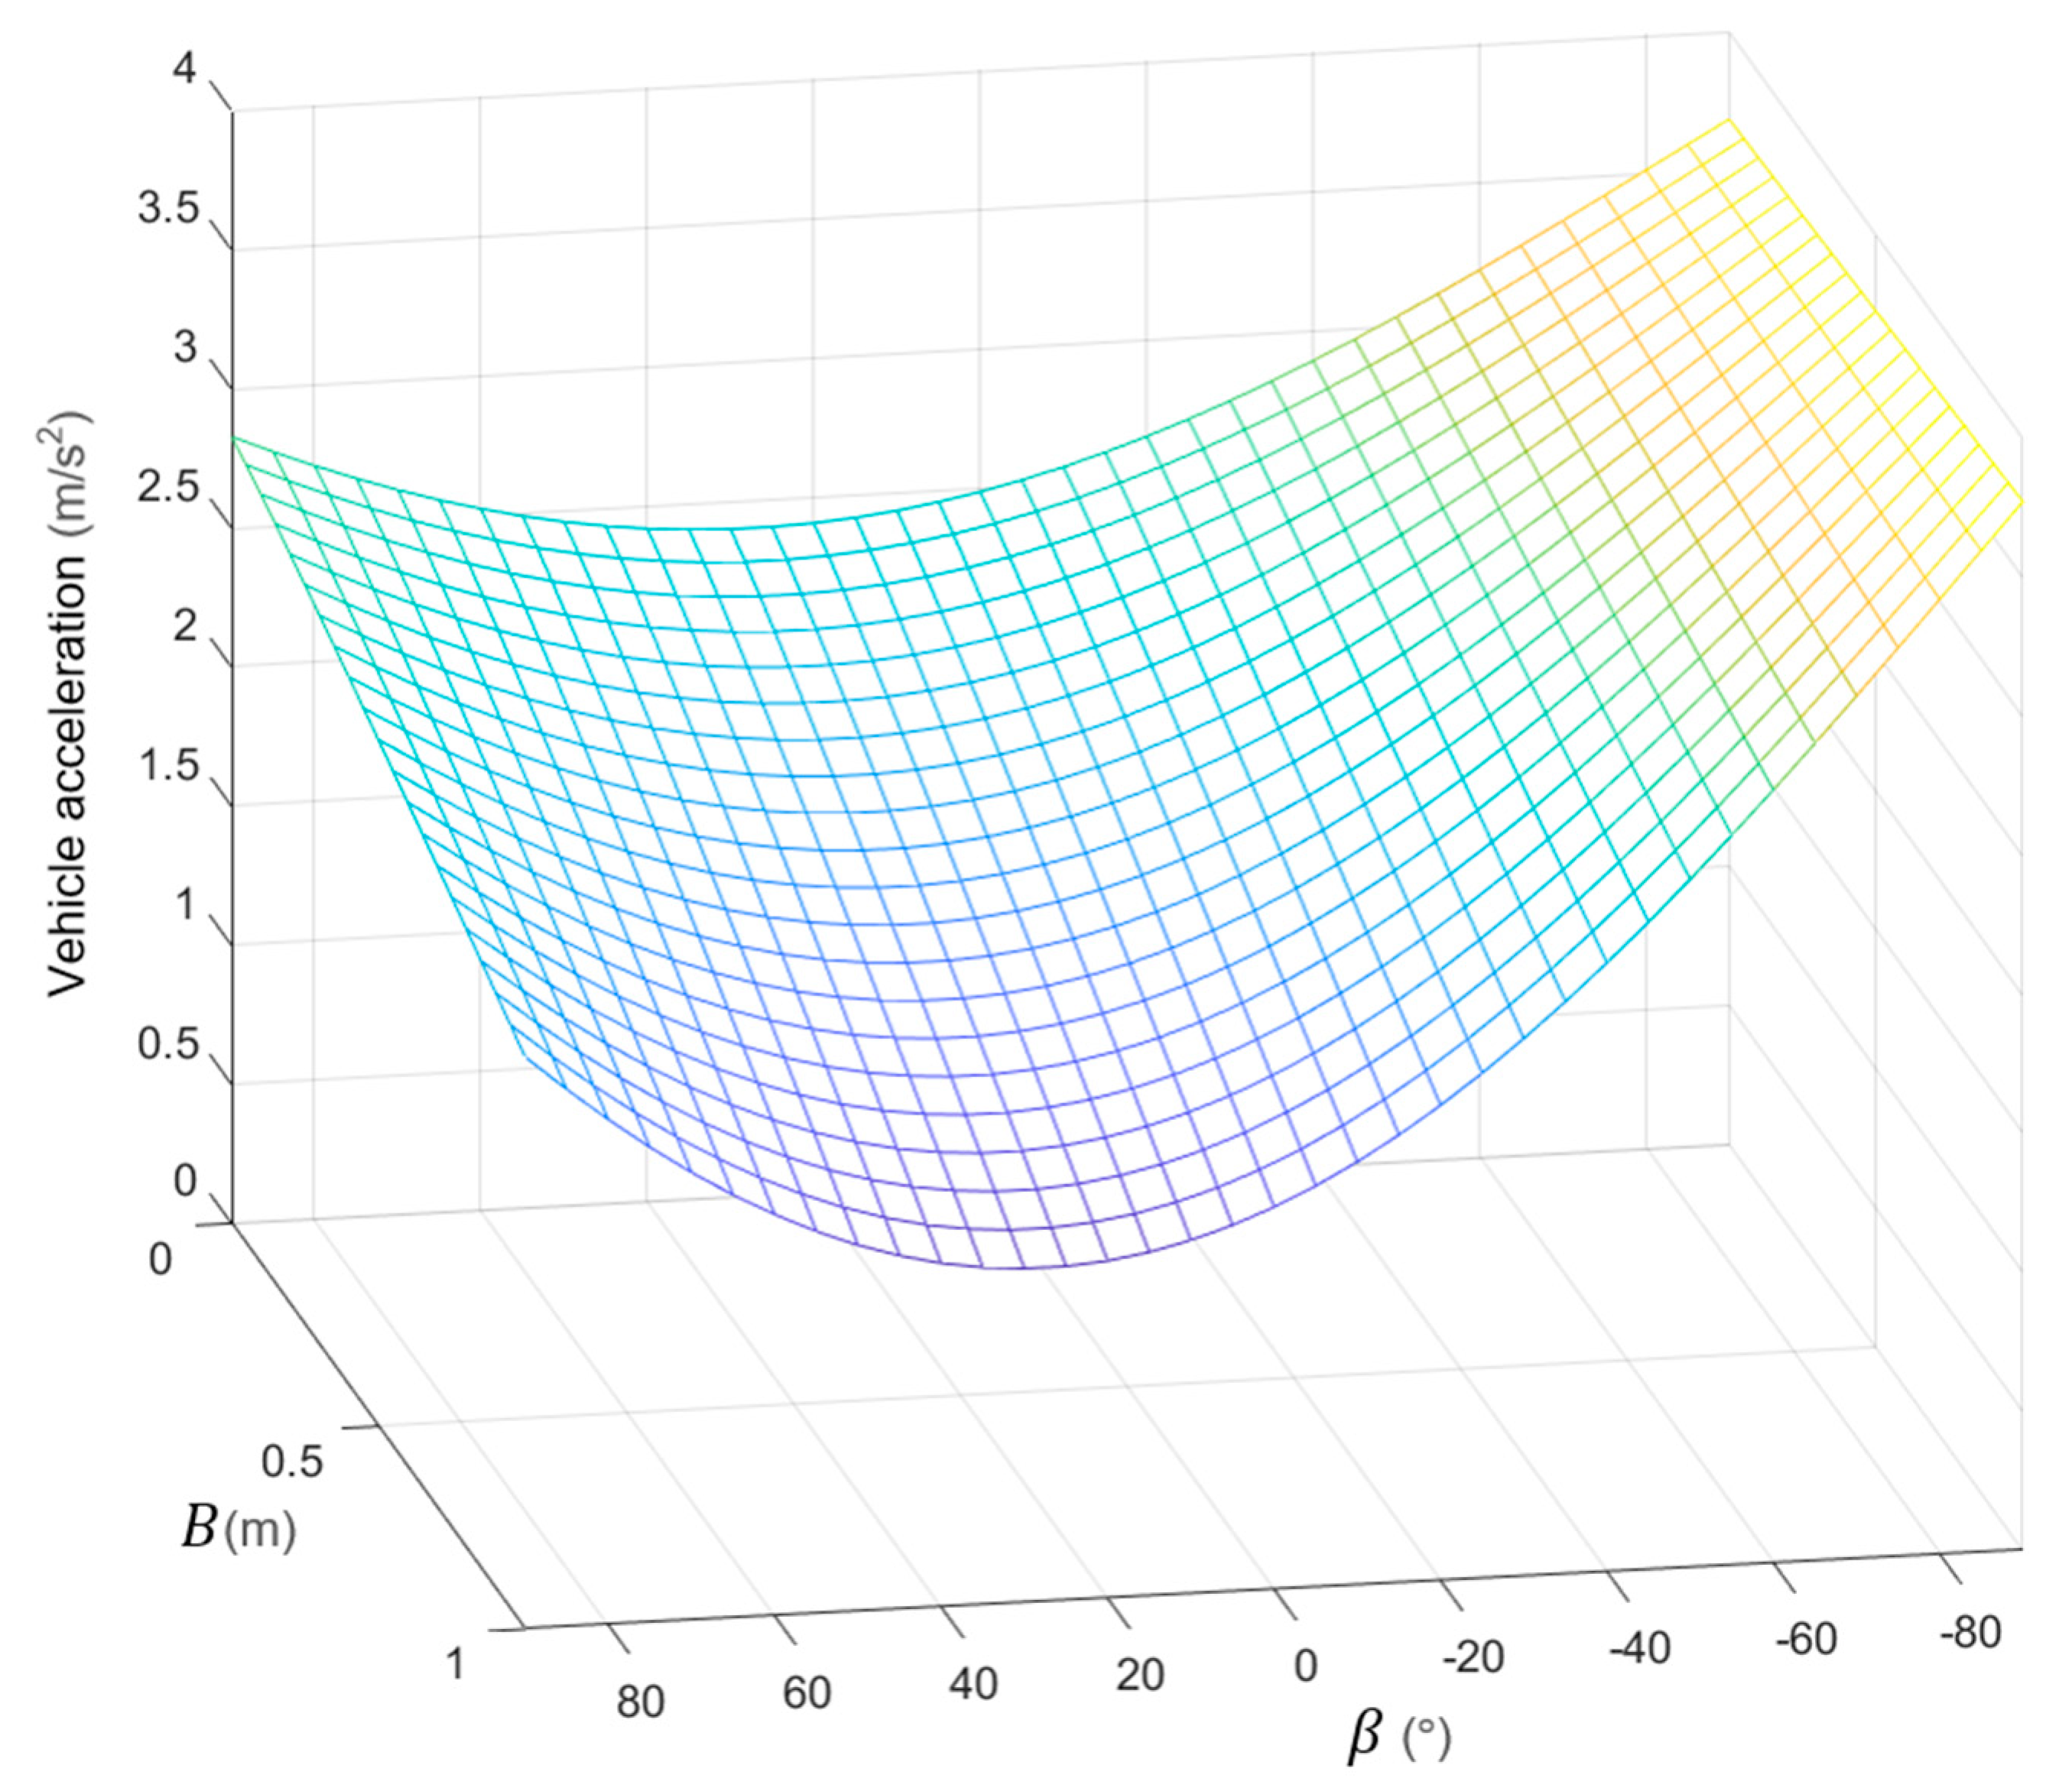
Figure 13 shows the acceleration of the vehicle body. We can see that the motor swing arm exhibited a monotonic positive correlation with the acceleration of the vehicle body. At the same time, the motor angle had a non-monotonic effect, and achieved a minimum value at the position approaching the angle.
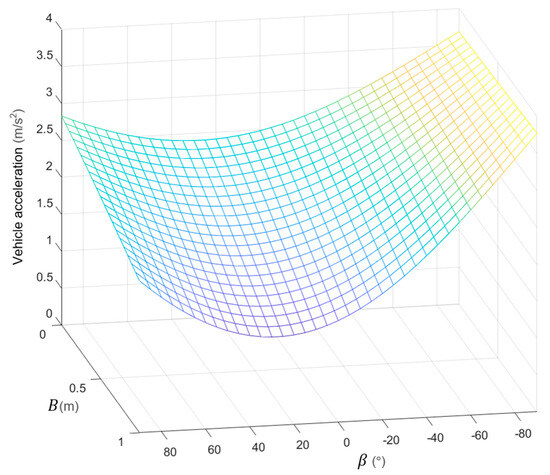
Figure 13.
Vehicle body acceleration.
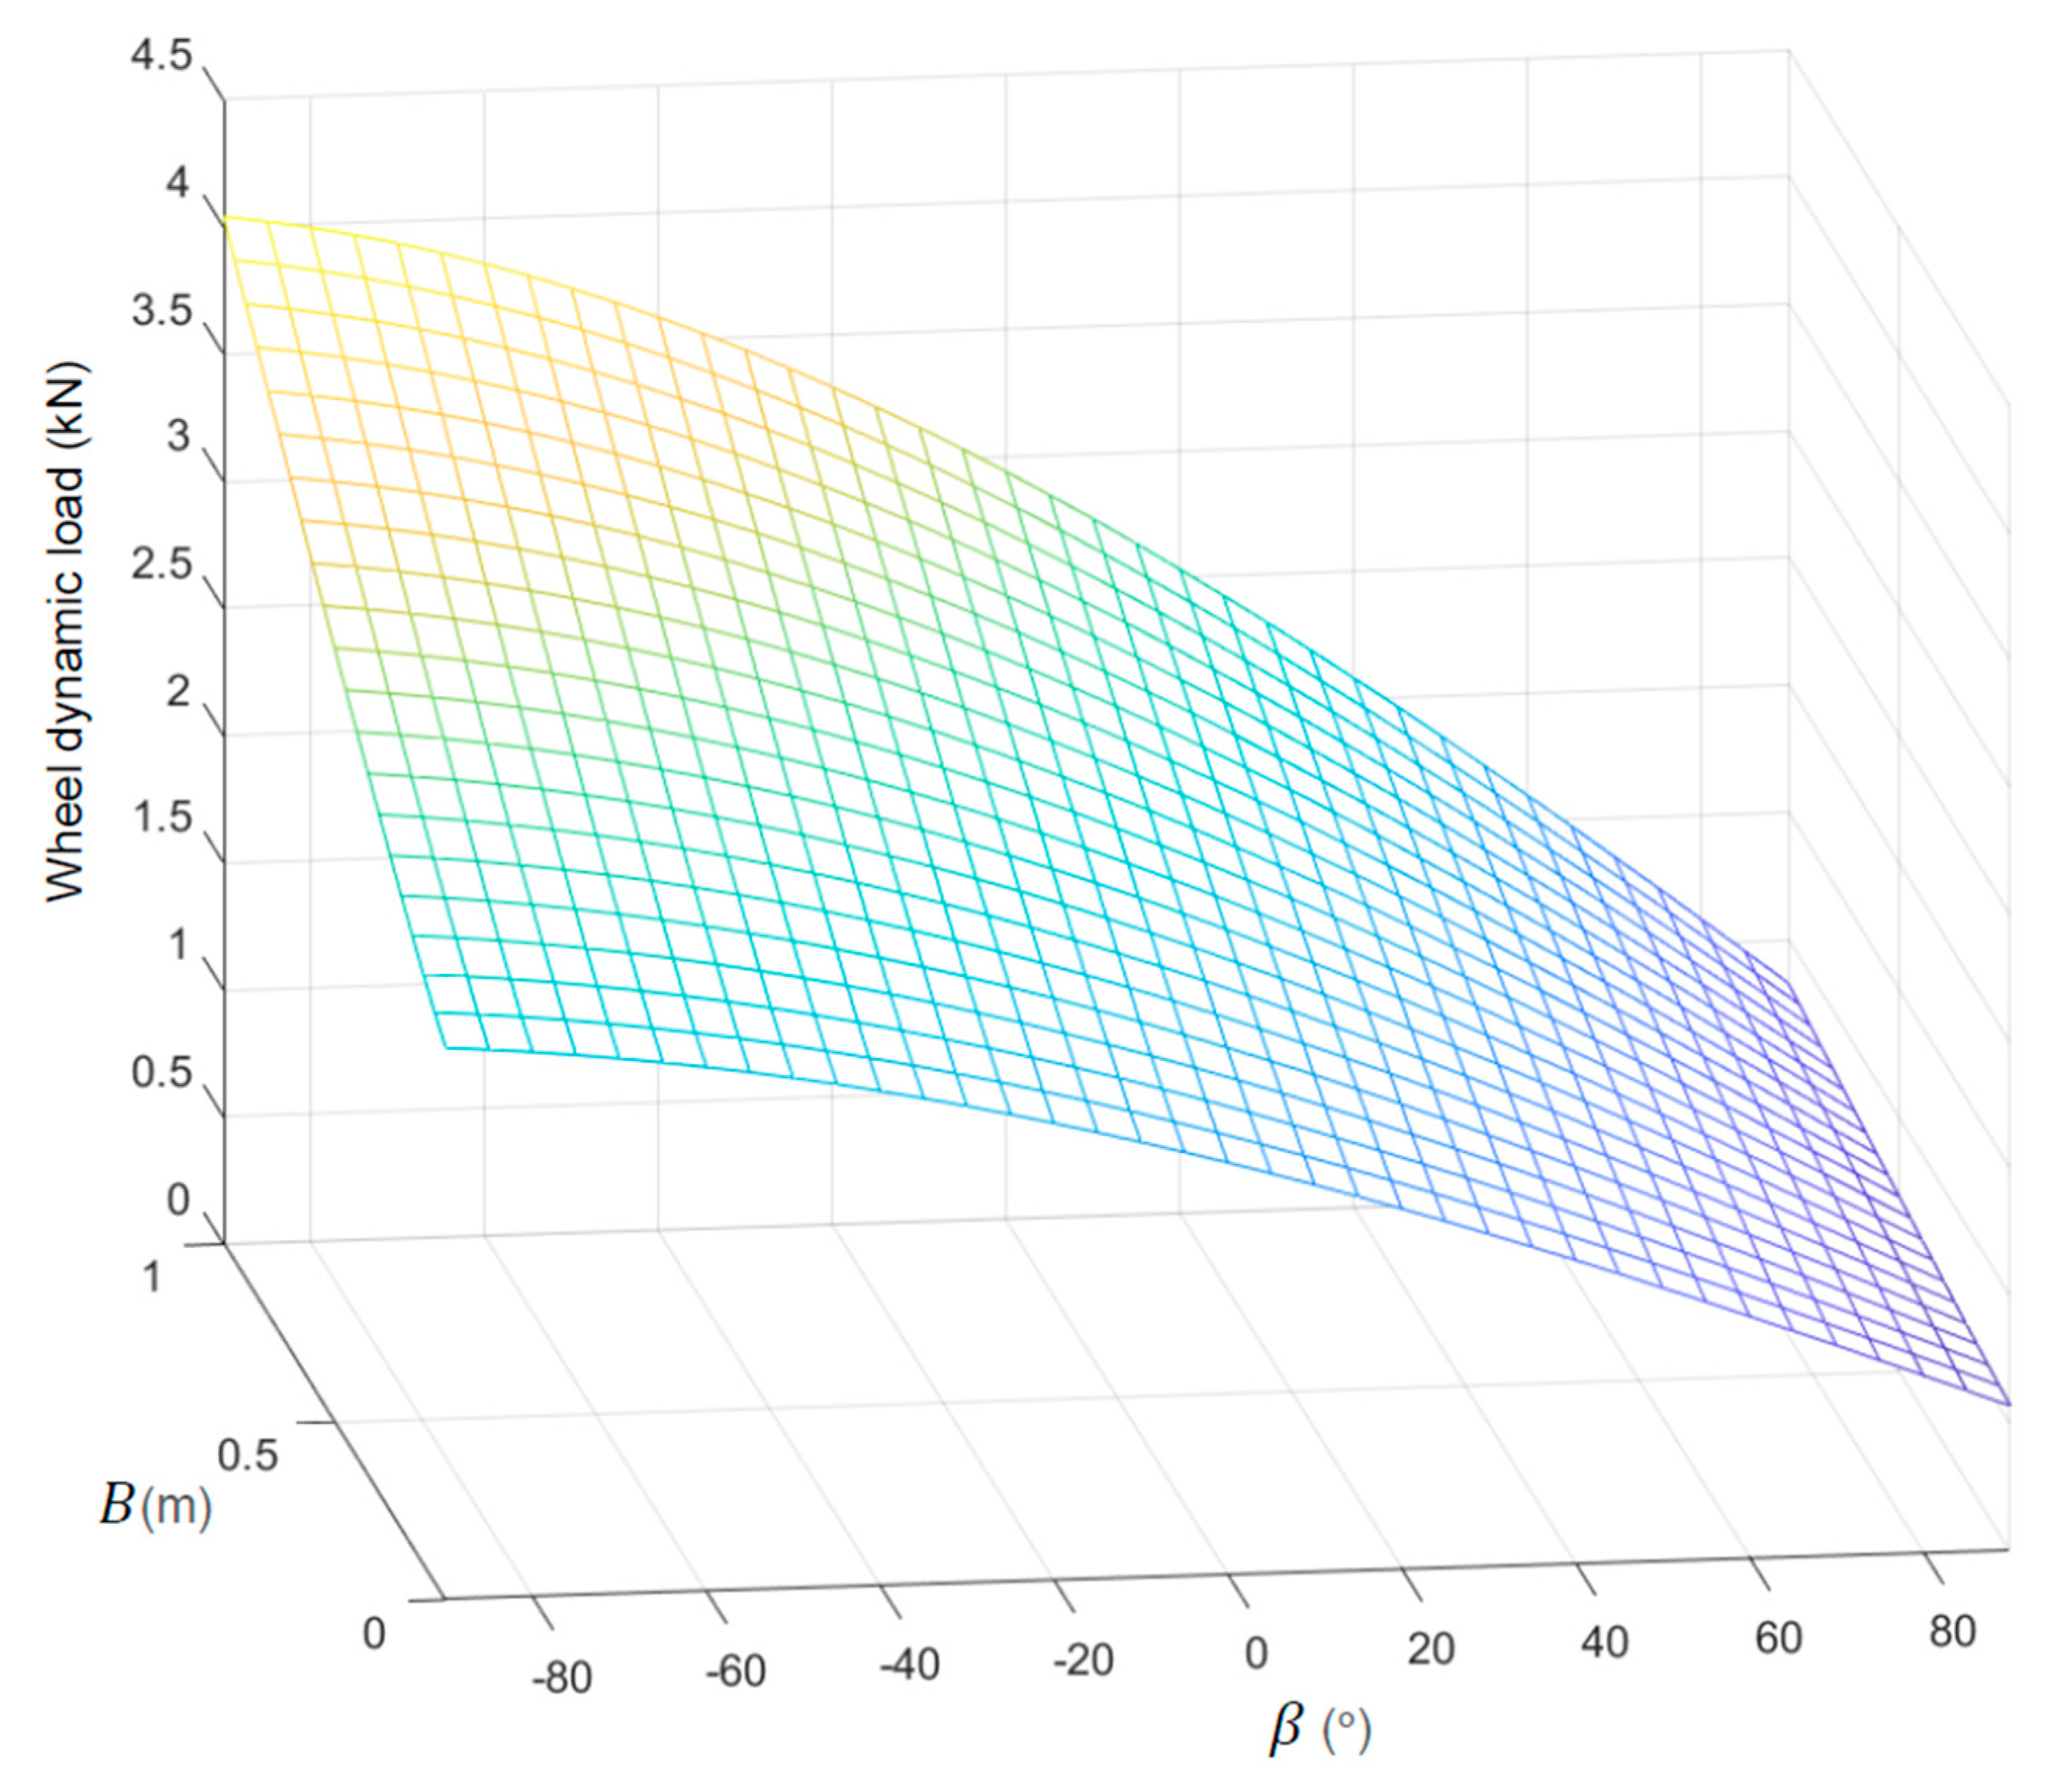
Figure 14 shows the dynamic load on the wheels. We can see that both the motor swing arm and the motor angle exhibited a monotonic positive correlation with the variation of vehicle acceleration. In engineering design, for the smallest possible wheel dynamic load, motor swing arm should be shortened, and motor angle should be increased as much as possible under the premise of actual conditions.
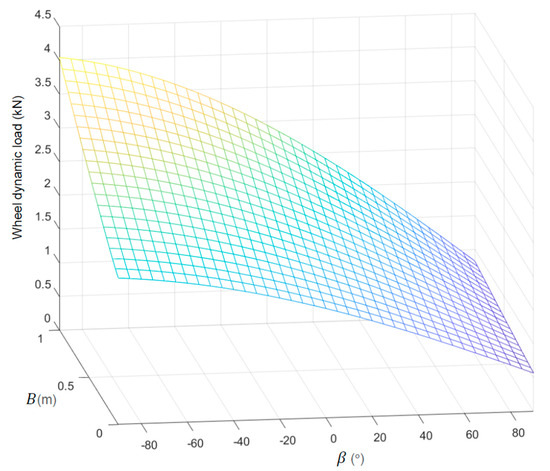
Figure 14.
Wheel dynamic load.
4.3. Parameter Optimization
Based on the vertical characteristics of the system, the EDW parameters could be optimized. Due to the priority of motor selection and transmission mechanism, their basic requirements must be met. On this basis, further optimization could be made for the suspension K&C values.
The basic parameter definitions of electric wheels are shown in Table 3. On this basis, we defined the motor swing arm , and the motor angle . Instead, we used the suspension stiffness and damping coefficient as design variables. The objective function was the root mean square value of vehicle acceleration and the RMS (root mean square) of wheel dynamic load, which were calculated by Equations (42) and (43), respectively [18].
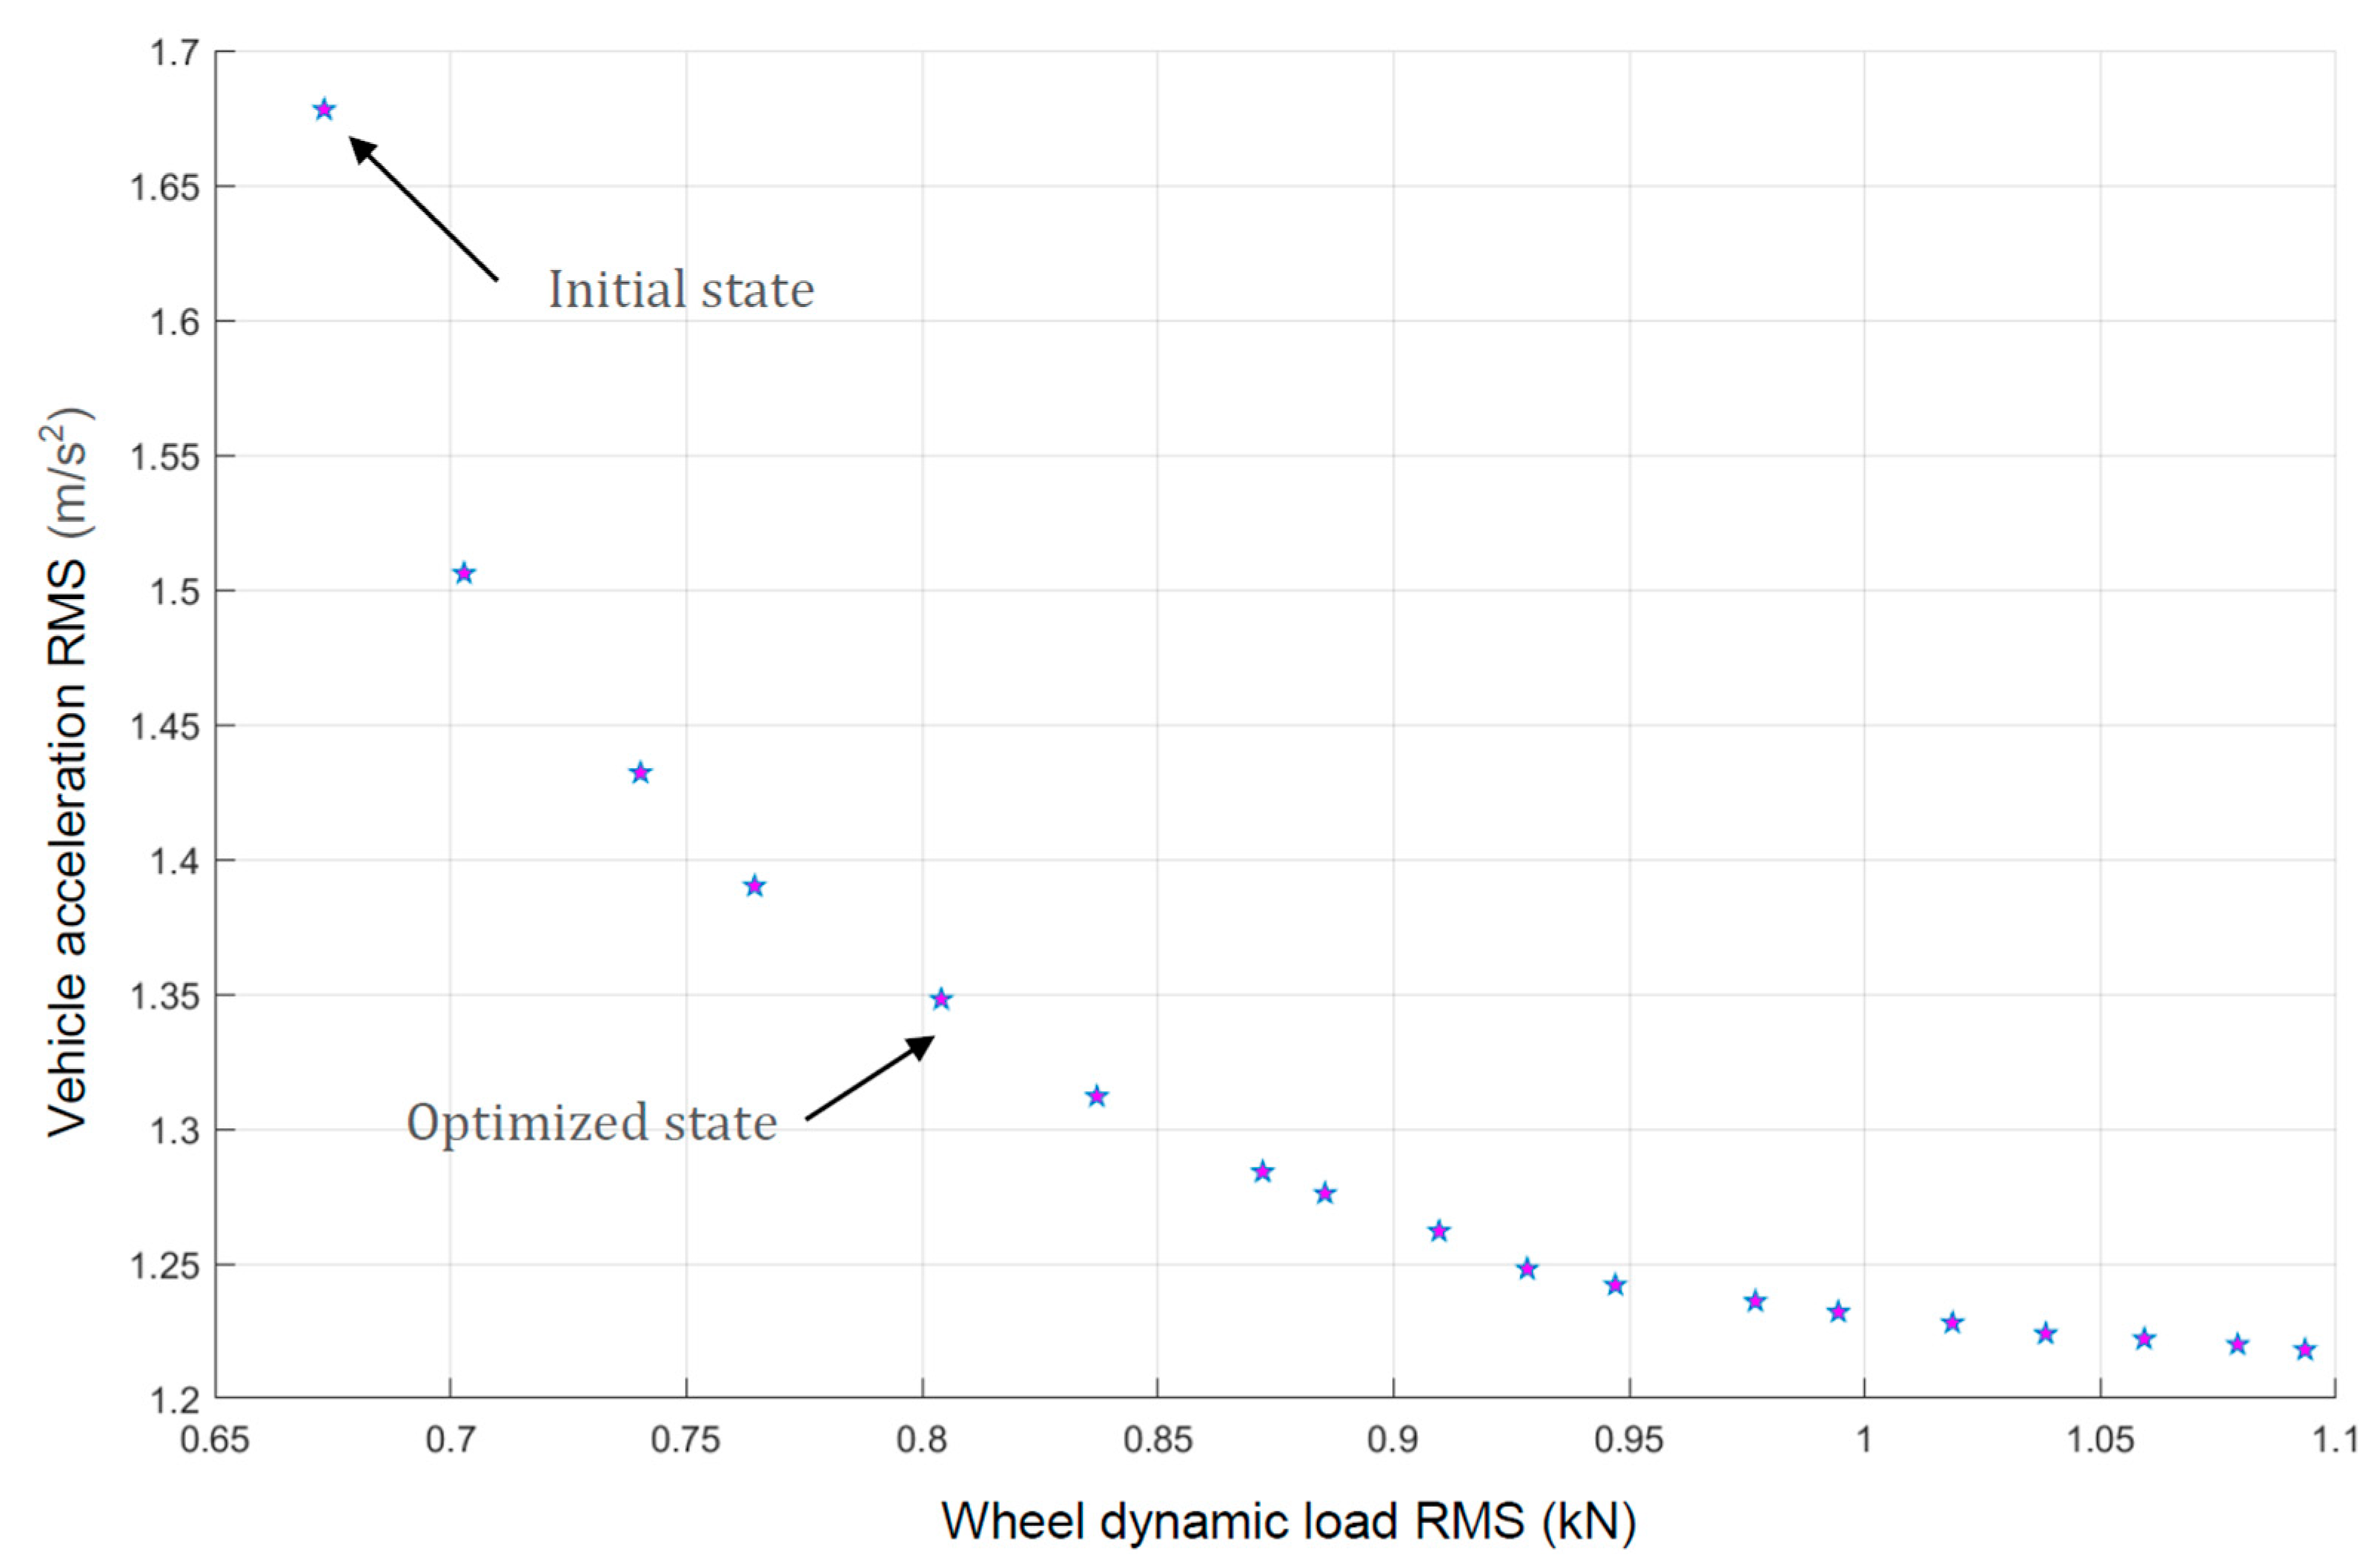
Because the two objective functions could not simultaneously obtain the minimum value, the genetic algorithm was used for multi-objective optimization. After repeated iterations, a set of Pareto frontiers was obtained. In this case, we took an optimized state to balance the indicators of vehicle body acceleration and wheel dynamic load, as shown in Figure 15.
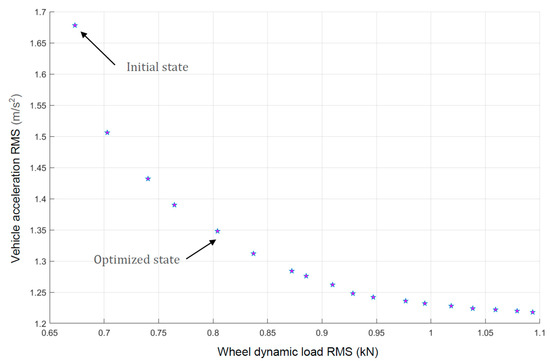
Figure 15.
Pareto front.
The comparison between the preferred solution and the initial state of this case is shown in Table 4. We can see that the initial acceleration of the vehicle body was relatively high, while the optimized state considered both the vehicle body acceleration and the wheel dynamic load, resulting in a more balanced overall performance that could adapt to the needs of more working conditions.
Table 4.
Comparison list of initial and optimized status.
4.4. Simulation Analysis
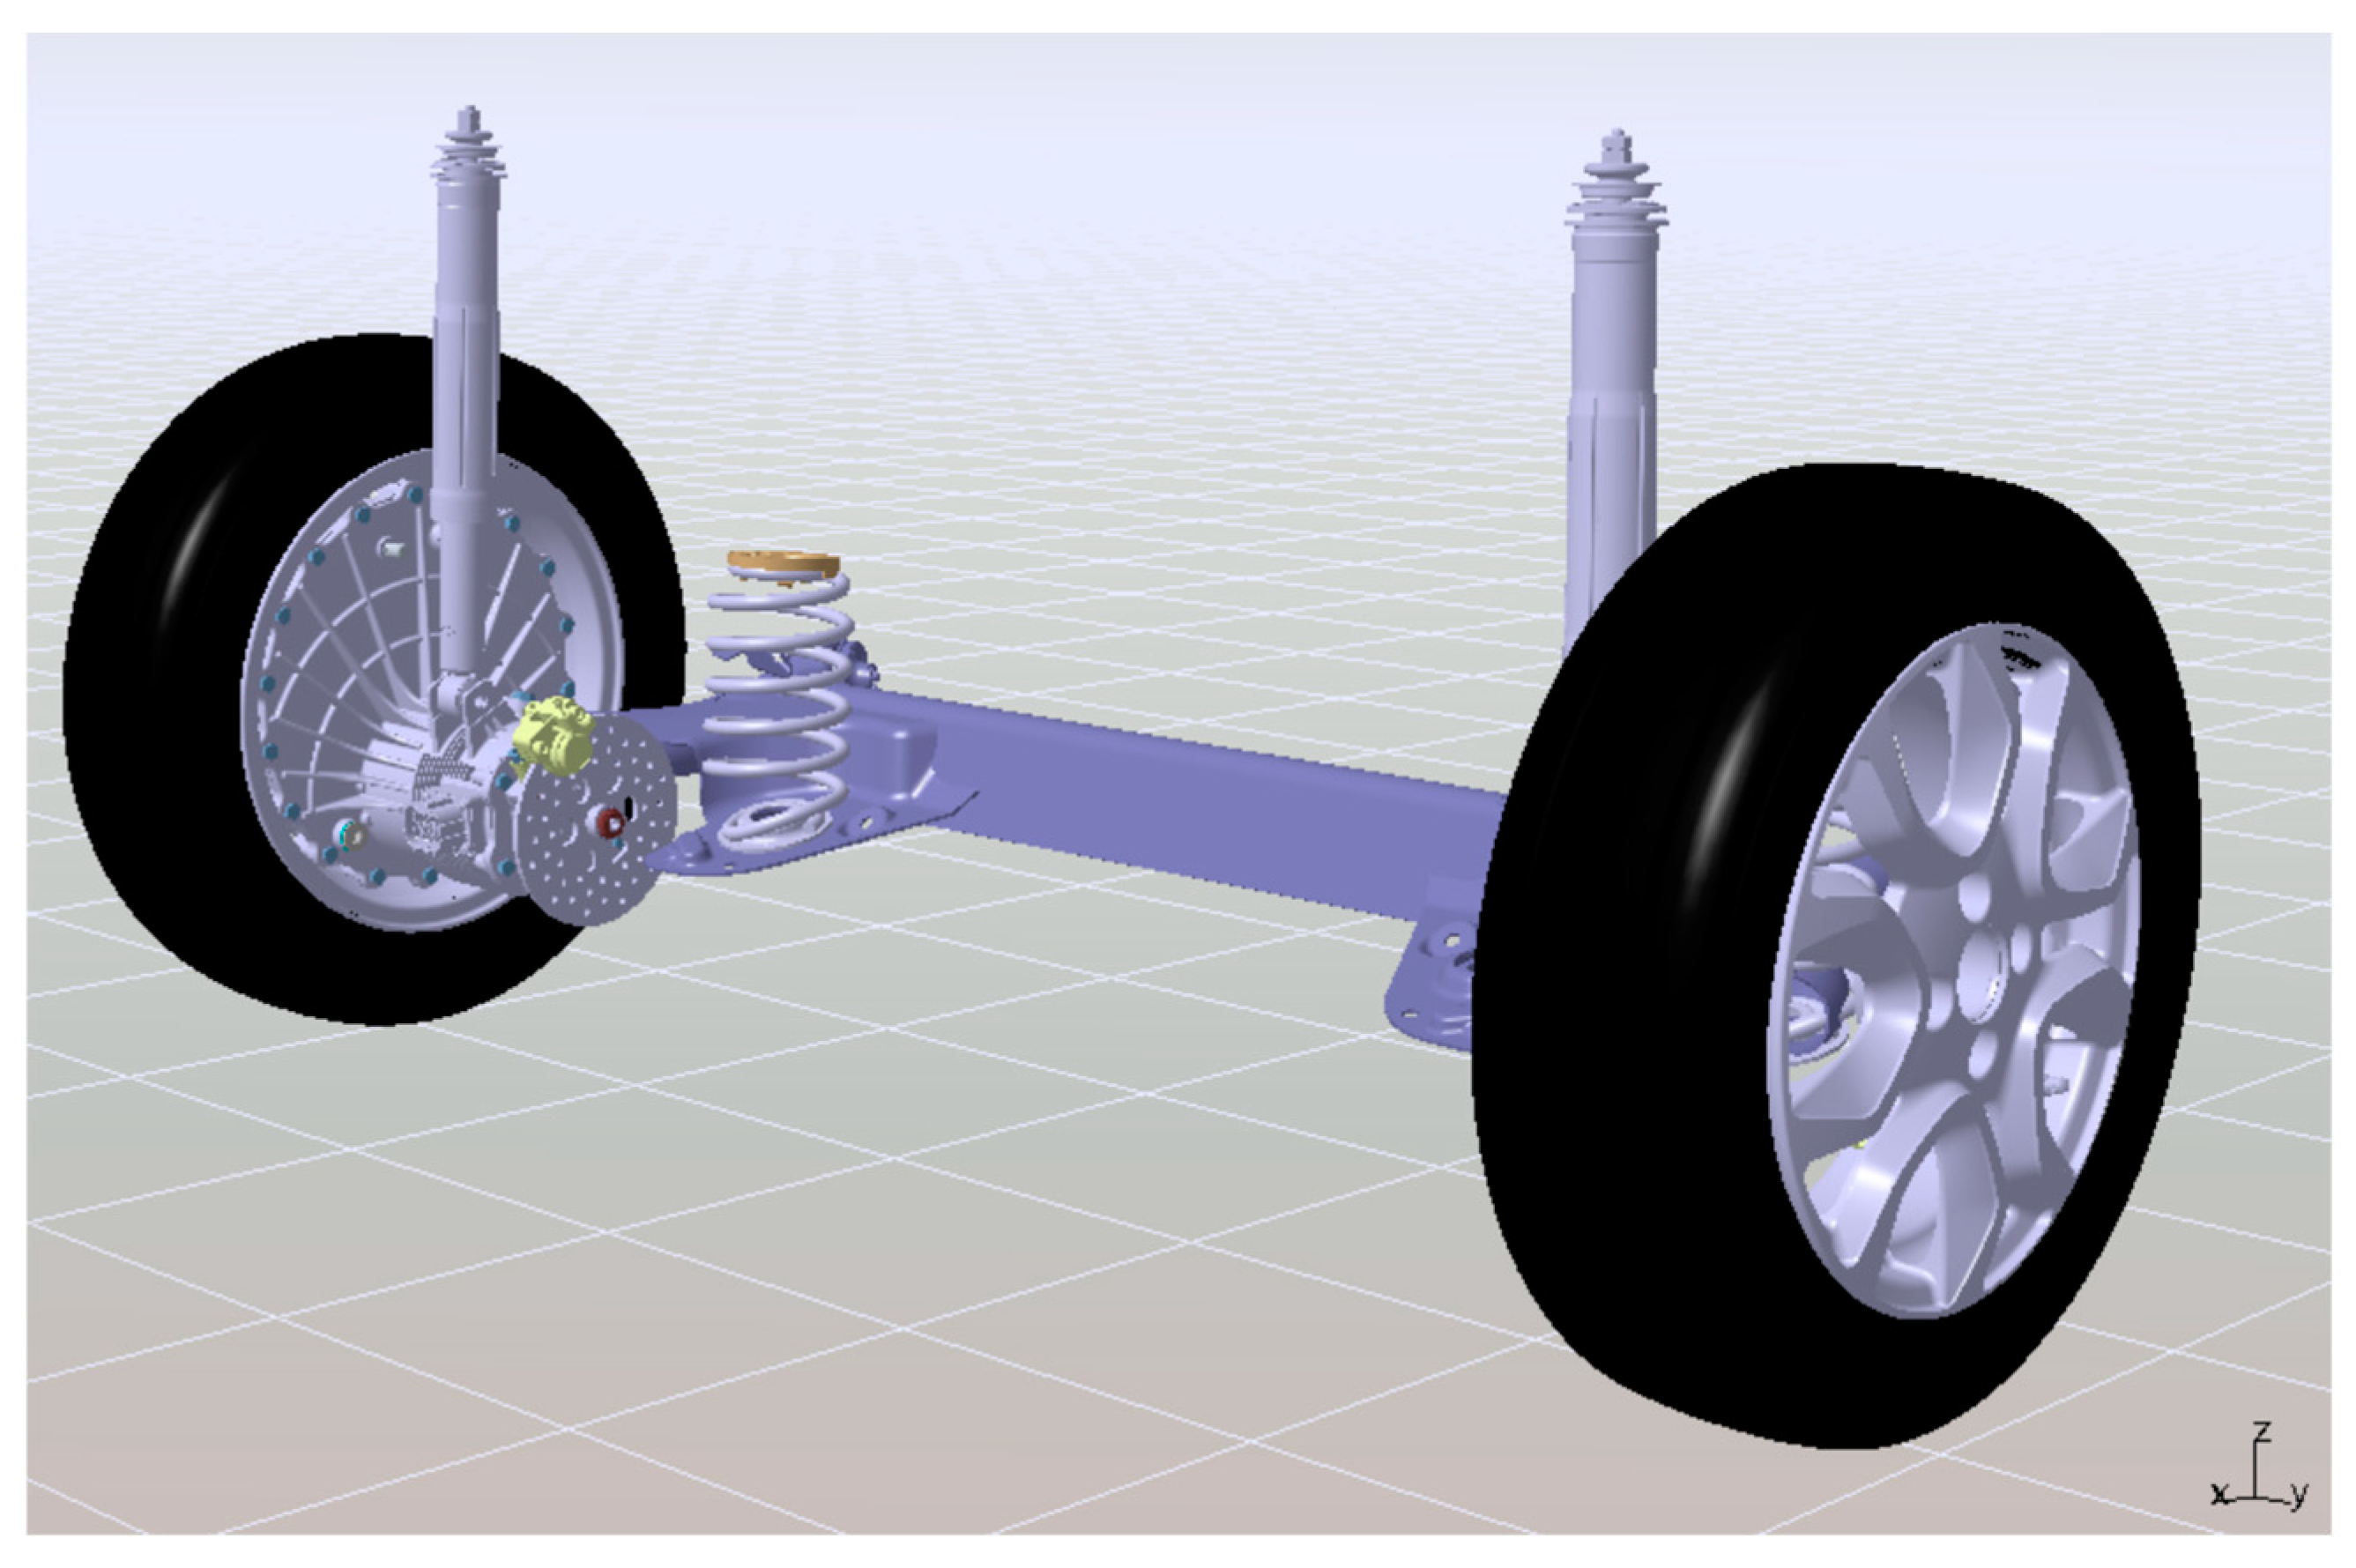
Based on the theoretical analysis above, we carried out specific engineering design and development of the EDW. A virtual prototype mounted on the rear suspension was established, as shown in Figure 16.
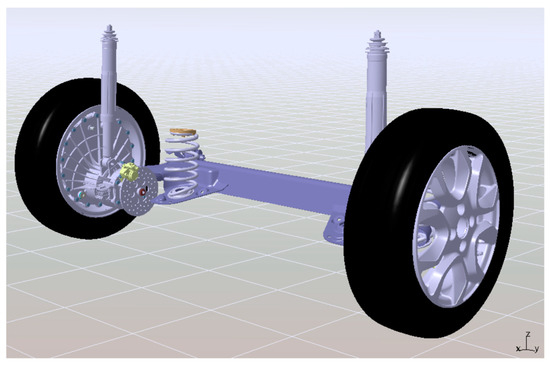
Figure 16.
EDW virtual prototype.
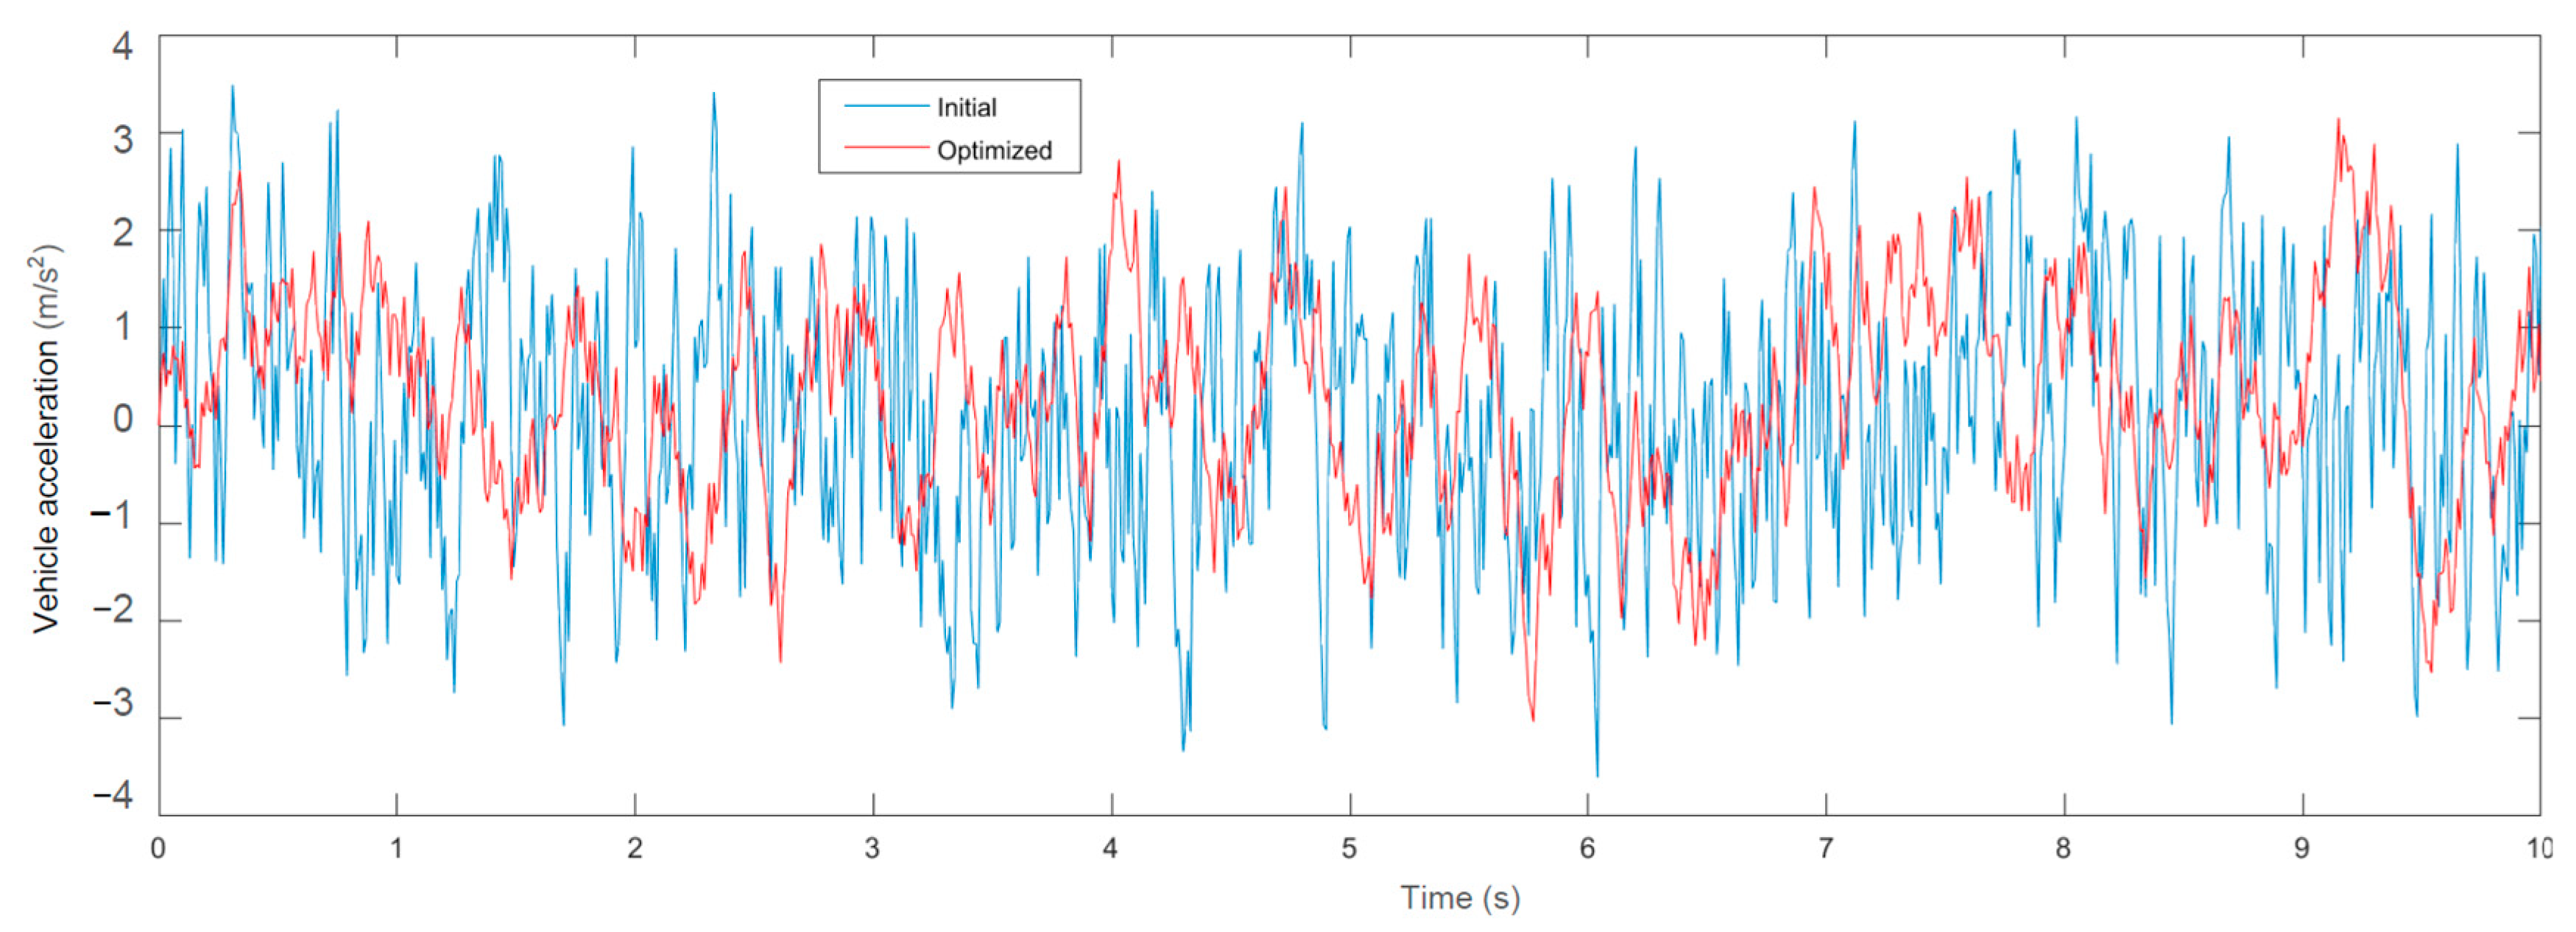
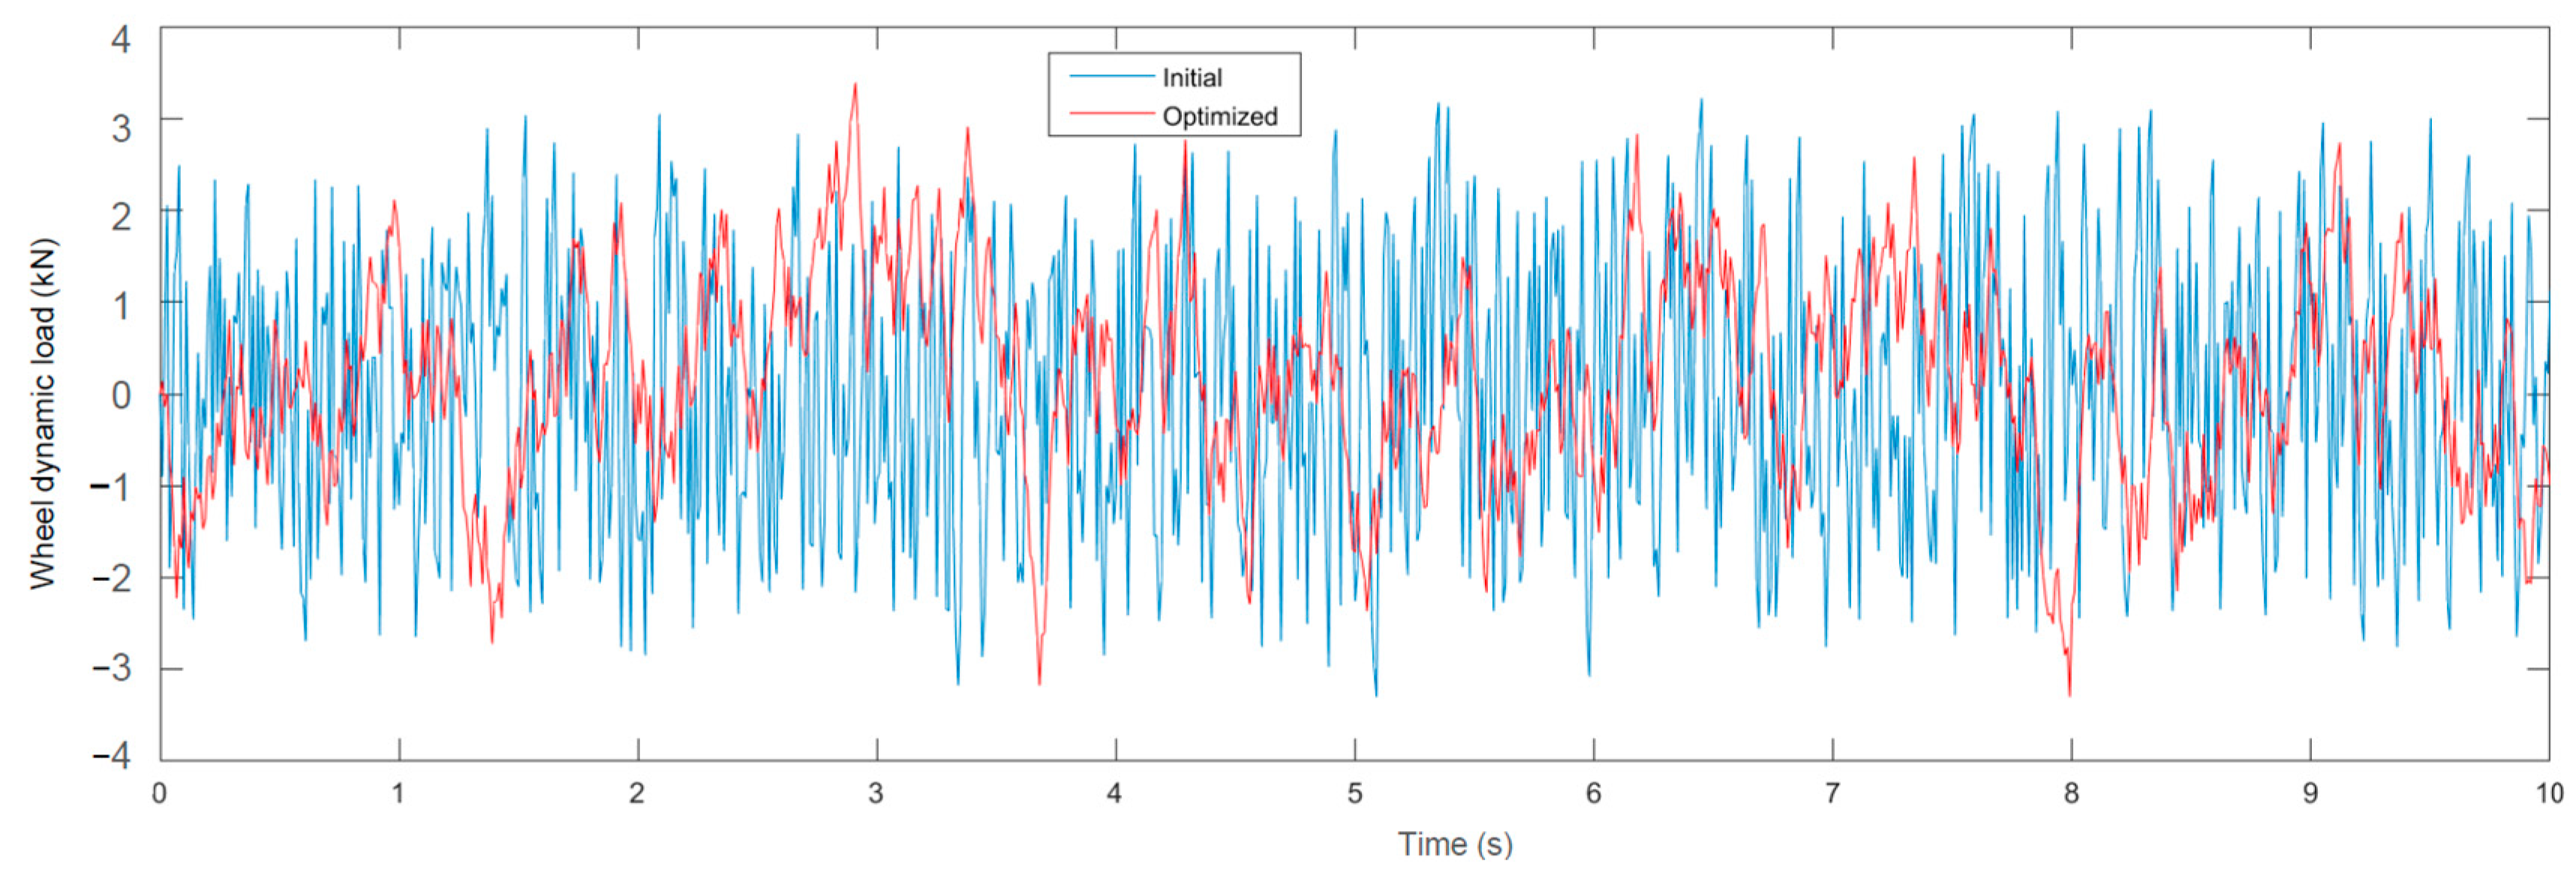
For the convenience of comparison, the simulation state was set the same as in the dynamic analysis. That is, the driving speed was 10 m/s, and the C-level road surface input filter white noise was set to be: , , . The time-domain response curves of vehicle acceleration and wheel dynamic load were obtained, as shown in Figure 17 and Figure 18, respectively. After integrating the curve, the RMS value of the vehicle acceleration was 1.35 m/s2, and the RMS value of the wheel dynamic load was 0.79 kN. The simulation results were basically consistent with the calculation results in Table 4, which verifies the correctness of the theoretical analysis.

Figure 17.
Time domain simulation of vehicle body acceleration.

Figure 18.
Time domain simulation of the wheel dynamic load.
5. Prototype and Test
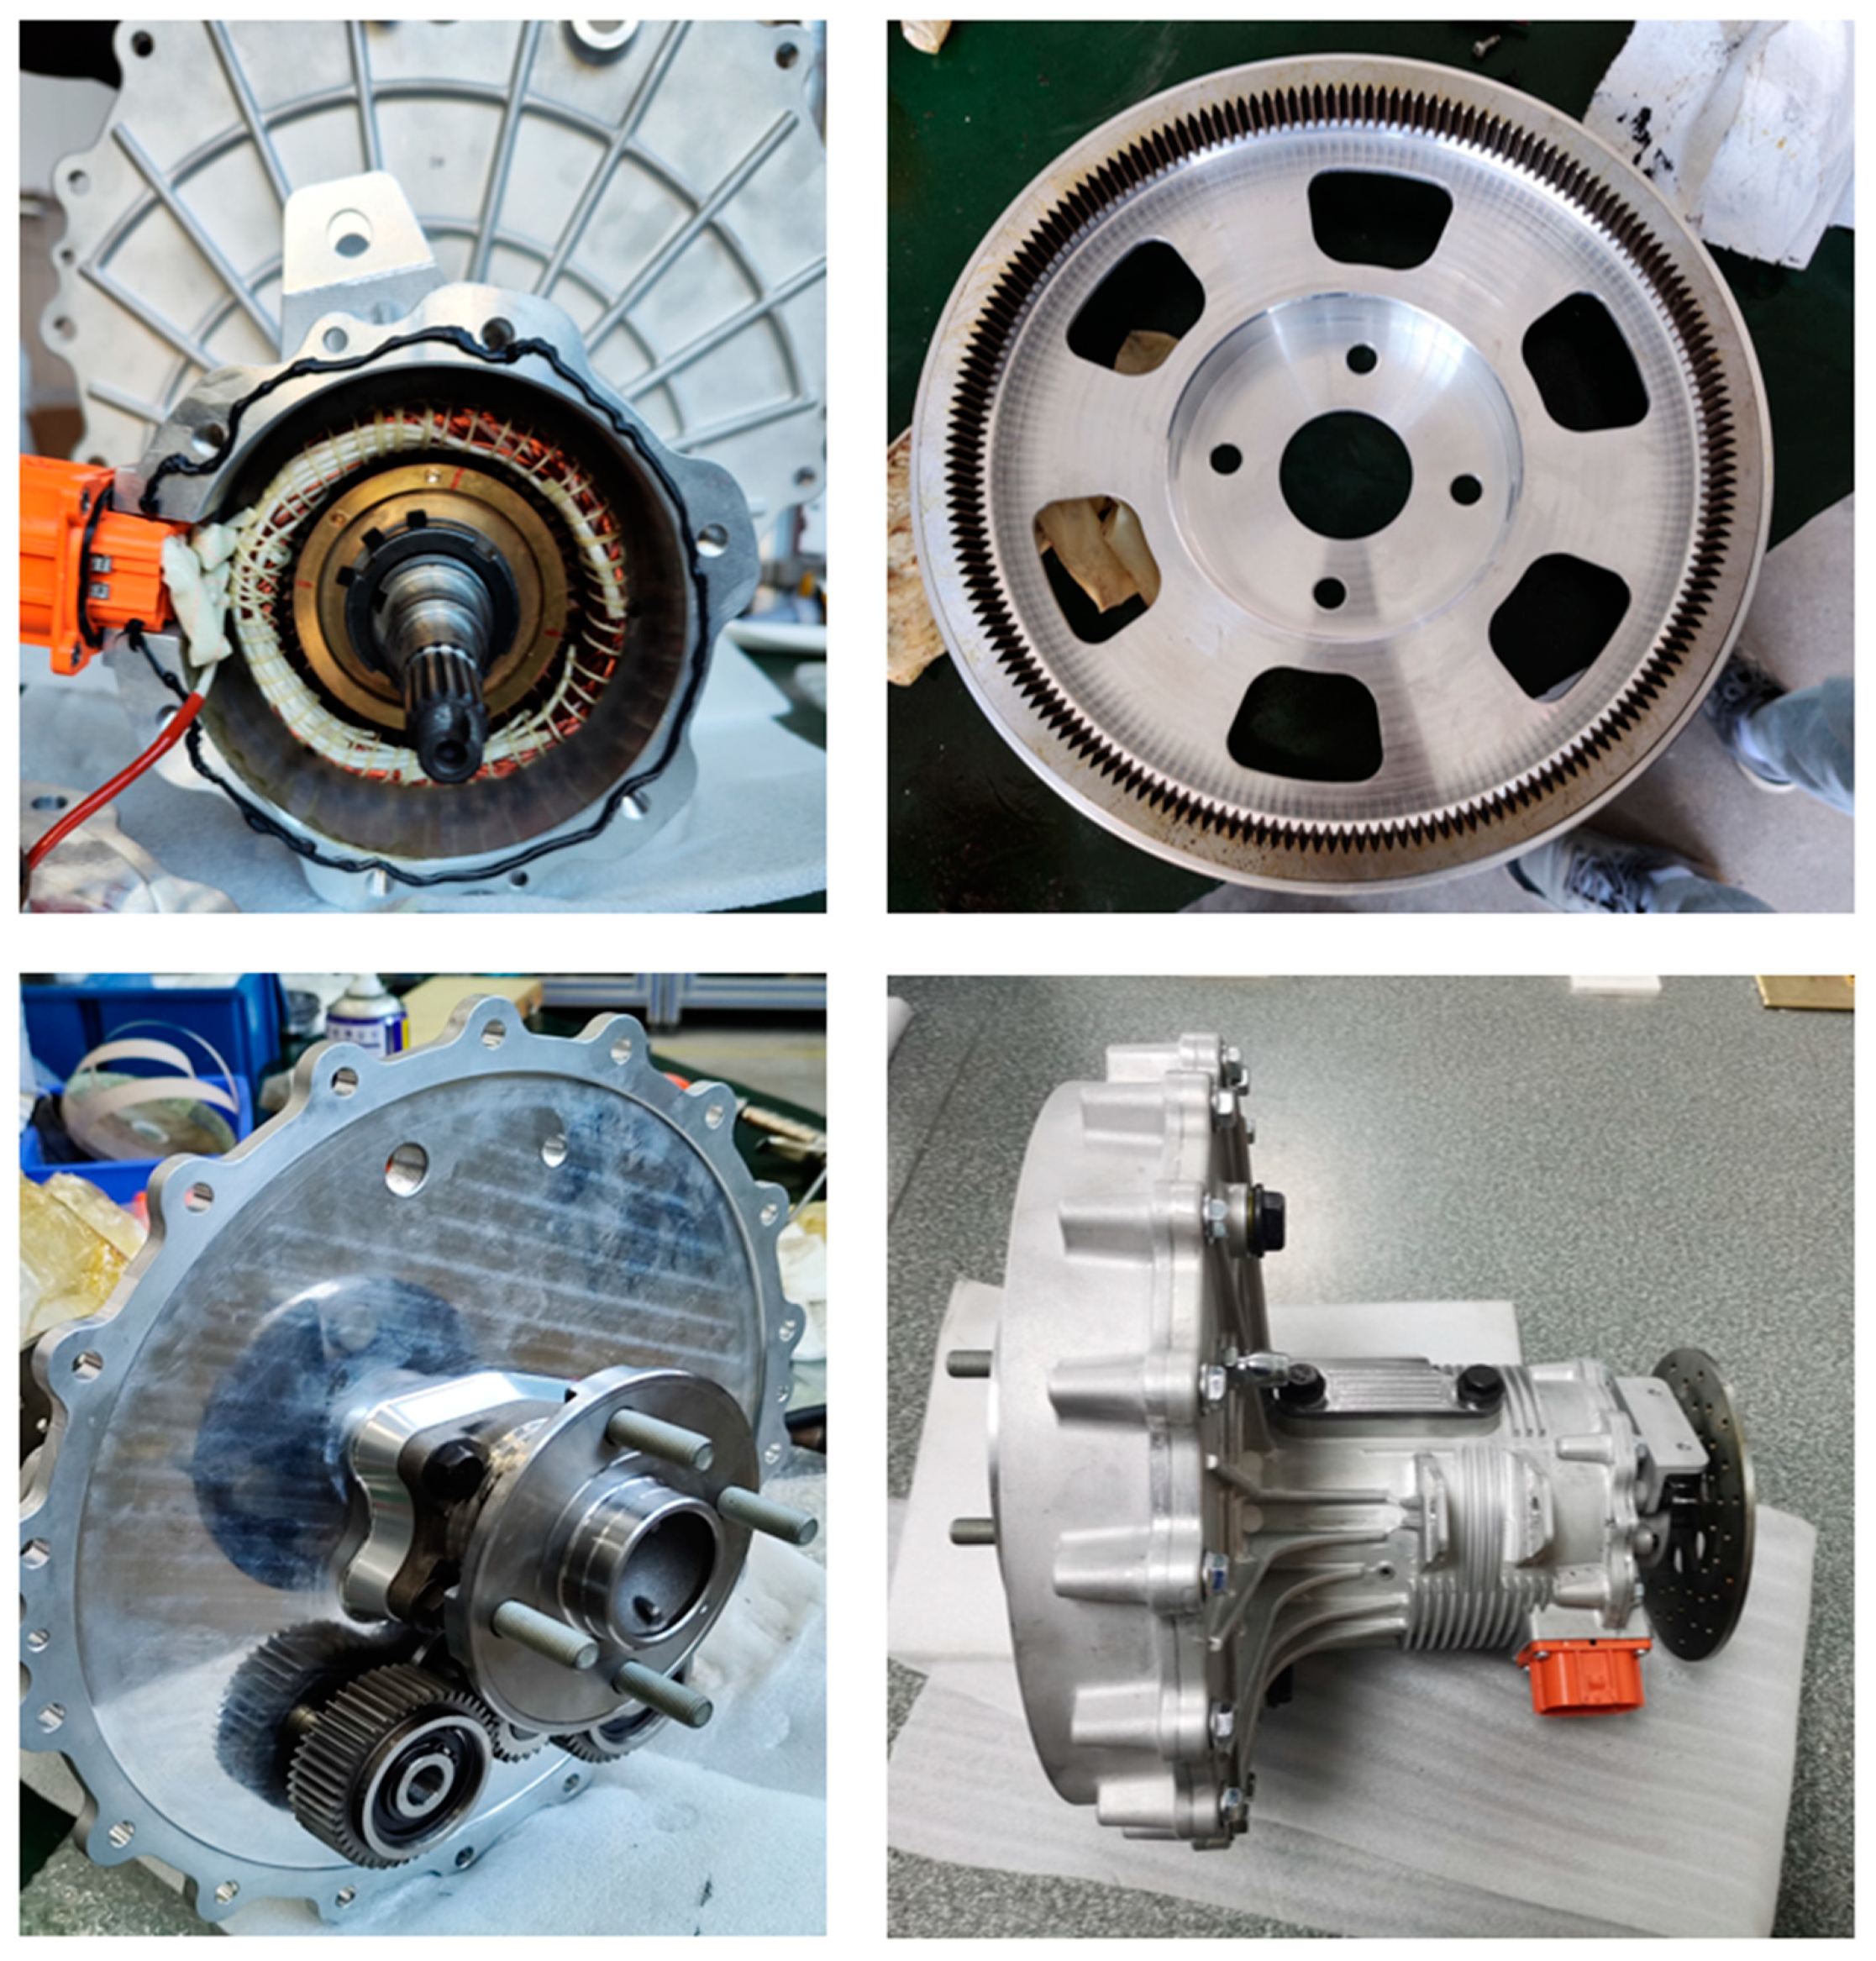
Based on the analysis and optimization above, we completed the engineering design of EDW and produced a prototype. Figure 19 shows the production and assembly process of the prototype, as well as the status of the motors, gears, and wheel hub bearings inside the system. The weight of prototype was measured to be 28.2 kg, which achieved a high degree of light weight.
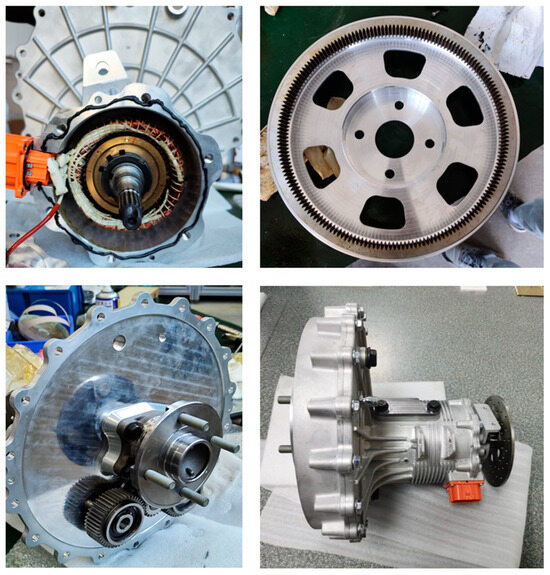
Figure 19.
Process and assembly of the prototype.
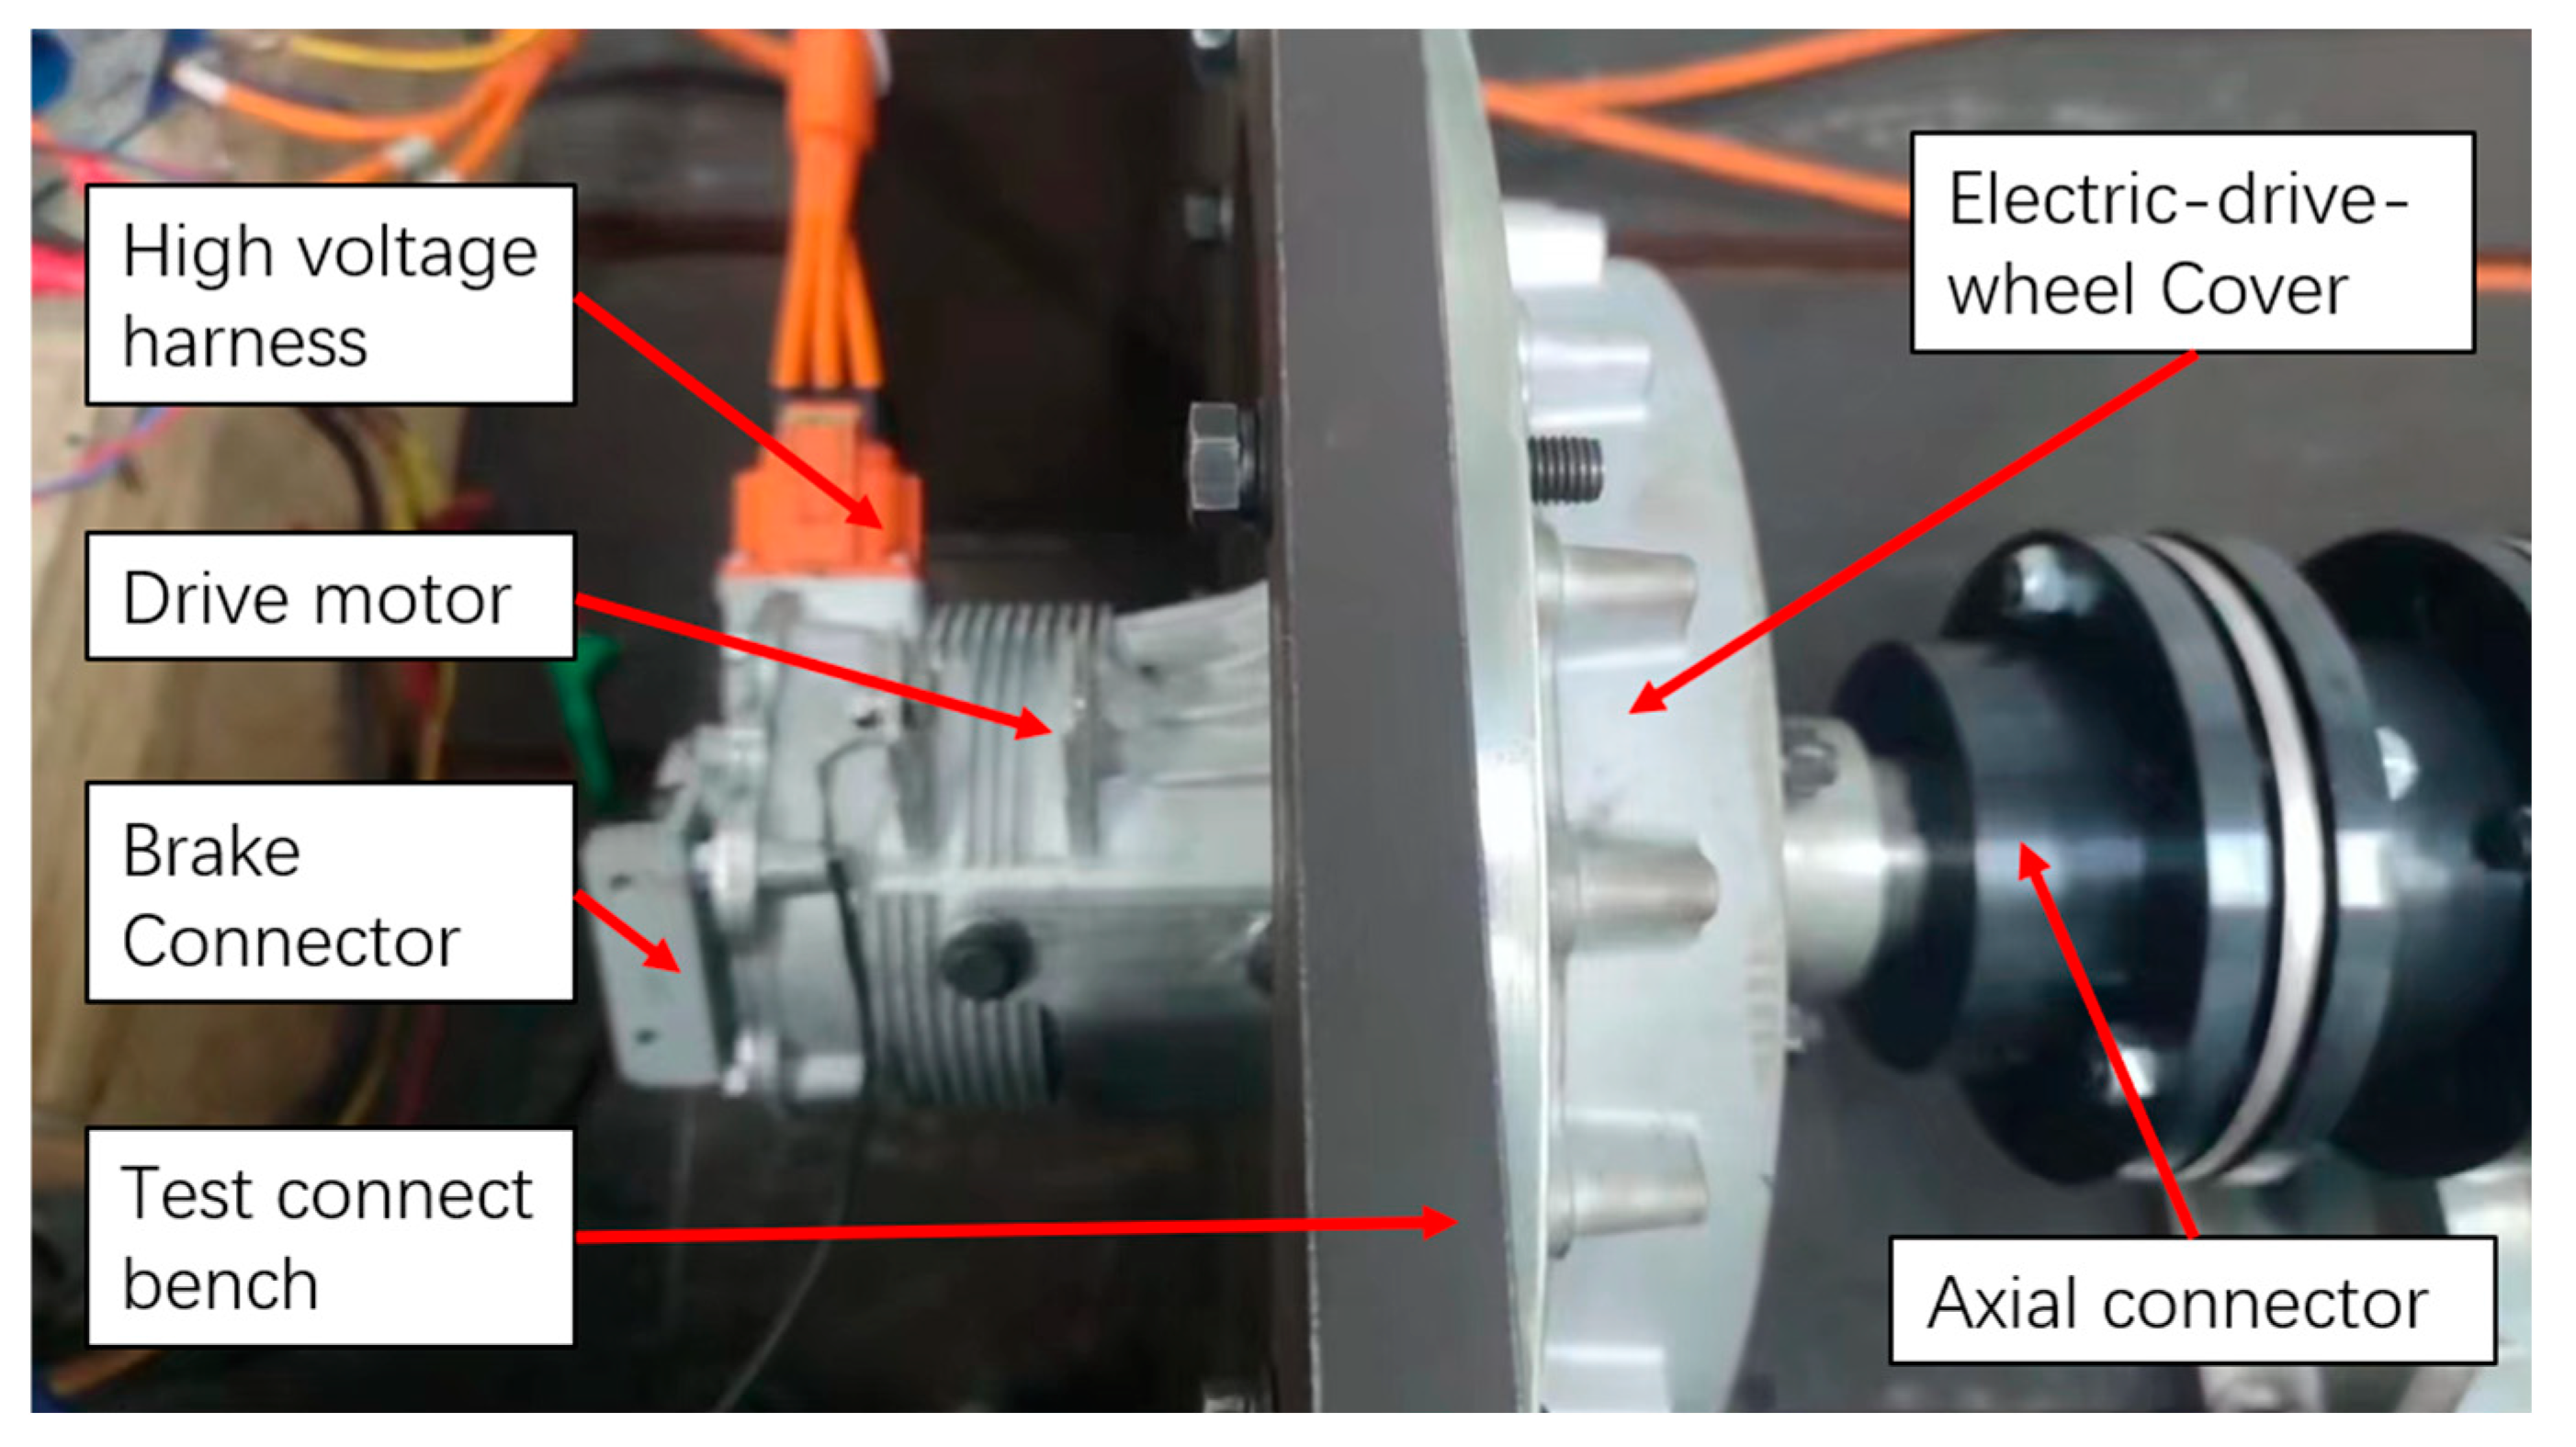
A test bench was established for the EDW with idler gear, as shown in Figure 20. The electric-drive-wheel was equipped on the test connect bench, while the high voltage harness was connected to the power resource to drive the motor. The power was transferred from the motor gear, the idler gear, the gear ring, and finally to the hub bearing, which was fixed to the axial connector as the output.

Figure 20.
The prototype equipped with a test bench.
The speed and torque were monitored by the sensors on the test bench to record the test data. The vehicle required the electric-drive-wheel to be consistent and accurate in a wide working range. Figure 21 illustrates the external characteristic curves of electric motor. We can see that the drive motor had a stable and accurate output at different working points.
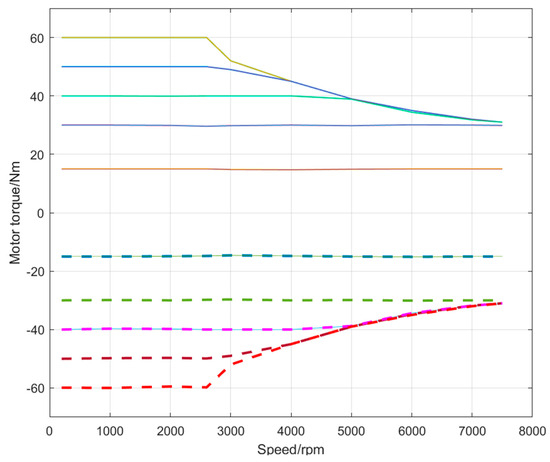
Figure 21.
External characteristic curves of the electric motor.
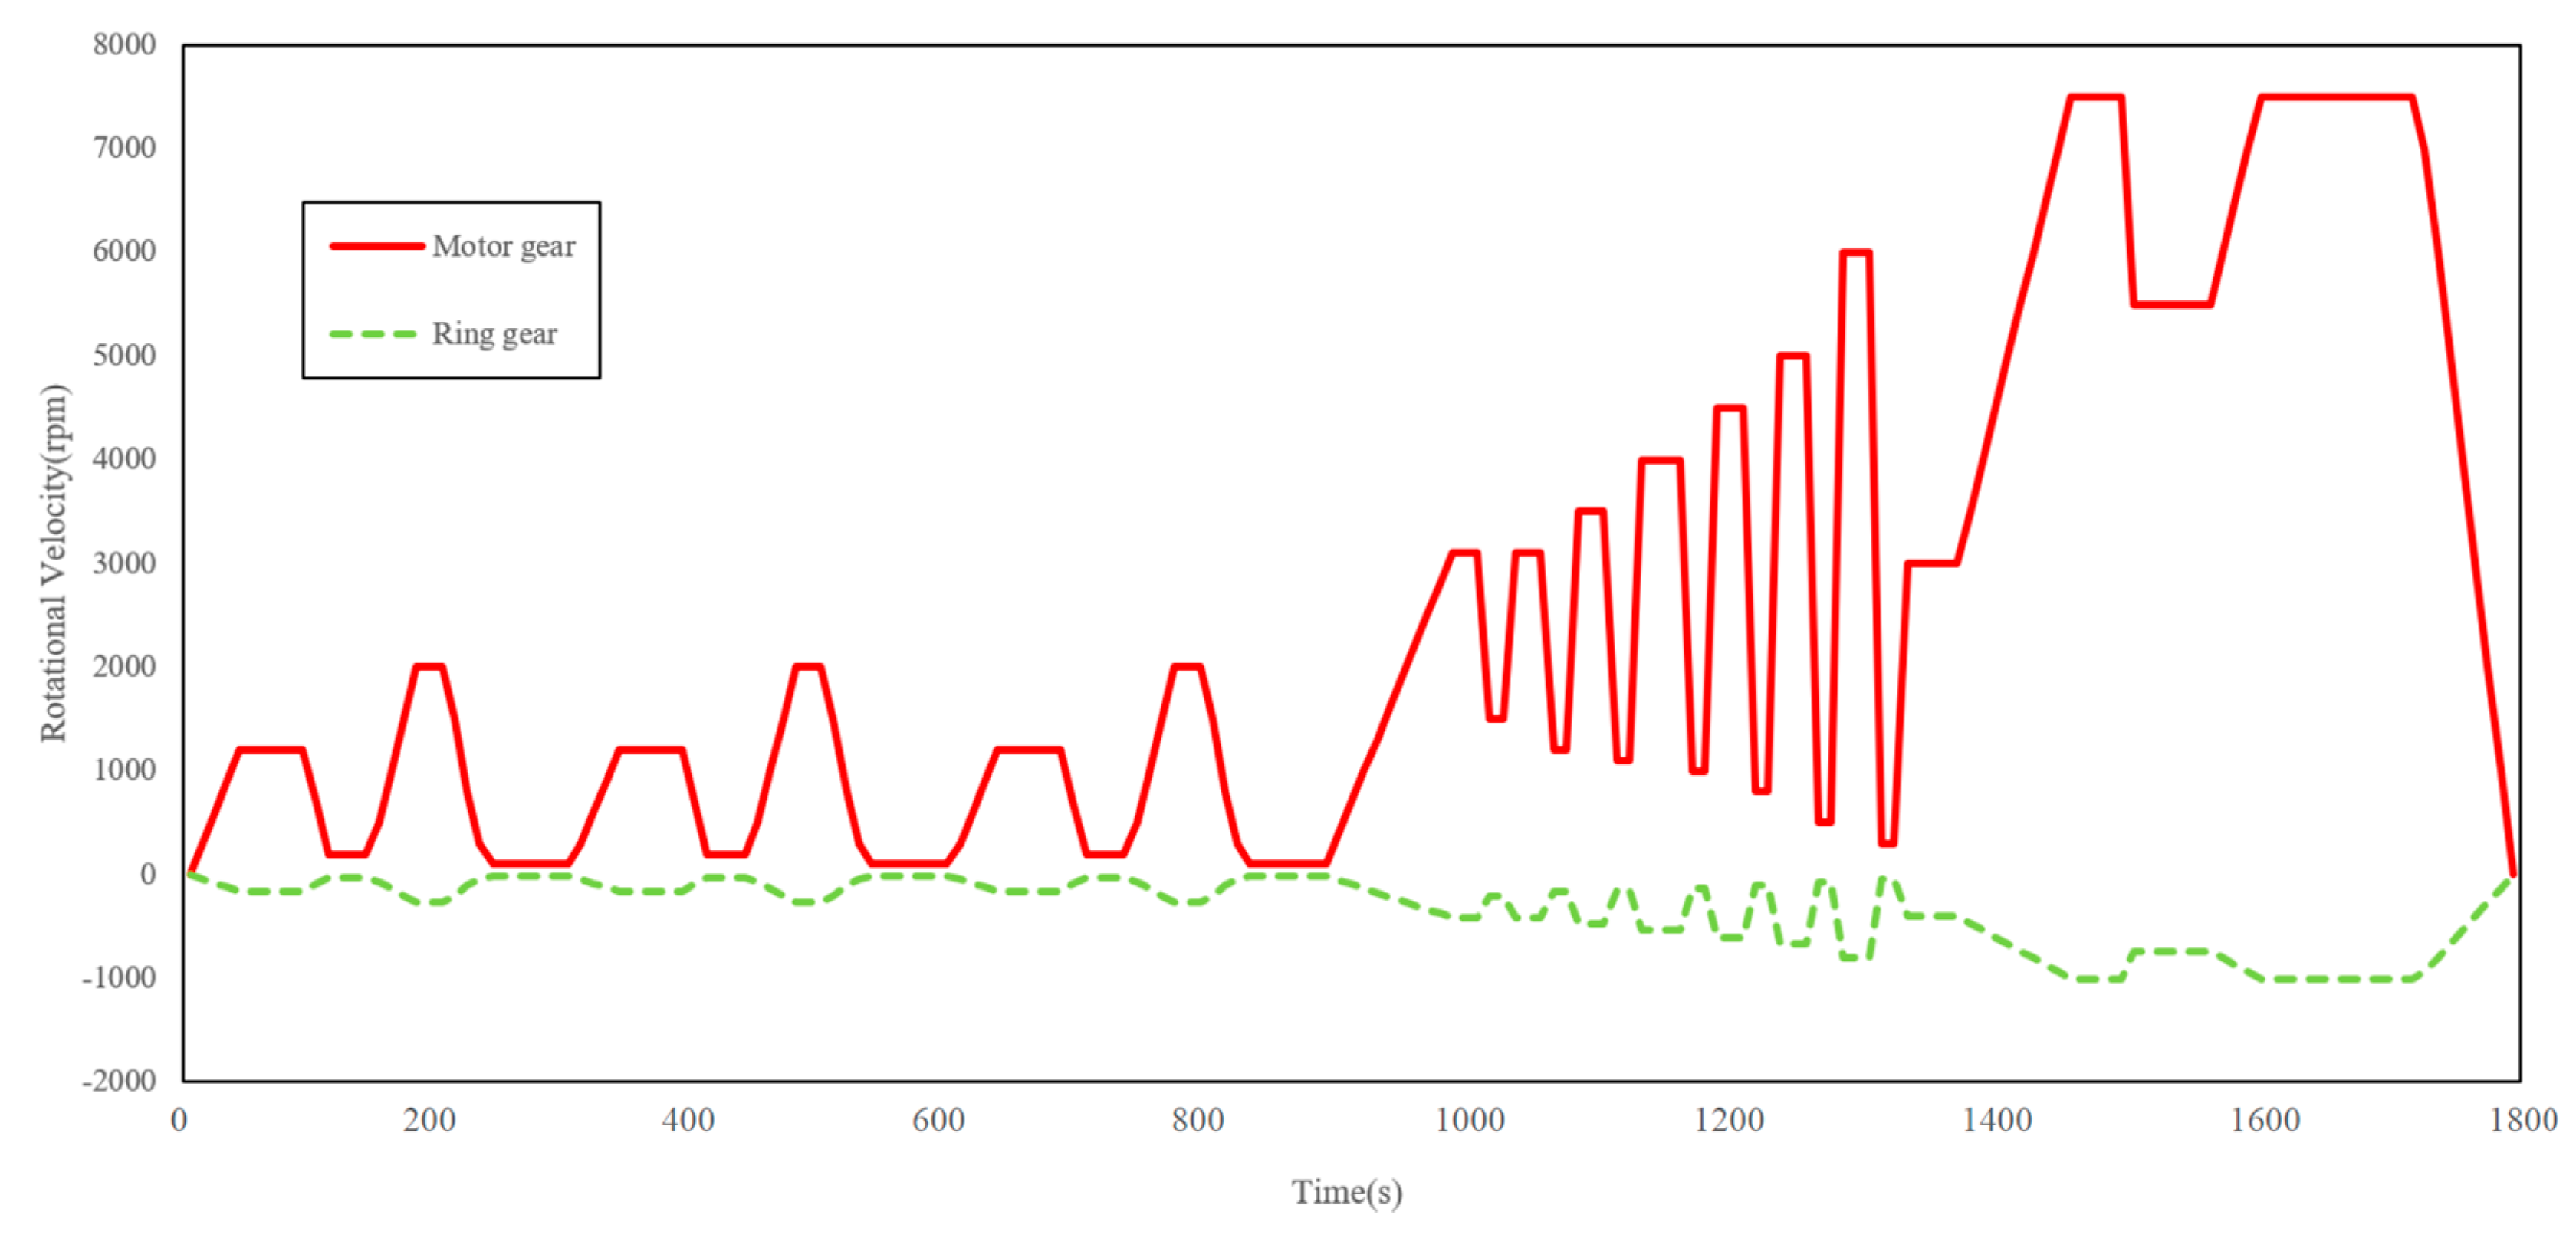
Based on the typical vehicle cycles, we gave some running cycles for the EDW prototype. The rotational velocity of each gear is shown in Figure 22, where the negative value stands for the opposite rotational direction. We can see that all the transmission components worked as expected throughout the whole working range. The motor gear rotational velocity started from three warm-up cycles under 3000 rpm, then it rose with intense fluctuations between 500 rpm and 6000 rpm. Then, the motor gear rotational velocity rose to the peak of 7500 rpm. Finally, the motor gear remained at 7500 rpm for 1 min and then gradually stopped. We can see that through the whole working range the ring gear curve followed perfectly in the time domain.
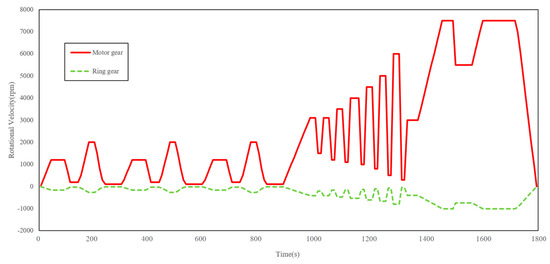
Figure 22.
Rotational speed of the transmission components.
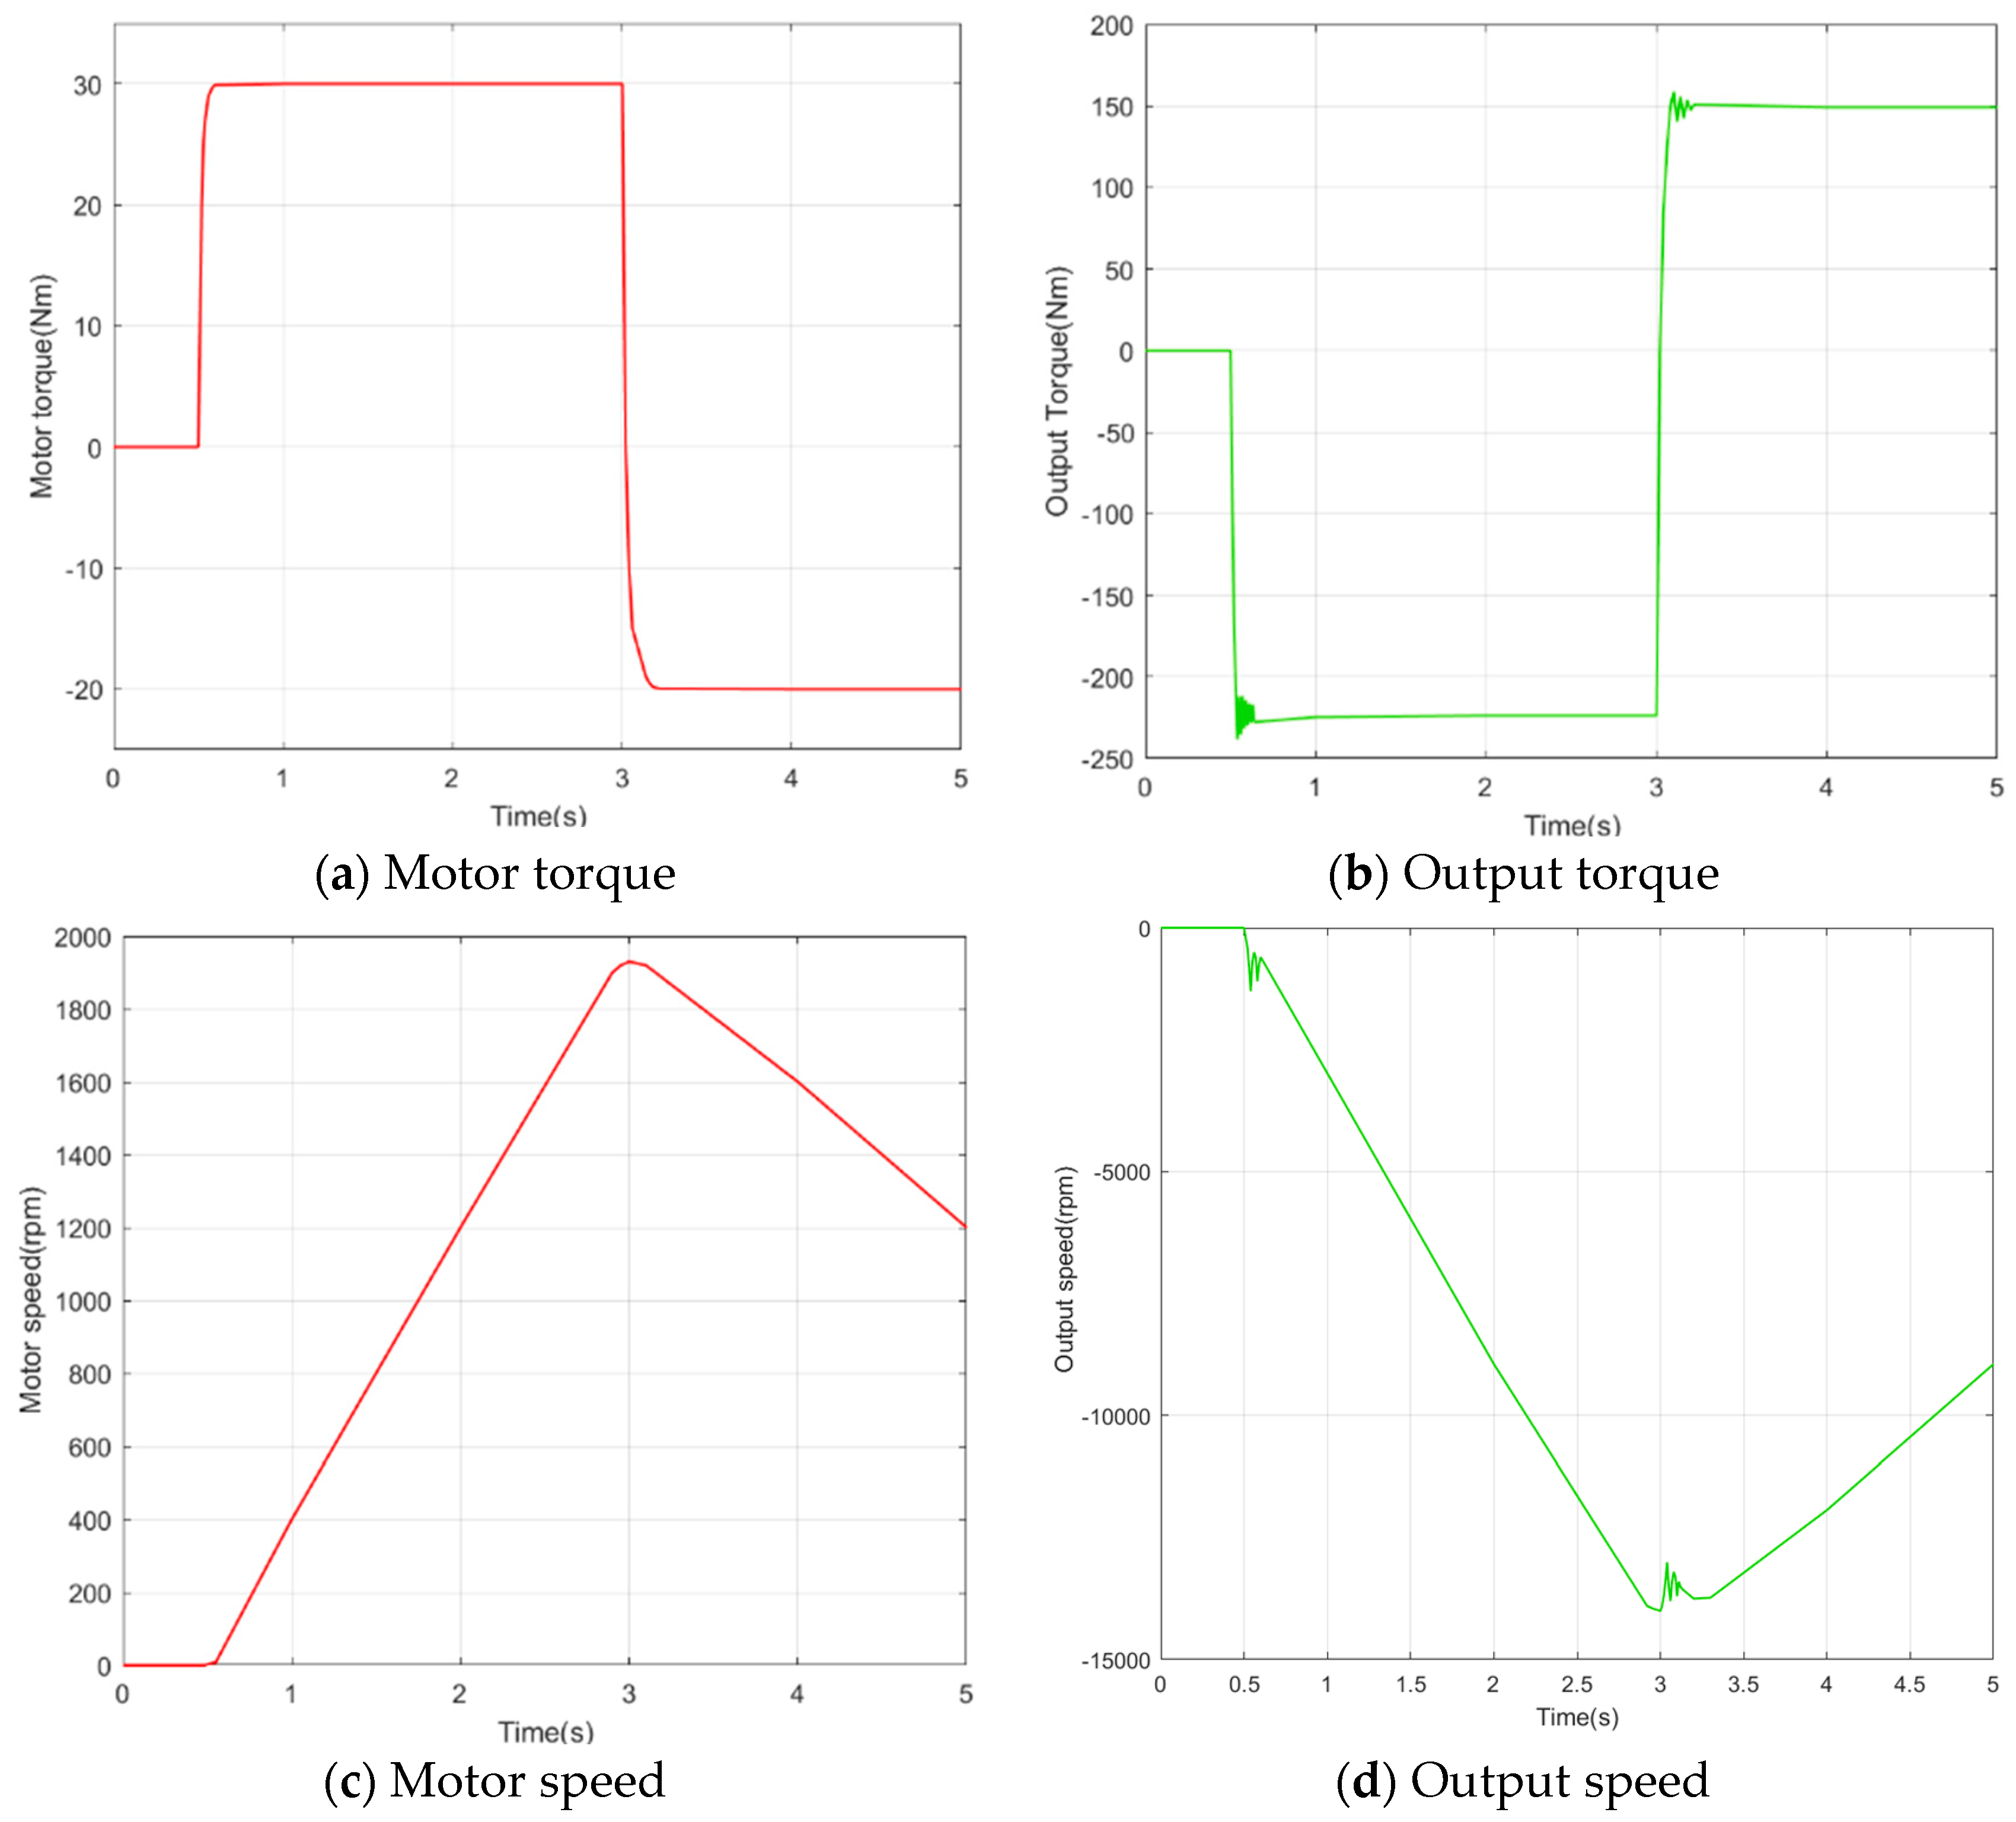
To better observe the dynamic output characteristics of the EDW, we conducted a special test on the step response of the system. At the point of 0.5 s, we input a step torque of 30 Nm to the drive motor, maintained it for 2.5 s, and then braked at −20 Nm at 3 s. We kept braking continuously for 5 s and examine the system response during this process, as shown in Figure 23. We can see that the torque fluctuation control of the system was good, with an overshoot time within 0.2 s, and an ideal performance in speed following. This was achieved through analysis and optimization based on the analysis of longitudinal characteristics.
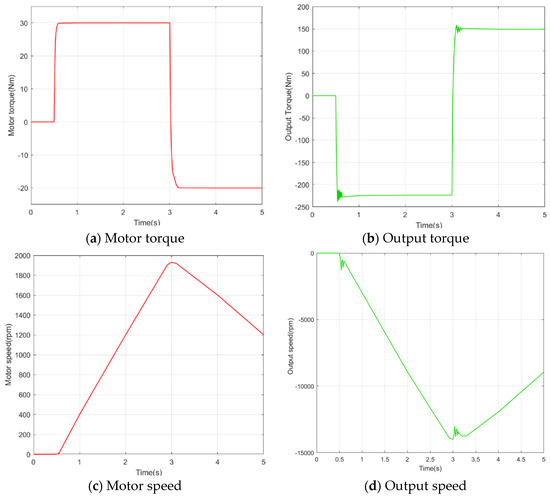
Figure 23.
Step response of the EDW.
6. Conclusions
This paper provides a comprehensive analysis of the performance of the EDW with idler gear. Based on this, we developed an engineering prototype for test. Conclusions were as follows:
(1) The evolution of the idler configuration requires geometric constraints that meet certain conditions. Under this premise, the smaller the modulus of the gear is, the better its load-sharing characteristics are, and the smoother the power transmission is. However, an extremely small modulus will reduce the strength of the gear and is constrained by the manufacturing process conditions of the gear. Therefore, when designing and developing, it is necessary to find a balance.
(2) The vertical characteristics of the idler system are influenced by the position of the motor. However, the position of the motor is constrained by the installation space and the geometric relationship of gear meshing, making it difficult to follow the optimal principle of vertical characteristics in practical development. For a given design state of a motor and transmission mechanism, targeted optimization can also be achieved by adjusting the suspension K&C values.
(3) The prototype was equipped with a test bench, covering a wide range of rotational speeds and diverse operating conditions. The performance of cycle conditions met the design expectations. In order to investigate the dynamic performance of the system, targeted torque step tests were conducted, and the output speed followed agilely with small overshoot wave momentum, reflecting good smoothness in longitudinal dynamics.
(4) Last but not least, the prototype was measured to be 28.2 kg, which showed good lightweight performance.
7. Patents
The work reported in this manuscript has applied for a China patent in 2024. The patent is titled as “An electric drive wheel that can sense the wheel load in real time with the sensing system”, with the patent number CN117774559A.
Author Contributions
Conceptualization, X.C. and A.K.; methodology, X.D. and A.K.; software, A.K.; validation, X.D. and J.Z.; formal analysis, X.D. and A.K.; investigation, X.D. and A.K.; resources, X.C. and X.D.; data curation, X.D. and J.Z.; writing—original draft preparation, X.D.; writing—review and editing, X.C.; visualization, X.D.; supervision, X.C.; project administration, X.C.; funding acquisition, X.C. All authors have read and agreed to the published version of the manuscript.
Funding
This research was funded by National Natural Science Foundation of China project “Research on the Mechanism Principle and Multi-source Information Processing Mechanism of a Load-sensing Distributed Drive System” (No. 5227052034).
Data Availability Statement
Data are contained within the article.
Conflicts of Interest
Author Xiaoyu Ding was employed by the company SAIC Motor. The remaining authors declare that the research was conducted in the absence of any commercial or financial relationships that could be construed as a potential conflict of interest.
References
- Agamloh, E.; Jouanne, A.V.; Yokochi, A. An overview of electric machine trends in modern electric vehicles. Machines 2020, 8, 20. [Google Scholar] [CrossRef]
- Boldea, I.; Tutelea, L.N.; Parsa, L. Automotive electric propulsion systems with reduced or no permanent magnets: An overview. IEEE Trans. Ind. Electron. 2014, 61, 5696–5711. [Google Scholar] [CrossRef]
- Hilton, C. Wheel Torque and Speed in a Vehicle with In-Wheel Motors; Protean Electric Ltd.: Farnham, UK, 2024; p. 8. [Google Scholar]
- Biek, M.; Connes, R.; Omerovi, S. The bearing stiffness effect on In-Wheel Motors. Sustainability 2020, 12, 4070. [Google Scholar] [CrossRef]
- De Santis, M.; Agnelli, S.; Patanè, F.; Giannini, O.; Bella, G. Experimental study for the assessment of the measurement uncertainty associated with electric powertrain efficiency using the back-to-back direct method. Energies 2018, 11, 3536. [Google Scholar] [CrossRef]
- Pedro, J.; Weinholtz, J.; Sousa, L.; Reis, L. A New Concept for a wheel-embedded assembly for electric vehicles. J. Mech. Des. 2013, 135, 124502. [Google Scholar] [CrossRef]
- Drexler, D.; Hou, Z. Simulation analysis on vertical vehicle dynamics of three in-wheel motor drive configurations. Proc. Inst. Mech. Eng. Part D J. Automob. Eng. 2023, 09544070231163925. [Google Scholar] [CrossRef]
- Ciobotaru, T.; Grigore, L.S.; Barothi, L. Kinematic and dynamic analysis of a planetary gear box in steady-state working regime. IOP Conf. Ser. Mater. Sci. Eng. 2024, 1303, 012015. [Google Scholar] [CrossRef]
- Jian, L.; Chau, K.T. Design and analysis of an integrated Halbach-magnetic-geared permanent-magnet motor for electric vehicles. J. Asian Electr. Veh. 2009, 7, 1213–1219. [Google Scholar] [CrossRef]
- Shi, Y.; Wei, J.; Deng, Z.; Jian, L. A novel electric vehicle powertrain system supporting multi-path power flows: Its architecture, parameter determination and system simulation. Energies 2017, 10, 216. [Google Scholar] [CrossRef]
- Shi, Y.; Jian, L. A novel Dual-Permanent-Magnet-Excited Machine with Flux Strengthening Effect for low-speed large-torque applications. Energies 2018, 11, 153. [Google Scholar] [CrossRef]
- Jian, L.; Deng, Z.; Shi, Y.; Wei, J.; Chan, C.C. The mechanism how coaxial magnetic gear transmits magnetic torques between its two rotors: Detailed analysis of torque distribution on modulating ring. IEEE/ASME Trans. Mechatron. 2019, 24, 763–773. [Google Scholar] [CrossRef]
- Perovic, D.K. Making the impossible, possible–overcoming the design challenges of In-Wheel Motors. World Electr. Veh. J. 2012, 5, 514–519. [Google Scholar] [CrossRef]
- Theling, J.; Brimmers, J.; Brecher, C. Reducing mass while improving the operational behavior form optimization of planetary gearbox housings. Forsch. Im Ingenieurwesen 2021, 85, 543–551. [Google Scholar] [CrossRef]
- Kahraman, A. Load sharing characteristics of planetary transmissions. Mech. Mach. Theory 1994, 29, 1151–1165. [Google Scholar] [CrossRef]
- Howard, S.I. Calculation of the combined torsional mesh stiffness of spur gears with two-and three-dimensional parametrical FE Models. J. Mech. Eng. 2011, 57, 810–818. [Google Scholar]
- Xue, S.; Howard, I. Ring-planet mesh stiffness study with different boundary conditions and crack locations. In Proceedings of the ASME International Design Engineering Technical Conferences & Computers & Information in Engineering Conference 2015, Boston, MA, USA, 2–5 August 2015. [Google Scholar] [CrossRef]
- Chen, X.; Yin, J.; Wang, W.; Wu, L.; Tang, F. Approaches to diminish large unsprung mass negative effects of wheel side drive electric vehicles. J. Adv. Mech. Des. Syst. Manuf. 2016, 10, JAMDSM0064. [Google Scholar] [CrossRef]
- Wang, W.; Chen, X. Design methodology for wheel corner module topology based on position and orientation characteristics. Mech. Mach. Theory 2019, 136, 122–140. [Google Scholar] [CrossRef]
- Qin, Y.; Wang, Z.; Yuan, K. Comprehensive analysis and optimization of dynamic vibration-absorbing structures for electric vehicles driven by In-Wheel Motors. Automot. Innov. 2020, 3, 192. [Google Scholar] [CrossRef]
- Abe, W.A. Development of an in-wheel drive with advanced dynamic-damper mechanism. JSAE Rev. 2003, 24, 477–481. [Google Scholar] [CrossRef]
- Frajnkovic, M.; Omerovic, S.; Rozic, U. Structural integrity of In-Wheel Motors. In Proceedings of the International Powertrains, Fuels & Lubricants Meeting, Heidelberg, Germany, 17–20 October 2018; Volume 1, p. 11. [Google Scholar]
- Ding, X.Y.; Kong, A.; Chen, X. An Electric Drive Wheel That Can Sense the Wheel Load in Real Time with the Sensing System. Chinese Patent CN117774559A, 29 March 2024. [Google Scholar]
- Hu, Y.; Talbot, D.; Kahraman, A. A gear load distribution model for a planetary gear set with a flexible ring gear having external splines. J. Mech. Des. 2018, 141, 053301. [Google Scholar] [CrossRef]
- Zhao, N.; Wang, L.I. A general mathematical design method of the torque-split gear transmission with idler pinion. J. Adv. Mech. Des. Syst. Manuf. 2018, 12, JAMDSM0127. [Google Scholar] [CrossRef]
- Cardon, A.; Tordion, G.V. Numerical implementation of complex potentials for gear tooth stress analysis. ASME J. Mech. Des. 1981, 103, 460–465. [Google Scholar]
- Comell, R.W. Compliance and stress sensitivity of spur gear teeth. ASME J. Mech Des. 1981, 103, 447–459. [Google Scholar]
- Liu, H.; Zhong, Z.; Jing, H. Simulation on the dynamic characteristics of In-Wheel-Motor powertrain in distributed drive electric vehicle. Automot. Eng. 2014, 36, 597–602. [Google Scholar]
- Kahraman, A.; Ligata, H.; Singh, A. Influence of ring gear rim thickness on planetary gear set behavior. J. Mech. Des. 2010, 132, 021002. [Google Scholar] [CrossRef]
- Hedlund, J.; Lehtovaara, A. A parameterized numerical model for the evaluation of gear mesh stiffness variation of a helical gear pair. Drive Syst. Tech. 2008, 222, 1321–1327. [Google Scholar] [CrossRef]
- Sánchez, M.B.; Pleguezuelos, M.; Pedrero, J.I. Approximate equations for the meshing stiffness and the load sharing ratio of spur gears including hertzian effects. Mech. Mach. Theory 2017, 109, 231–249. [Google Scholar] [CrossRef]
- Kahraman, M.I. A theoretical and experimental investigation of modulation sidebands of planetary gear sets. J. Sound Vib. 2009, 323, 677–696. [Google Scholar] [CrossRef]
- Kim, W.; Lee, J.Y.; Chung, J. Dynamic analysis for a planetary gear with time-varying pressure angles and contact ratios. J. Sound Vib. 2012, 331, 883–901. [Google Scholar] [CrossRef]
- Kahraman, A. Static load sharing characteristics of transmission planetary gear sets: Model and experiment. SAE Trans. 1999, 108, 1954–1963. [Google Scholar] [CrossRef]
- Chen, X.; Wang, W.; Wang, X. Research on vertical dynamics of electric drive systems with inhibition of negative effects of unsprung mass. J. Auto. Eng. 2014, 3, 430–437. [Google Scholar]
- Ning, G.; Wan, G. The present research situation of the influences on vehicle vertical performances induced by direct wheel drives system. Auto. Technol. 2007, 3, 21–25. [Google Scholar]
- Andrés, E.; Rojas, R.; Niederkofler, H.; Willberger, J. Comfort and Safety Enhancement of PassengerVehicles with In-Wheel Motors; SAE Technical Papers; SAE International: Warrendale, PA, USA, 2010. [Google Scholar] [CrossRef]

Disclaimer/Publisher’s Note: The statements, opinions and data contained in all publications are solely those of the individual author(s) and contributor(s) and not of MDPI and/or the editor(s). MDPI and/or the editor(s) disclaim responsibility for any injury to people or property resulting from any ideas, methods, instructions or products referred to in the content. |
© 2024 by the authors. Licensee MDPI, Basel, Switzerland. This article is an open access article distributed under the terms and conditions of the Creative Commons Attribution (CC BY) license (https://creativecommons.org/licenses/by/4.0/).