Article

A Spatiotemporal Domain-Coupled Clustering Method for Performance Prediction of Cluster Systems

1
School of Mechanical Engineering, Yanshan University, Qinhuangdao 066004, China
2
State Key Laboratory of Crane Technology, Yanshan University, Qinhuangdao 066004, China
3
Hebei Provincial Key Laboratory of Heavy Machinery Fluid Power Transmission and Control, Yanshan University, Qinhuangdao 066004, China
4
National Astronomical Observatories, Chinese Academy of Sciences, Beijing 100012, China
*
Author to whom correspondence should be addressed.
Actuators 2025, 14(5), 208; https://doi.org/10.3390/act14050208
Submission received: 21 March 2025 / Revised: 13 April 2025 / Accepted: 14 April 2025 / Published: 24 April 2025
(This article belongs to the Section Control Systems)

Abstract

:
The performance prediction of the Five-hundred-meter Aperture Spherical radio Telescope (FAST) project represents one of the primary challenges faced by the system. To address the performance prediction issues of the FAST hydraulic actuator cluster system, a spatiotemporal domain-coupled clustering performance prediction method is proposed. By preprocessing data from the FAST health monitoring system, virtual samples constructed from temporal-domain data are integrated with spatial-domain data, thereby resolving the small-sample and even zero-sample issues caused by missing fault data in the FAST hydraulic actuator cluster system. The effectiveness of the spatiotemporal domain-coupled clustering is validated through performance prediction of the hydraulic actuator cluster system. Subsequent optimization of the prediction protocol based on experimental outcomes demonstrated exceptional performance, with 96.8% of actuators achieving prediction accuracies exceeding 99%. This advancement establishes a robust technical foundation for accurate performance prediction in the FAST hydraulic actuator cluster system, thereby enhancing operational reliability and maintenance efficiency.

1. Introduction

FAST currently represents the world’s largest single-dish radio telescope, positioning China at the forefront of radio astronomy and deep-space exploration communication, thereby establishing the nation among global leaders in radio astronomy [1]. FAST employs a distinctive active displacement operational mode, where the hydraulic actuator cluster system serves as the critical driving unit for precision adjustment of the active reflector surface geometry [2]. The active reflector surface dynamically achieves instantaneous paraboloid formation and controlled deformation through coordinated displacement of ground-anchored hydraulic actuators. This electromechanical actuation system drives downhaul cables in response to positional control signals from nodal controllers, enabling real-time surface reconfiguration for astronomical observations [3]. Consequently, the FAST hydraulic actuator cluster system constitutes a rare global exemplar of localized large-scale electromechanical-hydraulic integration systems.
Given FAST’s intensive deep-space observation requirements [4], coupled with inevitable performance degradation and health deterioration of system components, performance prognostics emerge as a crucial phase in reliability studies of the hydraulic actuator cluster system. Proactive performance prediction enables timely optimization of maintenance strategies to extend service life, thereby significantly enhancing system availability and cost-effectiveness through predictive lifecycle management.
However, conventional life testing or accelerated life testing methodologies often encounter insufficient failure time data acquisition, leading to inherent small-sample challenges. Consequently, small-sample performance prediction methodologies have attracted substantial research attention due to their capability to achieve reliable predictions with limited reference samples. These approaches demonstrate enhanced computational efficiency and prediction accuracy compared to traditional reliability assessment techniques, thereby significantly reducing experimental costs and time expenditures associated with conventional life testing procedures. Current mainstream small-sample performance prediction frameworks primarily encompass three categories: small-sample analysis method [5], data-expansion method [6] and combined prediction method [7].
Commonly used small-sample analysis methods include gray model and Bayes method [8]. The main idea of gray model is to make use of the regularity information in the sample data to predict the unknown data by establishing the appropriate gray model. Abdolmajid et al. [9] used residuals to correct the gray model in order to improve the accuracy of the voltage fluctuation model. Zheng et al. [10] proposed an electric vehicle battery charge state estimation method based on the gray model, which can predict the battery-charge state in real time. Chen et al. [11] proposed a new life prediction model by combining the gray model and the particle filter and successfully predicted the remaining life of the battery accurately. Tomasz et al. [12] applied the gray model to the reliability evaluation of the automobile steering system and evaluated the accuracy of the gray model. Bayes method solves the problem of insufficient data of a small sample test effectively by calculating and analyzing prior information, prior distribution, and posterior distribution. Yang et al. [13] calculated the cumulative failure probability of the anti-skid valve by using the Bayes reliability theory and the MCMC algorithm and obtained the reliability information of the entire anti-skid system. Rodrigues et al. [14] established a three-parameter Weibull Bayes model to evaluate the reliability of the component system and used the Gibbs sampling algorithm for posterior distribution. Fan et al. [15] combined the Bayes method with historical data to accurately predict the remaining service life of LED lights. Ali et al. [16] used the Bayes method to estimate the parameters of the generalized exponential model and predict the performance of electronic devices under different voltages. Zhou et al. [17] used the layered Bayes model to analyze the reliability of transmission line interruptions based on limited interruption data.
Support vector machine and neural network are the main methods of data expansion. Loutas et al. [18] used support vector machine to predict the remaining service life of rolling bearings. Aikhuele et al. [19] proposed a prediction algorithm based on artificial neural networks to predict the future performance development of wind turbine systems. Koley et al. [20] combined the neural network with the Kalman filter and the support vector machine to improve the reliability of transmission lines under nonlinear load conditions. In addition, the Bootstrap method uses the original data to sample data several times, which has a low degree of time complexity, and is also the main method of data expansion. Picheny et al. [21] used the Bootstrap method to compare the results between normal distribution and lognormal distribution and evaluated the reliability of composite panels under thermal load. Lee et al. [22] established confidence intervals for measured samples through the Bootstrap method and then proposed a reliability assessment method based on pseudo-failure data. Rodrigues et al. [23] proposed a Bootstrap method for performance prediction of power-distribution equipment, which significantly improved the upper and lower limits of performance-prediction data. Li et al. [24] used the Bootstrap method to evaluate the reliability of high-quality, long-life products under zero-fault data.
The prediction method combining the small-sample analysis method and the data-expansion method is also the research hotspot in recent years. Zhai et al. [25] combined the Bayes method and the EM algorithm to predict model parameters of degraded data and proved its effectiveness in the small-sample problem of lithium-ion batteries. Liu et al. [26] proposed a gray–Markov model with fractional order accumulation, which shortens the forecasting time for short-term loads and improves the accuracy of forecasting results. Fan et al. [27] combined the particle filter method with the Metropolis–Hastings algorithm to update the relevant parameters of the degradation process and to predict the lifetime of the system. Zhao et al. [28] combined the Bootstrap method with the Bayes method to improve the accuracy of performance prediction for the small-sample problem of explosive initiators. Li et al. [29] made use of the performance degradation characteristics of aero-engines and combined the layered Bayes method with deep neural networks to realize the fusion decision of engine performance degradation assessment.
In summary, existing research achievements primarily focus on performance prediction for individual components, whereas the FAST hydraulic actuators represent a typical cluster system. This study investigates the FAST hydraulic actuator cluster system, with the overarching objective of addressing the small-sample performance prediction problem for this system. Leveraging big data from the FAST active reflector health monitoring system, a spatiotemporal domain-coupled clustering performance prediction method is proposed. For the spatial-domain clustering of the hydraulic actuator cluster system, the clustering feature is the absolute position error, and only hierarchical clustering algorithms are suitable for this purpose. In contrast, the absolute error intervals of individual actuators, serving as temporal-domain clustering features, are relatively concentrated, making partitioned clustering algorithms more appropriate for this context.
By employing a polar coordinate spatial-domain BIRCH clustering-based sample-construction method, the FAST hydraulic actuator cluster system is partitioned into distinct clusters, where actuators within the same cluster share similar characteristics and can serve as reference samples for one another. Additionally, a temporal-domain K-Means clustering-based historical virtual sample-construction method is utilized to process the temporal-domain data of individual actuators, effectively addressing the small-sample problem caused by missing fault data or insufficient reference data in the FAST hydraulic actuator cluster system. In the performance-prediction experiments for the FAST hydraulic actuator cluster system, the proposed algorithm is validated and optimized, significantly enhancing prediction accuracy. This approach achieves high-precision performance prediction, ensuring reliable, efficient, and cost-effective stable operation of the system. Furthermore, it provides a solution to the challenge of insufficient reference samples in similar complex systems, offering valuable insights for performance prediction in complex systems.

2. Data Preprocessing of the FAST Health Monitoring System

The FAST hydraulic actuator adopts an integrated design approach, where the hydraulic system, electrical control components, and sensors are collectively installed. The actuator is secured to the cylinder tube of the hydraulic cylinder using an encircling fixture. Two sets of pipelines connect the non-rod chamber and the rod chamber of the hydraulic cylinder to the corresponding interfaces on the valve block, forming a complete hydraulic actuation system. Additionally, a built-in central displacement sensor is incorporated within the hydraulic cylinder to provide real-time position feedback, enabling closed-loop control of the system. The overall structure of the hydraulic actuator is illustrated in Figure 1.
The health monitoring system of the FAST active reflector ensures its normal operation and long-term stability by conducting real-time monitoring of the structure and equipment. It mainly includes five parts: environmental monitoring, structural monitoring, cable network monitoring, actuator monitoring, and node position monitoring [30]. The health-monitoring system structure is shown in Figure 2.
Due to the large amount of system data, part of the original monitoring data of the actuator at a certain time is shown in Table 1. In the table, “Device ID” indicates the number of the actuator. “Control Theory” is the theoretical Control position of the actuator, and “Control Actual” is the actual position of the actuator detected by the position sensor, both in mm. “Control Temperature” and “Control Pressure” are the temperature and pressure of the hydraulic oil in the actuator hydraulic system, in °C and kPa, respectively.
According to the data provided by the National Astronomical Observatories of the Chinese Academy of Sciences, a total of 1,602,000 sets of data are selected from 14:15 to 15:15 on 5 July 2019 for data cleaning. The original data collected by the FAST active reflector health monitoring system is collected at the specified sampling frequency, and its data processing process is shown in Figure 3.
The key process in data cleaning is reliability test. The FAST active reflector health monitoring system collects a large amount of data. To ensure the accuracy and reliability of data analysis, the 3 σ principle commonly used in engineering applications is adopted to eliminate outliers [31]. Outliers are defined as data points that deviate from the arithmetic mean of the dataset by more than three times the standard deviation. The 3 σ principle expression is as follows:
x i x ¯ > 3 σ
There may be multiple outliers in the same data column. When the outlier is removed, the arithmetic mean and standard deviation of the remaining data should be recalculated, and the existence of other outliers should be rejudged. This process should be repeated until there are no outliers in the data column.

3. Spatiotemporal Domain-Coupled Clustering Method

This chapter proposes a spatiotemporal domain-coupled clustering method to address the spatial distribution patterns and temporal data characteristics of the FAST hydraulic actuator cluster system. The specific details and design of the spatial-domain BIRCH clustering method and the temporal-domain K-Means clustering method are described in detail.

3.1. Spatial-Domain BIRCH Clustering Method for Hydraulic Actuator

3.1.1. Polar Coordinate of the Spatial Position of the Hydraulic Actuator

The actuators in the FAST hydraulic actuator cluster system are arranged according to the arithmetic sequence from the internal minimum ring to the external maximum number of rings. The minimum ring is five actuators; five actuators are added for each of the first 28 rings, the maximum ring is 195 actuators, for a total of 29 rings. At the same time, the actuators are arranged clockwise from 0° to 360°, and from the innermost ring to the outermost ring, the average value of the number of actuators is taken to determine the pole diameter and pole angle of the spatial position of the actuators. The actual position of the actuator is drawn into the polar diagram through Python (v. 3.8.0) programming; a circular spatial domain is plotted using the numpy and matplotlib packages. The 2225 hydraulic actuators within the actuator cluster system are numbered, and the angular and radial distributions are assigned according to the arrangement pattern. The spatial polar coordinate system is defined, as shown in Figure 4. Ultimately, a one-to-one correspondence between the actual positions of the 2225 hydraulic actuators in the FAST hydraulic actuator cluster system and their positions in polar coordinates is achieved. This approach not only facilitates the observation of clustering results but also aligns with the physical reality, thereby providing practical guidance for on-site maintenance.

3.1.2. Spatial Clustering Feature Selection

The FAST hydraulic actuator cluster system consists of 2225 hydraulic actuators, with each actuator functioning as a subsystem of the overall system. For the FAST hydraulic actuator cluster system, the control precision of each hydraulic actuator directly influences the shape of the target reflection surface of the actuator cluster system, thereby directly affecting scientific observations. Based on the surface fitting requirements for the reflection surface, each hydraulic actuator has a theoretical position. The health monitoring system of the hydraulic actuator continuously tracks the real-time deviation between the theoretical and actual positions of the actuators. The theoretical and actual positions of the hydraulic actuators are critical parameters for the actuator cluster system. Furthermore, the absolute position error of the hydraulic actuator reflects changes in actuator performance, serving as a clustering feature with greater discriminative power and identificatory significance.
Therefore, in the process of spatial clustering, the absolute error feature is selected to describe the spatial position and distribution of data points, thereby facilitating the grouping of data points. The absolute error is defined as the absolute value of the difference between the actual position and the theoretical position of the actuator [32], which reflects the precision and stability of the actuator’s motion. The equation for calculating the absolute error is as follows:
Δ d = d a d t
where Δ d is the absolute error of the hydraulic actuator: d a is the actual position of the hydraulic actuator; d t is the theoretical position of the hydraulic actuator.

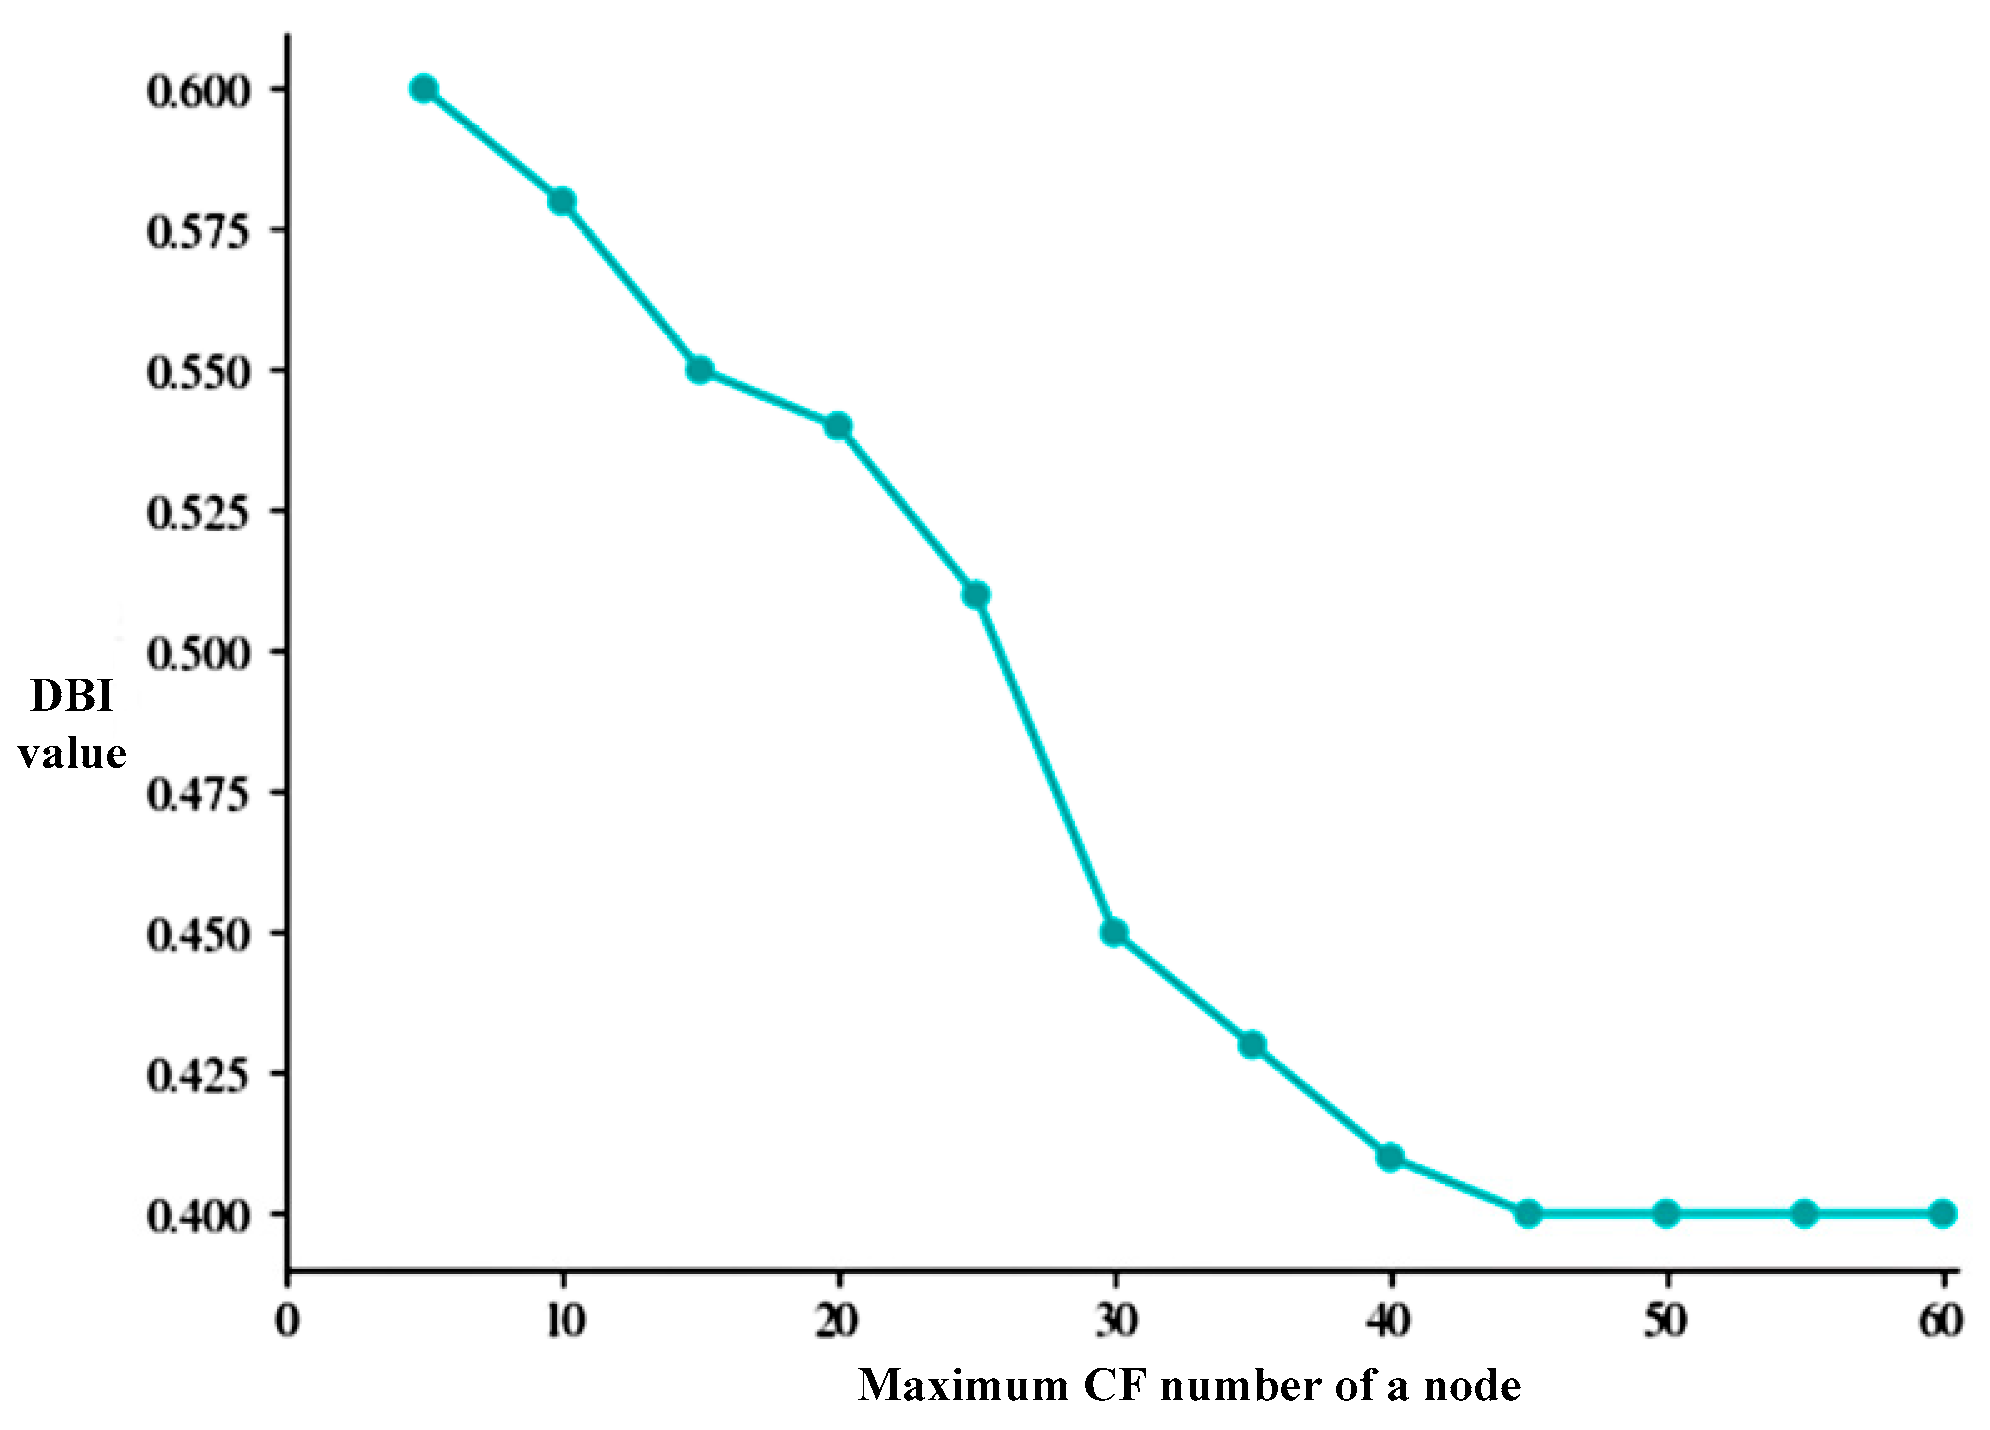
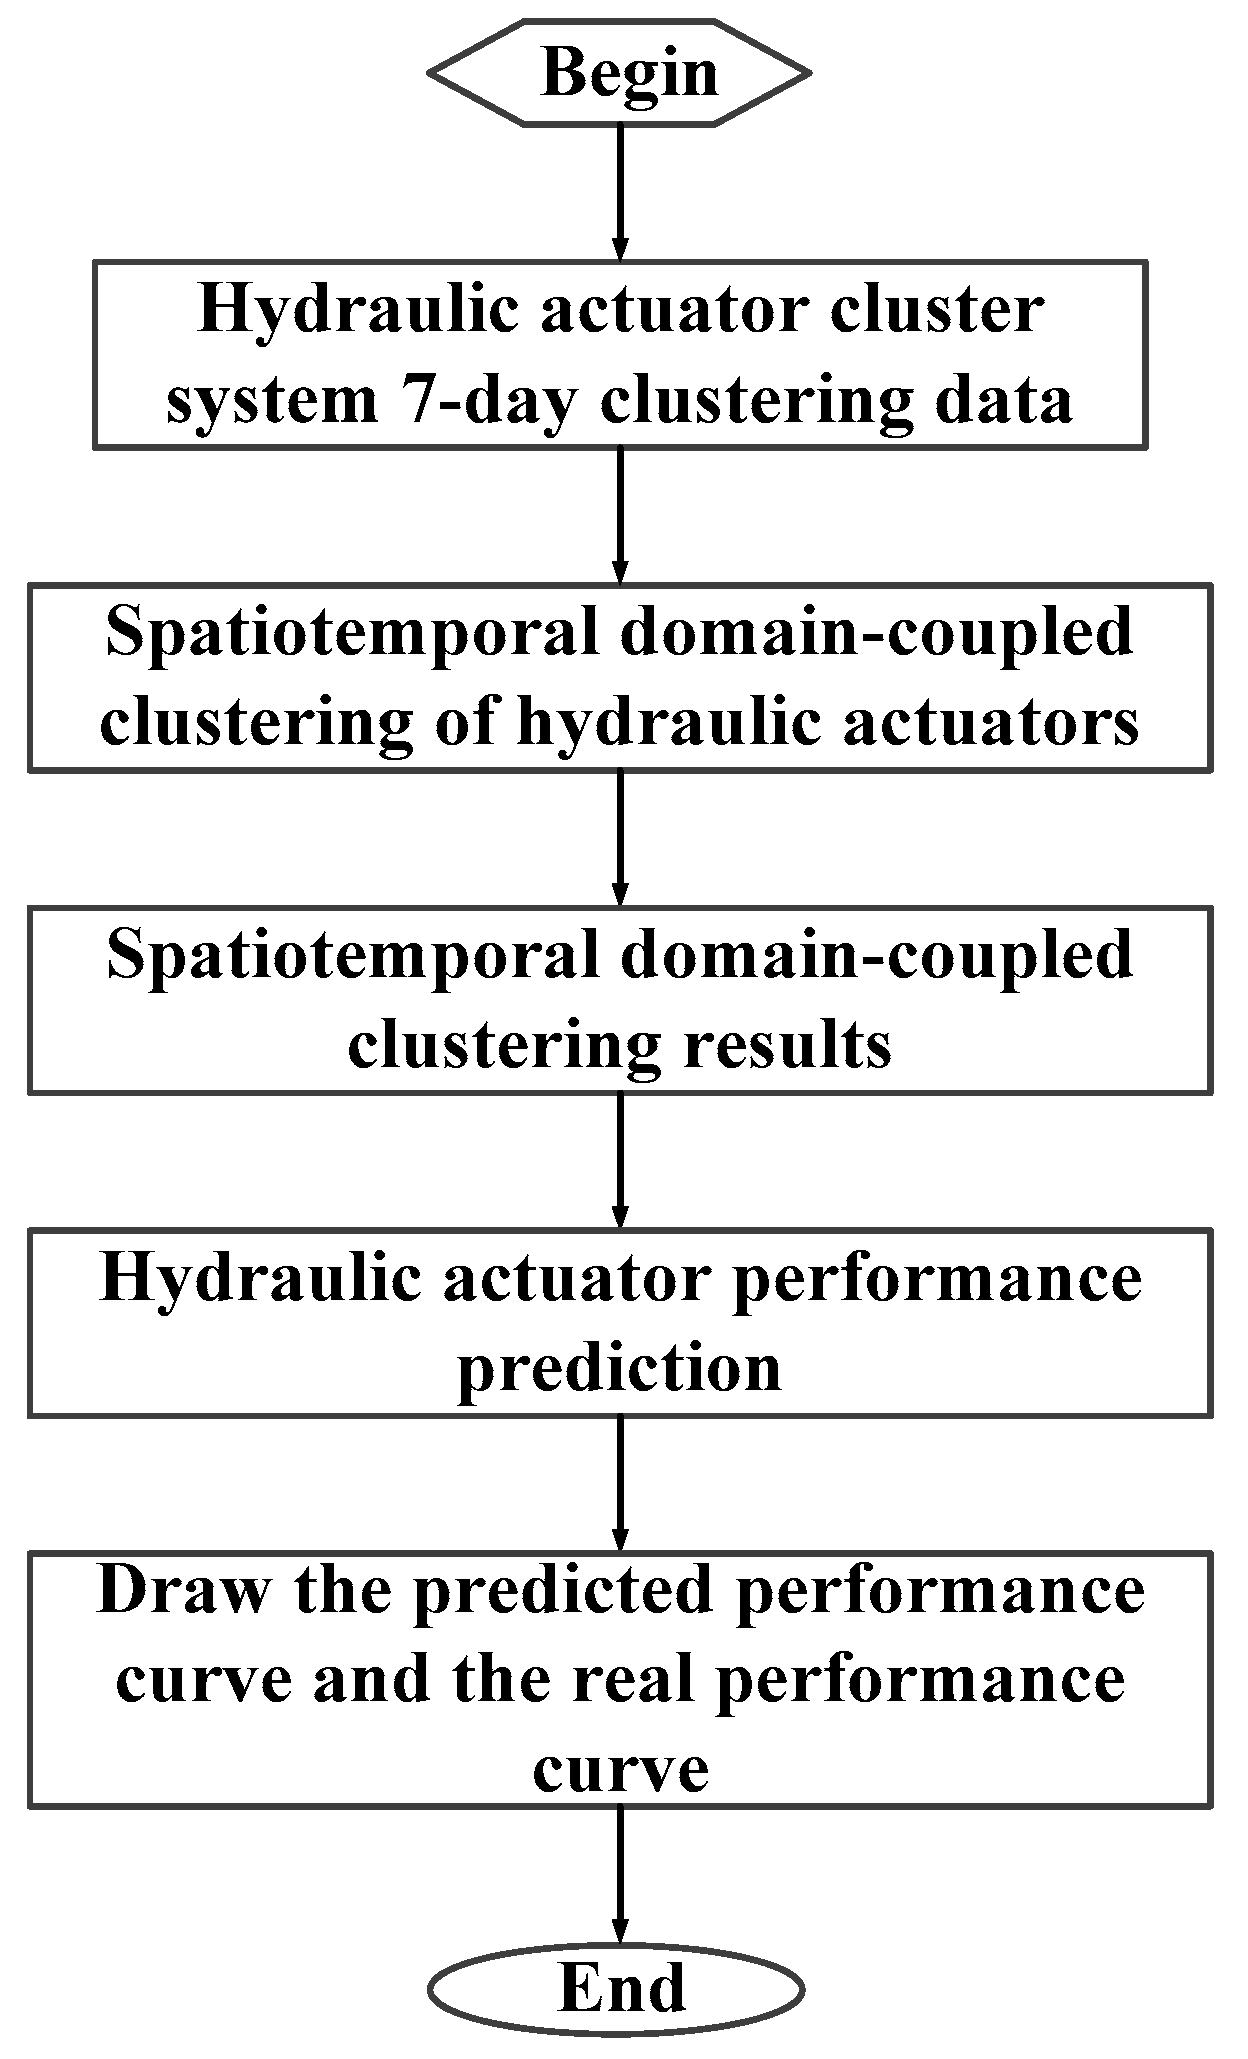
3.1.3. The Main Process of Spatial-Domain BIRCH Clustering

(1)
Initialize, set the maximum number of data items B allowed in the leaf node and the maximum number of nodes L that can be accommodated in the memory;
(2)
Establish a CF tree, calculate their centroid and radius by scanning the data set, take B data as the unit, and insert operations in the CF tree until all data in the data set are processed;
(3)
Cluster, traverse the CF tree, and process each node as follows.
If the node is a leaf node, a new family is generated and the centroid and number of data items of the family are set to the centroid and number of data items of the node. If the node is a non-leaf node, the family of all nodes of the node is merged into a family, and the centroid and number of data items of the family are set to the centroid and number of data items of the merged family.
(4)
Compress the CF tree, traverse the CF tree, and perform the following processing for each node.
If the node is not a leaf node, the distance of all children of the node to the node is calculated and saved in a distance matrix;
If the node is a leaf node, the data item of the node is inserted into the distance matrix, and the distance between the data item and other data items is calculated;
Applying the hierarchical clustering algorithm to the distance matrix, a new CF tree is obtained, in which the number of nodes does not exceed L.
(5)
Repeat steps (3) and (4) until there is only one family left in the compressed CF tree, or compression cannot continue.
The BIRCH algorithm needs to determine the maximum sample radius threshold τ and the maximum CF number β of internal nodes. The Davies–Bouldin Index (DBI) is used to evaluate the influence of different τ and β on BIRCH clustering results. The DBI is measured by the ratio of the sum of sample average values within any two families to the distance between the families [33], and the average value of this measure for all families is investigated. The calculation equation is as follows:
D B I = 1 K k = 1 K max k l d a ν g C k + d a ν g C l d c e n C k , C l
The smaller the average distance between samples within each cluster, the smaller the DBI; conversely, the greater the distance between the centroids of different clusters, the larger the DBI. A smaller DBI indicates that samples within clusters are more closely grouped, thereby reflecting better clustering performance.
When K is unknown by default, the evaluation results of DBI are shown in Figure 5 and Figure 6. And then we end up with τ = 5 and β = 45 .

3.2. Temporal-Domain K-Means Clustering Method for Hydraulic Actuator

3.2.1. Temporal-Domain K-Means Clustering Algorithm Principle
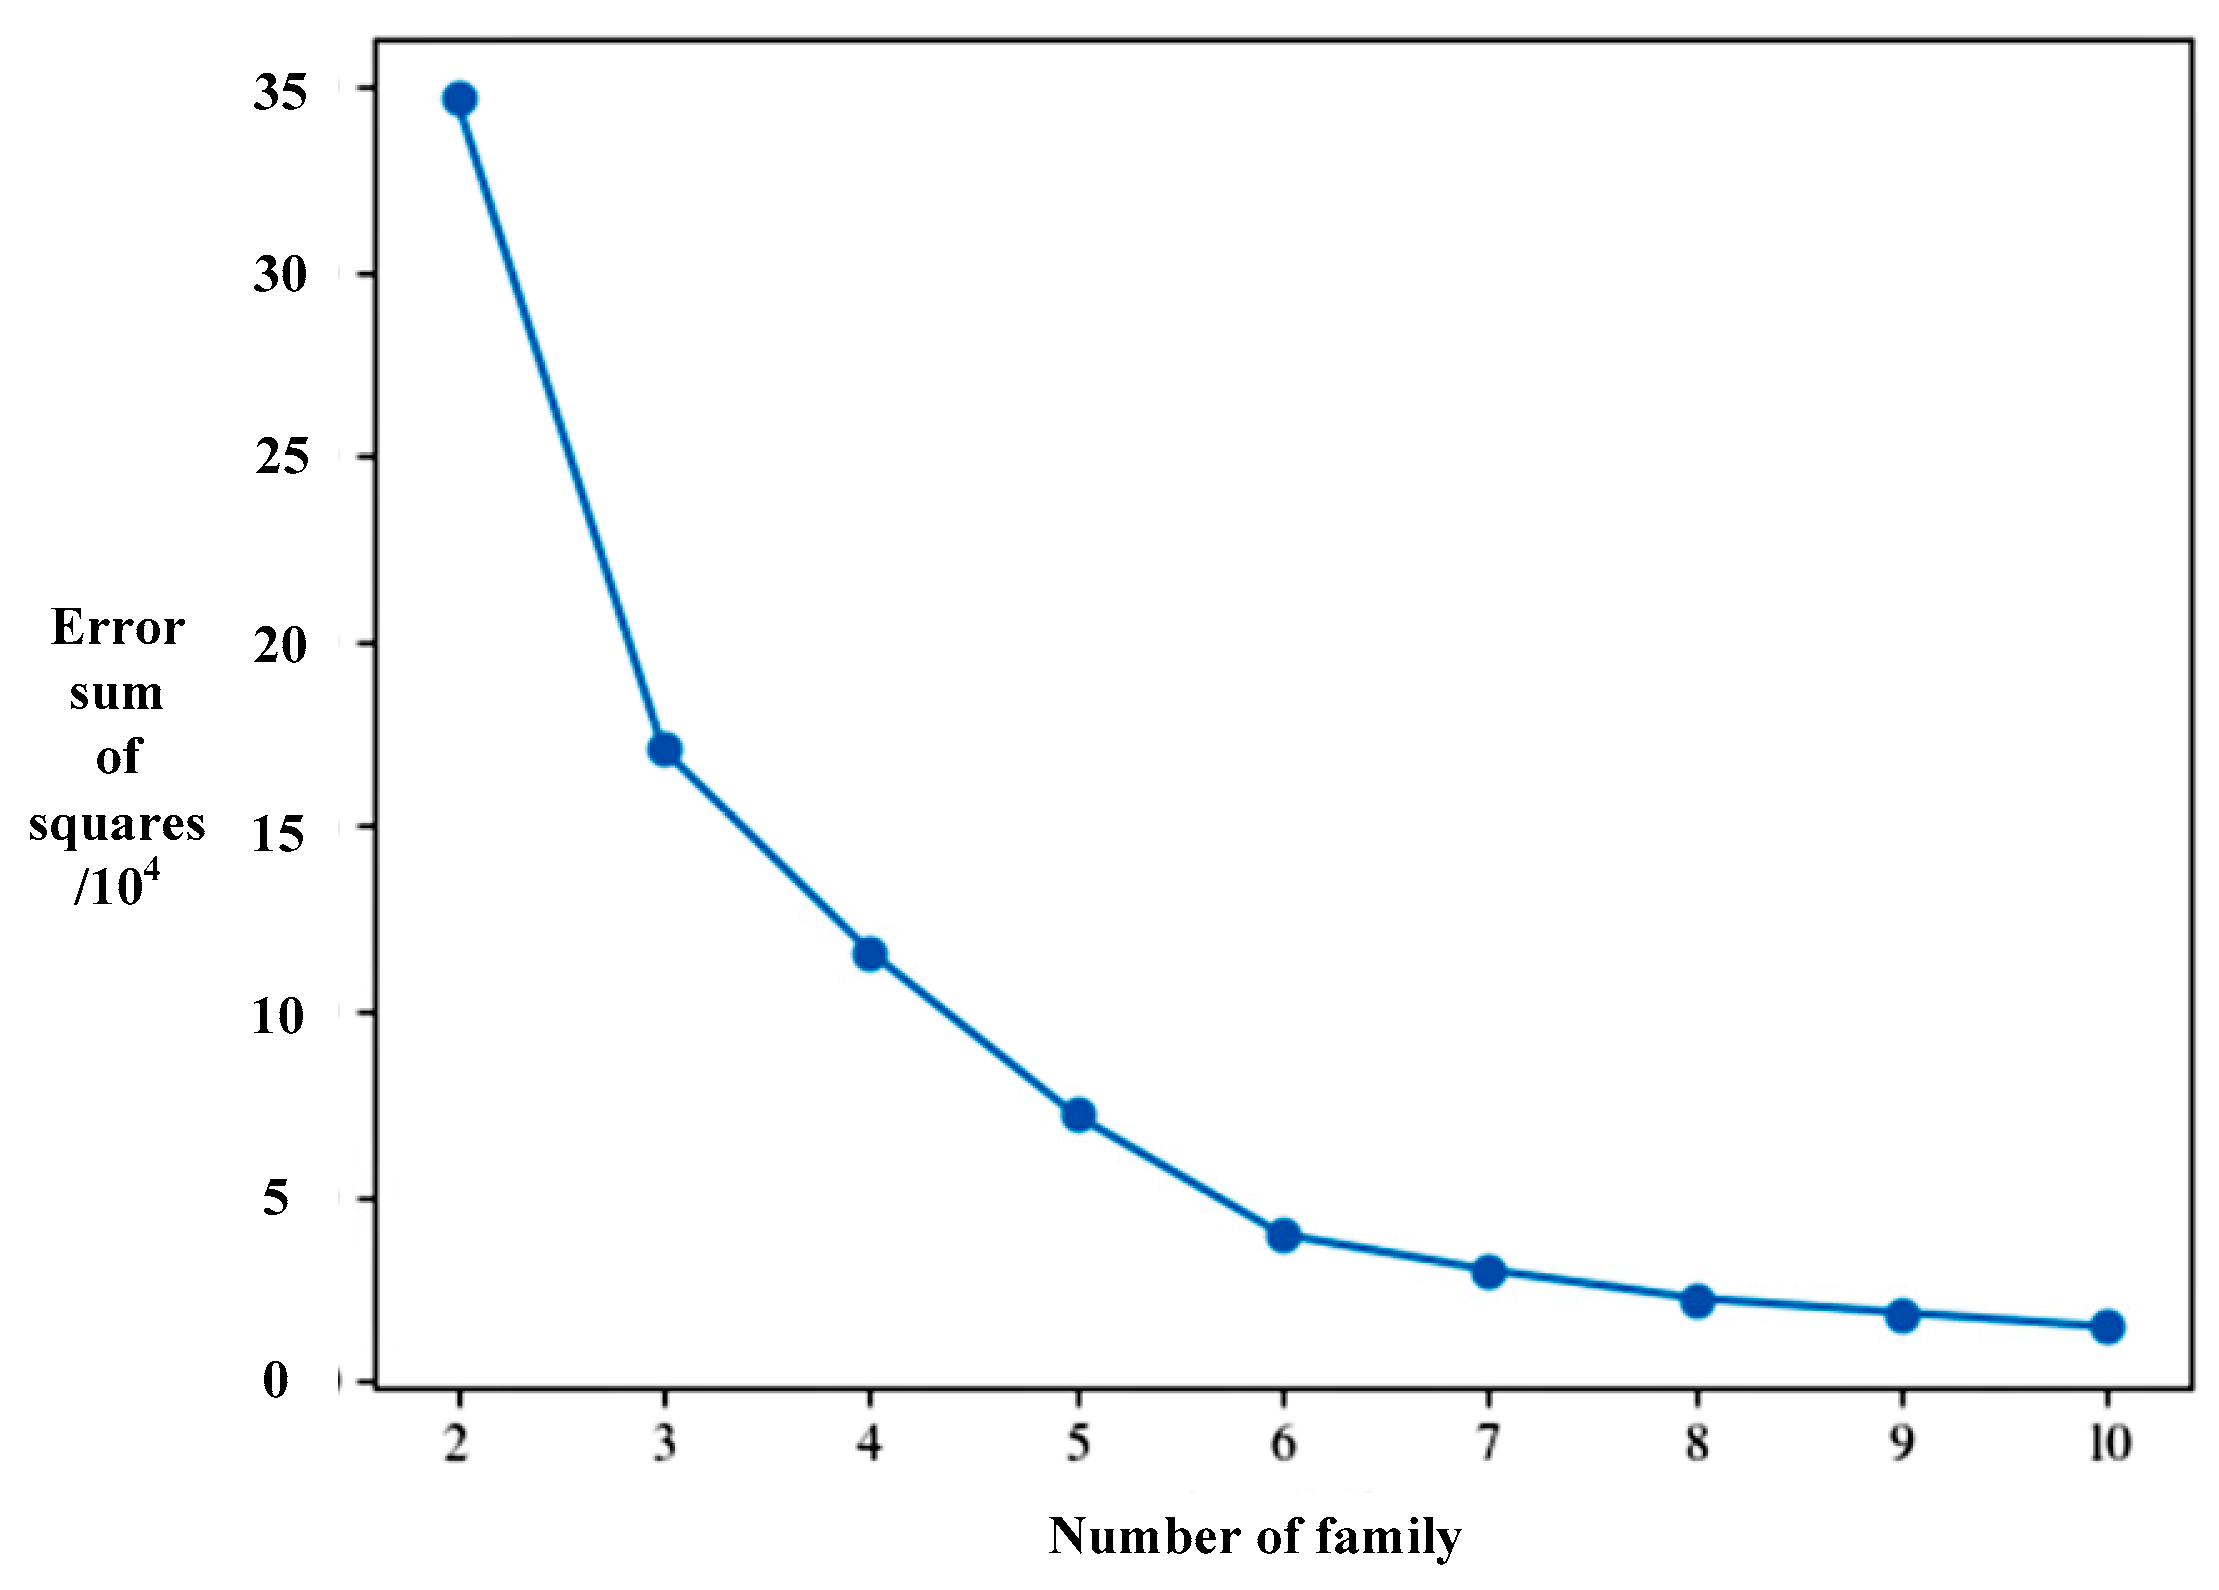
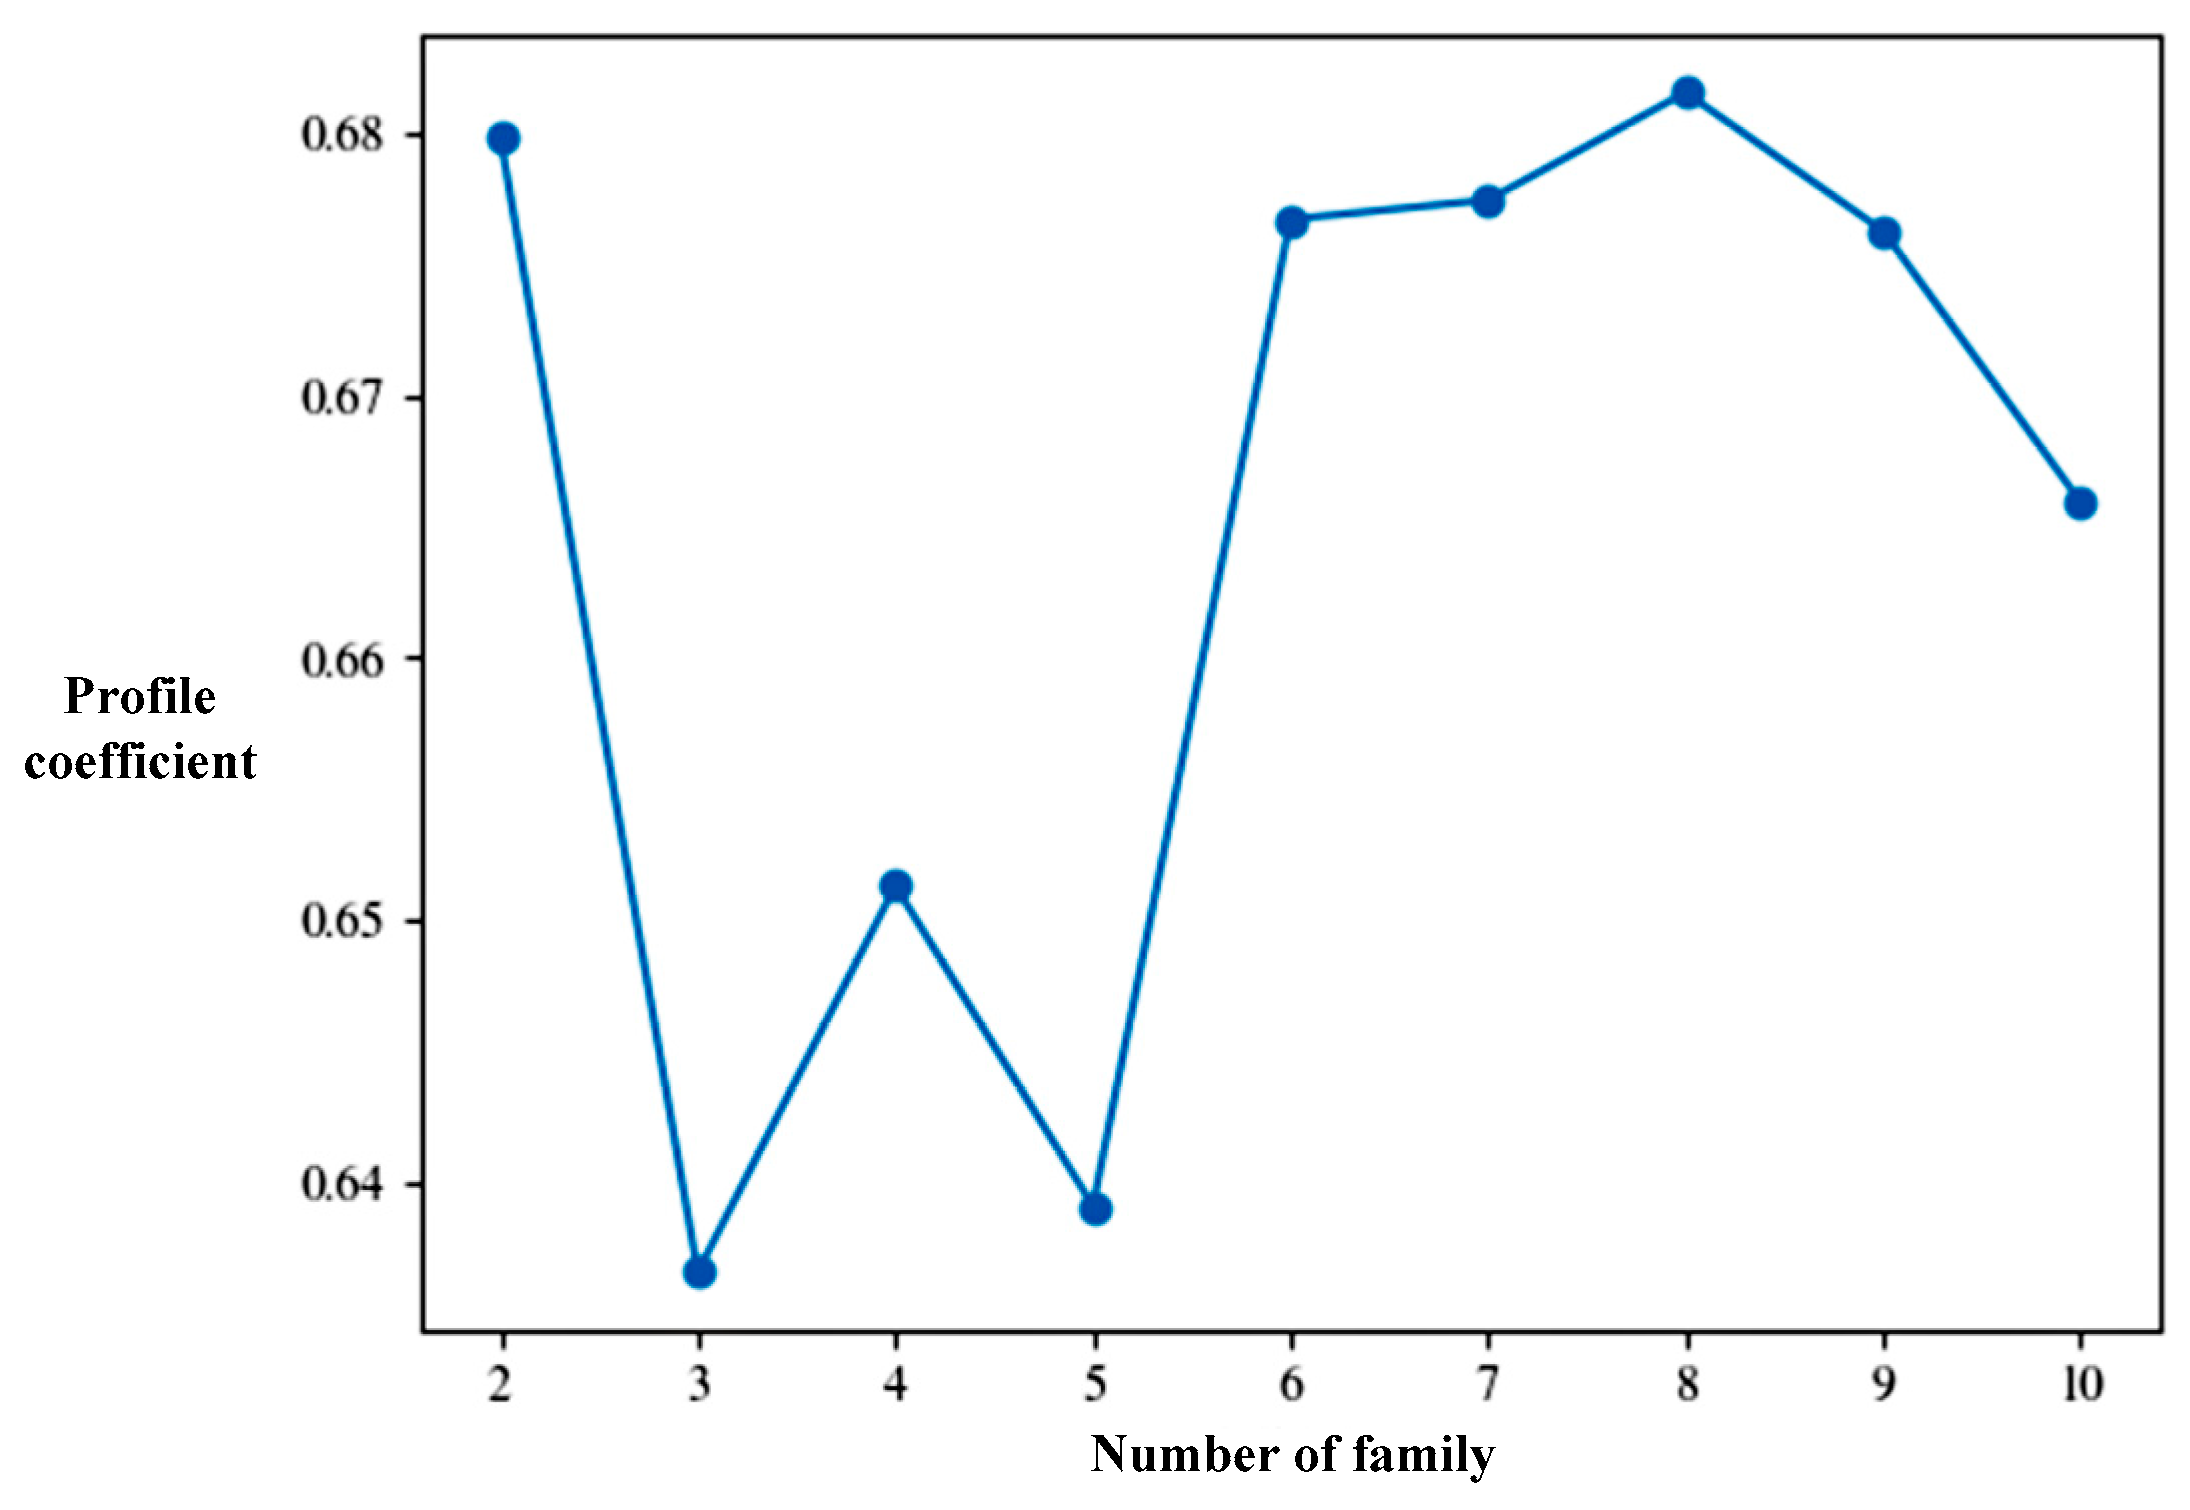
The K-Means clustering algorithm randomly selects data points from the data set as the initial cluster center, calculates the distance between each data point and each cluster center, and assigns it to the cluster center closest to it. Each cluster center and the data points assigned to them represent a cluster. As data points are continuously allocated and cluster centers are continuously adjusted, the cluster centers of each cluster are recalculated until the cluster centers no longer change or reach a predetermined number of iterations.
Let the original data set be X = { x 1 , x 2 , , x m } , and x j R n , K-Means clustering divides the original data into class K under the condition that the given family number is K ( K m ) , then C = { C 1 , C 2 , , C K } .
Take u k as the cluster center of C k , and the Equation (4) is obtained:
μ k = 1 C k x j C k x j
where C k is the number of objects in family C k .
In the iterative process, the sum of squares of the distance between each data point and the cluster center where the data is located is called the sum of squares of error [34], and the calculation formula is shown in (5):
S S E = k = 1 K x j C k x j μ k 2
Therefore, the goal of K-Means iteration is to minimize the sum of squares of error.
In the temporal-domain clustering, the absolute error feature is also used to describe the position and distribution of data points on the time axis. The feature of the temporal-domain clustering is shown in Equation (2).

3.2.2. Determination of the Optimal K Value

The K-Means algorithm needs to determine the value of K , that is, the number of divided families, in advance, which can be determined by the elbow method and the contour coefficient [35] in the clustering evaluation index.
The temporal-domain clustering data of the 184th hydraulic actuator is selected, and the elbow method is used to determine the optimal K value. First, assuming that the number of the temporal-domain clustering family of the 184th hydraulic actuator is no more than 10, the sum of squared errors of all values of K value between 2 and 11 are calculated, respectively, and the elbow diagram of the sum of squared errors of all values of K value between 2 and 11 is drawn, as shown in Figure 7.
The temporal-domain clustering data of the 184th hydraulic actuator determine the elbow K value of 8 in advance by the elbow method. To ensure accuracy, the silhouette coefficient is used to determine the choice of the best value again. Assuming that the number of temporal-domain clustering clusters for hydraulic actuators does not exceed 10, the silhouette coefficient for cluster number K ranging from 2 to 11 is calculated. The resulting silhouette coefficient plot is illustrated in Figure 8. When K is finally confirmed to be 8, the silhouette coefficient is the largest, and the temporal-domain clustering effect of hydraulic actuators is the best.

4. Analysis of Spatiotemporal Domain-Coupled Clustering Result

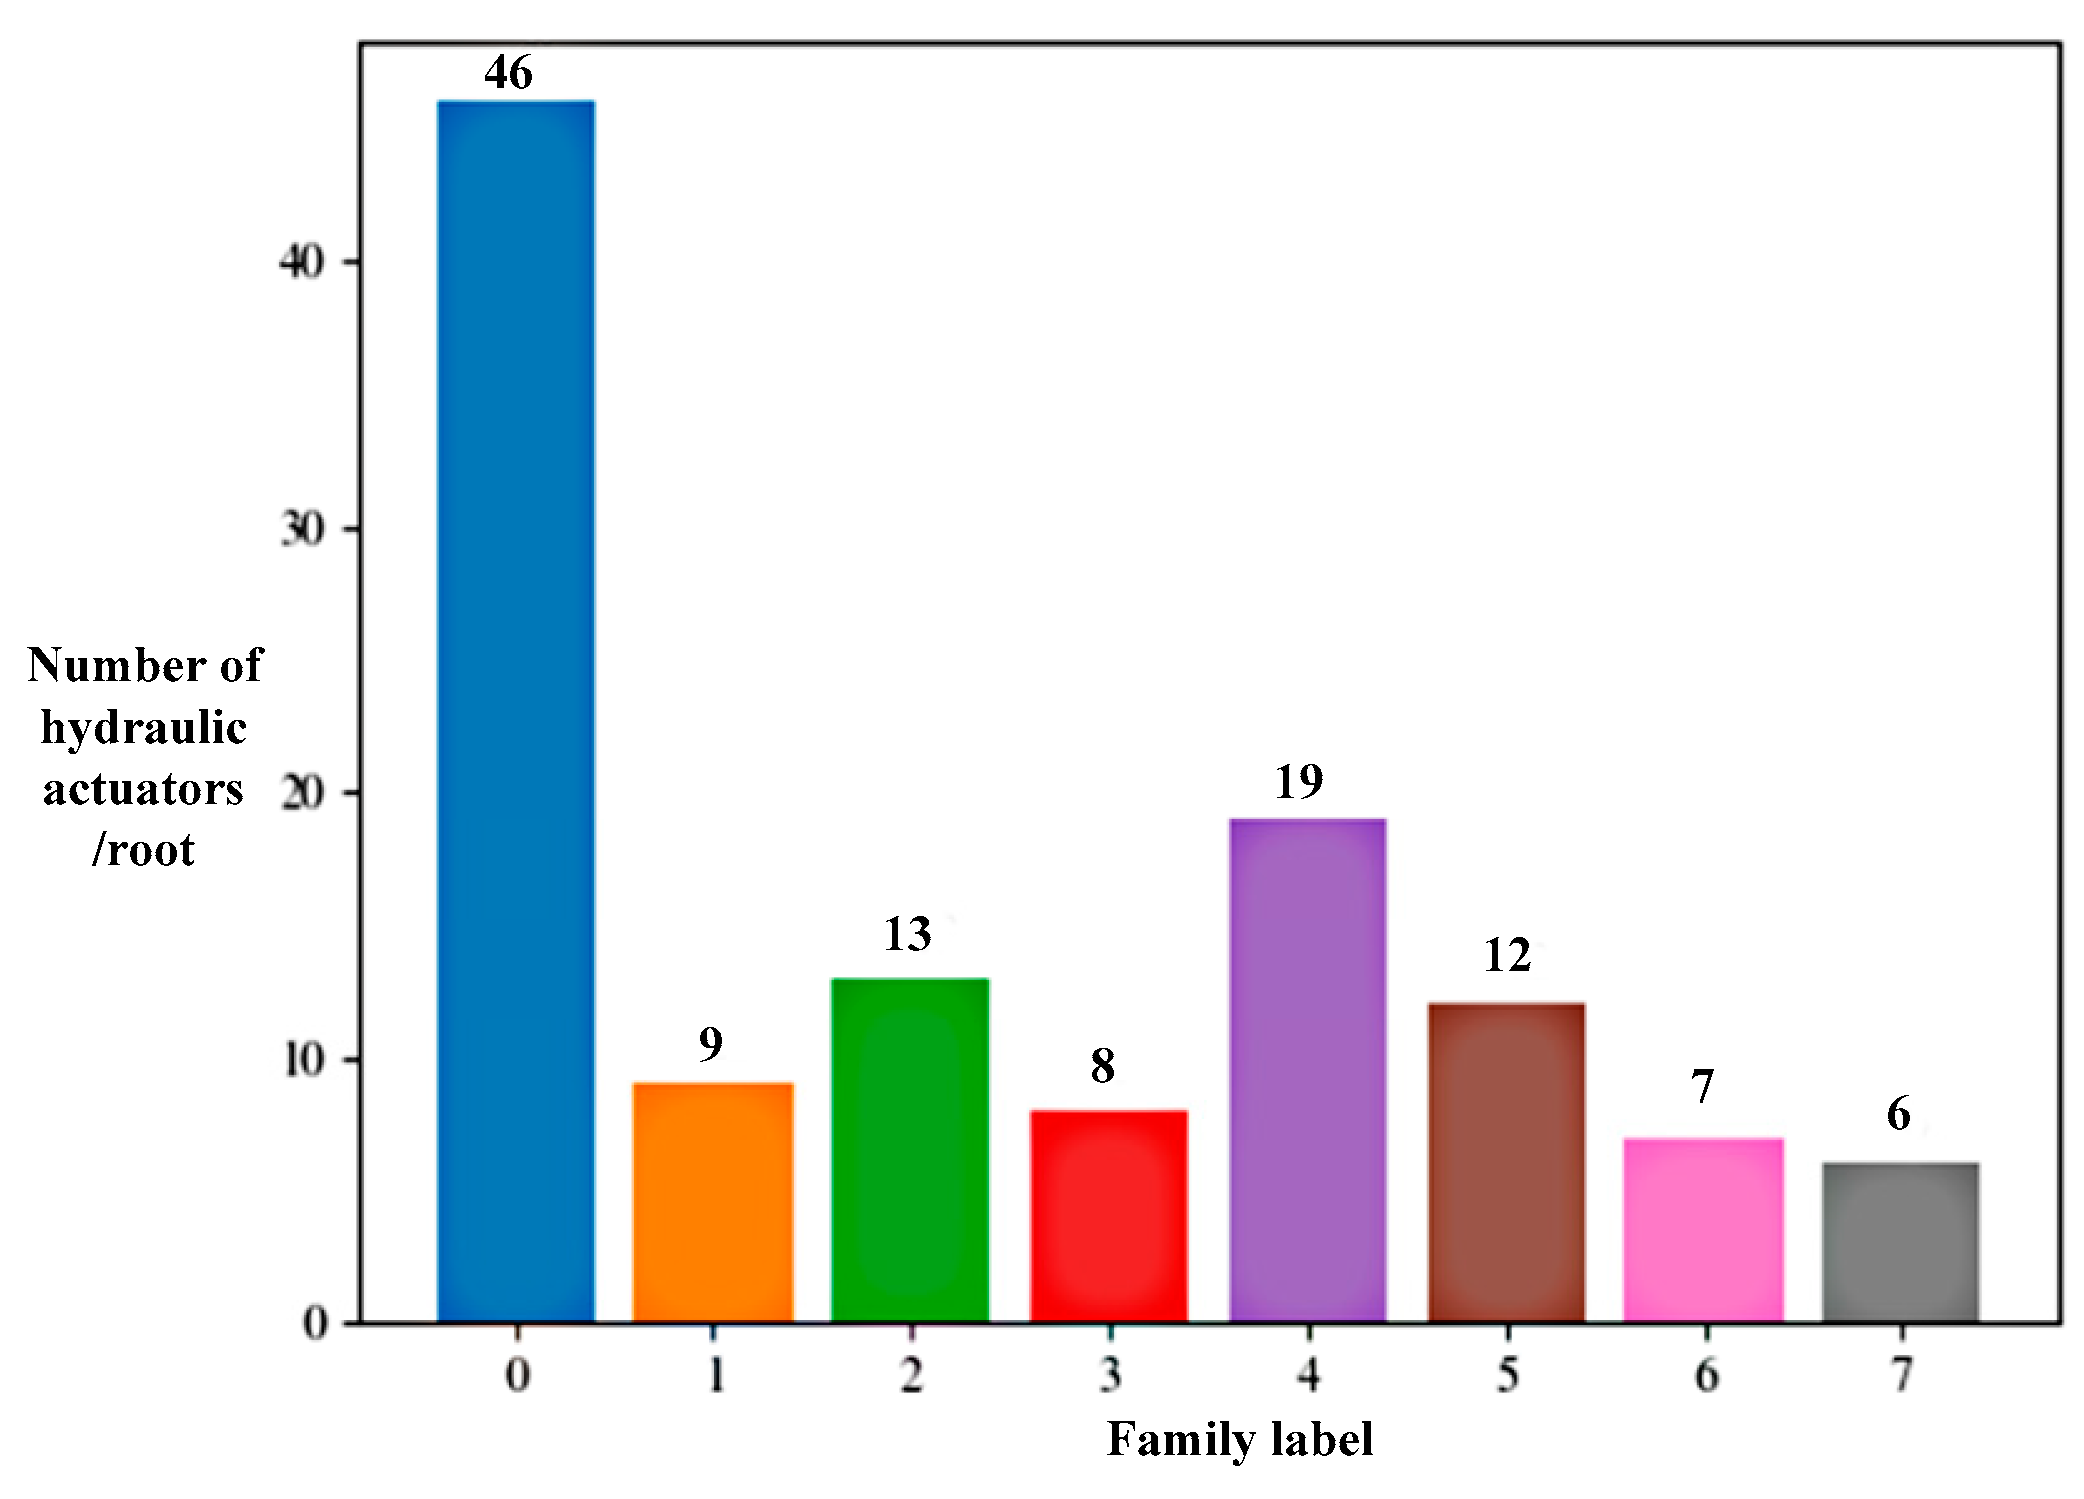
4.1. Analysis of Spatial-Domain BIRCH Clustering Result

According to the data provided by the National Astronomical Observatories, the data at 14:15 on 5 July 2019 is selected as the spatial-domain BIRCH clustering data of the hydraulic actuator cluster system, and the clustering results are shown in Figure 9.
The 2225 hydraulic actuators in the cluster system are divided into 83 families according to different absolute errors. The basic requirements of the national standard for the number of samples used for reliability analysis and life evaluation using the Weibull method [36] are that the number of reference samples can only be used when the number of Weibull is more than 7, and more than 11 is the optimal. According to this standard, the number of statistical hydraulic actuators in 1–7, 8–11, 12–50, 51–100, and more than 100 families are shown in Figure 10.
There are 42 families containing 1–7 actuators, one family containing 8–11 actuators, 29 families containing 12–50 actuators, seven families containing 51–100 actuators, and four families containing more than 100 actuators. In the spatial-domain BIRCH clustering of the hydraulic actuator cluster system, there are still many cases where there is only one hydraulic actuator in many families, and the hydraulic actuators in this case still have no samples that can be referred to one another. Therefore, it is necessary to construct the virtual sample parameters through the temporal-domain clustering of a single hydraulic actuator.

4.2. Analysis of Temporal-Domain K-Means Clustering Result

In the spatial-domain BIRCH clustering of the hydraulic actuator cluster system, the 184th hydraulic actuator is a single family. According to the data provided by the National Astronomical Observatories, the clustering data of the 184th hydraulic actuator in July 2019 is selected for temporal-domain K-Means clustering; one data point is taken every 6 h, and the family number value is set to 8. The temporal-domain K-Means clustering result of the absolute error of the 184th hydraulic actuator is shown in Figure 11, where the largest family is the 0 family with the smallest error, indicating that the hydraulic actuator cluster system can maintain a high position accuracy most of the time.
According to the temporal-domain K-Means clustering results of the absolute error of the 184th hydraulic actuator in Figure 11, the number of hydraulic actuator data contained in each family is shown in Figure 12. According to the Weibull method, among the data participating in temporal-domain K-Means clustering, only the seventh family contains six groups of data, and the other seven families have more than seven groups of data. In summary, the temporal-domain K-Means clustering of virtual samples is constructed by introducing the full-time temporal-domain data of a single actuator to solve the problem of lack of reference samples in some families in spatial-domain clustering.
When the spatiotemporal domain-coupled clustering is completed, the category of each point of the hydraulic actuator cluster system will be saved to its own attribute table, which contains the time, root number, and category of all the recording points of the hydraulic actuator cluster system. After categorizing each point in the hydraulic actuator cluster system, a comparative analysis is performed on the differing recording temporal, spatial locations, and individual performance variation trends among points belonging to the same category. This analysis serves to assess the quality of the clustering and predict the performance variation trends of the hydraulic actuators.

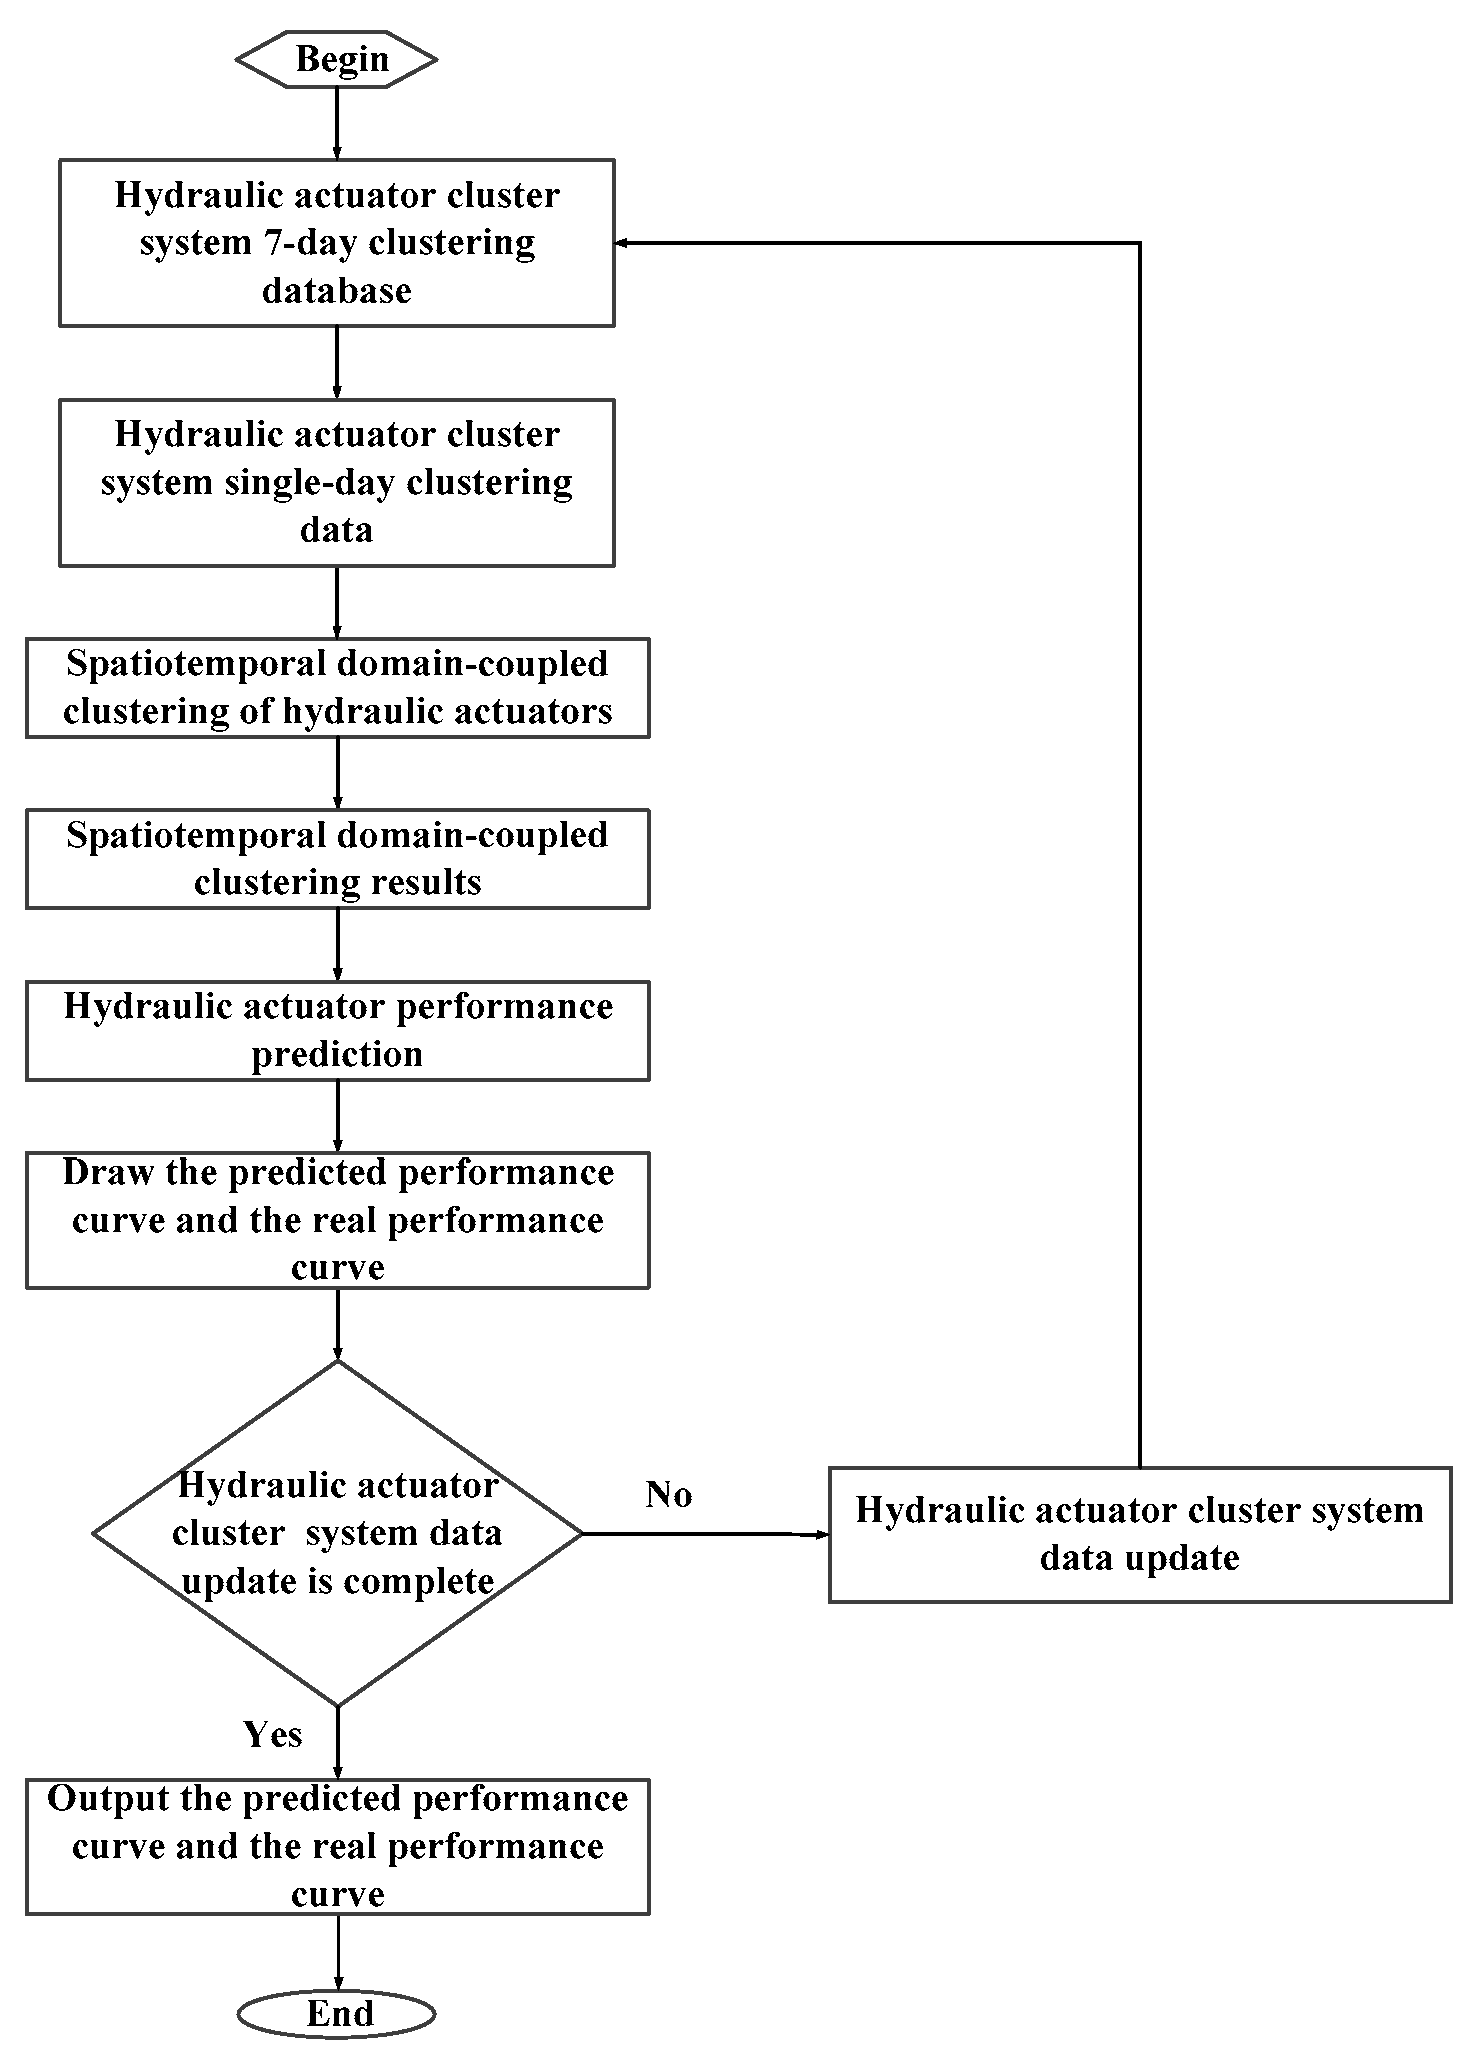
5. Validation and Optimization of Spatiotemporal Domain-Coupled Clustering Prediction Algorithm

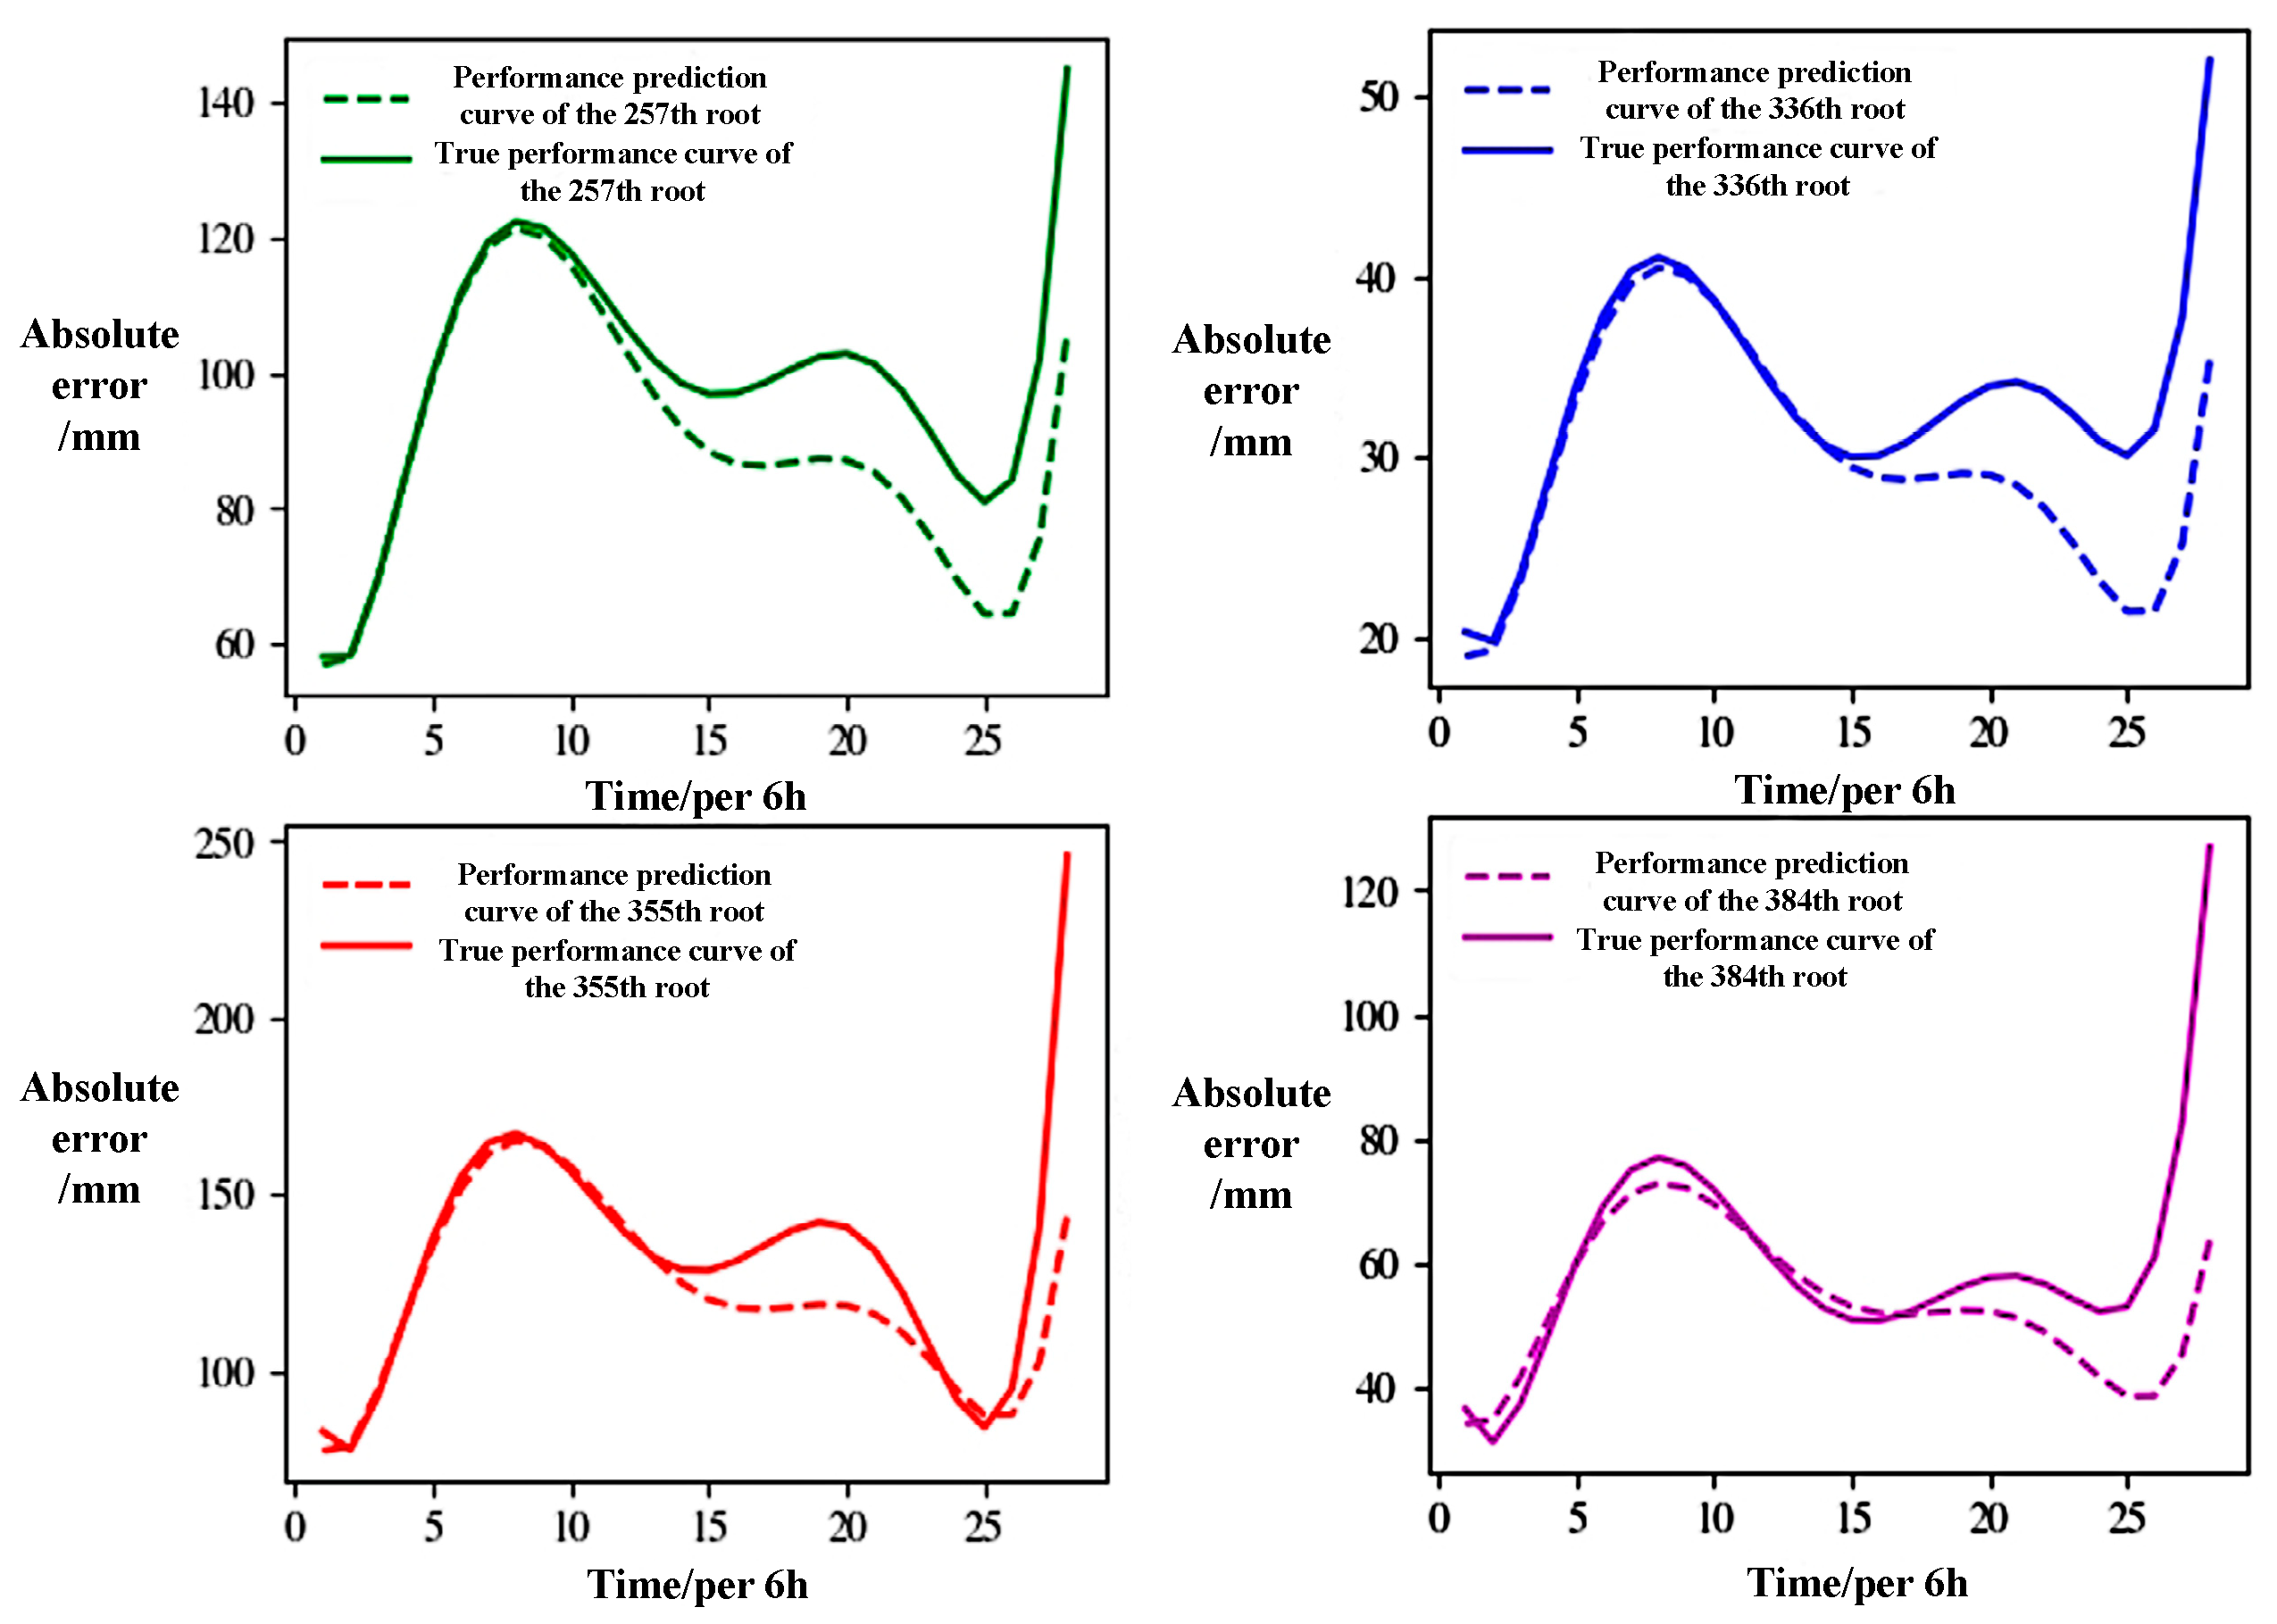
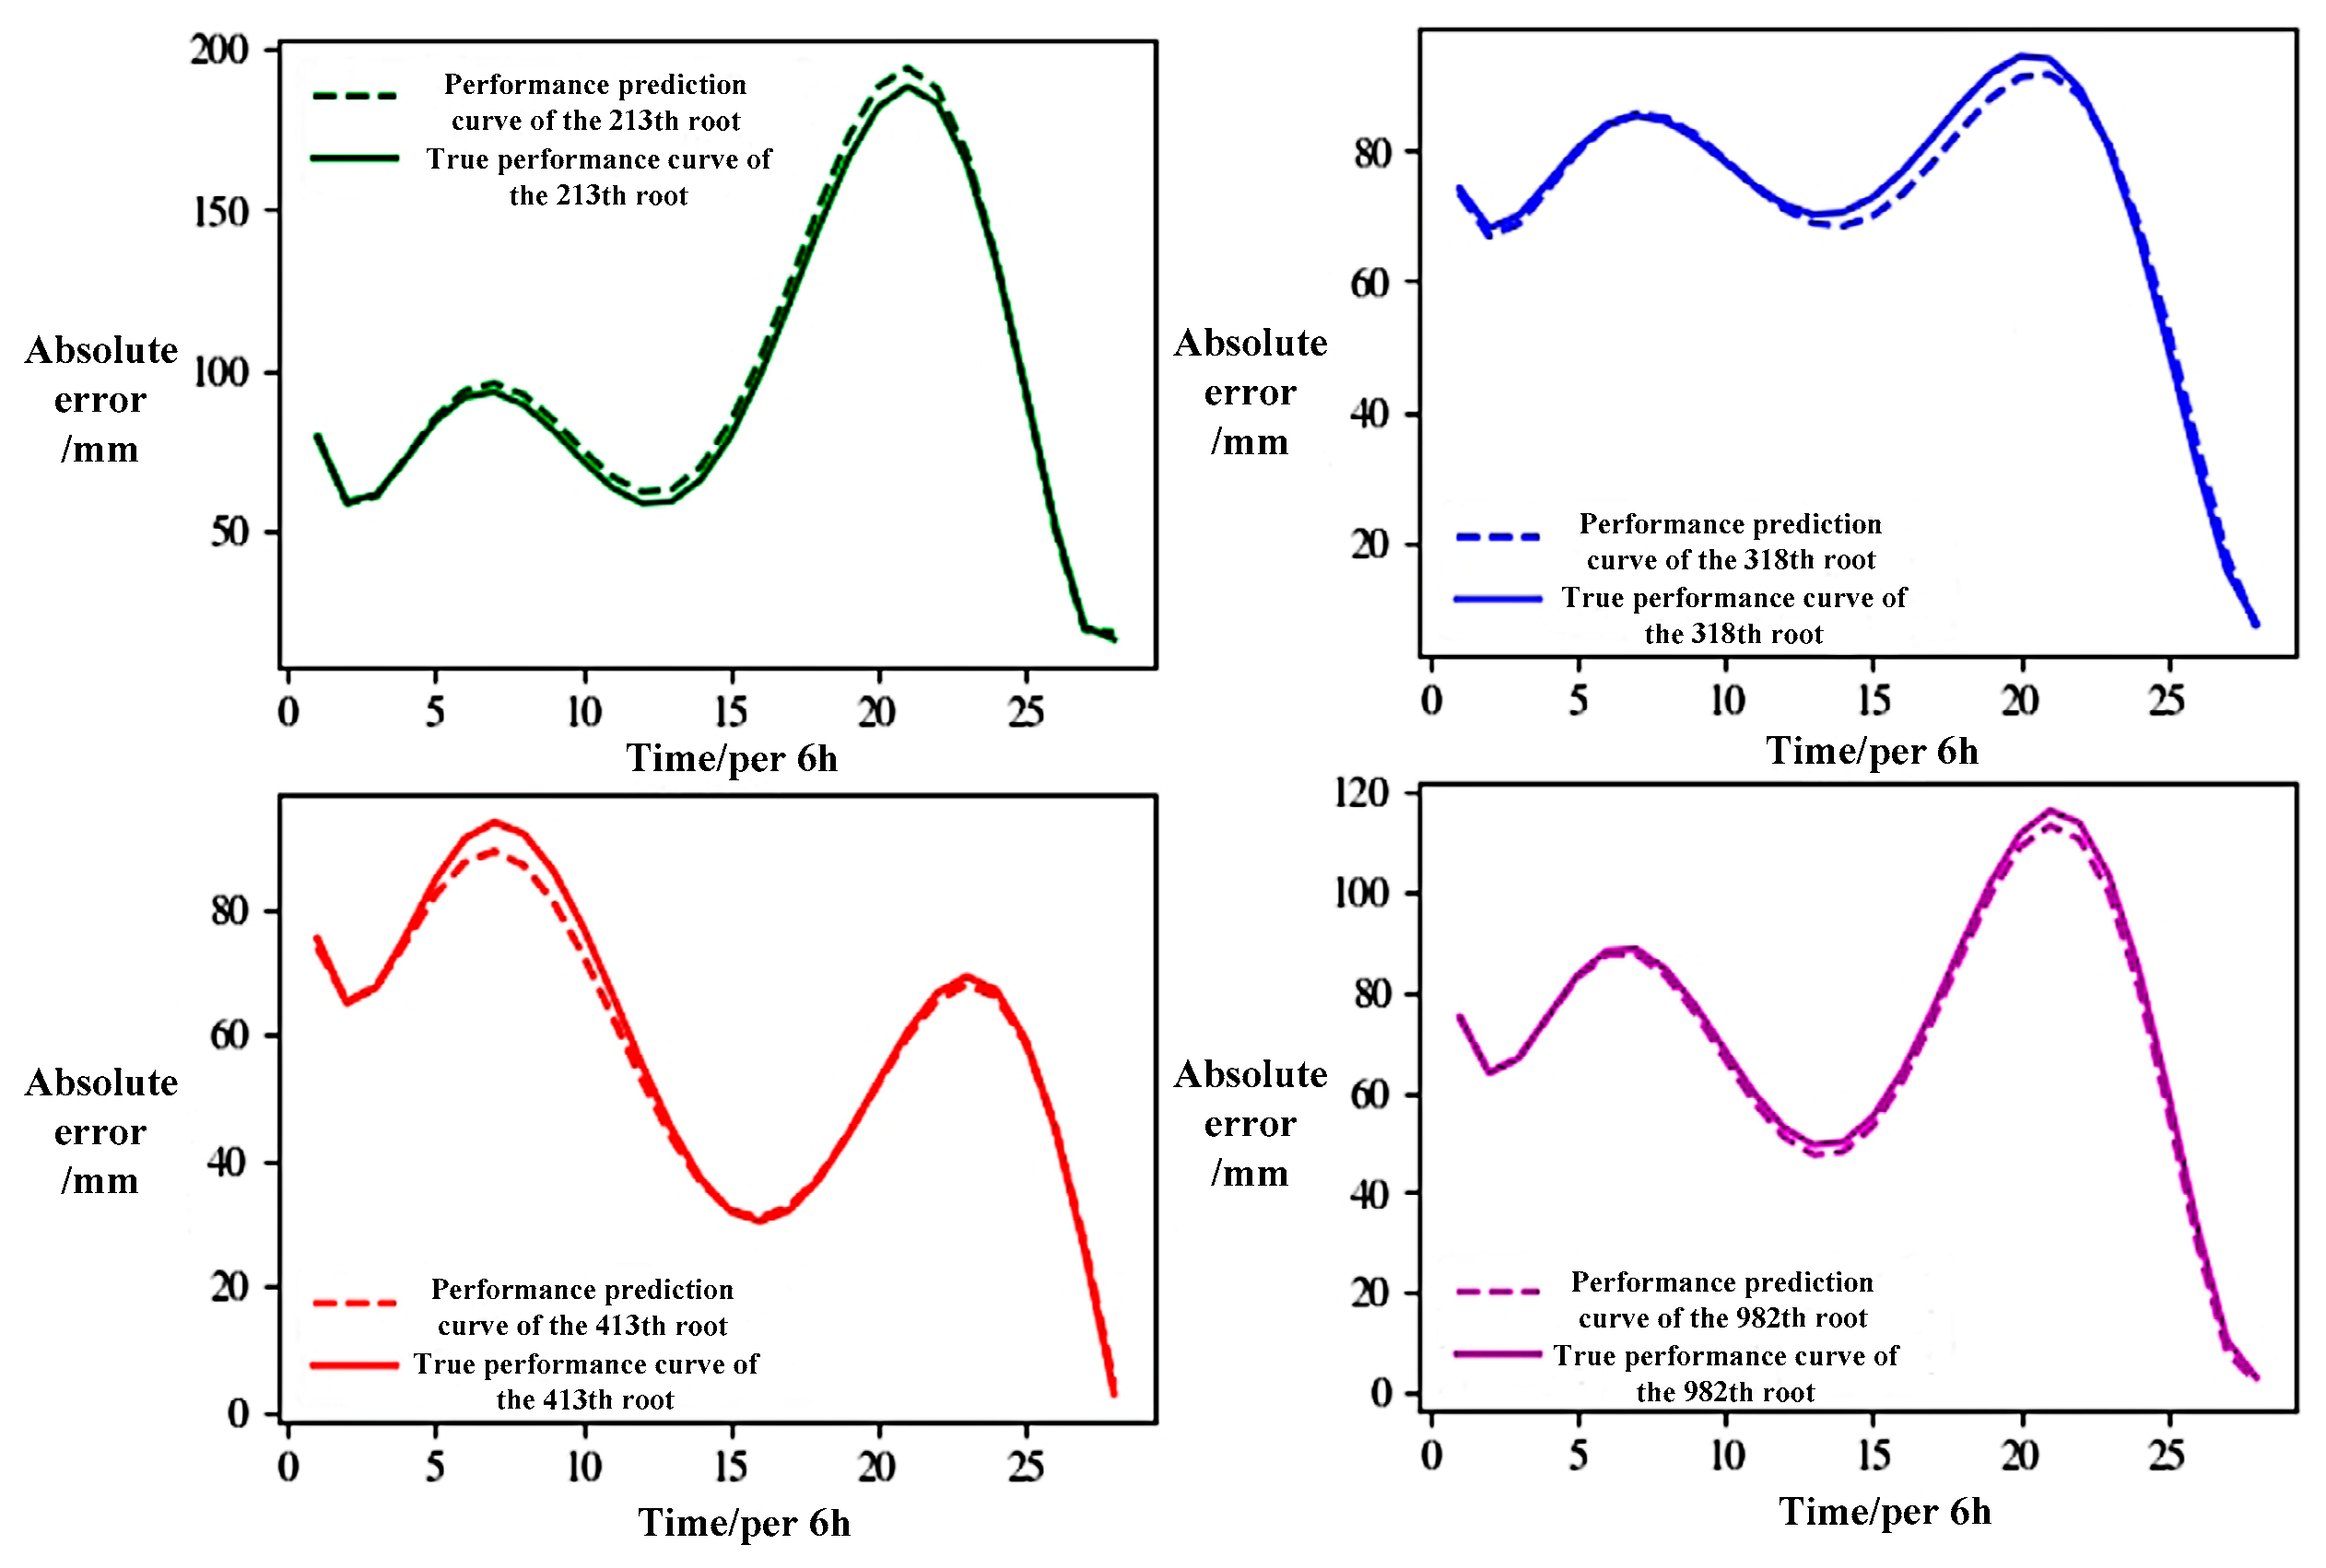
5.1. Performance Prediction and Result Analysis of Hydraulic Actuator

The absolute error of the displacement of the hydraulic actuator is taken as an indicator of performance prediction, the data outliers are removed according to the data-cleaning method proposed in Section 2, the monitoring data of the FAST health-detection system for a week are divided every 6 h when the data is preprocessed for the hydraulic actuator cluster system, and a total of 28 time intervals can be divided for a week.
The pre-processed week data from 5 July 2019 to 11 July 2019 are selected as the initial data of the absolute displacement error of the hydraulic actuator cluster system, and the data from 11–17 July 2019 are selected as the validation data of the spatiotemporal domain-coupled clustering algorithm of the hydraulic actuator cluster system. By comparing the forecast data with the real data, the accuracy of the forecast can be verified.
The flow chart of the spatiotemporal domain-coupled clustering verification of hydraulic actuator cluster system is shown in Figure 13. Some data selected from the hydraulic actuator clustering results are shown in Table 2.
Actuators 1060, 257, 336, 355, and 384 from family 26 are selected for analysis. Since they belong to the same family, it can be inferred that the performance variation trends of actuators 257, 336, 355, and 384 during the first time interval of the seventh day are approximately consistent with that of actuator 1060 during the first time interval of the first day. Consequently, the performance variation trends of these four actuators over a week can be referenced against the performance trends of a single actuator from the same family during the previous week.
At this point, the ratio of the absolute position errors between these four hydraulic actuators during the first time interval of the seventh day and actuator 1060 during the first time interval of the first day is calculated separately. This ratio serves as the absolute position error ratio between the two actuators:
A = Δ d 1 Δ d 2
where Δ d 1 is the absolute error value of the position of the hydraulic actuator at the first time interval on the seventh day, and Δ d 2 is the absolute error value of the position of the hydraulic actuator at the first time interval on the first day.
The least squares method is employed to perform curve fitting on the absolute error points of the hydraulic actuators. Given the sufficient volume of absolute error data over an extended period, the absolute error curve can effectively represent the performance curve of the actuators. Based on the fitted curve of the hydraulic actuators’ absolute errors, the derivative of the fitted curve is computed to obtain the performance variation curve of the hydraulic actuators. This curve provides critical insights for performance prediction, as illustrated in Figure 14.
The data from the previous week for actuators 257, 336, 355, and 384 are used as training data for prediction. By comparing these predictions with the actual performance curves of the following week, the effectiveness of the spatiotemporal domain-coupled clustering algorithm for the hydraulic actuator cluster system is validated. A comparison between the predicted performance curves and the actual performance curves is illustrated in Figure 15.
The coefficient of determination R 2 is utilized as the fitting coefficient between the predicted and actual curves, where R 2 ranges between 0 and 1. A value closer to 1 indicates a better fit. The fitting coefficients for the first three days, the last four days, and the entire week are calculated separately for actuators 257, 336, 355, and 384, as presented in Table 3.
As illustrated in the chart, the predicted curves exhibit significant overlap with the actual curves during the first three days, with a fitting coefficient of at least 0.9793. However, the predicted curves gradually deviate from the actual curves in the last four days, with the maximum fitting coefficient being only 0.7784.
By clustering the data of the hydraulic actuator cluster system from 5 July 2019 to 11 July 2019, and forecasting the data of the week from 11 July 2019 to 17 July 2019, the fitting coefficient between the performance prediction curve of 2225 actuators and the real performance curve of the whole actuator cluster system is calculated, respectively, and the fitting coefficient of 2225 actuators of the whole system is classified and summarized. The results are shown in Table 4.
As indicated by the fitting proportion distribution table of the hydraulic actuator cluster system, the fitting coefficient between the predicted performance curves and the actual performance curves exceeds 0.9 in 80.4% of cases. This demonstrates that performance prediction based on spatiotemporal domain-coupled clustering achieves high accuracy for the majority of actuators. However, the overall accuracy of performance prediction for the entire hydraulic actuator cluster system still presents certain challenges, as the predicted performance curves exhibit high accuracy only during the first three days. Further analysis is required to identify the underlying causes of these issues, followed by an optimized design of the performance prediction process.

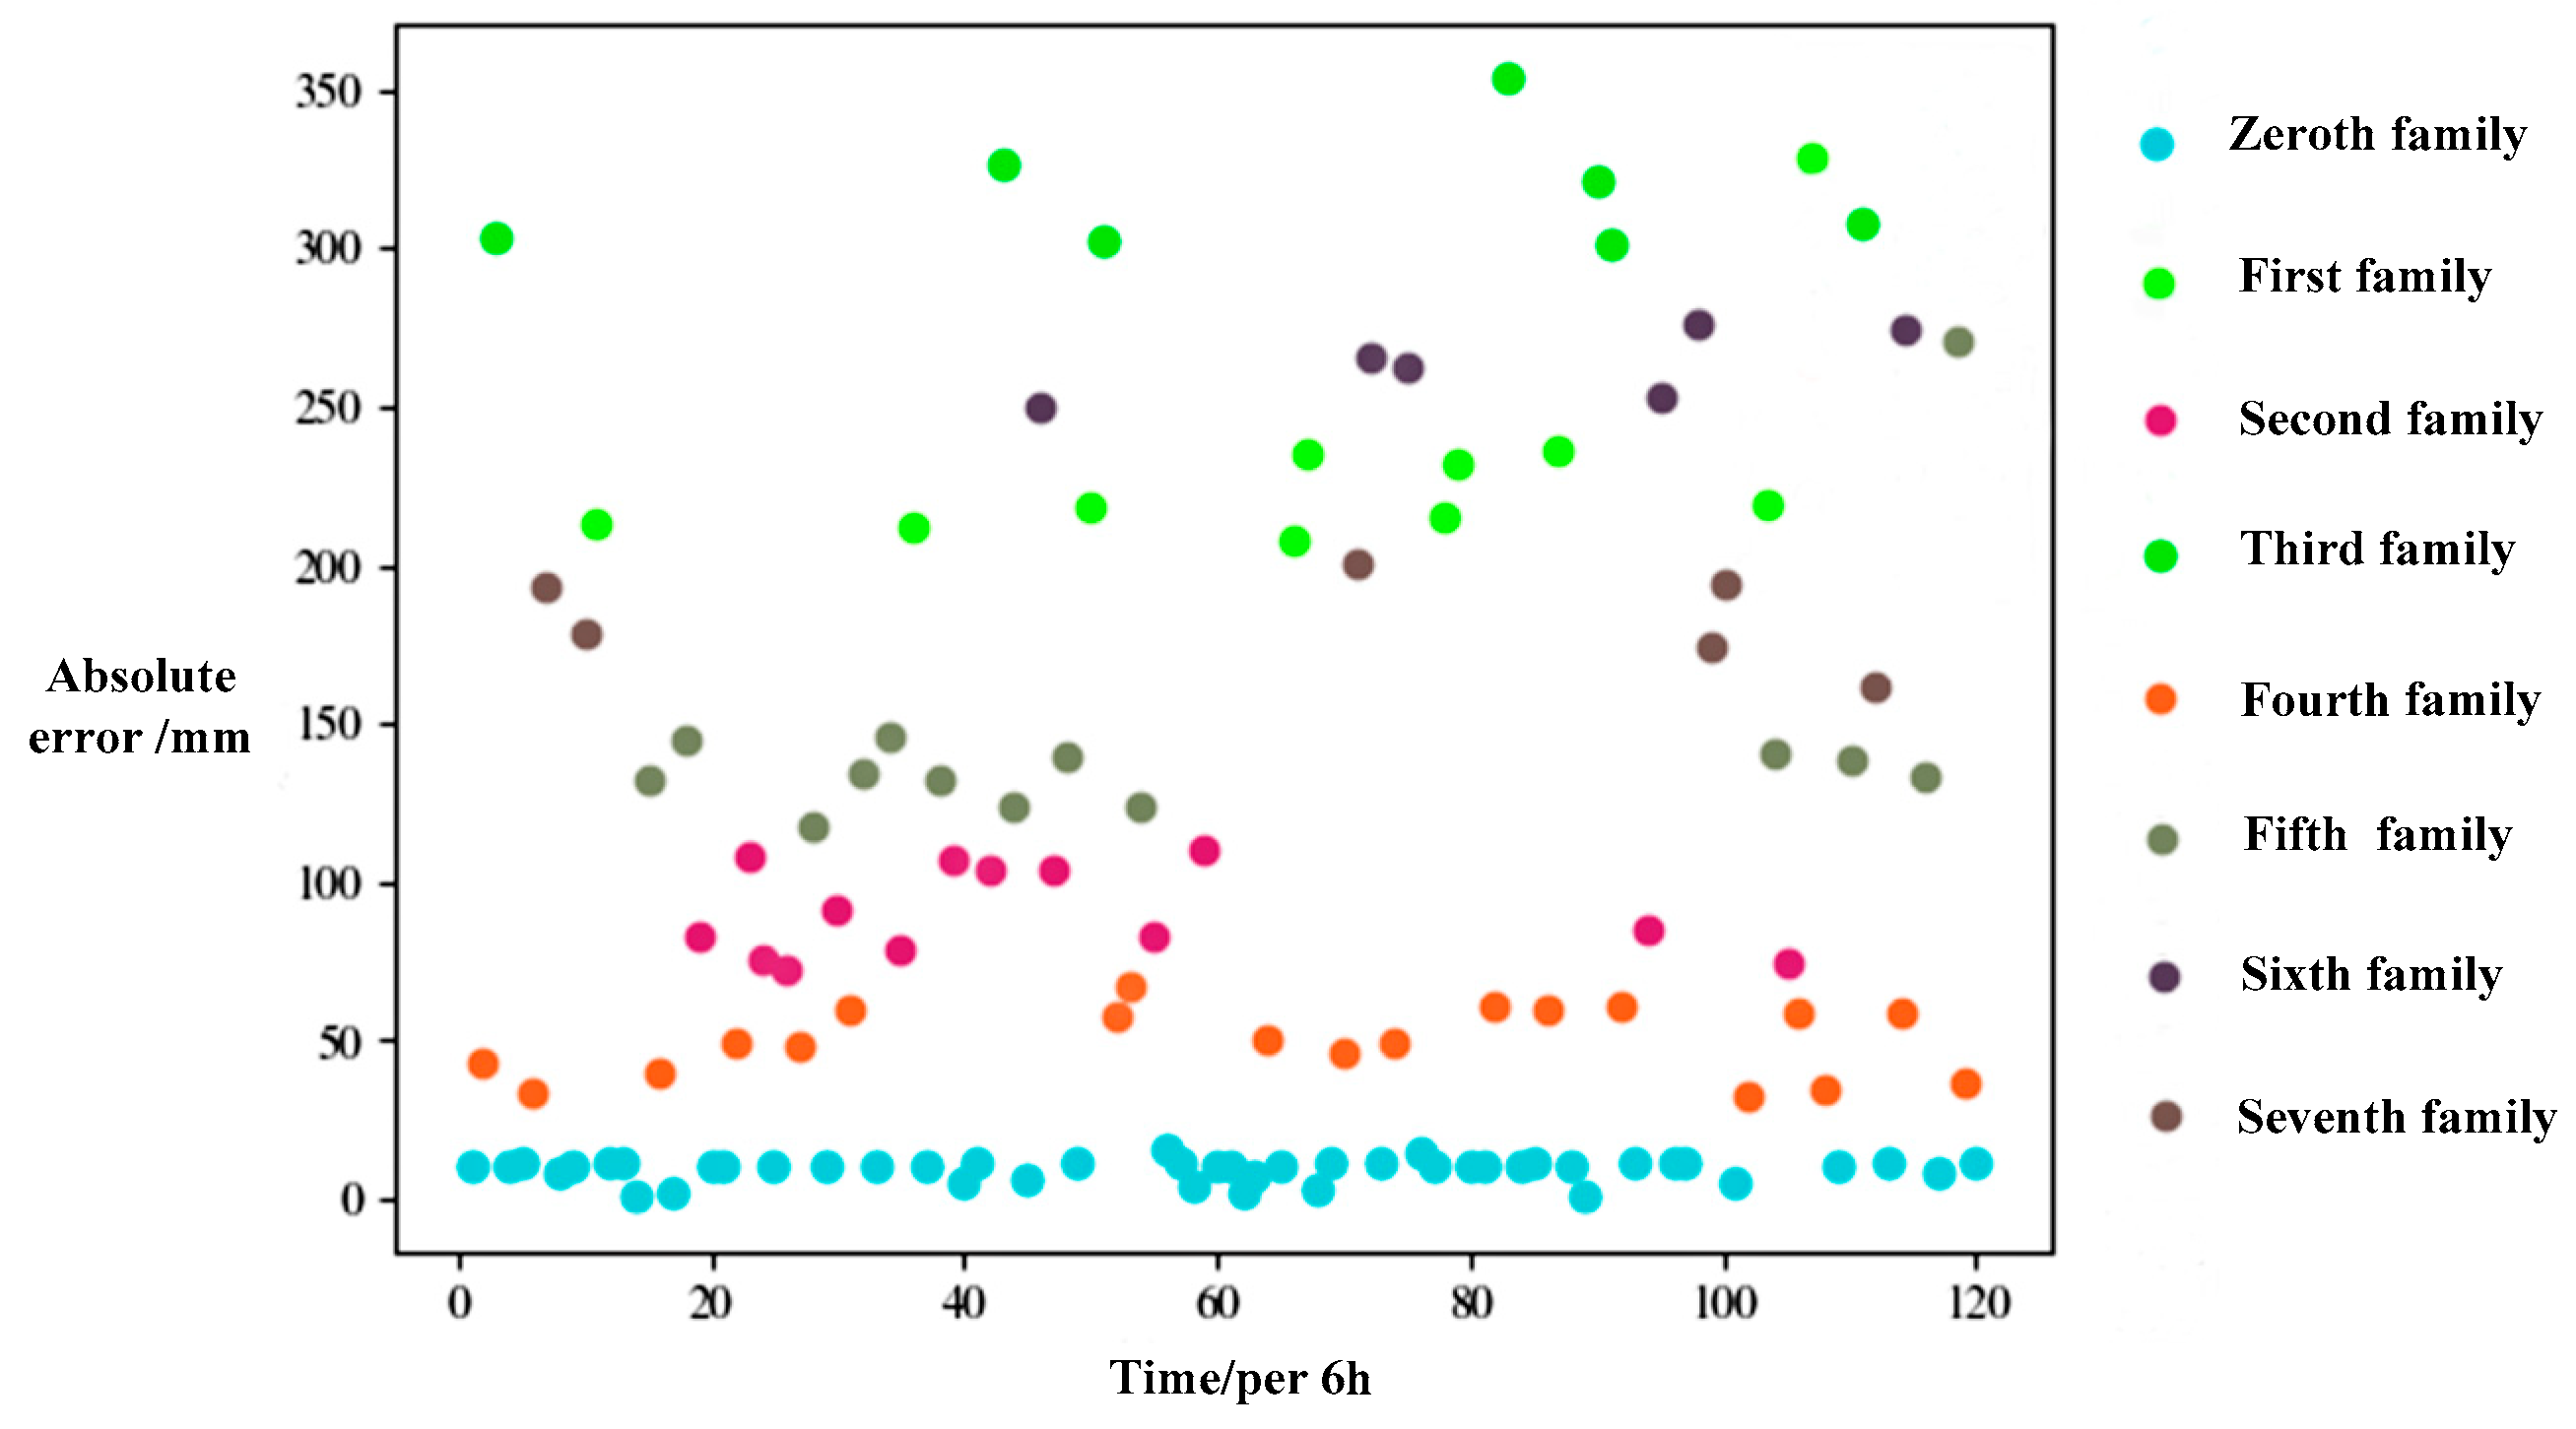
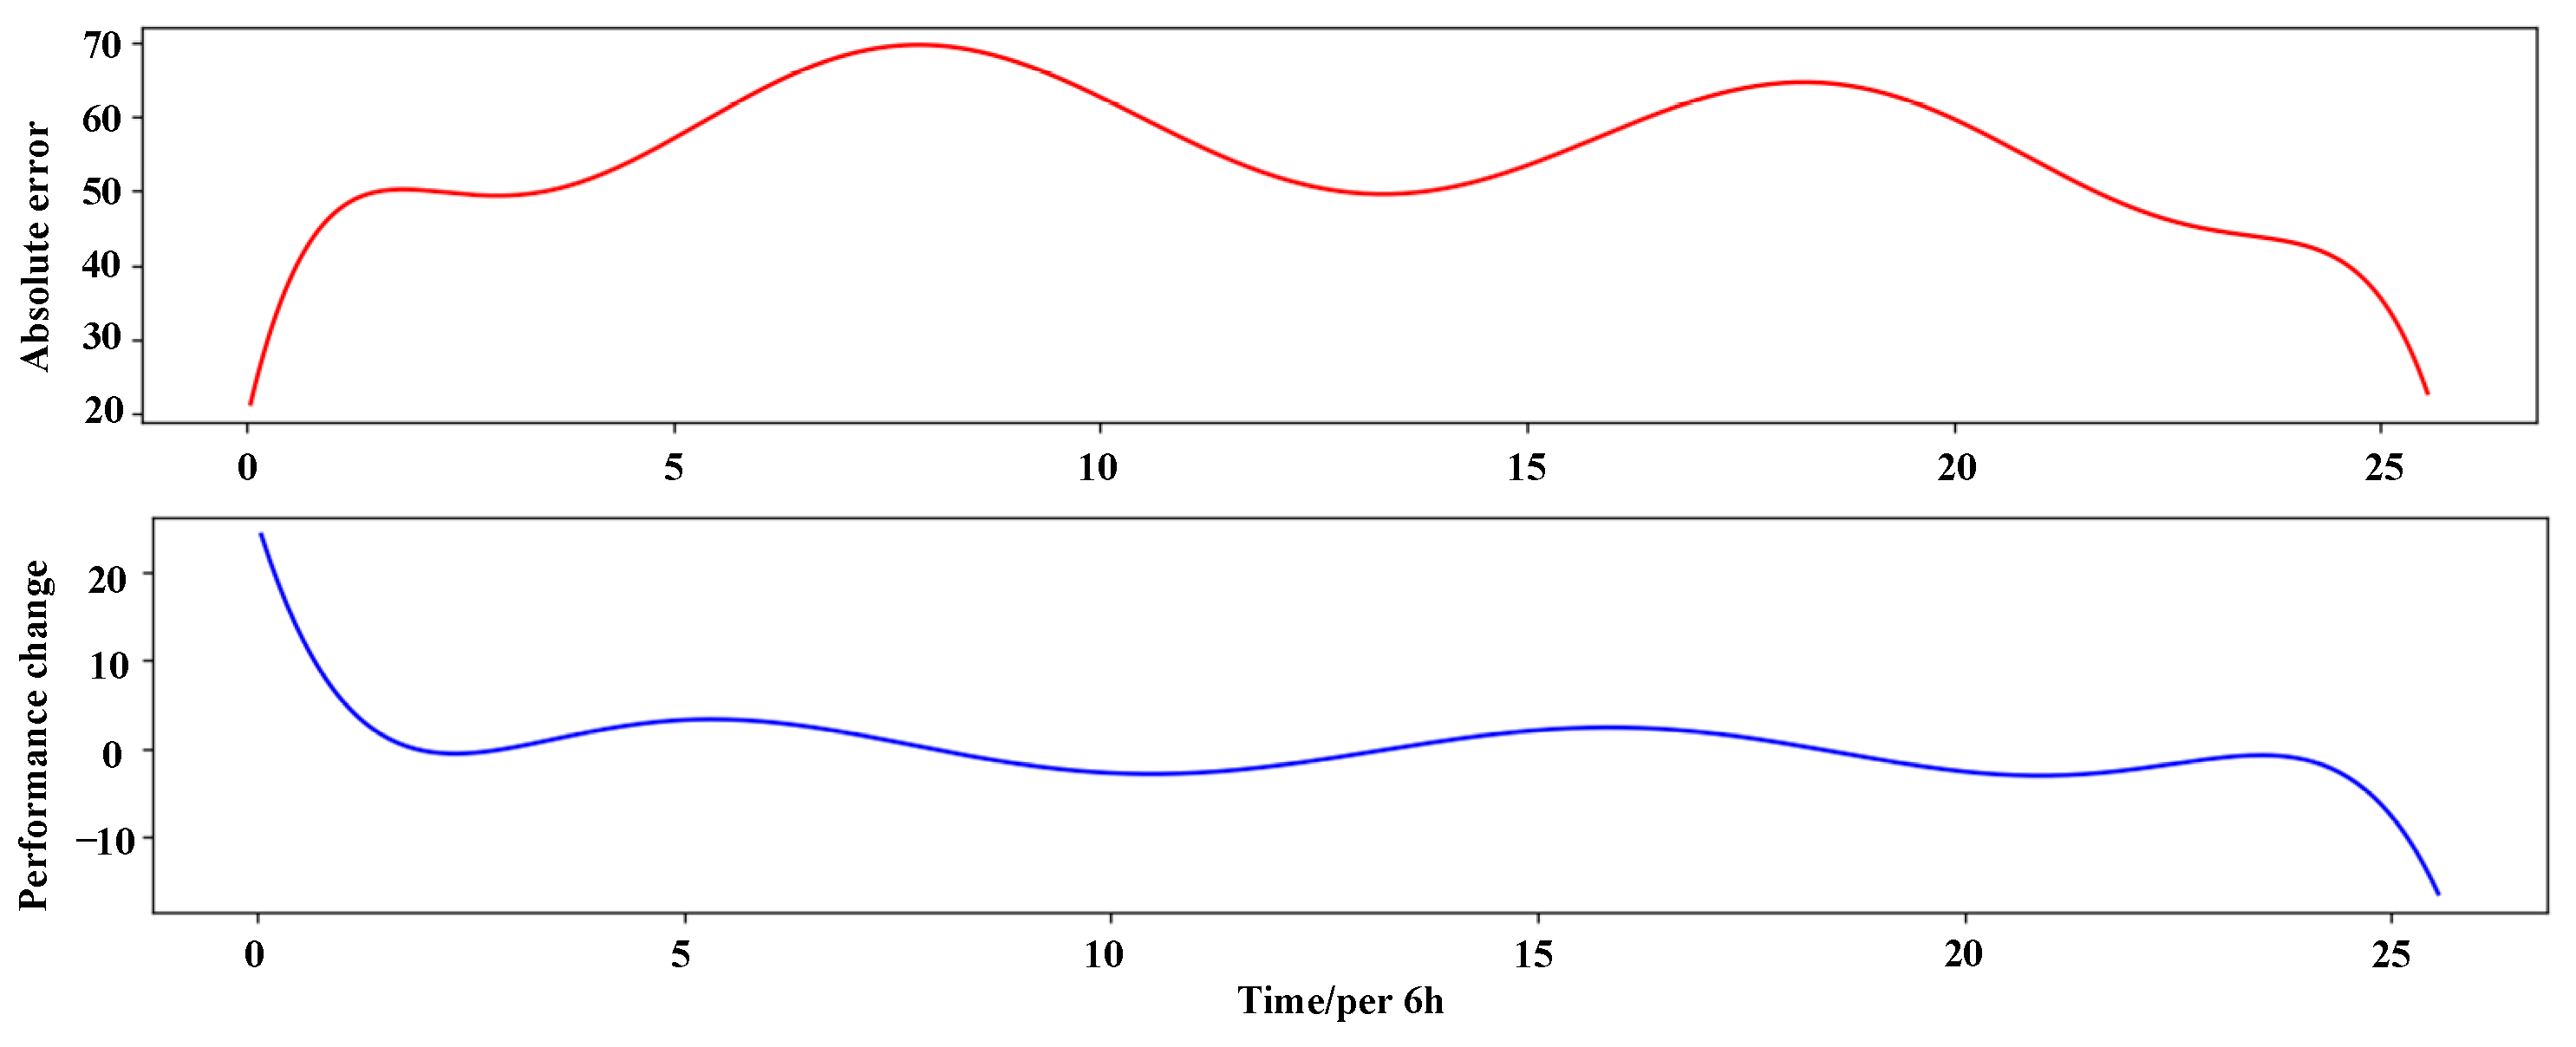
5.2. Error Analysis and Algorithm Optimization of Hydraulic Actuator Performance Prediction

In the working process of FAST, the hydraulic actuator cluster system has been working in real time, and each different hydraulic actuator will adjust different control strategies with the change of observation angle. Hydraulic actuators belonging to the same working state may also change into different working states with the change of time. This shows that the result of the spatiotemporal domain-coupled clustering of the hydraulic actuator cluster system should be a real-time change process, and the clustering result will change with different control strategies of the hydraulic actuator, resulting in the accuracy of the hydraulic actuator performance prediction results only in the first three days, and the performance prediction of the hydraulic actuator will gradually deviate from the real value in the last four days.
If the performance prediction is made according to the real-time updated hydraulic actuator category during the performance prediction process, the error deviation between the hydraulic actuator performance prediction curve and the real performance curve will be reduced. Optimize the design of hydraulic actuator performance prediction and update the spatiotemporal domain-coupled clustering data of the hydraulic actuator cluster system in real time. The shorter the hydraulic actuator performance prediction time, the more accurate the performance-prediction curve will be. At this time, the hydraulic actuator performance prediction will only be made for one day, and then the next day will be made after the prediction. This is to ensure the accuracy of hydraulic actuator performance prediction data. The flow chart of hydraulic actuator performance prediction and optimization is shown in Figure 16.

5.3. Hydraulic Actuator Performance Prediction Optimization Verification

According to the above optimization design, the health monitoring data of the hydraulic actuator cluster system during the 2 weeks from 5 July 2019 to 18 July 2019 are still selected to verify the optimization scheme of the spatiotemporal domain-coupled clustering performance prediction of the hydraulic actuator cluster system.
Following Equation (6), the absolute position error ratios between actuators 213, 318, 413, and 982 from family 27 during the first time interval of the third day and actuator 1277 during the first time interval of the first day are calculated. This process continues until the data for the entire week are updated, concluding when the real-time performance variation trends of actuator 1277 are predicted for 1 week. Actuators 213, 318, 413, and 982 then repeat the aforementioned 1-week performance-prediction process. By comparing the predicted performance curves of these four actuators with their actual performance curves, the effectiveness of the optimized spatiotemporal domain-coupled clustering algorithm for the hydraulic actuator cluster system is validated. A comparison between the predicted and actual performance curves is illustrated in Figure 17.
The fitting coefficients for the first three days, the last four days, and the entire week were calculated separately for actuators 213, 318, 413, and 982, as presented in Table 5.
According to the comparison between the predicted performance curve and the real performance curve in Figure 17 and the fitting coefficient of the hydraulic actuator in Table 5, it can be concluded that the fitting coefficient of the predicted performance of the four hydraulic actuators can remain above 0.99 within a week, which proves the effectiveness of the optimized performance-prediction algorithm.
By clustering the data of the hydraulic actuator cluster system from 5 July 2019 to 11 July 2019, and forecasting the data of the week from 11 July 2019 to 17 July 2019, the fitting coefficient between the performance-prediction curve of 2225 actuators and the real performance curve of the whole actuator cluster system is calculated, respectively, and the fitting coefficient of 2225 actuators of the whole system is classified and summarized. The results are shown in Table 6.
As indicated by the fitting proportion distribution table of the hydraulic actuator cluster system after algorithm optimization, the proportion of cases where the fitting coefficient between the predicted performance curves and the actual performance curves exceeds 0.99 has reached 96.8%. This demonstrates the effectiveness of the performance prediction optimization scheme. The optimized spatiotemporal domain-coupled clustering approach is now capable of achieving highly accurate performance predictions for the hydraulic actuator cluster system. The average execution time of the prediction algorithm before optimization was 0.58 s, whereas the average prediction time after optimization decreased to 0.35 s, thereby demonstrating that the optimization process also enhanced the real-time performance of the prediction algorithm.

6. Conclusions

This paper integrates the spatial-domain BIRCH clustering method with the temporal-domain K-Means clustering method, proposing a spatiotemporal domain-coupled clustering approach that leverages big data from the FAST health monitoring system. This method addresses the small-sample problem caused by data deficiencies due to faults in the FAST hydraulic actuator cluster system.
Firstly, a polar coordinate system is established based on the spatial distribution patterns of the hydraulic actuators, and polar coordinate spatial-domain clustering is performed. This divided the 2225 actuators in the cluster system into 83 clusters according to their performance. Actuators within the same cluster can serve as reference samples for one another, thereby addressing the reference sample issue for the majority of the actuators. Secondly, to tackle the problem of some actuators still lacking reference samples in spatial-domain clustering, a virtual sample-construction method based on temporal-domain K-Means clustering is proposed. The optimal K value for the K-Means algorithm is determined in advance using algorithm evaluation metrics, and temporal-domain data from individual actuators are utilized to construct virtual samples, resolving the issue of missing reference samples in spatial-domain clustering. Finally, the proposed spatiotemporal domain-coupled clustering method is employed to achieve performance prediction for the FAST hydraulic actuator cluster system.
In the initial scenario, a 1-week performance prediction is conducted for the FAST hydraulic actuator cluster system, with over 90% prediction accuracy achieved for 80.4% of the actuators. This validated the effectiveness of the spatiotemporal domain-coupled clustering for hydraulic actuators. However, only 0.8% of the actuators exhibited prediction accuracy exceeding 99%. To enhance the accuracy of hydraulic actuator performance prediction, the prediction algorithm is optimized. Subsequent performance predictions revealed that 96.8% of the actuators achieved accuracy above 99%, ultimately resulting in a significant improvement in the performance prediction accuracy for the FAST hydraulic actuator cluster system.
For the FAST hydraulic actuator cluster system, performance prediction through appropriate data processing contributes to the optimization of control strategies and facilitates timely adjustments to system maintenance strategies. Additionally, this approach provides valuable insights for performance prediction in other complex systems.

Author Contributions

Conceptualization, W.C. and Y.Z.; Methodology, Y.Z.; Software, H.W.; Validation, H.W., M.Z. and Y.Z.; Resources, J.Z.; Data curation, W.C.; Writing—original draft preparation, Y.Z.; Writing—review and editing, H.W.; Visualization, J.Z.; Supervision, M.Z.; Project administration, J.Z.; Funding acquisition, W.C. All authors have read and agreed to the published version of the manuscript.

Funding

This work is supported by the National Natural Science Foundation of China (Grant Nos. 52405073, 12173054, and 52075469) and the Young Elite Scientists Sponsorship Program by CAST (Grant No. 2023QNRC001).

Data Availability Statement

According to the confidentiality of the fund project, the codes and data supporting the survey results of this paper are not disclosed at present because the research has not been completed. You can request a copy from the author at zyr894416121@163.com.

Acknowledgments

Thank you very much for the support from the National Natural Science Foundation of China and Young Elite Scientists Sponsorship Program by CAST. The results of this paper are supported by the China Scholarship Council (CSC). Besides, the authors wish to thank the reviewers for their useful and constructive comments. The authors thank Wei Cai for his help and careful guidance.

Conflicts of Interest

The authors declare no conflicts of interest in this work or in the publication of this work. All authors consent to the publication of this work.

References

  1. Nan, R. Five-hundred-meter aperture spherical radio telescope. Sci. China Ser. G Phys. Mech. Astron. 2006, 49, 129–148. [Google Scholar] [CrossRef]
  2. Wang, Q.; Gao, Y.; Xue, J.; Zhu, M.; Wang, Y. Key performance analysis of five-hundred-meter aperture spherical radio telescope reflective surface hydraulic actuator. J. Mech. Eng. 2017, 53, 183–191. [Google Scholar] [CrossRef]
  3. Zhu, M.; Zhao, J.; Wang, Q. Reliability evaluation of key hydraulic components for actuators of FAST based on small sample test. Int. J. Precis. Eng. Manuf. 2017, 18, 1561–1566. [Google Scholar] [CrossRef]
  4. Jiang, P.; Gan, H.; Yao, R.; Sun, J.; Lu, J.; Yu, D.; Li, H.; Yu, J.; Dong, B.; Chai, X.; et al. FAST: The Five-Hundred-Meter Aperture Spherical Radio Telescope. Engineering 2023, 28, 21–25. [Google Scholar] [CrossRef]
  5. Peng, C. Research on the reliability of coal mining machines based on fault tree analysis and Bayesian networks. Coal Mine Mach. 2023, 44, 181–183. [Google Scholar]
  6. Han, X.; Zhan, J.; Zhang, F.; Hu, J.; Wu, X. Robust topological superconductivity in spin–orbit coupled systems at higher-order van Hove filling. Sci. Bull. 2024, 69, 319–324. [Google Scholar] [CrossRef]
  7. Hasan, M.; Mia, B.; Ahmed, U.; Karim, M.A.; Islam, A.A.; Mohi-Ud-Din, M. Heat stress tolerance in wheat seedling: Clustering genotypes and identifying key traits using multivariate analysis. Heliyon 2024, 10, 38623. [Google Scholar] [CrossRef]
  8. Martinez-Martin, P.; Rojo-Abuín, J.M.; Weintraub, D.; Chaudhuri, K.R.; Rodriguez-Blázquez, C.; Rizos, A.; Schrag, A. Factor Analysis and Clustering of the Movement Disorder Society-non-motor Rating Scale. Mov. Disord. 2020, 35, 969–975. [Google Scholar] [CrossRef]
  9. Abdolmajid, D.; Ali, D.; Alireza, A. Modeling and Forecasting Nonstationary Voltage Fluctuation Based on Grey System Theory. IEEE Trans. Power Deliv. 2017, 32, 1212–1219. [Google Scholar]
  10. Zheng, D.; Wang, H.; An, J.; Chen, J.; Pan, H.; Chen, L. Real-Time Estimation of Battery State of Charge with Metabolic Grey Model and LabVIEW Platform. IEEE Access 2018, 6, 13170–13180. [Google Scholar] [CrossRef]
  11. Chen, L.; Wang, H.; Chen, J.; An, J.; Ji, B.; Lyu, Z.; Cao, W.; Pan, H. A Novel Remaining Useful Life Prediction Framework for Lithium-ion Battery Using Grey Model and Particle Filtering. Int. J. Energy Res. 2020, 44, 7435–7449. [Google Scholar] [CrossRef]
  12. Tomasz, K.; Kazimierz, O. Forecasting the Number of Failures of the Steering System Components with the Use of the Grey System Theory Method. Sci. J. Silesian Univ. Technol. 2021, 112, 85–97. [Google Scholar]
  13. Yang, J.; Qiu, X.; Chen, Z. The Reliability Evaluation of Antiskid Valve of CRH2 EMUs Based on Bayes Method. Period. Polytech. Transp. Eng. 2018, 47, 268–276. [Google Scholar] [CrossRef]
  14. Rodrigues, A.; Pereira, C.; Polpo, A. Estimation of Component Reliability in Coherent Systems with Masked Data. IEEE Access 2019, 7, 57476–57487. [Google Scholar] [CrossRef]
  15. Fan, X.; Guo, W.; Sun, J. Reliability of High-Voltage GaN-Based Light-Emitting Diodes. IEEE Trans. Device Mater. Reliab. 2019, 19, 402–408. [Google Scholar] [CrossRef]
  16. Ali, S.; Shah, I.; Siddiqui, G.F.; Saba, T.; Rehman, A. Reliability Analysis for Electronic Devices Using Generalized Exponential Distribution. IEEE Access 2020, 8, 108629–108644. [Google Scholar] [CrossRef]
  17. Zhou, K.; Cruise, J.; Dent, C.; Dobson, I.; Wang, Z.; Wilson, A.; Wehenkel, L. Bayesian Estimates of Transmission Line Outage Rates that Consider Line Dependencies. IEEE Trans. Power Syst. 2021, 360, 1095–1106. [Google Scholar] [CrossRef]
  18. Loutas, T.; Roulias, D.; Georgoulas, G. Remaining Useful Life Estimation in Rolling Bearings Utilizing Data-Driven Probabilistic E-Support Vectors Regression. IEEE Trans. Reliab. 2013, 62, 821–832. [Google Scholar] [CrossRef]
  19. Aikhuele, D.; Periola, A.; Ighravwe, D. Wind Turbine Systems Operational State and Reliability Evaluation: An Artificial Neural Network Approach. Int. J. Data Netw. Sci. 2019, 3, 323–330. [Google Scholar] [CrossRef]
  20. Koley, E.; Shukla, S.; Ghosh, S.; Mohanta, D.K. Protection Scheme for Power Transmission Lines Based on SVM and ANN Considering the Presence of Non-Linear Loads. IET Gener. Transm. Distrib. 2017, 11, 2333–2334. [Google Scholar] [CrossRef]
  21. Picheny, V.; Kim, N.; Haftka, R. Application of Bootstrap Method in Conservative Estimation of Reliability with Limited Samples. Struct. Multidiscip. Optim. 2010, 41, 205–217. [Google Scholar] [CrossRef]
  22. Lee, S.; Bolic, M.; Groza, V.; Dajani, H.R.; Rajan, S. Confidence Interval Estimation for Oscillometric Blood Pressure Measurements Using Bootstrap Approaches. IEEE Trans. Instrum. Meas. 2011, 60, 3405–3415. [Google Scholar] [CrossRef]
  23. Rodrigues, A.; Silva, M. Confidence Intervals Estimation for Reliability Data of Power Distribution Equipments Using Bootstrap. IEEE Trans. Power Syst. Publ. Power Eng. Soc. 2013, 28, 3283–3291. [Google Scholar] [CrossRef]
  24. Li, H.; Xie, L.; Li, M.; Ren, J.; Zhao, B.; Zhang, S. Reliability Assessment of High- Quality and Long-Life Products Based on Zero-Failure Data. Qual. Reliab. Eng. Int. 2019, 35, 470–482. [Google Scholar] [CrossRef]
  25. Zhai, Q.; Ye, Z. Robust Degradation Analysis with Non-Gaussian Measurement Errors. IEEE Trans. Instrum. Meas. 2017, 66, 2803–2812. [Google Scholar] [CrossRef]
  26. Liu, F.; Guo, W.; Liu, R.; Liu, J. Improved Load Forecasting Model Based on Two-Stage Optimization of Gray Model with Fractional Order Accumulation and Markov Chain. Commun. Stat.-Theory Methods 2019, 50, 2659–2673. [Google Scholar] [CrossRef]
  27. Fan, M.; Zeng, Z.; Zio, E.; Kang, R.; Chen, Y. A Sequential Bayesian Approach for Remaining Useful Life Prediction of Dependent Competing Failure Processes. IEEE Trans. Reliab. 2019, 68, 317–329. [Google Scholar] [CrossRef]
  28. Zhao, W.; Cao, K.; Tao, Y.; Zhang, J.; Tu, X.; Wang, J.; Dong, H. Performance Reliability Evaluation of Explosive Initiator Based on Bayes-Bootstrap Method. In Proceedings of the 2021 Global Reliability and Prognostics and Health Management, Nanjing, China, 15–17 October 2021; pp. 1–6. [Google Scholar]
  29. Li, Y.; Wang, H.; Fu, Q. Aeroengine Performance Degradation Evaluation Method Based on Hierarchical Bayes Integrated with DNN Fusion Decision. In Journal of Physics: Conference Series; IOP Publishing: Bristol, UK, 2021; Volume 1, p. 1910. [Google Scholar]
  30. Cai, W.; Zhao, J.; Zhu, M. A real time methodology of cluster-system theory-based reliability estimation using k-means clustering. Reliab. Eng. Syst. Saf. 2020, 202, 107045. [Google Scholar] [CrossRef]
  31. Wang, J.; Liu, X.; Chai, J.; Wang, Y.; Jin, X.; He, Z.; Cai, W.; Guo, R. Numerical and experimental investigation on active hydraulic tensioner system for a TLP under tether fails condition. Mar. Struct. 2025, 99, 103693. [Google Scholar] [CrossRef]
  32. Xie, W. Stability and dynamic responses of a top-tensioned riser under two different parametric excitations. Mar. Struct. 2024, 97, 103653. [Google Scholar] [CrossRef]
  33. Wang, L.; Xiong, C.; Yang, Y. A novel methodology of reliability-based multidisciplinary design optimization under hybrid interval and fuzzy uncertainties. Comput. Methods Appl. Mech. Eng. 2018, 337, 439–457. [Google Scholar] [CrossRef]
  34. Cai, W.; Li, Z.; Zhu, M.; Guo, R.; Wang, J.; Zhao, J. A Performance Prediction Method Utilizing Time-Dependent Subsystem Transfers between Family Systems. Appl. Sci. 2024, 14, 2448. [Google Scholar] [CrossRef]
  35. Li, R.; Bao, L.; Chen, L.; Zha, C.; Dong, J.; Qi, N.; Tang, R.; Lu, Y.; Wang, M.; Huang, R.; et al. Accelerated aging of lithium-ion batteries: Bridging battery aging analysis and operational lifetime prediction. Sci. Bull. 2023, 68, 3055–3079. [Google Scholar] [CrossRef] [PubMed]
  36. Zhang, H.; Yuan, H.; Li, P. Estimation Method for Extremely Small Sample Accelerated Degradation Test Data. In Proceedings of the 2015 First International Conference on Reliability Systems Engineering, Hangzhou, China, 21–23 October 2015; pp. 1–5. [Google Scholar]
Figure 1. Hydraulic actuator overall structure diagram.
Actuators 14 00208 g001
Figure 2. FAST active reflector health monitoring system.
Actuators 14 00208 g002
Figure 3. Data processing flow chart.
Actuators 14 00208 g003
Figure 4. Polar coordinate diagram of the actual position of the hydraulic actuator cluster system.
Actuators 14 00208 g004
Figure 5. DBI diagram of the CF radius threshold.
Actuators 14 00208 g005
Figure 6. Influence curve of the maximum CF number of each node on DBI.
Actuators 14 00208 g006
Figure 7. The 184th hydraulic actuator cluster data elbow chart.
Actuators 14 00208 g007
Figure 8. The 184th hydraulic actuator cluster data silhouette coefficient diagram.
Actuators 14 00208 g008
Figure 9. The spatial-domain BIRCH clustering result of the hydraulic actuator cluster system.
Actuators 14 00208 g009
Figure 10. Statistical diagram of the number of different families of hydraulic actuators.
Actuators 14 00208 g010
Figure 11. The temporal-domain K-Means clustering results of the 184th hydraulic actuator.
Actuators 14 00208 g011
Figure 12. Plot of data quantity of temporal-domain clustering results in different families.
Actuators 14 00208 g012
Figure 13. Flow chart of the spatiotemporal domain-coupled clustering verification of hydraulic actuator cluster system.
Actuators 14 00208 g013
Figure 14. Hydraulic actuator performance analysis diagram.
Actuators 14 00208 g014
Figure 15. Comparison between the predicted performance curve and the actual performance curve.
Actuators 14 00208 g015
Figure 16. Hydraulic actuator performance prediction optimization flow chart.
Actuators 14 00208 g016
Figure 17. The comparison between the optimized performance-prediction curve and the real performance curve.
Actuators 14 00208 g017
Table 1. Partial data of actuator monitoring data at a certain time.
Device IDControl
Theory
Control
Actual
Control
Temperature
Control
Pressure
11,070,0001,070,00026.172777
2961,943962,63425.482293
31,000,0001,000,00025.982383
2223445,522445,62026.053700
2224389,577389,67526.25125
2225395,675395,73125.144397
Table 2. Hydraulic actuator clustering results (Part).
Device IDPerformance IndexClustering
Result
Device IDPerformance IndexClustering
Result
1050−1.5961261253103.990627
1060−1.6547261277103.214827
1061−1.6256261062104.117027
257−1.576726580104.165627
336−1.539426213103.922727
355−1.613926318104.815827
384−1.591126413104.168427
---982103.873927
Table 3. Hydraulic actuator fitting coefficients.
Device IDFitting Coefficient of the First Three DaysFitting Coefficient of the After Four DaysFitting Coefficient for One Week
2570.99890.74610.8757
3360.97970.77840.8799
3550.99170.76870.8835
3840.97930.77480.8793
Table 4. Proportional distribution of fitting coefficients in the hydraulic actuator cluster system.
Actuator Fitting Coefficient R2Number of Actuators/(Roots)Proportion of the Total Number of Hydraulic Actuators
R2 < 0.8000%
0.80 ≤ R2 < 0.851024.6%
0.85 ≤ R2 < 0.9033415.0%
0.90 ≤ R2 < 0.9585238.8%
0.95 ≤ R2 < 0.9991941.3%
R2 > 0.99180.8%
Table 5. The fitting coefficients of hydraulic actuator after algorithm optimization.
Device IDFitting Coefficient of the First Three DaysFitting Coefficient of the
After Four Days
Fitting Coefficient for
One Week
2130.99770.99800.9981
3180.99970.99520.9971
4130.99830.99320.9969
9820.99950.99780.9985
Table 6. The proportional distribution of the fitting coefficients in the optimized hydraulic actuator cluster system.
Actuator Fitting Coefficient R2Number of Actuators/(Roots)Proportion of the Total Number of Hydraulic Actuators
R2 < 0.8000%
0.80 ≤ R2 < 0.8500%
0.85 ≤ R2 < 0.9030.1%
0.90 ≤ R2 < 0.95170.8%
0.95 ≤ R2 < 0.99522.3%
R2 > 0.99215396.8%
Disclaimer/Publisher’s Note: The statements, opinions and data contained in all publications are solely those of the individual author(s) and contributor(s) and not of MDPI and/or the editor(s). MDPI and/or the editor(s) disclaim responsibility for any injury to people or property resulting from any ideas, methods, instructions or products referred to in the content.

