Abstract
It is well established that the differential cylinder area in pump-controlled single-rod actuators creates the need of correctly switching the connections between the main circuit lines and a charge circuit, in order to provide means for equalising the flows into and out of the pump and the actuator. Many attempts to automatically switch the charge circuit connections to either cap- and rod-sides of the hydraulic cylinder have been made through the years. However, in many of these attempts, strong oscillations in the cylinder motion were observed when operational quadrants were changed under some particular velocity and force conditions. In this paper, we perform a thorough numerical analysis for some representative pump-controlled single-rod actuators. The goal is to understand the causes of undesirable behaviour of several circuits under certain operating situations. We show through comprehensive simulations that all but one circuit design produces undesirable oscillatory results under these circumstances. This paper is built upon and complements a previously published paper by the same authors on this important subject.
1. Introduction
Hydrostatic actuators have long been studied due to their energetic efficiency. In this type of hydraulic circuit, the cylinder is directly controlled by the pump, eliminating energy losses that would otherwise be present if directional valves were used. As a result, practically all the hydraulic power that leaves the pump is converted into useful work at the cylinder rod, producing an efficiency of nearly 99% [1], which represents a huge gain when compared to the typical 6% to 40% efficiency range of valve-controlled actuators [2]. However, the different actuation areas in single-rod cylinders has always been a hindrance to the development of functional hydrostatic actuation solutions. The reason is that typical hydrostatic actuators require closed hydraulic circuits, where the cap- and the rod-side of the cylinder connect directly to the pump ports. Since the flows into and out of the cylinder are different, in the simplest-case scenario, a flow compensation circuit needs to be added between the cylinder and the pump. Several circuit designs have been created to this end, though none had reached the goal of operating smoothly at small loads and at every operational quadrant transition [3,4,5,6,7,8,9,10,11]. Recently, a novel solution was developed [1,12] with stable and trustworthy performance. The goal of this paper is to perform systematic numerical simulations on a set of representative circuits and show that the solution proposed in [1,12] is, in fact, stable and non-oscillatory even in the most demanding conditions of force and velocity at the cylinder rod. In fact, this work augments the previous work by authors [13], where typical circuits for hydrostatic actuators were studied qualitatively.
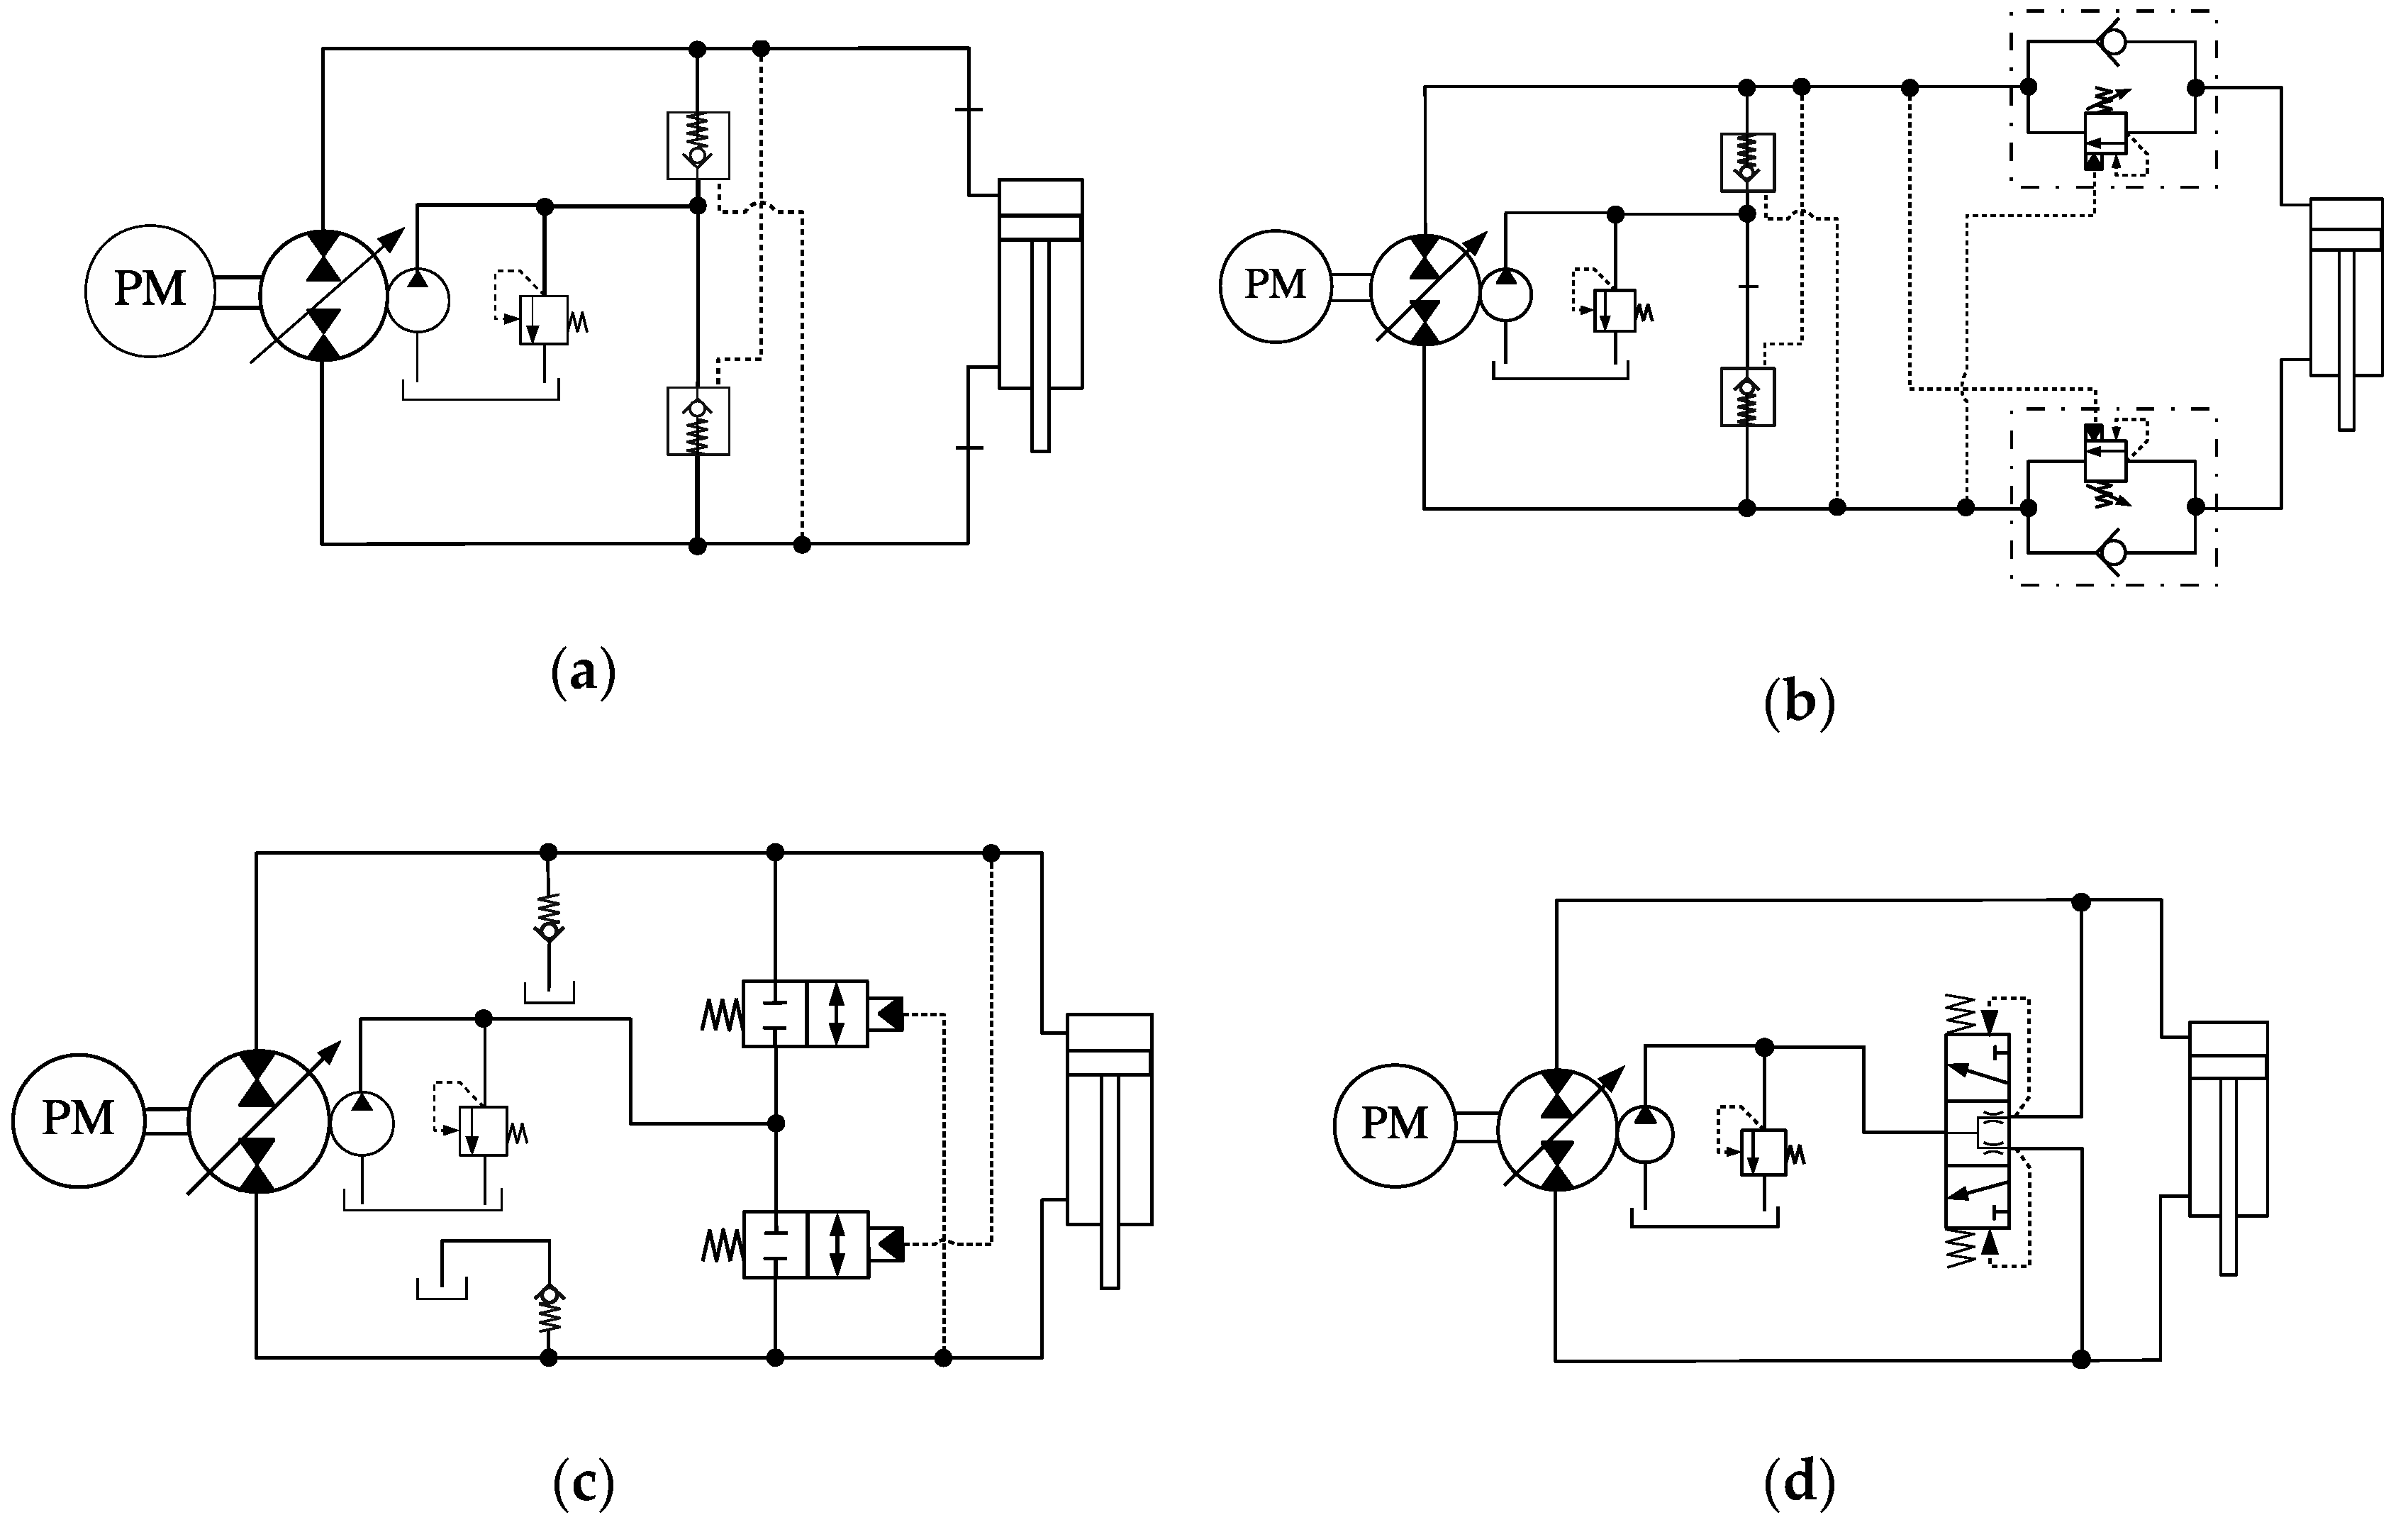
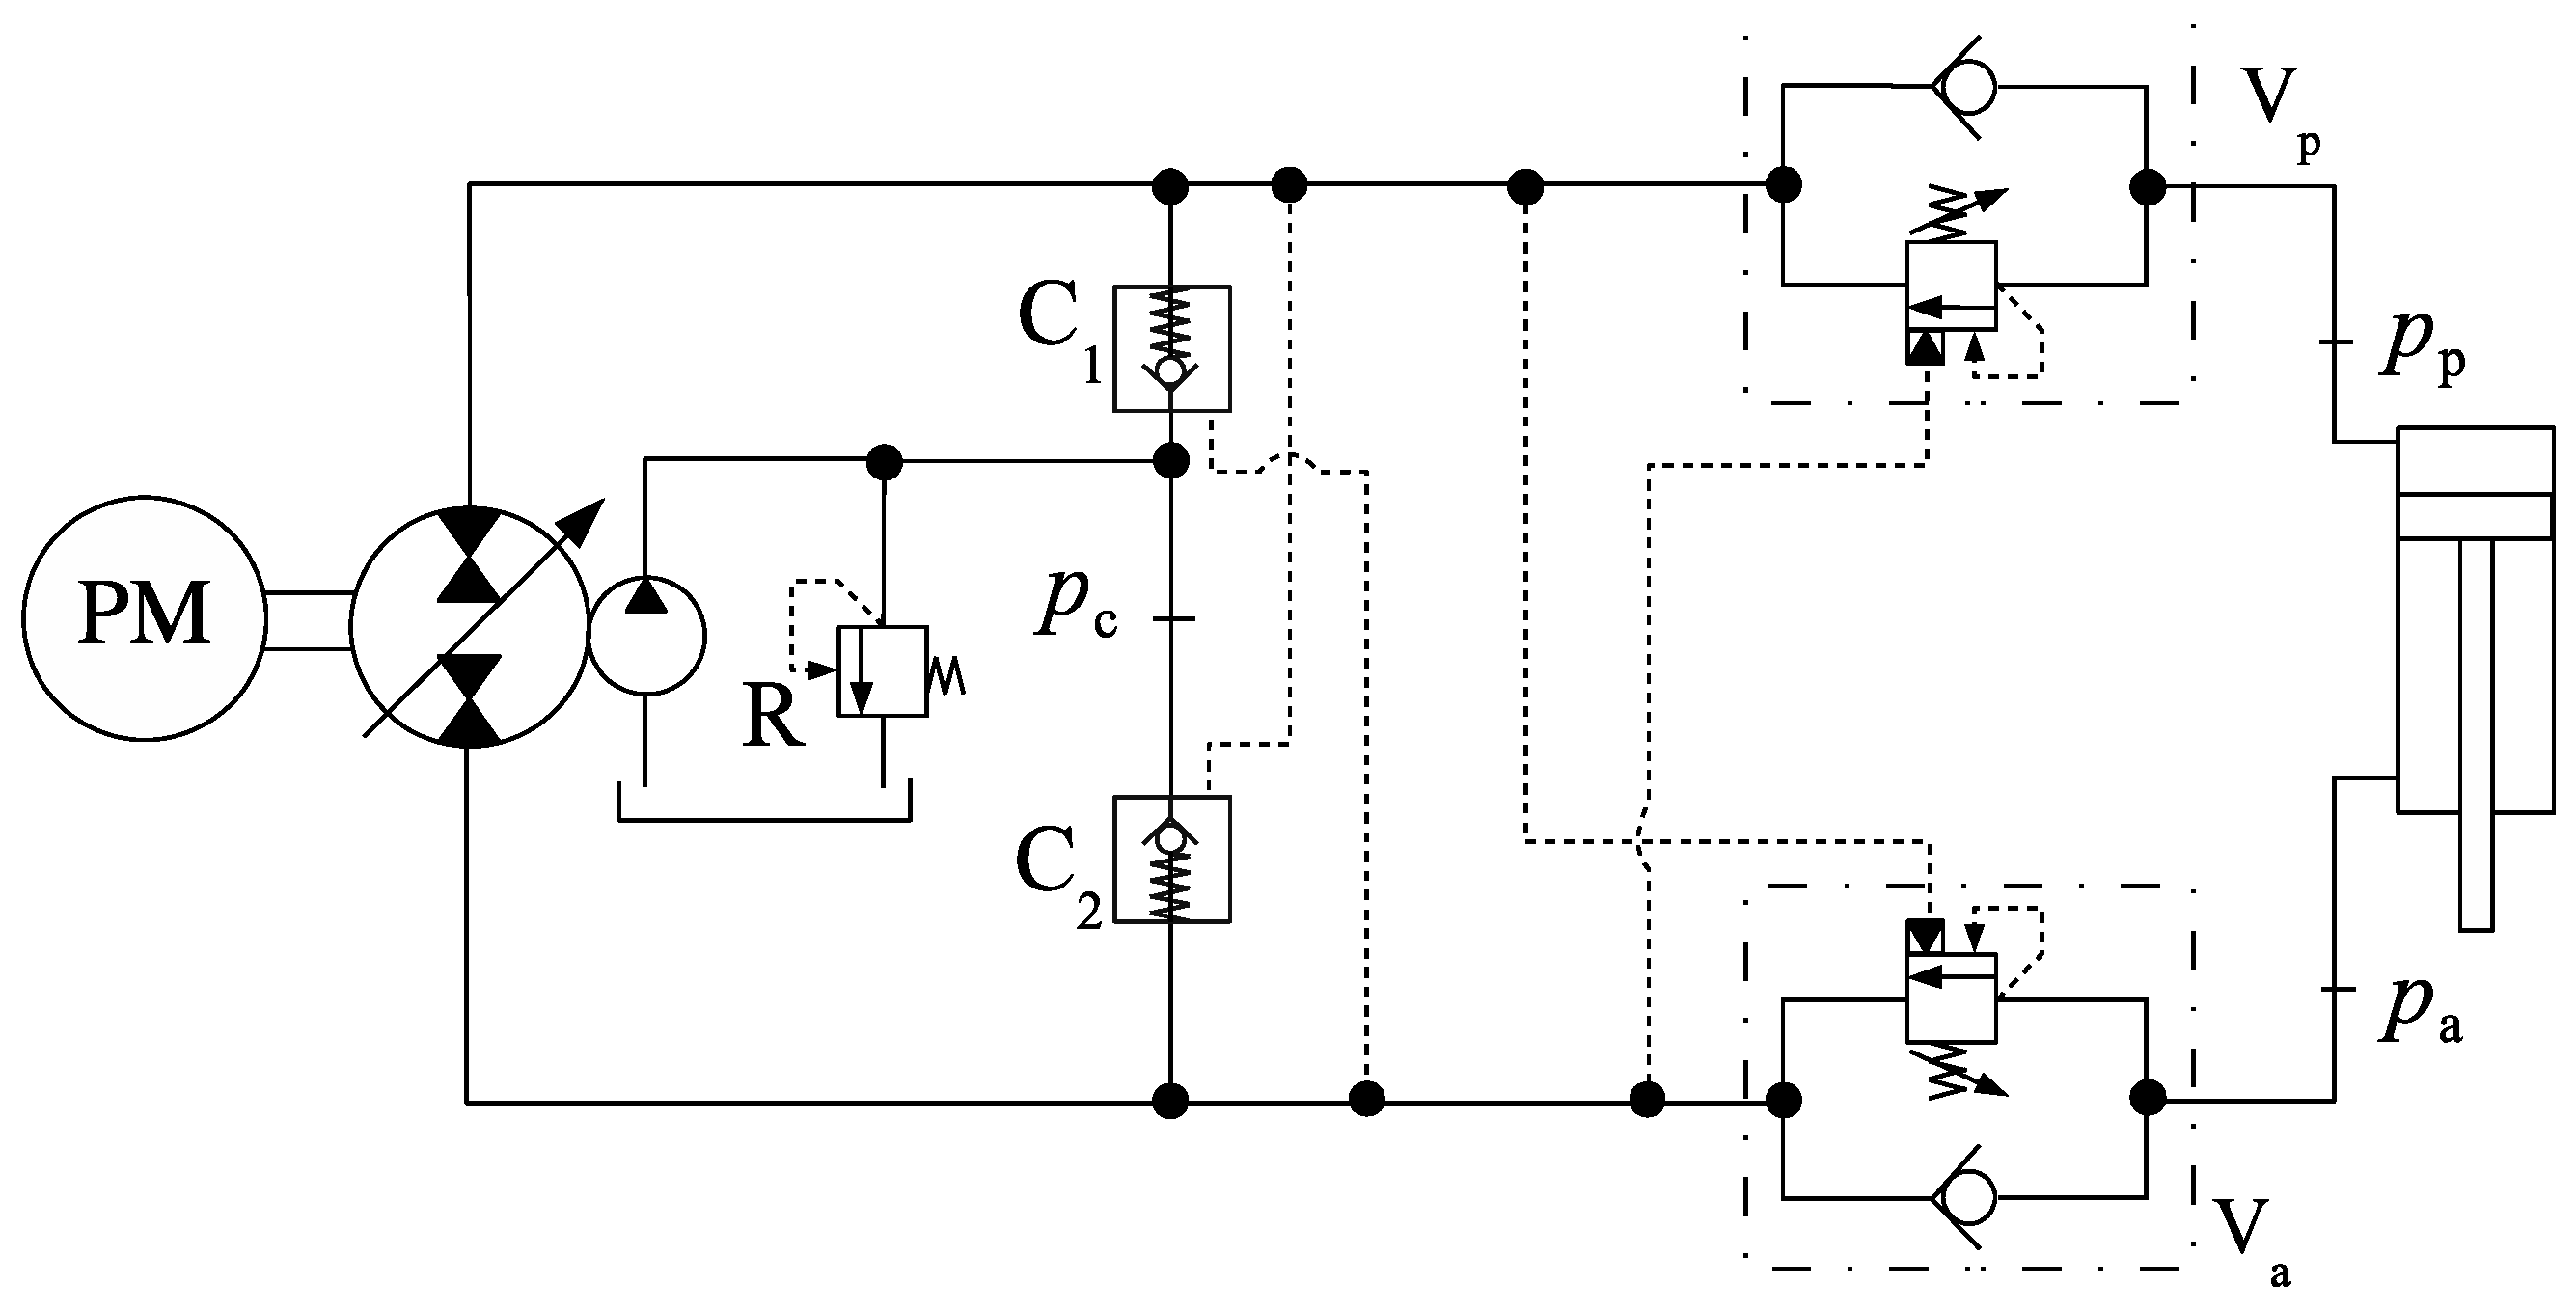
Figure 1 shows a representative subset of the circuits introduced in reference [13], which will be used as a basis for our discussion. The circuits shown in the figure have been described in previous papers and will be analysed here in detail.
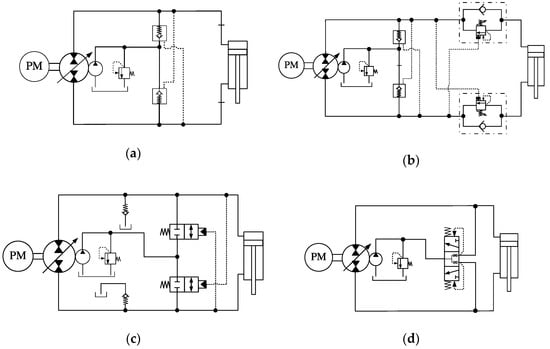
Figure 1.
Single-rod hydrostatic actuators using compensation directional valves: (a) circuit with piloted check valves [6]; (b) circuit with piloted check valves and counterbalance valves [7]; (c) circuit with two directional valves [13]; (d) circuit with one directional valve [8].
In this paper, we conduct numerical simulations of all four of the circuits shown in Figure 1. We compare their performances and, more importantly, investigate the instabilities that occur at some particular operational conditions, most notably, when the external load is low and when the load changes from assistive to resistive.
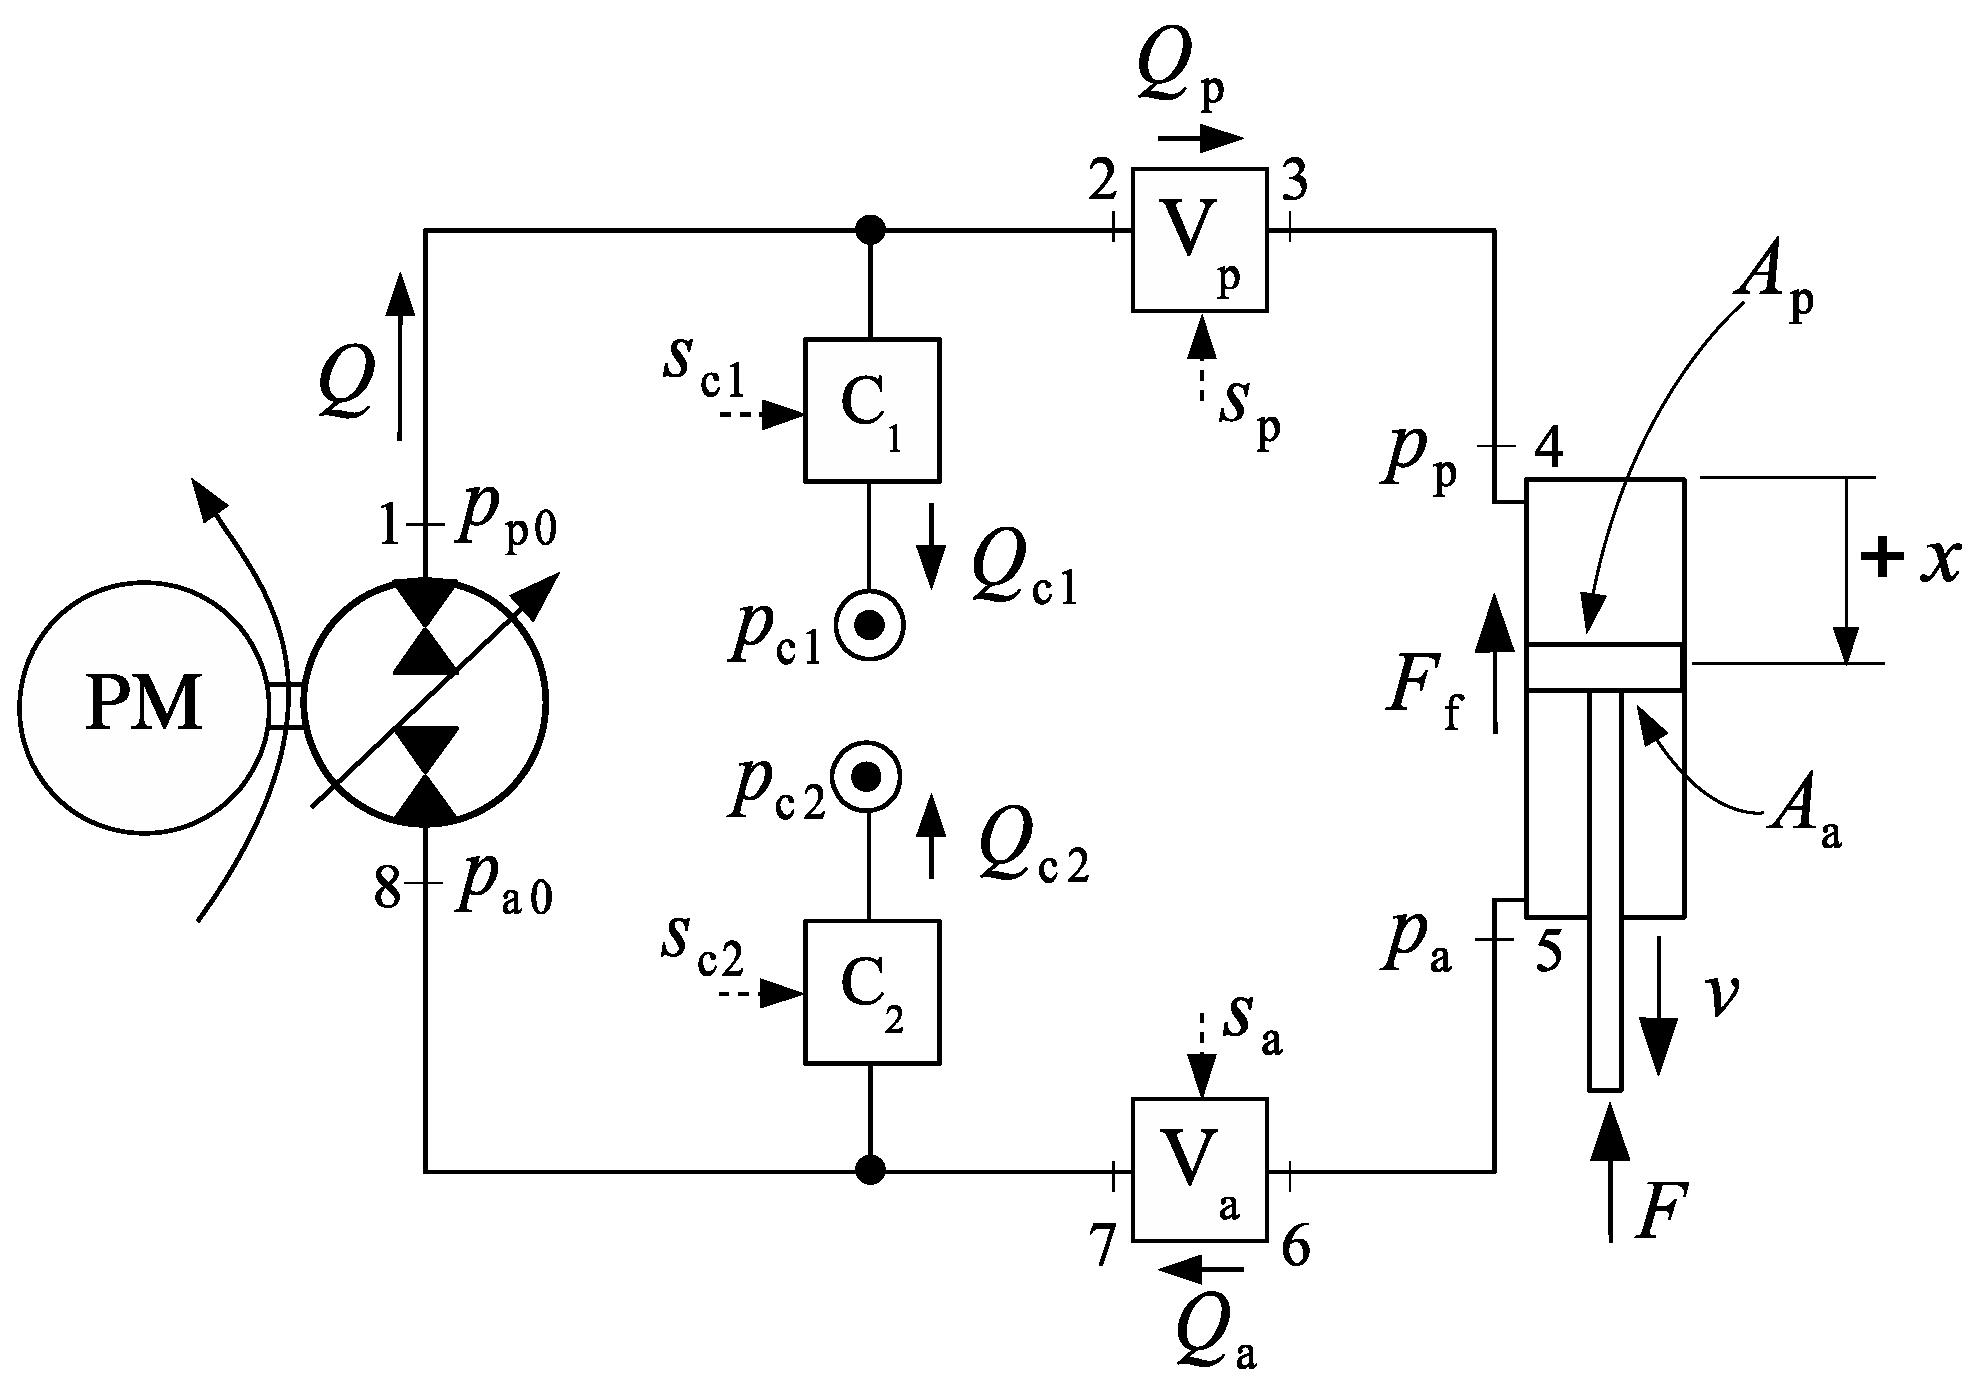
Figure 2 shows the general representation of a valve-compensated actuator. In the figure, pump, cylinder and flows, , , , and are represented by solid arrows. Two compensation valves, C1 and C2, connect the cap and rod sides of the circuit—indicated by the subscripts (piston) and (annulus), respectively—to the charge pressures, and . Valves C1 and C2 may be combined into a single valve, C, and/or connected to a single charge pressure, . The compensation valves, C1 and C2, are activated by external signals, and , the nature of which depends on the technology being employed (hydraulic or electric). Likewise, signals and activate the inline valves, Vp and Va, which may be present at some configurations. Note that the presence of valves Vp and Va creates a pressure differential between the pump and the cylinder ports, i.e., and . Conduit pressure losses are disregarded in our analysis, so that the pressure differentials between the pump and the cylinder cease to exist in the absence of valves Vp and Va, as is the case in a number of circuit designs. The piston and annulus areas of the differential cylinder are and , respectively. The piston-to-annulus area ratio is defined as . Finally, the external force is represented as , and the friction force, , is given by [3].
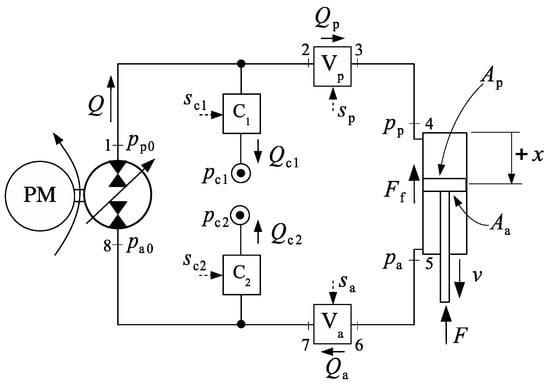
Figure 2.
General representation of a typical valve-compensated single-rod hydrostatic actuator.
In (1), is the Coulomb friction, is the Stribeck friction, is the viscous friction coefficient, is the sliding speed coefficient and is a sufficiently small threshold speed value (), chosen so that the friction force can be linearly approximated within the interval . The function returns the value , when is oriented as in Figure 1 and otherwise.
A force balance on the cylinder shown in Figure 2 results in
where is the combined mass of piston, rod and load.
Considering the effective bulk modulus, , a mass balance can be carried out at line 1–2, in Figure 2. The same can be done for lines 3–4, 5–6 and 7–8, as follows:
where is the fluid volume in the conduits and valves between points and, respectively; is the cylinder stroke and is the distance travelled by the piston.
Observe that we are not considering fluid evaporation due to cavitation in Equations (3), which would add a degree of complexity that is not needed in the present work.
In the particular case where the valves Vp and Va are not present, as in Figure 1a,c,d, we have that and . Equation (3) then reduces to
Equations (2) and (3) or, Equations (2) and (4) together with the relation will be used to model the circuits in this paper. Note that other equations must be provided for the compensation flows, and . These equations depend on the commutation valves being used. Here, we apply the commonly employed assumption that compensation valves move fast enough that dynamic forces can be disregarded. Table 1 lists the values of some common data that will be used in all the examples of this paper.

Table 1.
Basic data used in the numerical simulations.
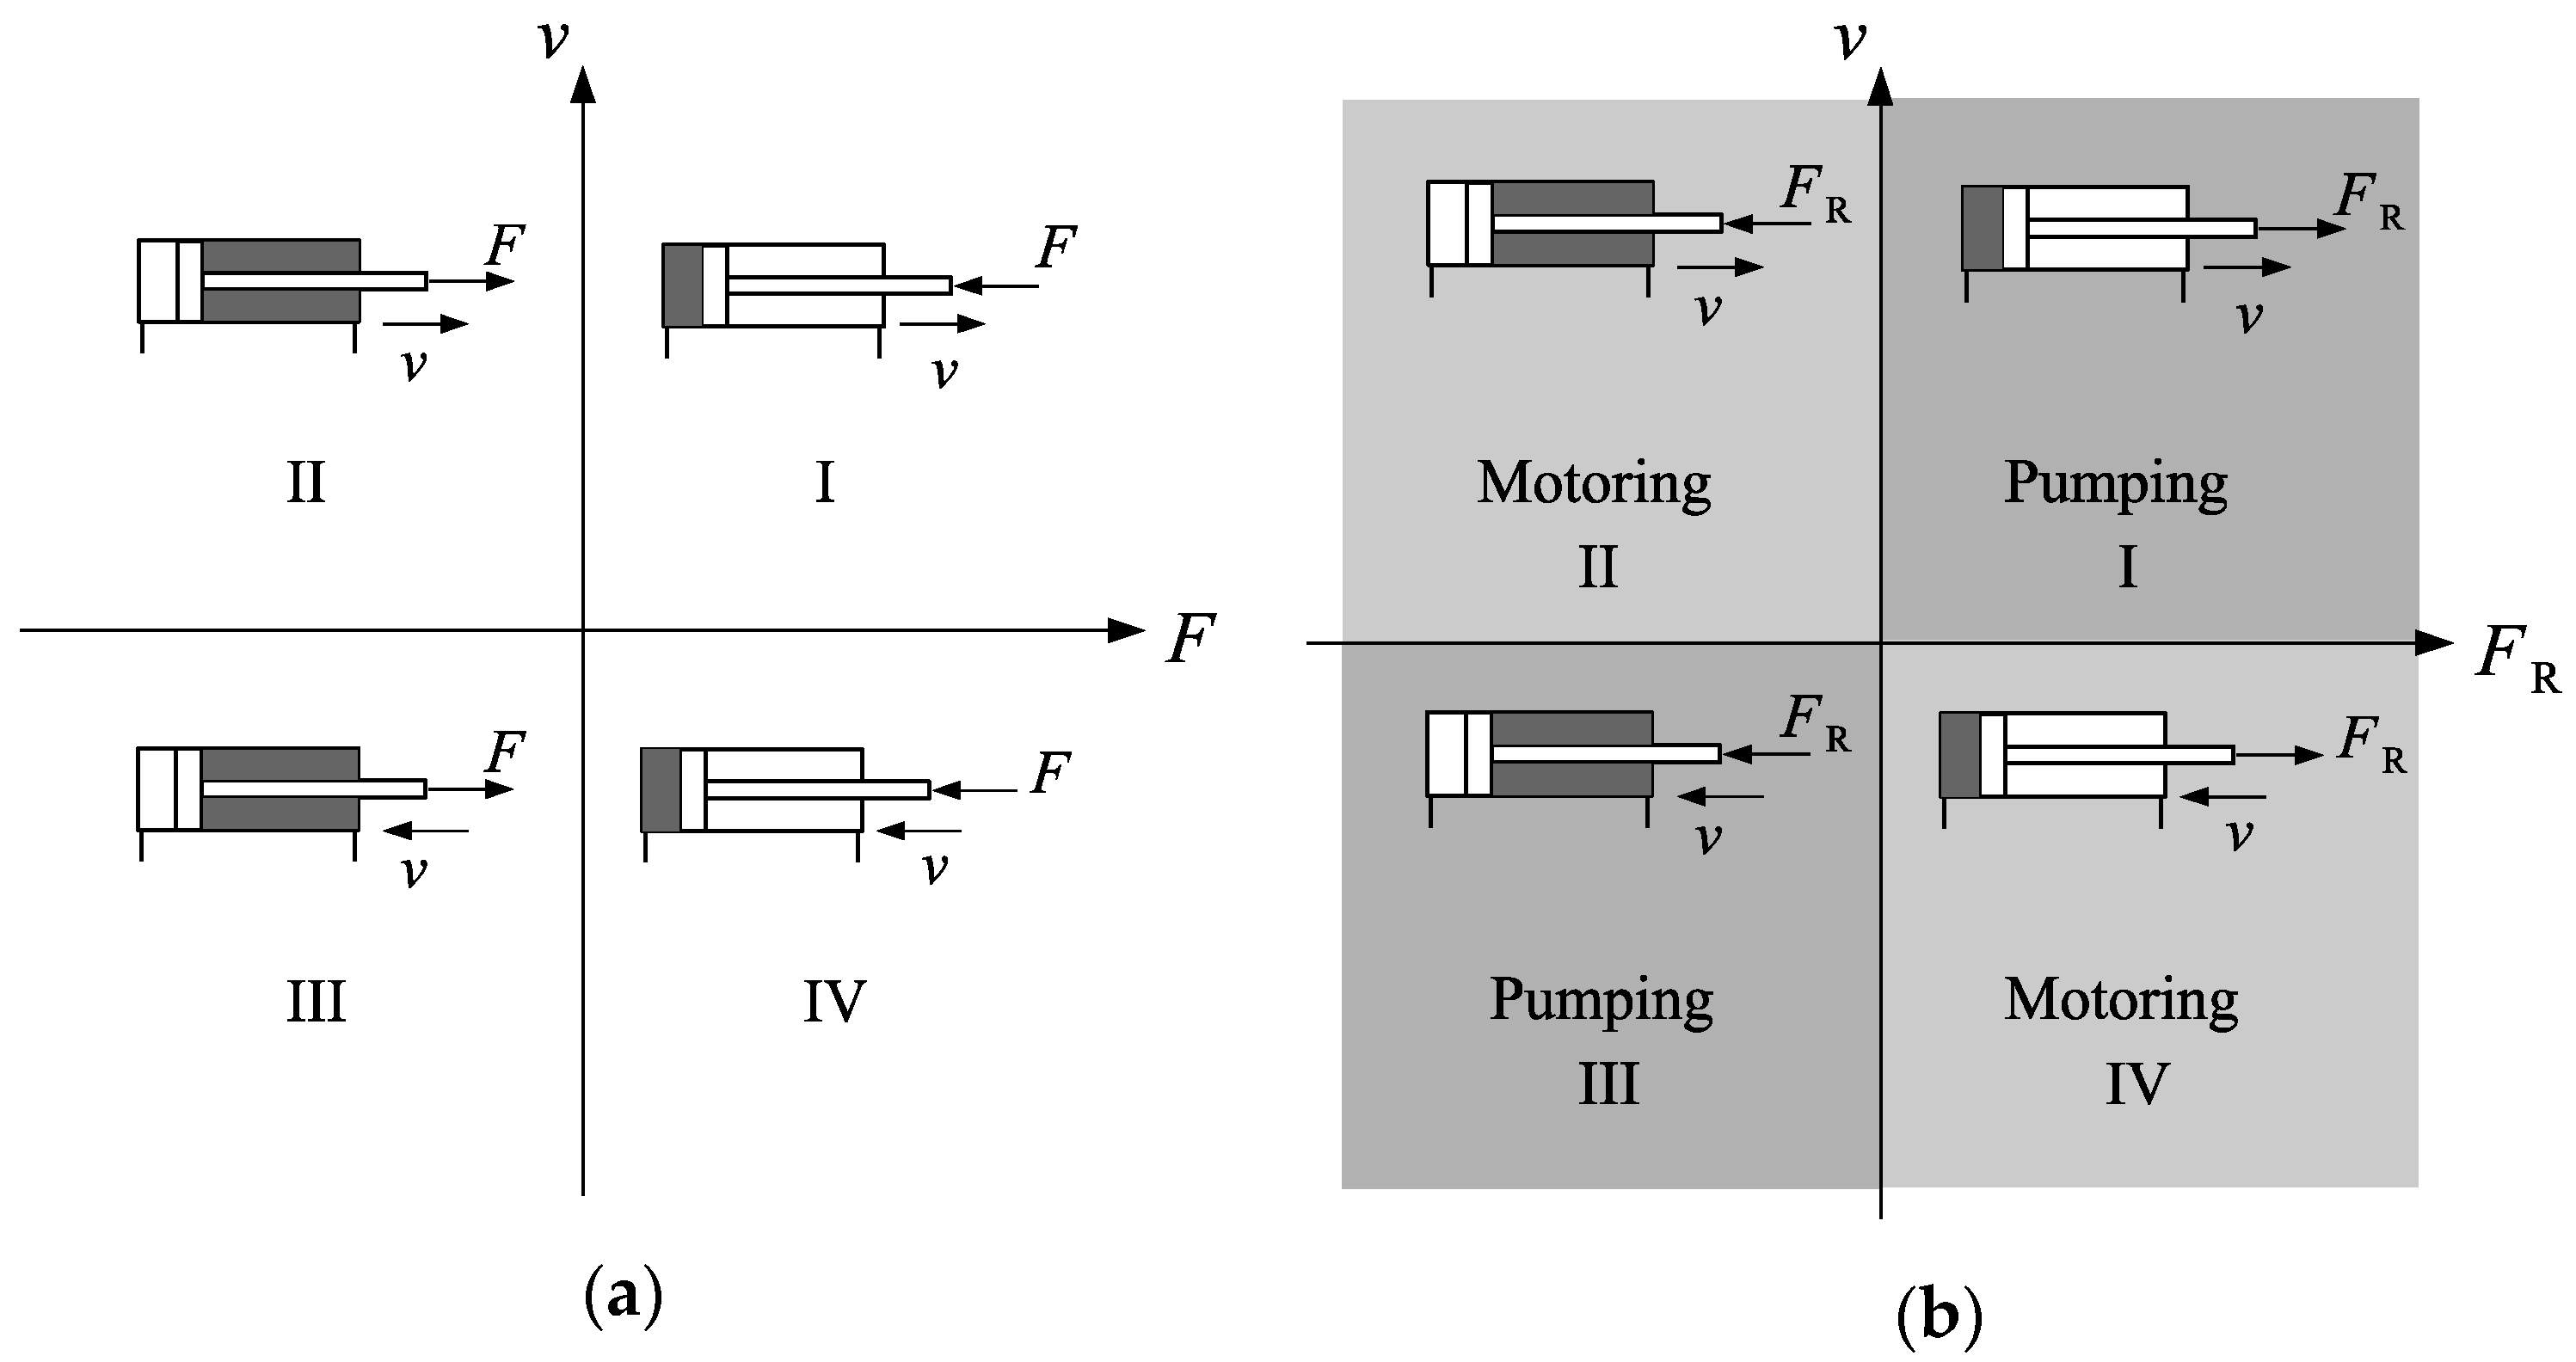
The relative signs of the external force and cylinder velocity have long been used as indicators of the operational quadrant in hydrostatic actuators [3], as shown in Figure 3a. Recently, this has been questioned [1], and a new operational quadrant division was proposed (see Figure 3b), with the cylinder force, , being defined as
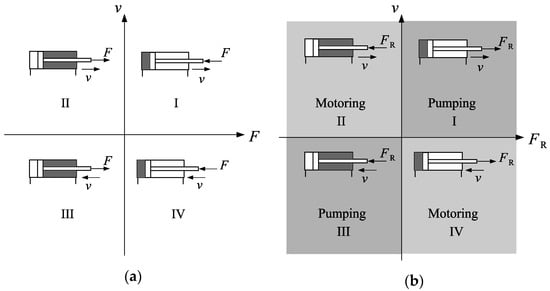
Figure 3.
Operational quadrant divisions: (a) External force versus velocity; (b) actuator force versus velocity.
In what follows, we study each of the four circuits in Figure 1 in detail. The methodology used is to simulate these circuits numerically, as the actuator shifts from a motoring to a pumping quadrant. This approach puts to test the correct shifting of the compensation valves in the most demanding scenarios. We will demonstrate that in all the circuits in Figure 1, there is a poor control of the cylinder at low loads or, in most cases, no control at all. Even more importantly, we show that attempts to reduce circuit oscillations through damping mechanisms do not solve the low-load performance problem, which indicates that something else lies as an unresolved issue, at the root of every circuit design. Finally, we simulate one recently developed solution that claims to have established the foundations to the correct approach to valve-compensated circuits [1,12]. We confirm that this claim is indeed correct as we proceed to show the superiority of the proposed circuit when compared to other designs shown in Figure 1. It is important to reinforce that we are only concerned with the correct redirection of the compensation flows and do not intend to delve into all sorts of oscillation sources in hydraulic circuits. This is not the goal of this paper. However, once the flow redirection problem is solved, future research can focus on other aspects of the actuator design.
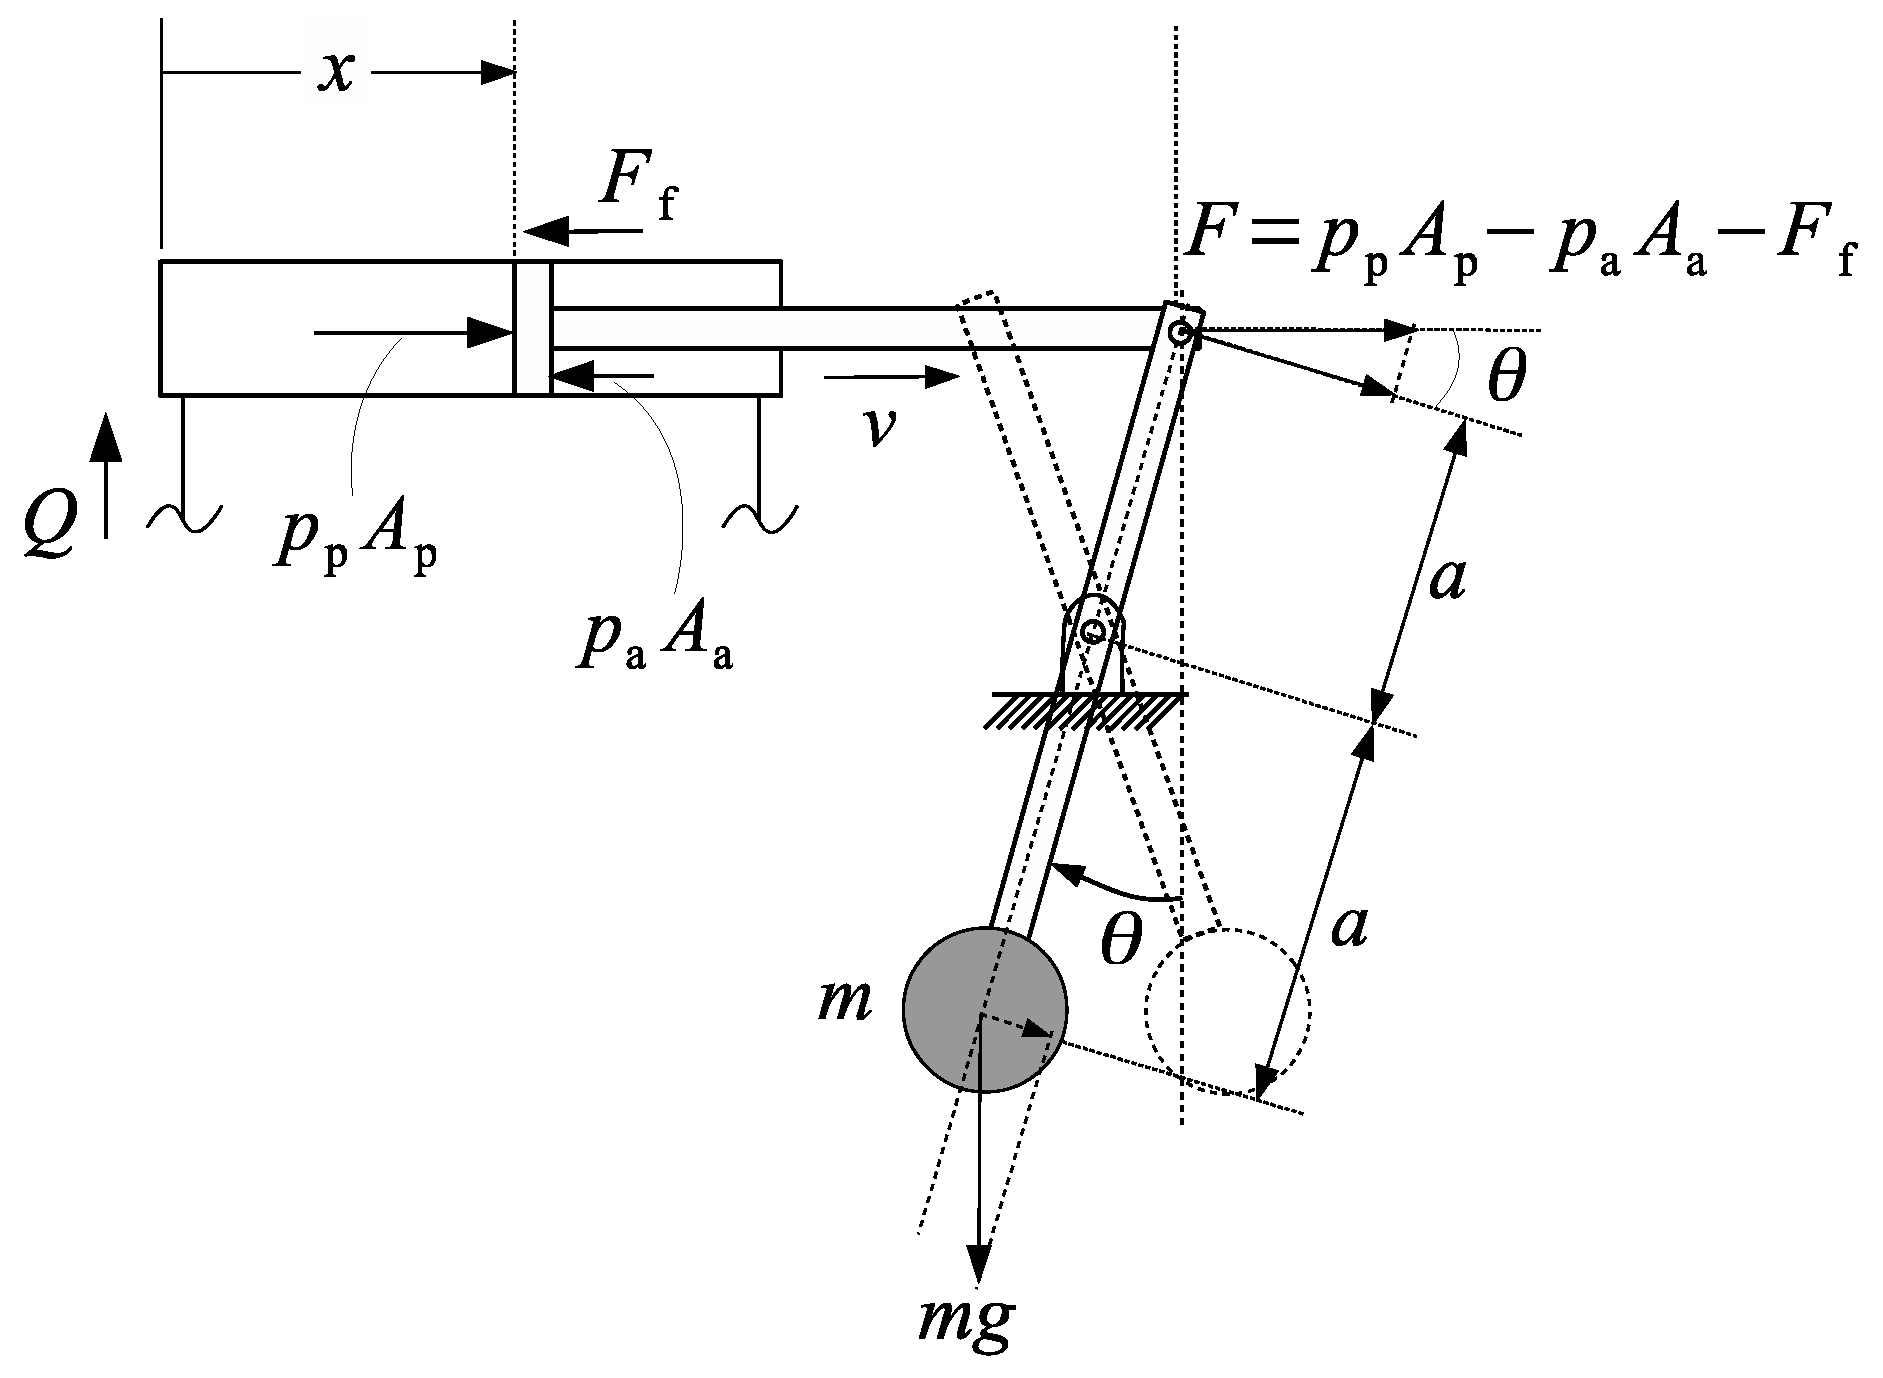
Figure 4 illustrates the application case studied in this paper. In the figure, the cylinder rod is attached to a link, similar to the stick in an excavator. As the actuator moves, the mass, , is displaced from the extreme right () to the extreme left (), the force, acting on the cylinder rod changes between two maximum values, and and the circuit shifts from quadrant II (motoring) to quadrant I (pumping).
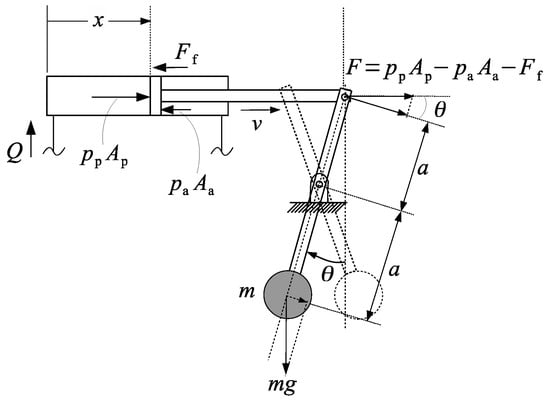
Figure 4.
Pendular motion driven by a single-rod hydraulic cylinder.
Applying a static force balance (disregarding inertial forces) to the lever attached to the mass, , in Figure 4, we obtain
Assuming that the cylinder is at mid-stroke () when the pendulum stays in the vertical position, we propose the following approximation for
To avoid unnecessary oscillations at the beginning, we slowly increase the flow into the cap-side of the cylinder from to . Therefore, the following expression will be used for the pump flow, , in Equations (3) and (4)
where is an attenuation factor. In our simulations, we have used .
The period of time, , during which the cylinder moves between two actuator positions to can be approximately given by
In our simulations, we used Equation (6), with given by Equation (7), with . All the simulations were carried out for (corresponding to ).
2. Circuit with Pilot-Operated Check Valves
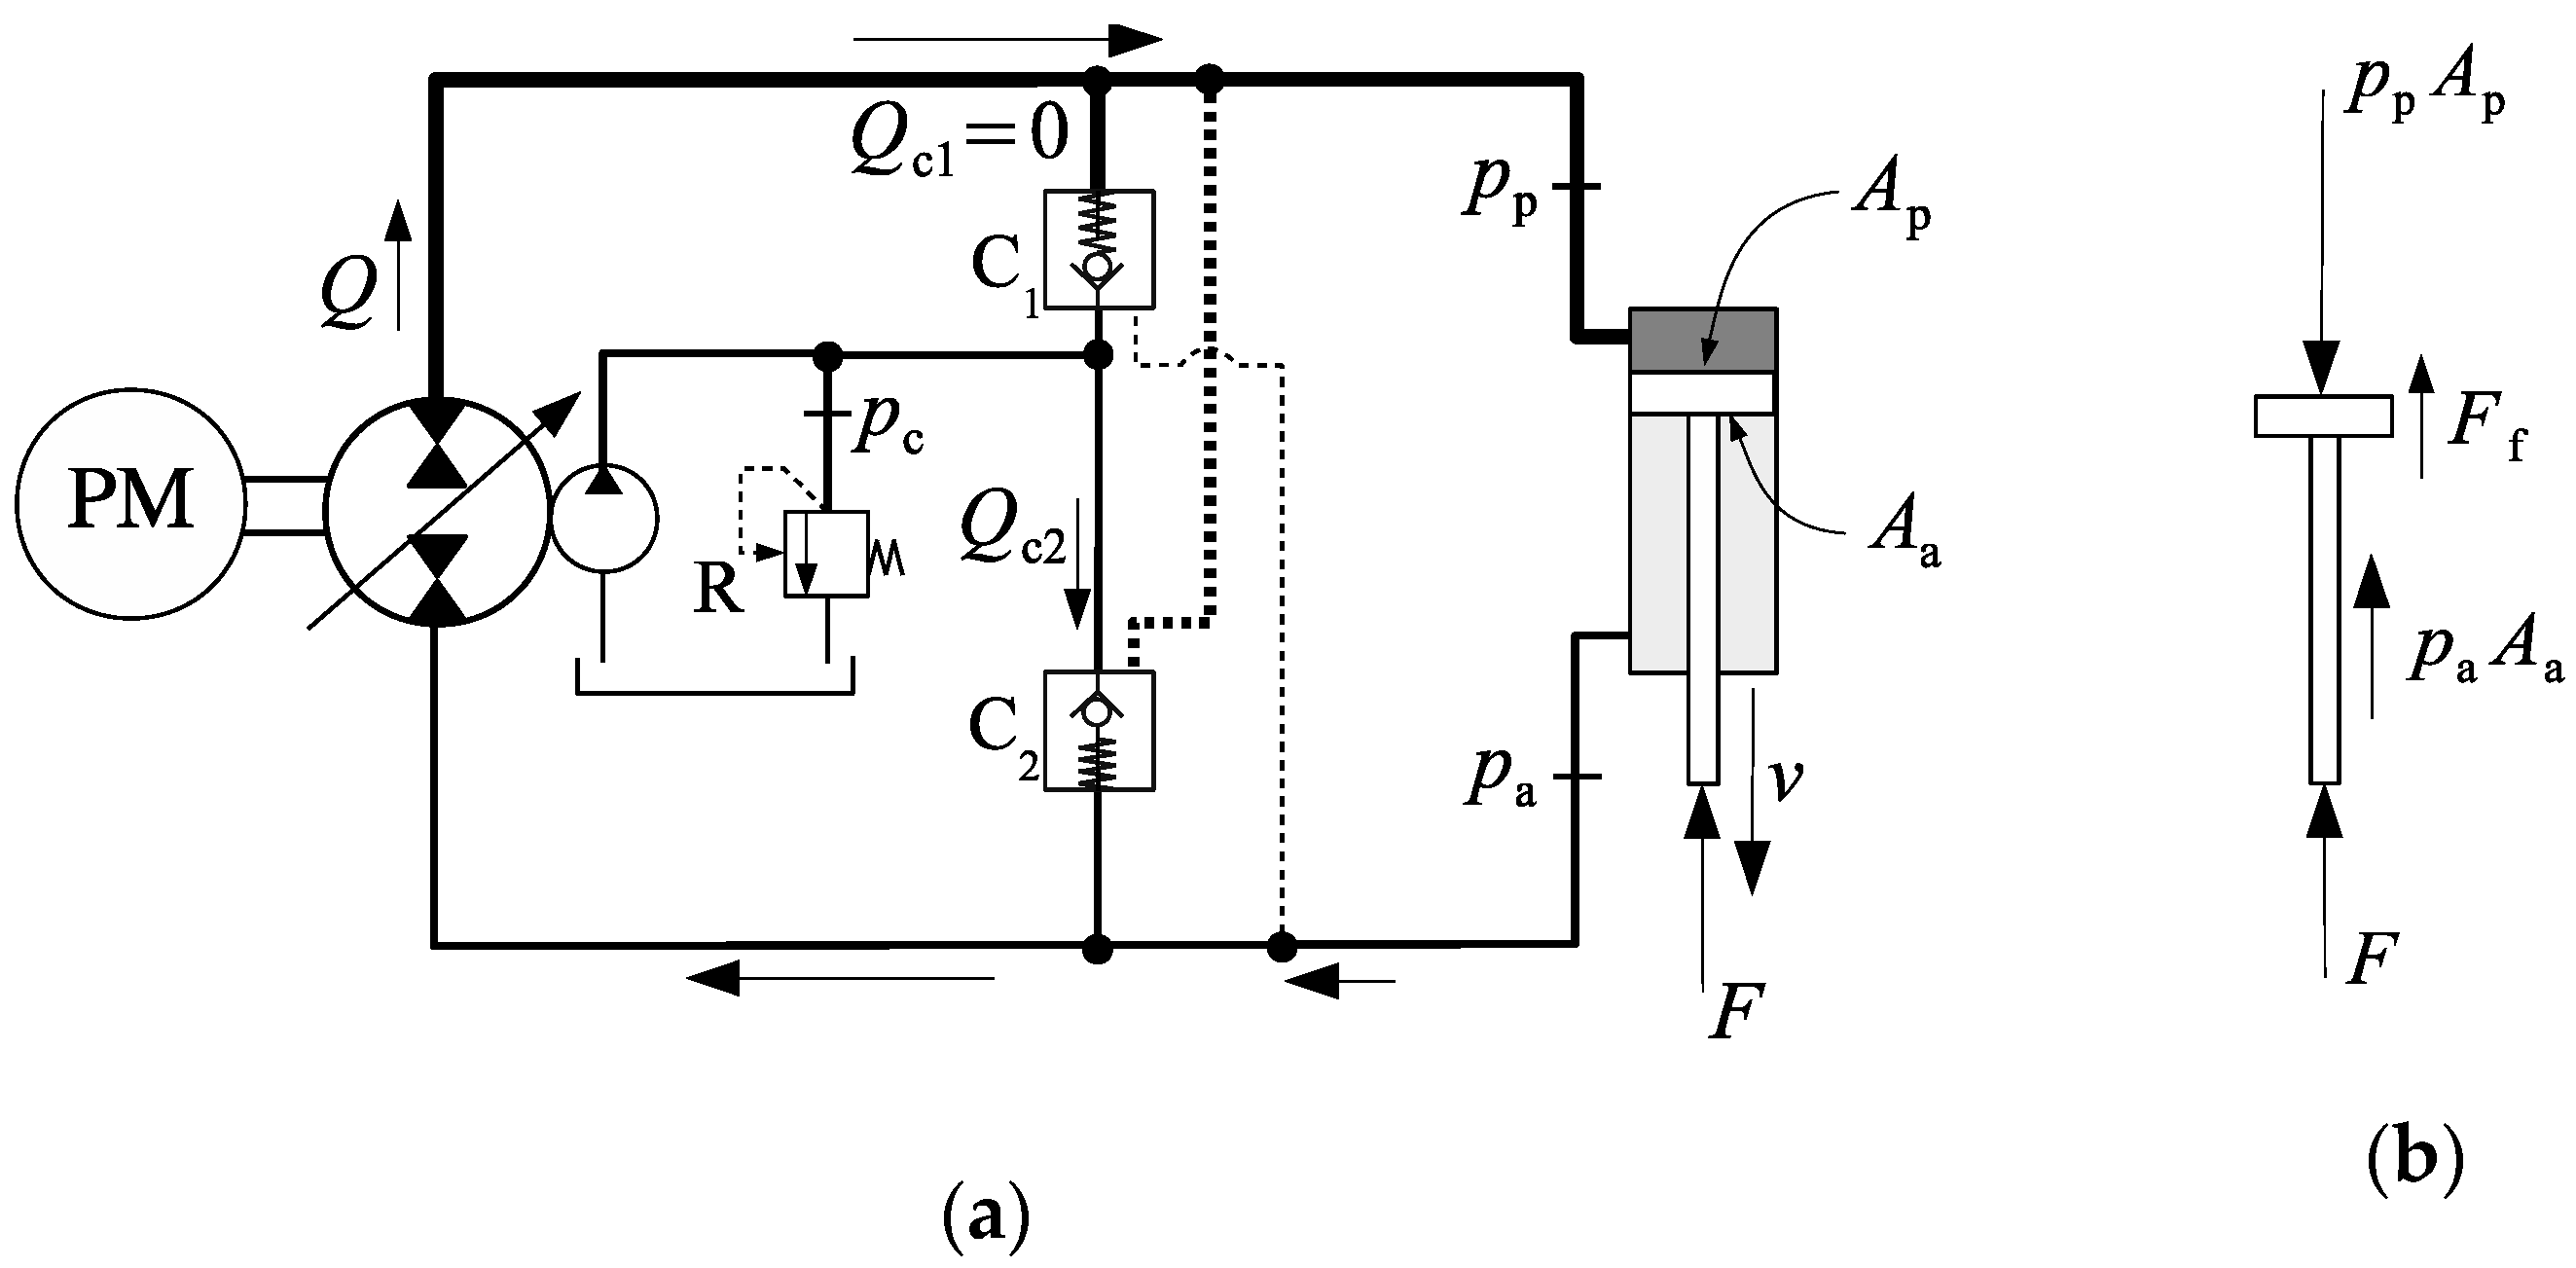
Consider the circuit in Figure 1a, reproduced again in Figure 5a, where the pump pushes the actuator against an external force, . The forces acting on the rod and piston are shown in Figure 5b. Equation (6) can be applied to all operational quadrants, as defined in Figure 3a, by correctly adjusting the signs of the velocity and the external force. The expected behaviour of valves C1 and C2 depend on the operational quadrant and is given in Table 2.
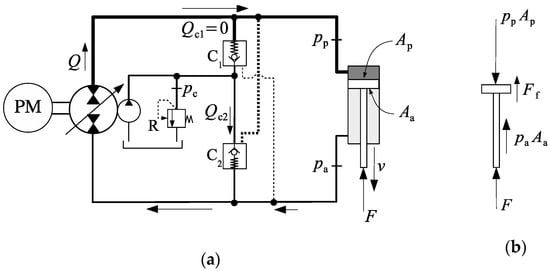
Figure 5.
First quadrant operation of the circuit shown in Figure 1a: (a) operational diagram; (b) forces acting on the piston and rod.

Table 2.
Expected behaviour of valves C1 and C2 at each operational quadrant.
The term “critical” has been used for the region of operation where the two valves C1 and C2, in the circuit shown in Figure 5a are simultaneously open or closed [7,8,9]. In such case, it is clear that the circuit will not operate properly. Here, we extend the definition of “critical region” to encompass the area on the velocity versus external force diagram in Figure 3a, where valves C1 and C2 are incorrectly open or closed. By studying the circuit in Figure 5a, we identify that the correct behaviour of valves C1 and C2 should be as indicated on the second column of Table 2. However, this is not what has been observed and reported in practice, as will be fully described by performing a numerical simulation on the circuit in Figure 5a. Our starting point is to consider Equations (2) and (4). We rewrite these equations for the particular case where
The check valve flows, and , in Equations (10), are modelled by the following equations [3]:
In Equation (11), is the charge pressure and is the pressure at the valve output ( for valve C1 and for valve C2); is the valve coefficient, taken as , so that a flow through the valve creates a pressure drop of . This is an average value but otherwise, quite reasonable and stands between the very low pressure drop of typical check valves (less than , for this flow magnitude) and the relatively higher pressure drops of directional valves (around , found in industrial manufacturer catalogues (see, for example, reference [17]). Under the assumption that valve channels can be treated as orifices, we might as well understand that the flow regime is turbulent within the valves.
The first equation in (11) comes from a modification of the orifice equation to account for the relative poppet displacement. This way of treating a variable poppet displacement is simple [18], but it is sufficient for the purpose of this analysis. In order to determine the opening conditions of valves C1 and C2, we follow reference [13] where the opening conditions for valve C1 are defined below:
Likewise, for valve C2
In most of our simulations, we have used , and in inequalities (12) and (13). The values for the other parameters are given in Table 1.
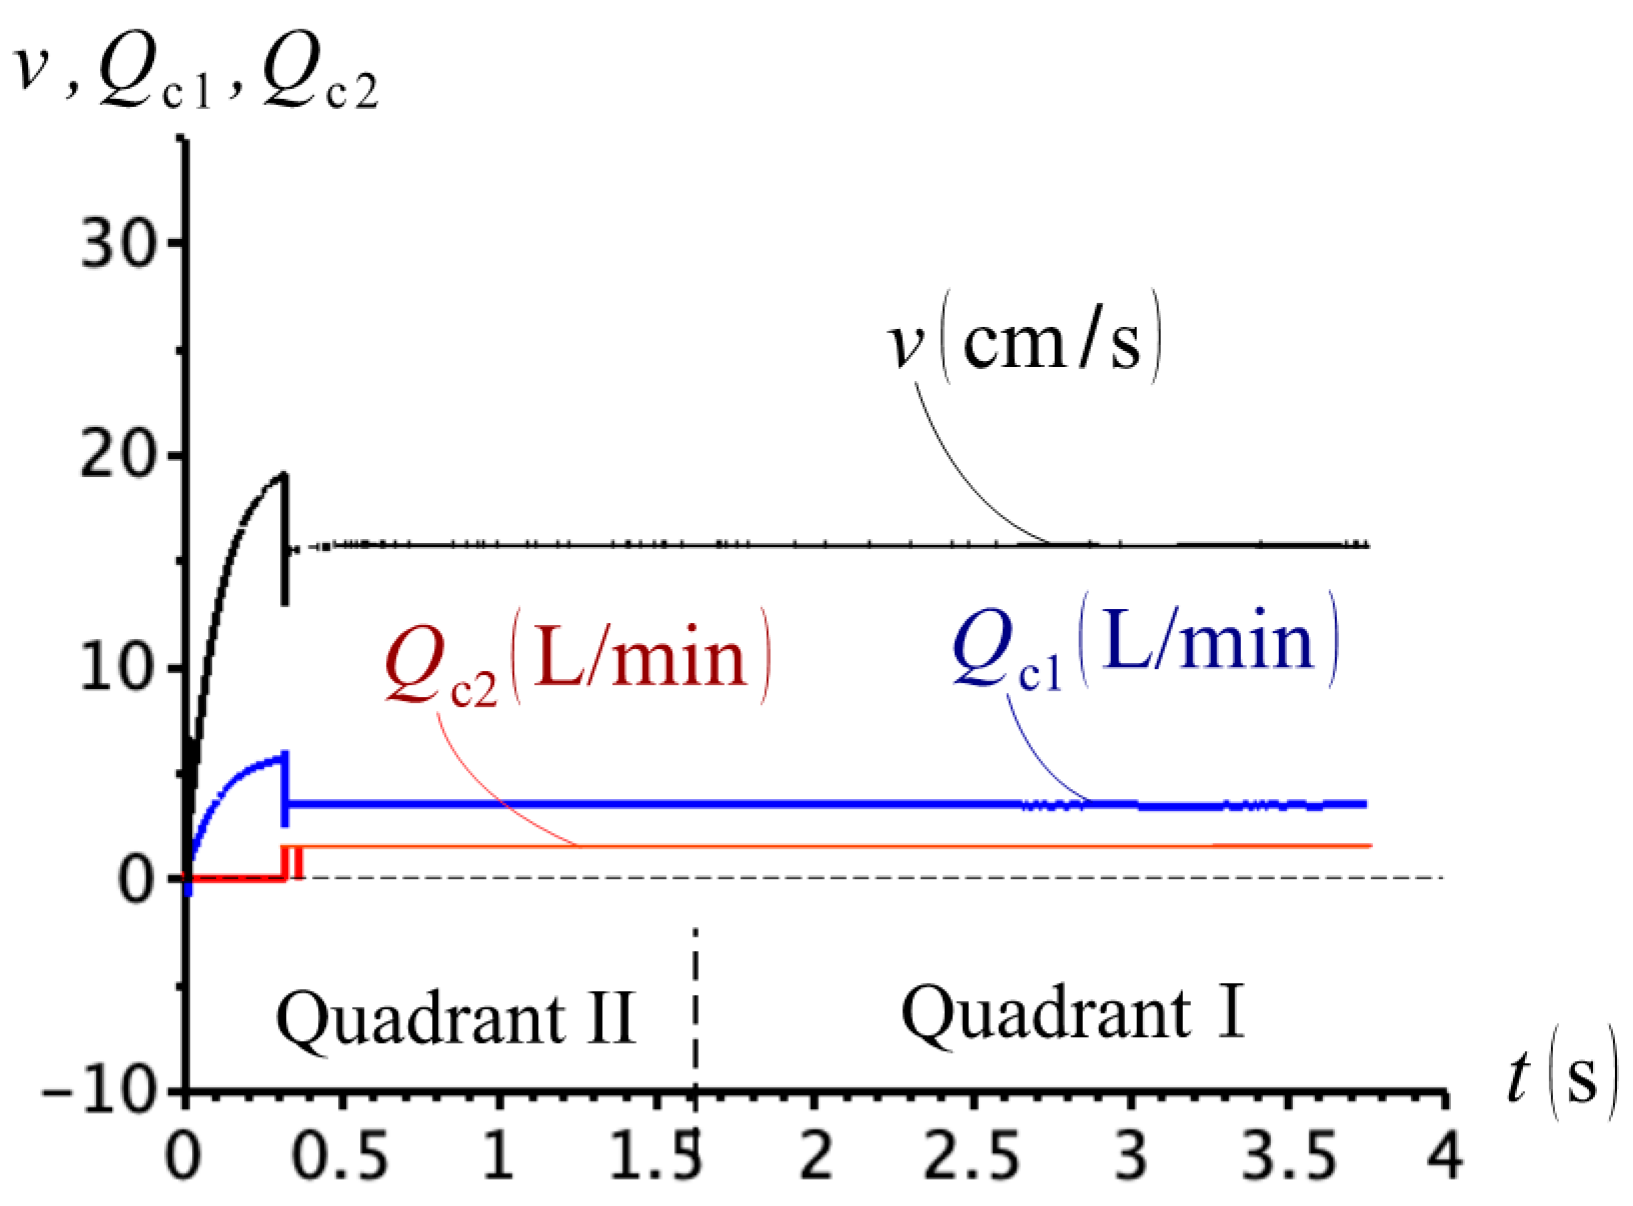
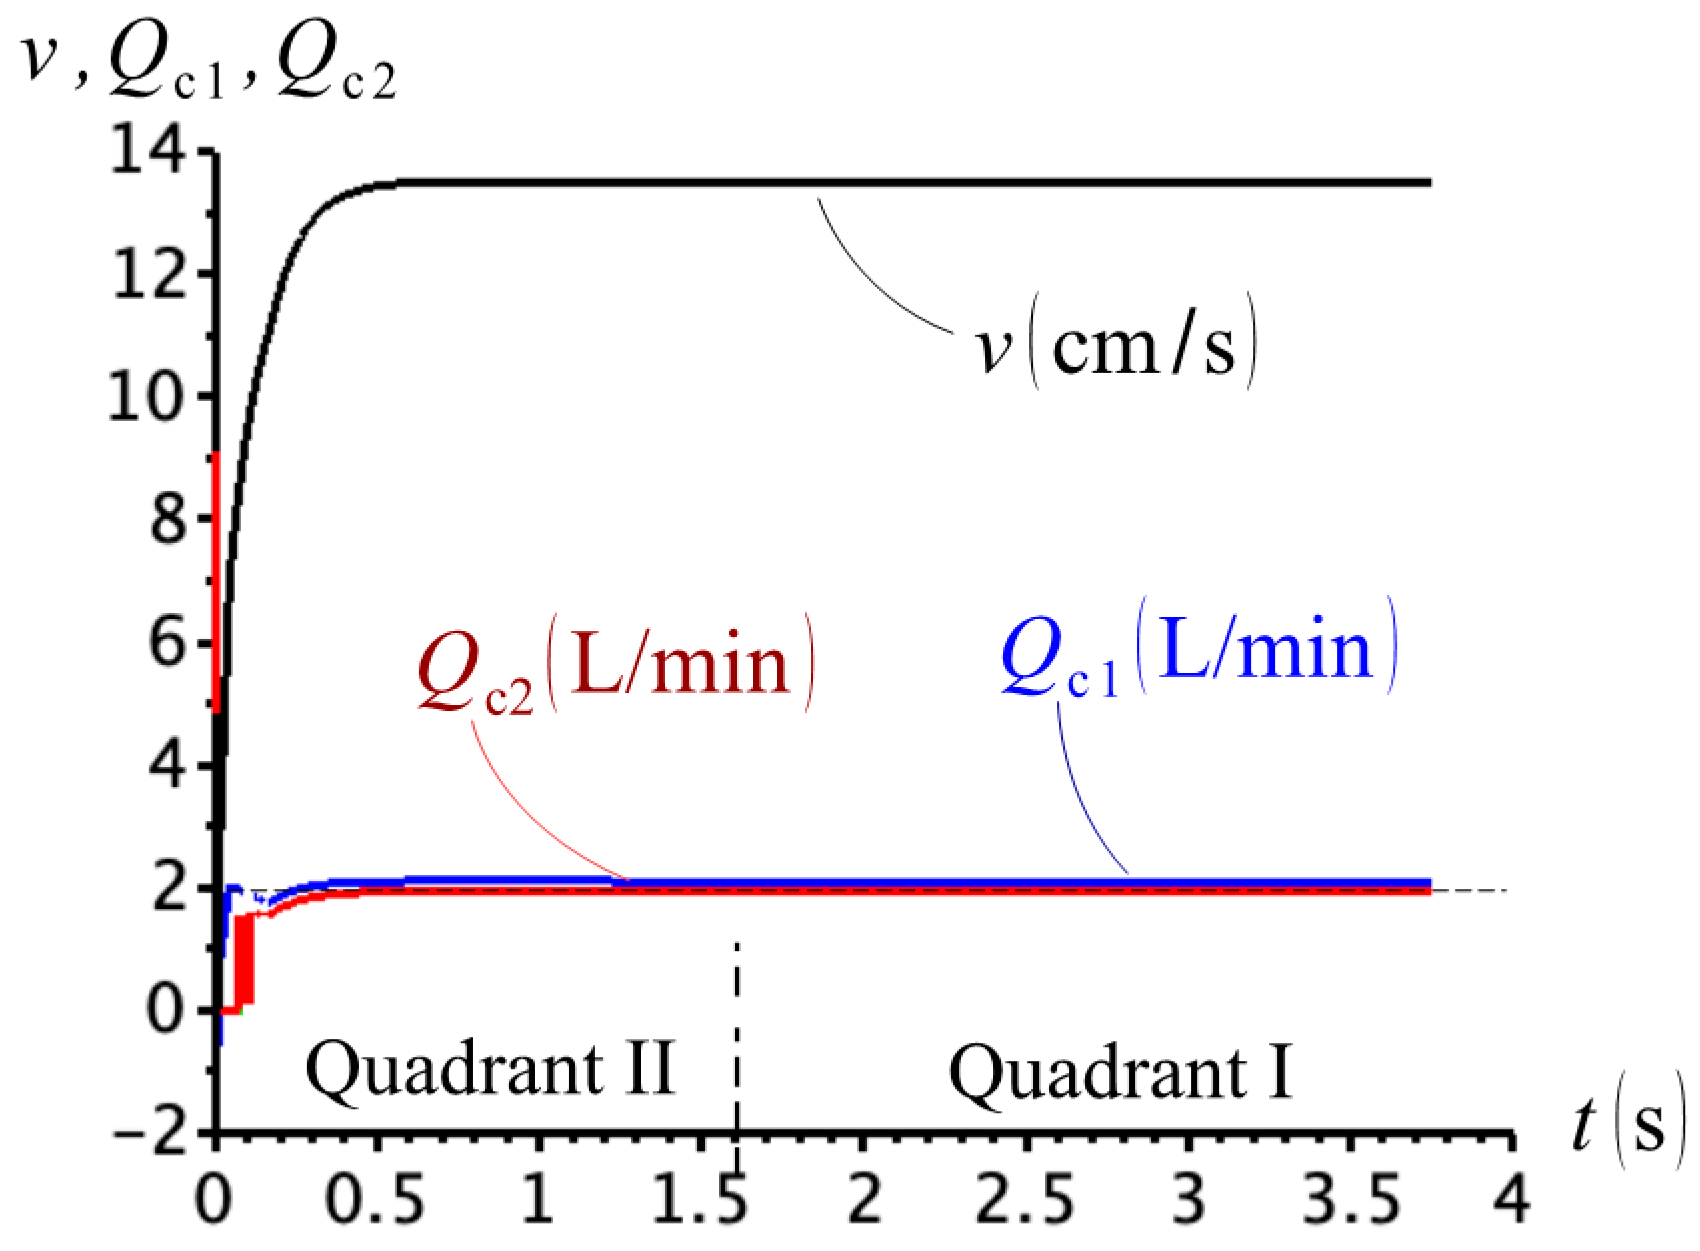
Our first numerical experiment simulates the limiting condition where a small mass, , is attached to the pendulum in Figure 4. Considering a flow, the expected velocities at quadrants II and I are and , respectively. However, it is only at the very beginning of the second quadrant that the circuit behaves correctly, with valve C1 being opened and valve C2 closed, as seen in Figure 6 (the status of valves C1 and C2 can be inferred by the presence of the flows and ). Note that, shortly after the beginning of the second quadrant, both flows, and , are non-zeros, indicating that valves, C1 and C2, remain simultaneously open, during the whole simulation. The practical implication is that the charge pump is driving the cylinder alongside with the main pump, meaning that the cylinder is not exclusively controlled by the pump as it extends.
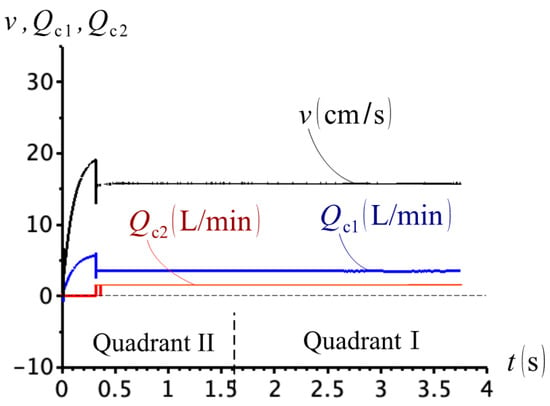
Figure 6.
Cylinder velocity and check valve flows for load mass .
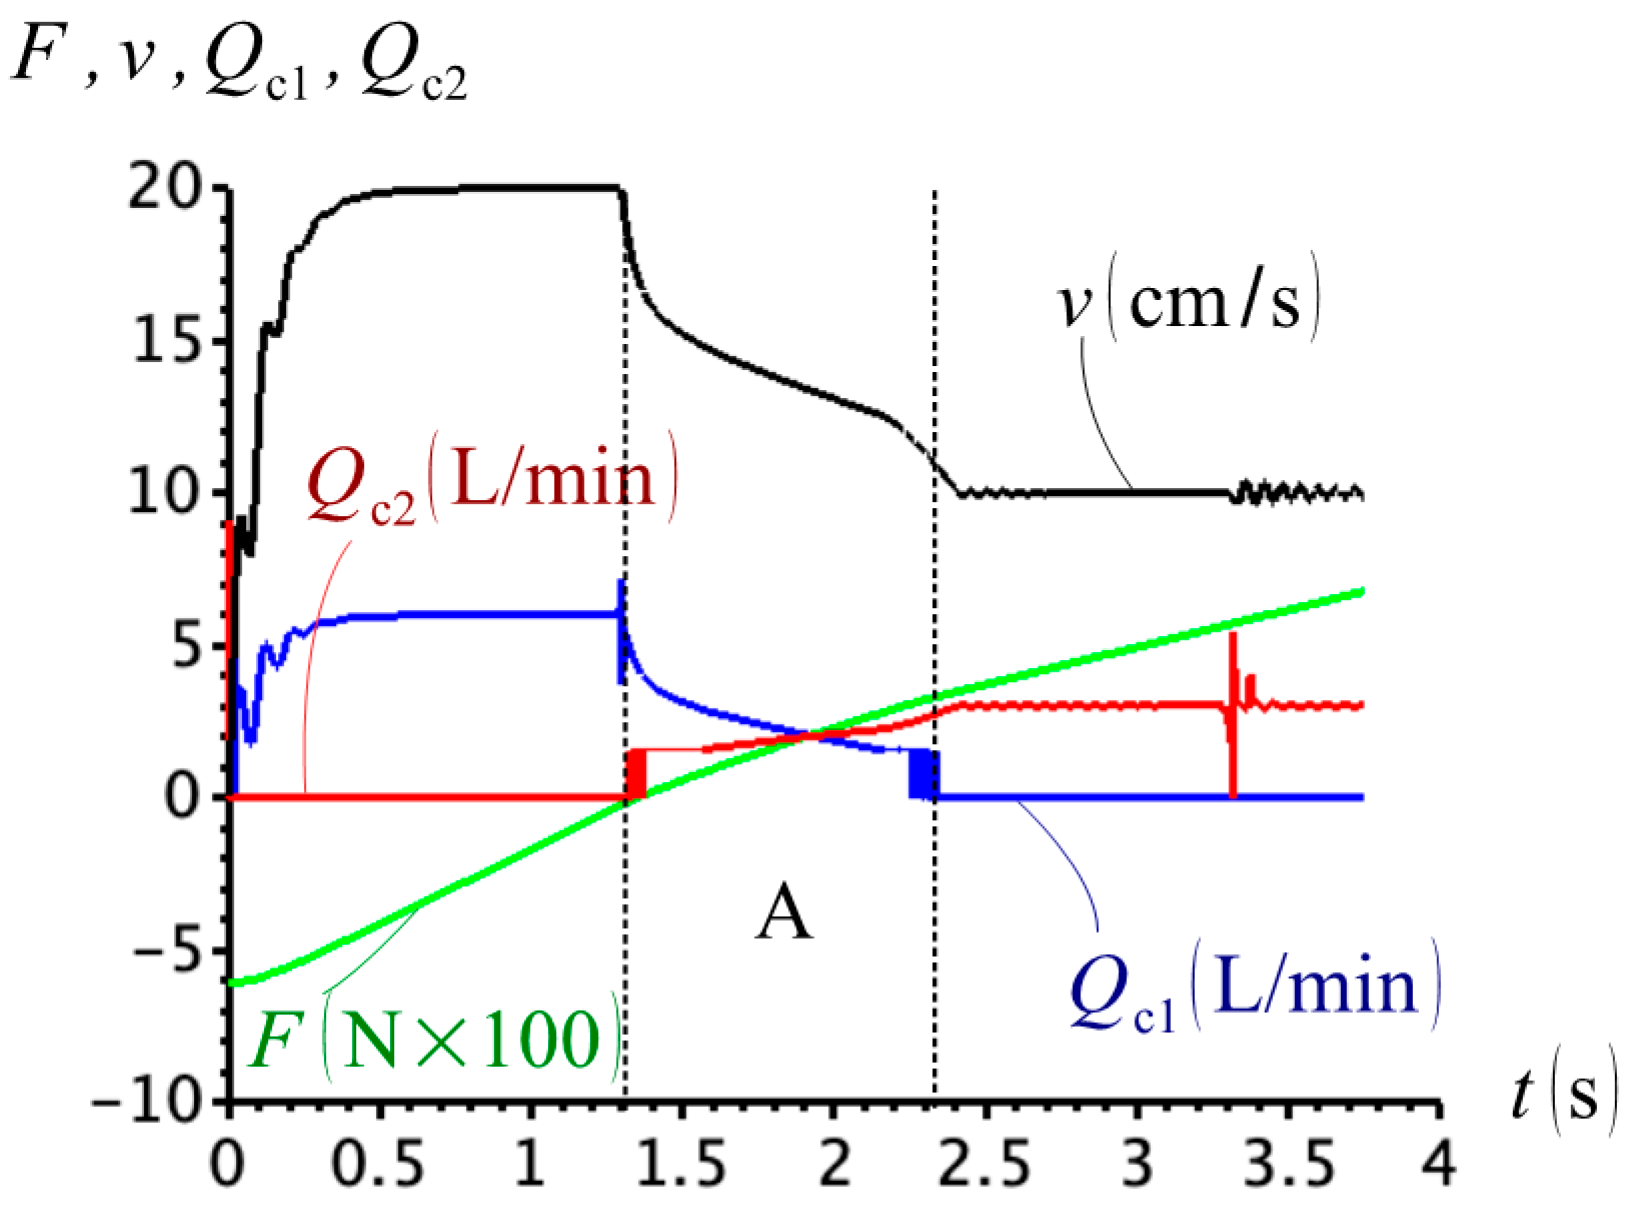
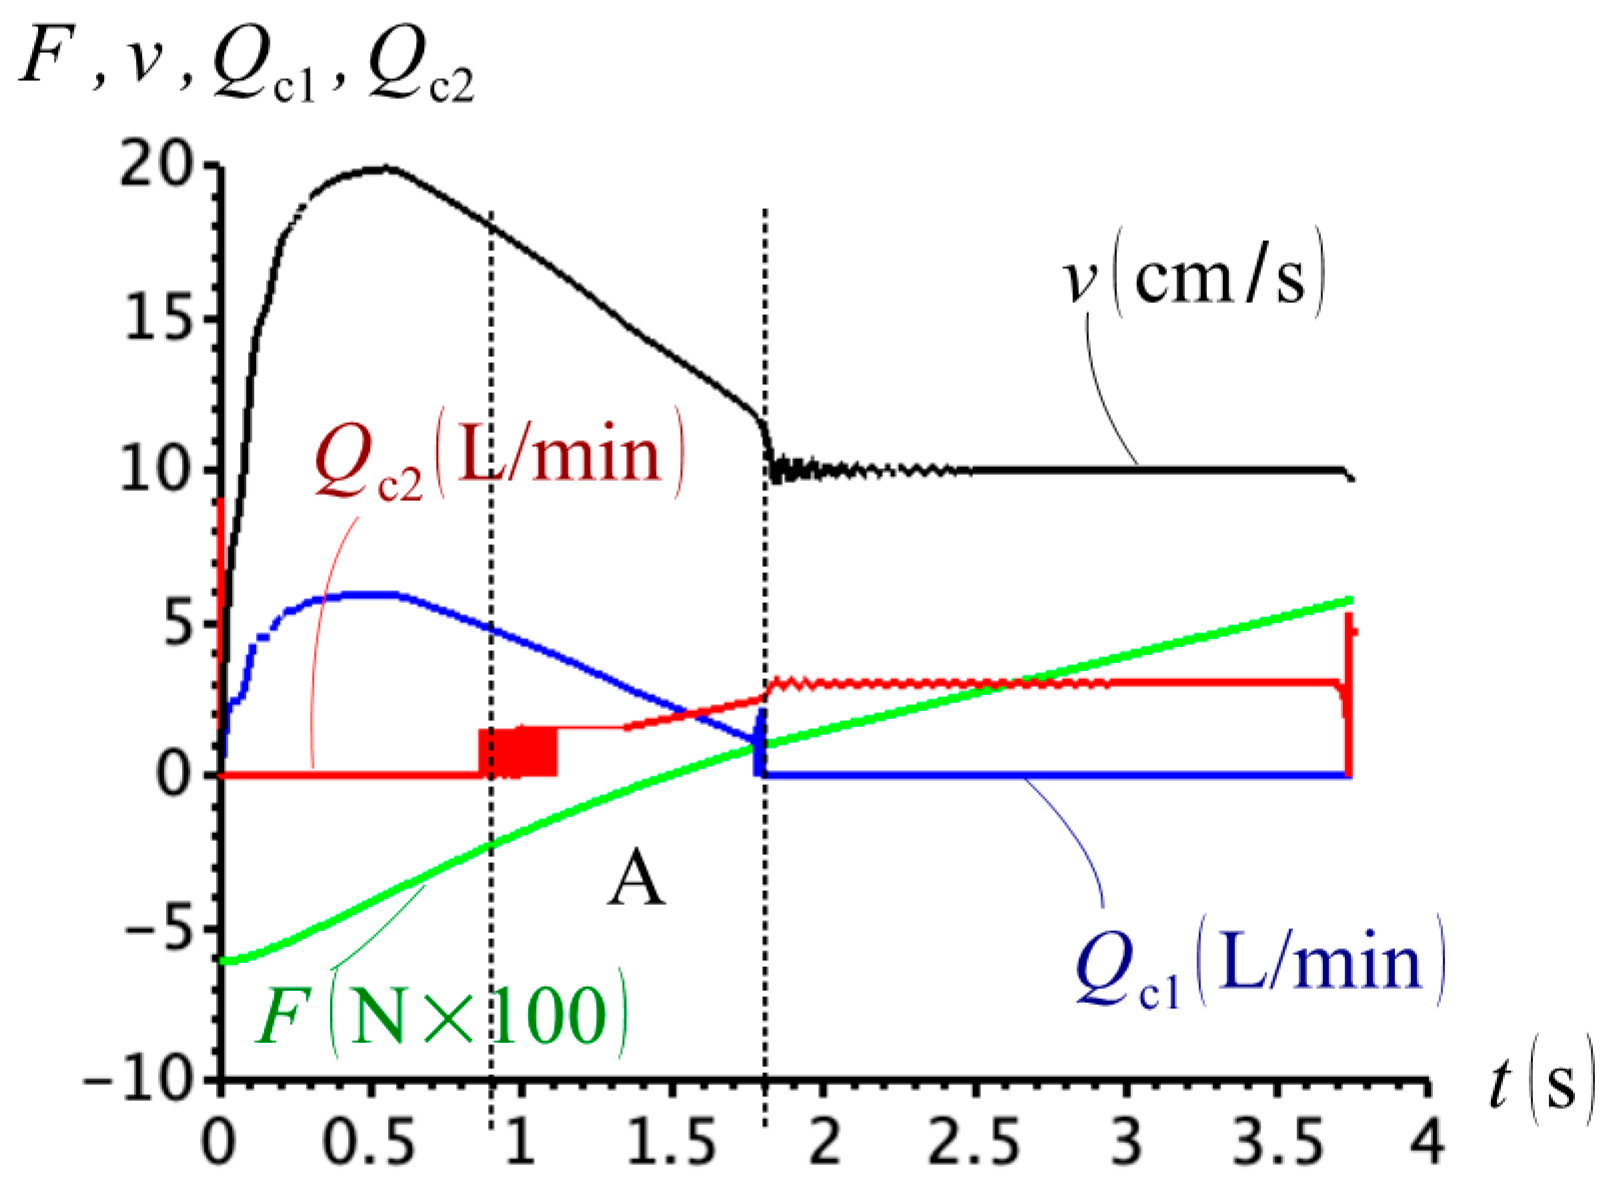
Figure 7 shows the evolution in time of the check valve flows, and , the cylinder velocity, and the external force, , for . Note the region A, where both valves are open. In this particular example, there is no control of the cylinder for approximately one second.
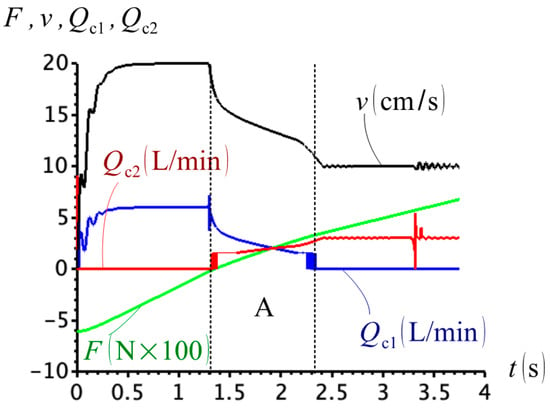
Figure 7.
External force, F, cylinder velocity, v, and check valve flows, Qc1 and Qc2, for .
Two important factors contribute to the failure of the circuit shown in Figure 1a. Firstly, the flow compensation valves, C1 and C2, are independently activated by either the cap- or rod-side pressures or by the charge pressure. These pressure signals can be combined in such a way that both valves may open or close at the same time or remain incorrectly open. Secondly, and most importantly, cap- and rod-side pressures do not seem to precisely indicate the correct moment when the compensation flow should be diverted to either sides of the circuit. Instead, it is clear that a minimum pressure level must be reached before the valves operate as expected. Based on these observations, some modifications have been proposed to improve the above circuit performance. We will analyse these modifications next.
3. Modified Versions of the Circuit with Pilot-Operated Check Valves
Recently, a series of circuits have been designed in an attempt to improve the piloted check valve circuit operation [10]. The idea was to reduce the time lapsed in the “critical region” [10] where both valves C1 and C2 are simultaneously open. We have already discussed this point in the previous section, where we extended this definition to include the incorrect opening or closing of the valves (see Table 2). To keep with the original definition given in [10], we focus on the interval where valves C1 and C2 are simultaneously open. Assuming that both valves open in piloted mode, we obtain the cap and rod-side pressures from Equation (6), as follows:
where .
Substituting , given by the first equation in (14) into the first inequality in (12), we can show that the maximum force, , that keeps valve C1 open in piloted mode, is
Likewise, the minimum force, , that is needed to open valve C2 can be obtained by substituting , given by the second equation in (14) into the first inequality in (13):
The critical region, , where both valves are open at the same time is given by
Equation (17) can be further simplified if we note that when both C1 and C2 are open, we have that ;
Figure 8 is the graphical representation of the critical region established by the limiting forces and . From Equation (16), we see that the lower limit, , can be increased by choosing a higher charge pressure for valve C2. This becomes evident when we note that the term multiplying in Equation (16), , is greater than zero. Likewise, since in Equation (15), the upper limit, , can also be reduced by increasing the charge pressure. We conclude, therefore, that the “critical region” would become narrower for higher values of . Alternatively, we could change the charge pressures for valves C1 and C2 separately.

Figure 8.
Graphical representation of critical force range, .
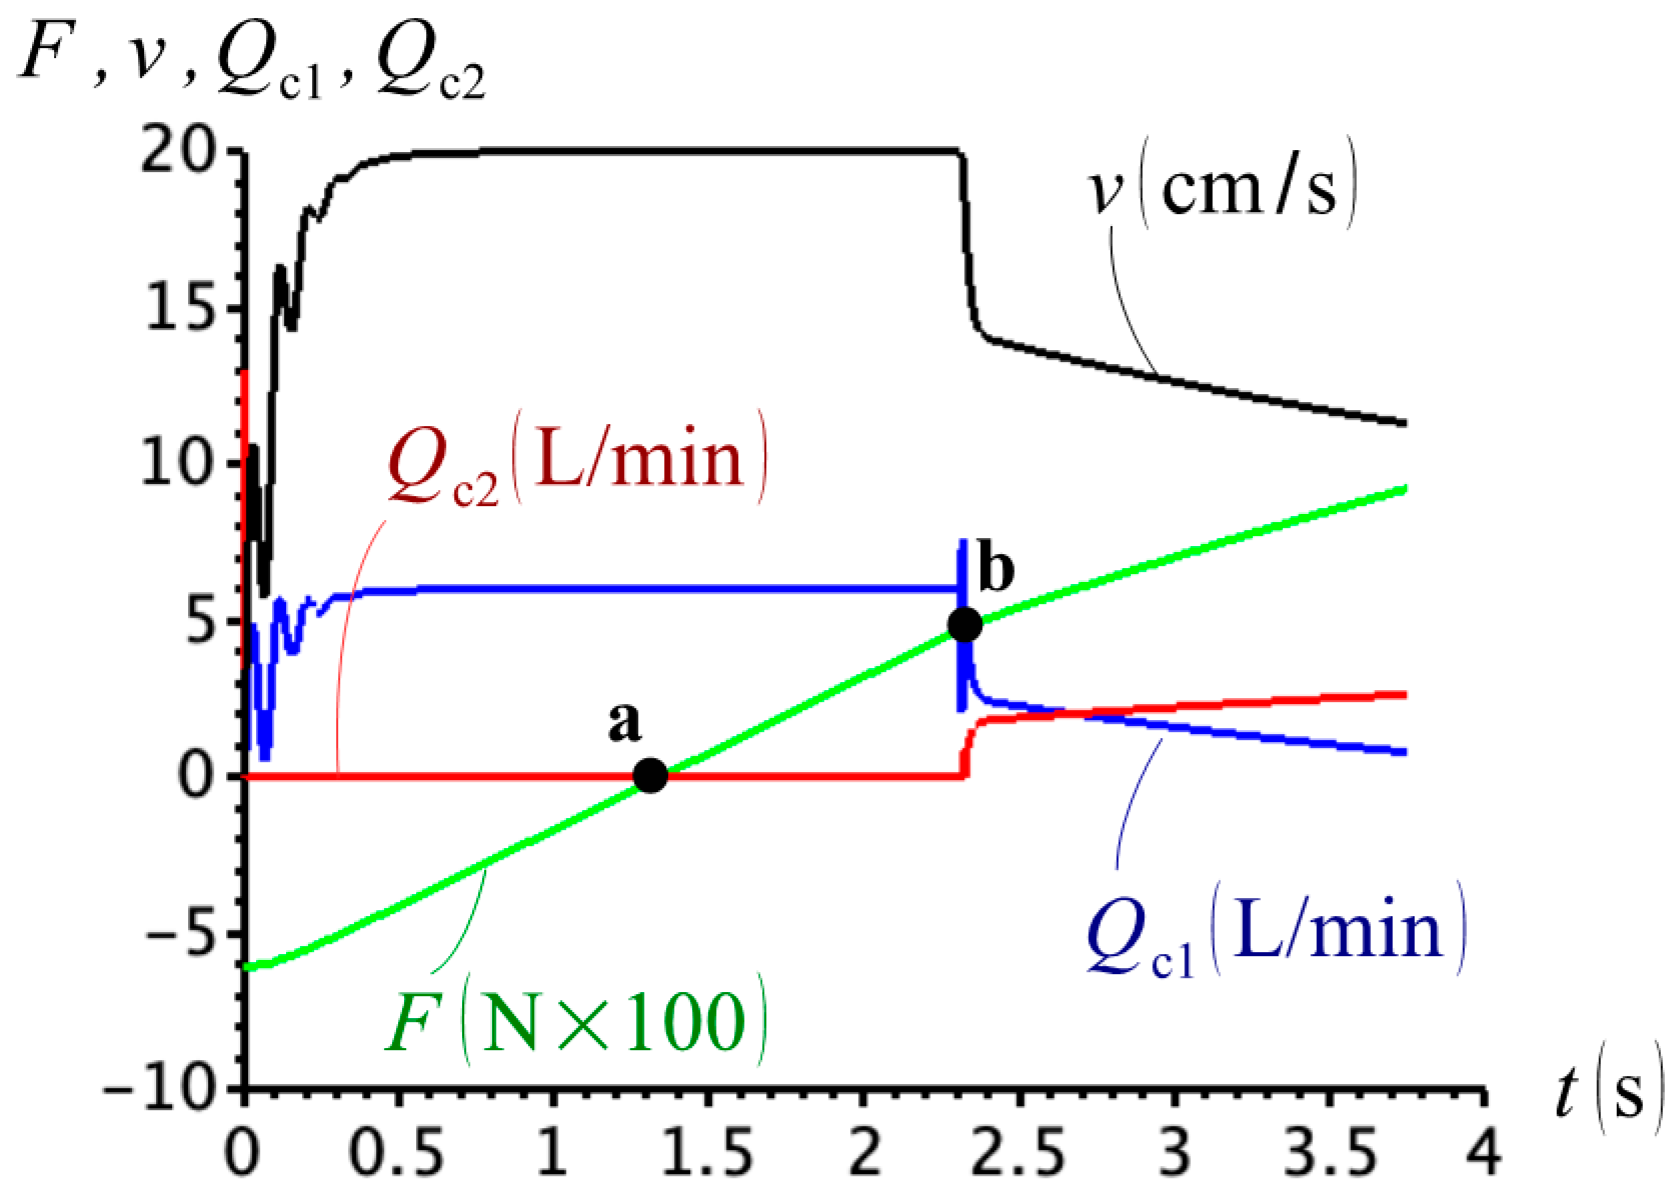
Let us compare the simulation results in Figure 7, where we used a charge pressure , with the results obtained in Figure 9, with a charge pressure . From the previous discussion, we could expect some improvement and, looking at Figure 9, we might as well conclude that this is the case. Note, however, that the transition from quadrant II to quadrant I is not marked by a change in the compensation flows any longer. Instead, valve C1 remains open from point a, which is the point where quadrants shift, according to the division in Figure 3a, and remains open past point b, where valve C2 is also activated. As a result, at least we conclude that C1 and C2 are not following the expected behaviour after point b is reached. In addition, if the diagram in Figure 3a represents the correct quadrant division, the compensation valves are incorrectly open after point a is reached (see Table 2). This has cast some doubts about the correct quadrant representation of Figure 3a and attempts have been made to draw diagrams on the force-velocity plane that are able to catch the quadrant shifting points (see, for example, references [7,10]).
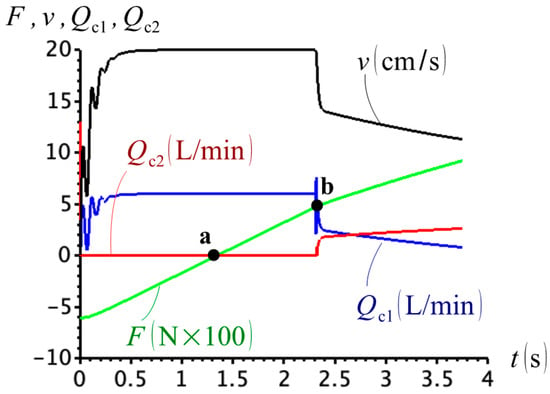
Figure 9.
External force, cylinder velocity and check valve flows for and .
3.1. Circuit Using Pilot-Operated Check Valves with Different Charge Pressures
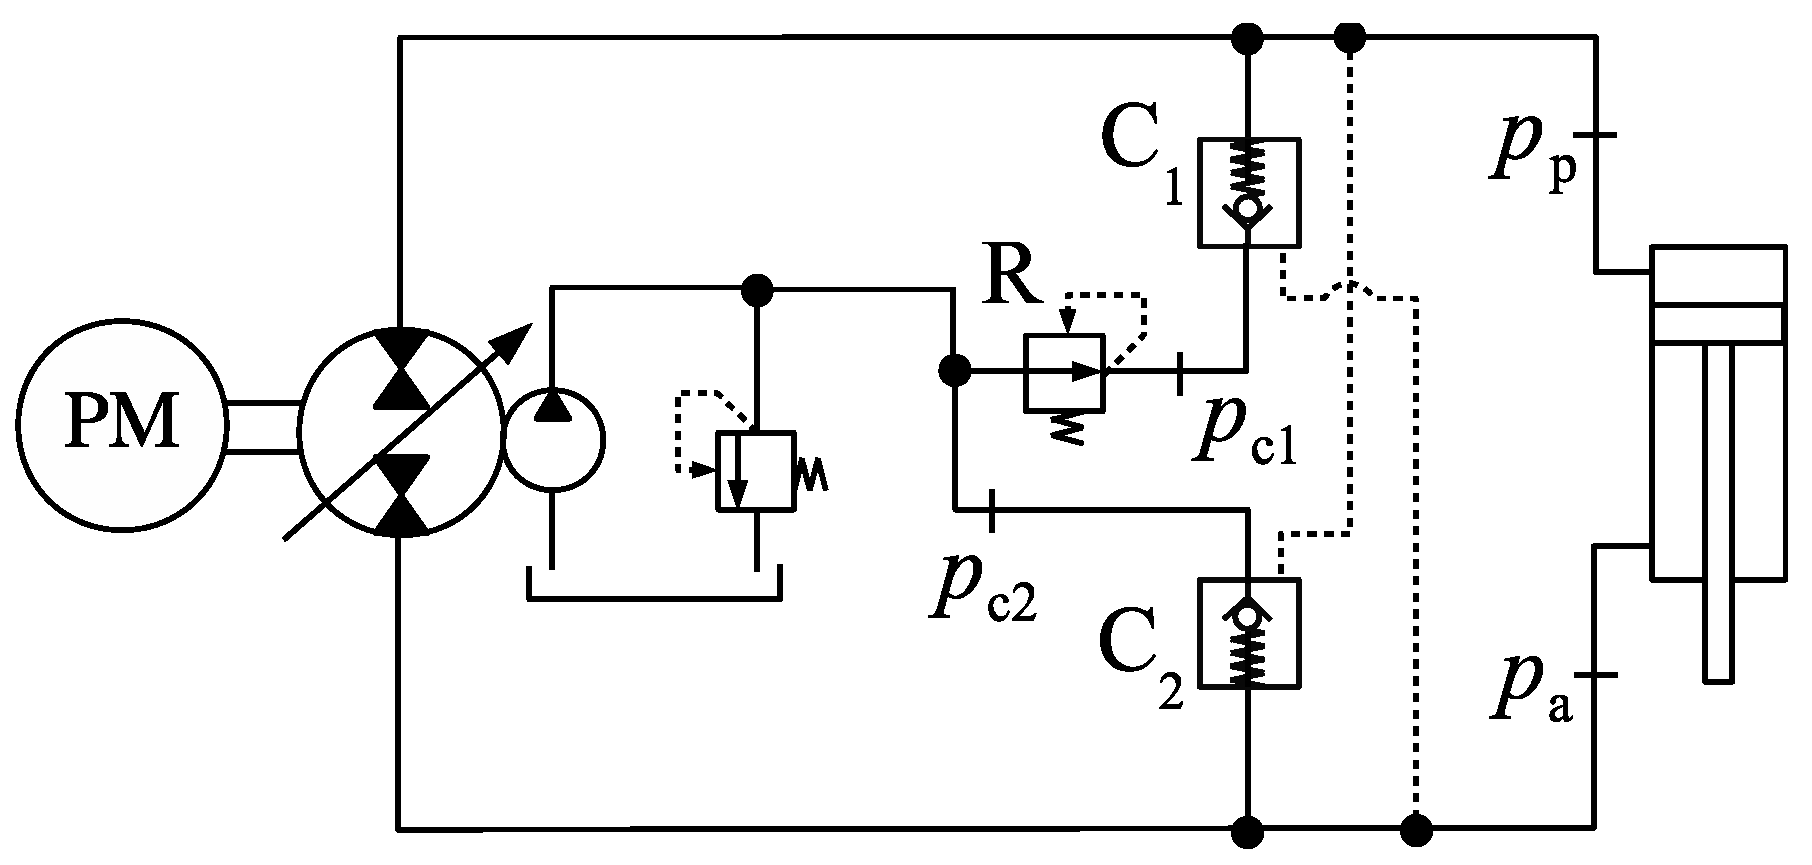
As mentioned in the previous section, one attempt to improve the circuit in Figure 1a includes modifying the charge pressures at the ports of valves C1 and C2 independently. Figure 10 shows one way of creating a circuit with two different charge pressures, and , with [10]. The idea is to reduce the critical region in Figure 8, by increasing the lower limit, (shifting it to the right). Practically, a pressure reducing valve, R, has been added between the charge circuit and valve C1.
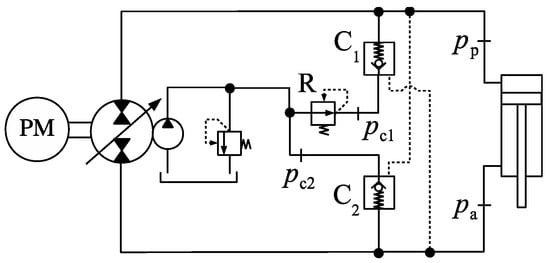
Figure 10.
Circuit using different charge pressures ().
We first simulated the low-load case (), with and . The results are shown in Figure 11, where we see that both valves, C1 and C2, are simultaneously open throughout the cylinder motion. Similar to what we saw in Figure 6, the cylinder extends uncontrolled in both quadrants.
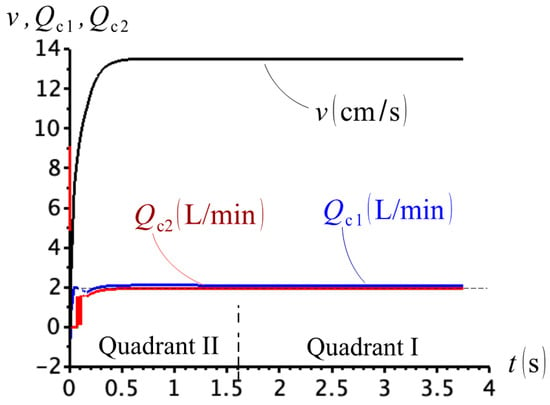
Figure 11.
Cylinder velocity and check valve flows for , and .
In the second case study, we used . The results shown in Figure 12. The results are not much different from those presented in Figure 7. We observe a displacement to the left and a very slight reduction of the instability region, A. However, the benefits of adding a second valve to the circuit are almost imperceptible.
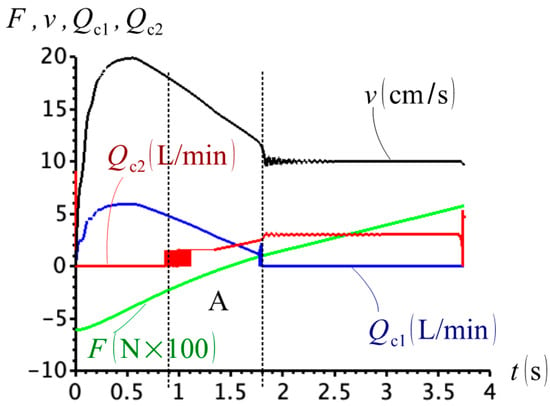
Figure 12.
External force, cylinder velocity and check valve flows for , and .
3.2. Circuit Using Inline Flow Throttling
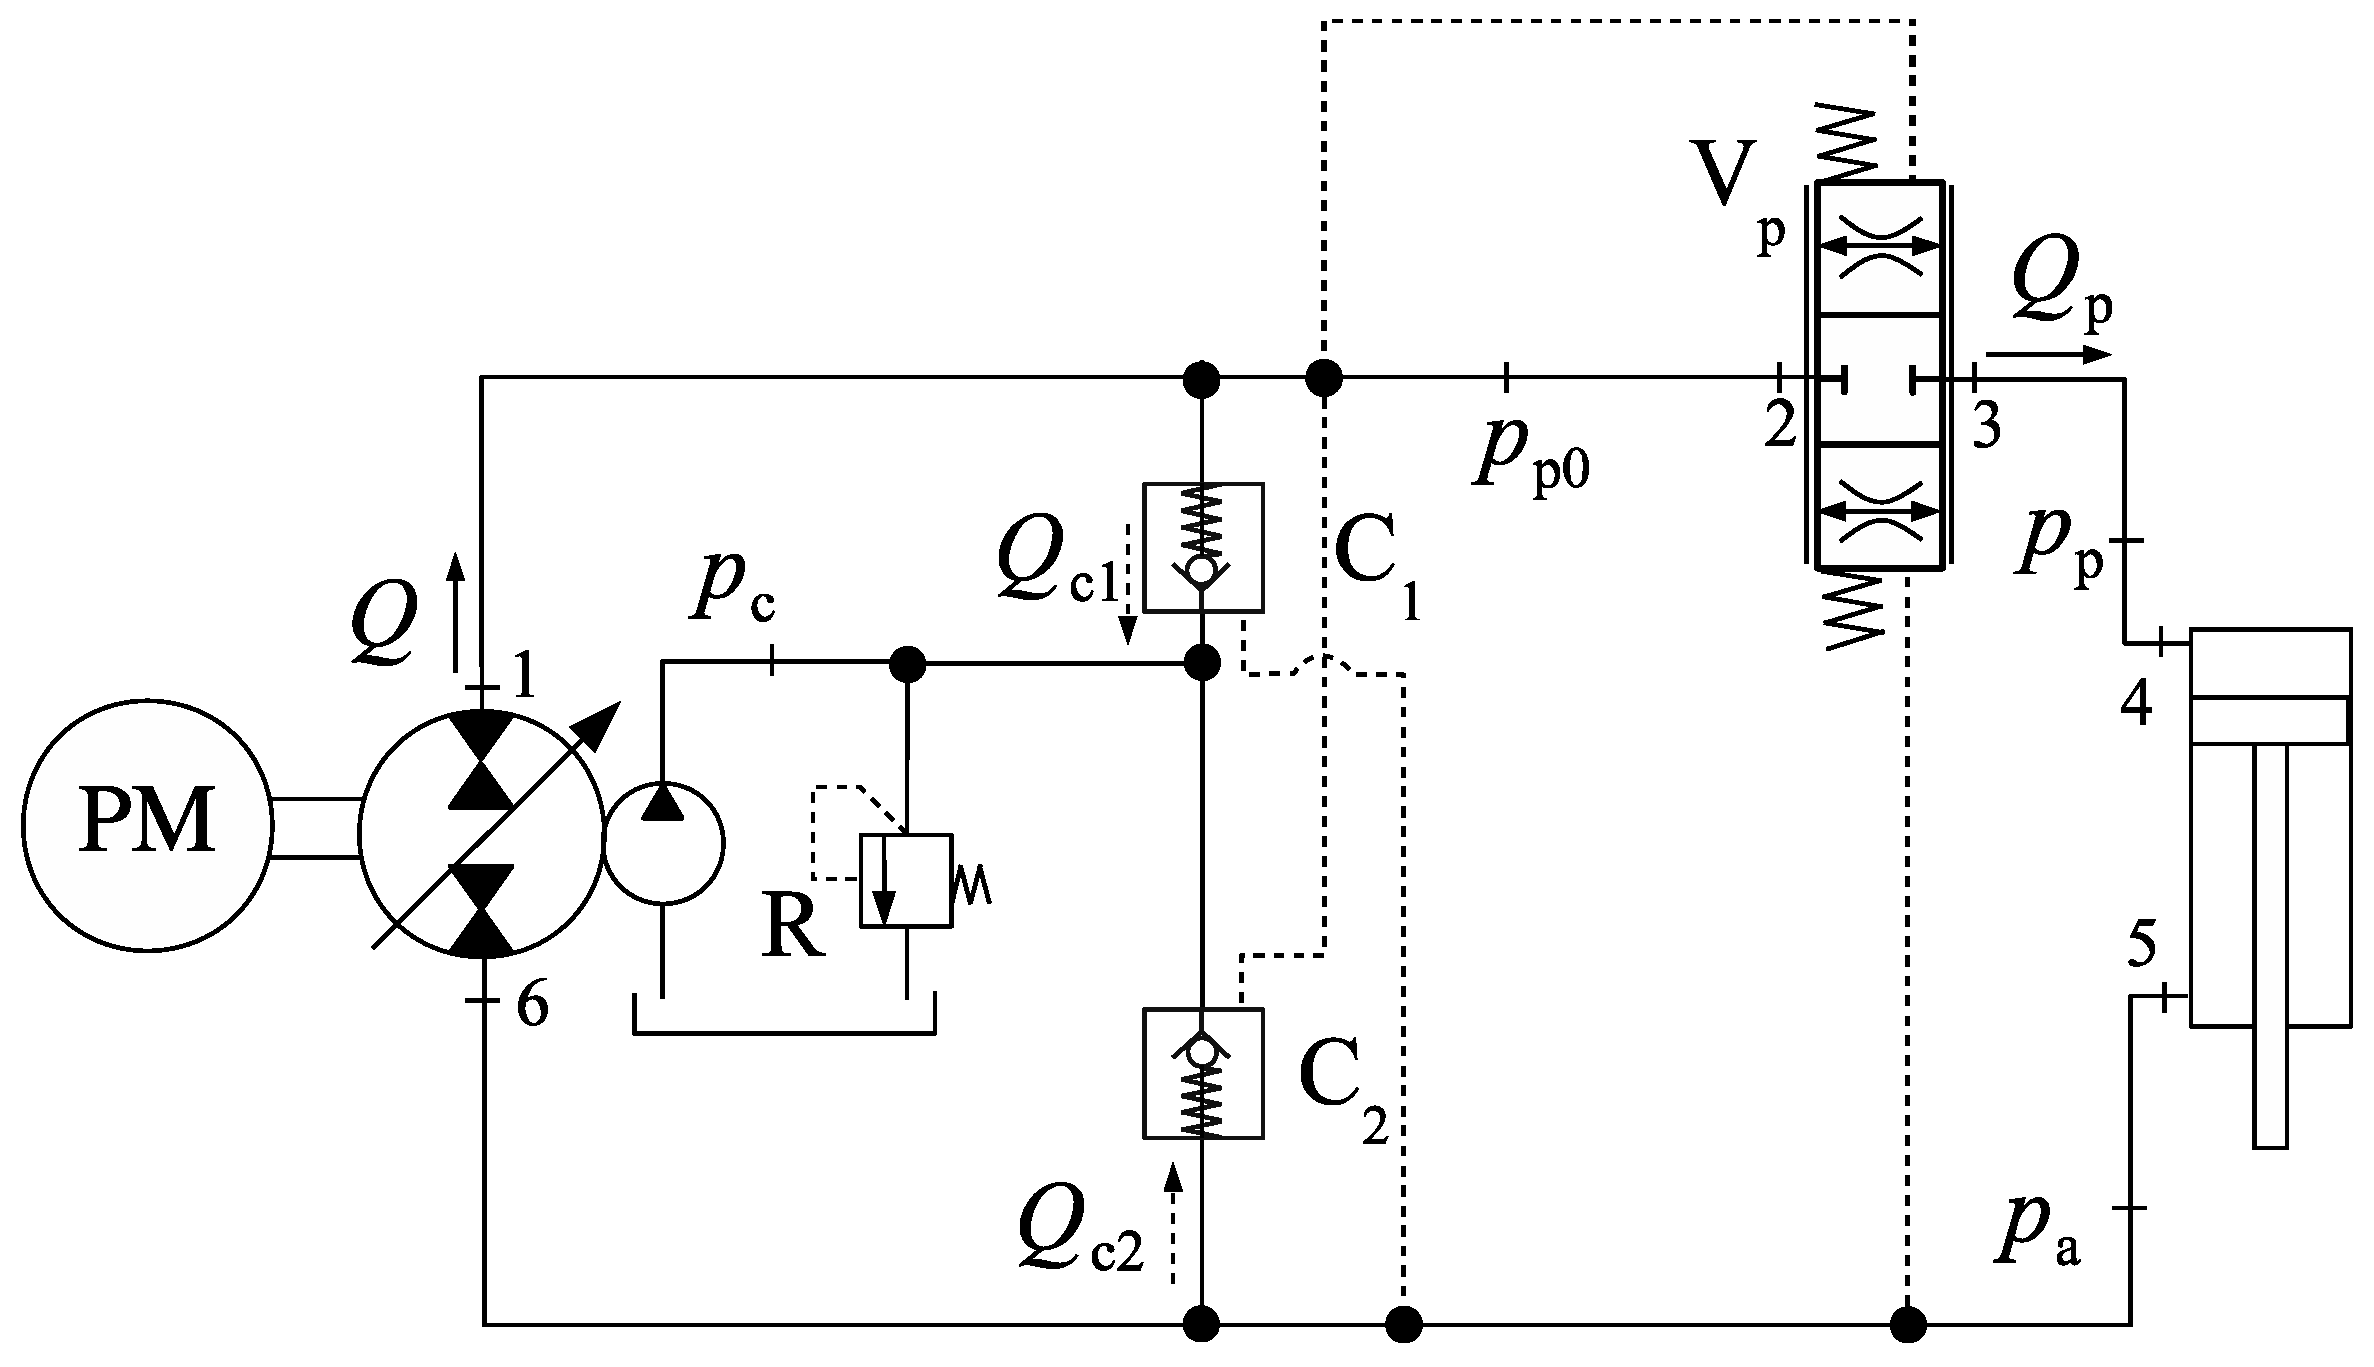
Another attempt to improve the circuit in Figure 1a is shown in Figure 13 [10]. The unconventional 2-port, 3-stage ( directional valve Vp is retrofitted into a proportional valve where the flow resistance changes with the pressure differential, . When , valve Vp gradually opens the passage between the pump and the cylinder cap-side. When , valve Vp centres, cutting the communication between pump and cylinder. Note that, due to throttling, during the entire cylinder extension. Likewise, during cylinder retraction. As a result, throttling losses are introduced throughout the cylinder motion, just like in a conventional valve-controlled actuator.
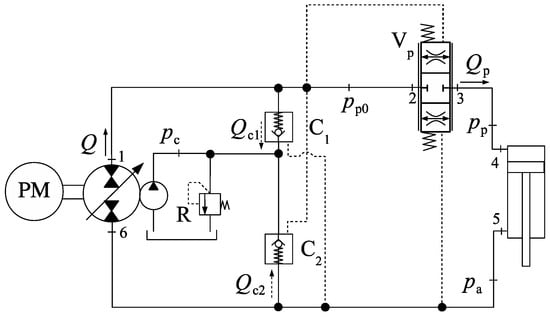
Figure 13.
Circuit with an inline throttling valve.
The relation between and is given by
where is the flow through valve Vp and is the flow resistance.
Consider the case where is constant in Equation (19). As an example, let us assume that the pressure drop at fully open position, , at valve V, is for . We thus can obtain as follows
As the pump flow gradually increases, pressure builds up according to Equation (19), keeping valve C1 closed and valve C2 open in piloted mode. The in-line resistance created by valve Vp assures the correct behaviour of check valves during the first-quadrant of operation. Second quadrant operation, however, is poor, as will be shown next.
To simulate the circuit in Figure 13, we used Equations (2) and (3), with and . Since Va is not present (see Figure 2), the equation for was disregarded in Equation (3). With these considerations, the modelling equations become
with obtained from Equations (8) and (10) and , obtained from Equation (19).
Figure 14a shows the simulation results for , where we see that the cylinder extends at half of the expected velocity during the second quadrant, which already indicates a circuit malfunction. The velocity is regularised during the first quadrant and a constant pressure differential, , is created to compensate for the pressure losses at valve Vp (Figure 14b). Note that we are simulating the best-case scenario, where the resistance at valve Vp remains constant and at a low value.
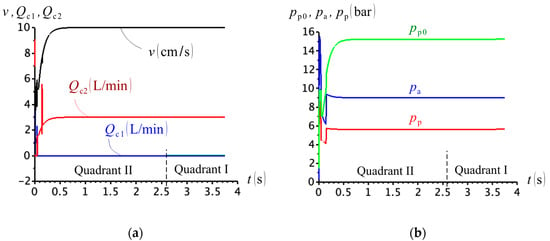
Figure 14.
(a) Cylinder velocity and check valve flows; (b) circuit pressures .
As far as energy efficiency is concerned, the circuit in Figure 13 can be, at best, compared to a conventional actuator using a directional valve and a variable flow pump to control the cylinder. It is also observed that valve Vp needs to be sized accordingly to the flow, and may become bulky and heavy. In such a case, the dynamics of the valve (not simulated in this paper) plays a role on the valve performance. The quadrant division in Figure 14 has been made by observing the sign of the external force (not shown in the figure), according to Figure 3a.
Figure 15 shows the simulation for the case where a mass . At the beginning, when the cylinder is pulled by the external force, , valve C2 is closed by the rod-side pressure, (Figure 15b). However, shortly after the cylinder starts moving, pressure , which is higher than the cap-side pressure, , opens valve C2, which remains open throughout the cylinder motion. In the end, the presence of valve Vp does not establish the right opening sequence of the compensation valves; it, however, ends up creating a low-pressure zone at the cap-side when the cylinder starts moving, as seen in Figure 15b.
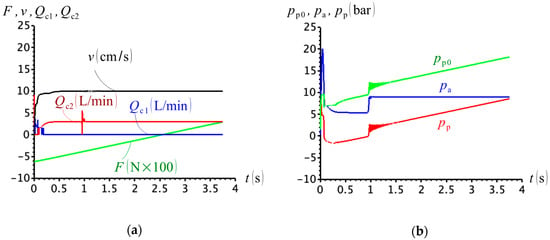
Figure 15.
(a) External force, cylinder velocity and check valve flows; (b) circuit pressures ().
Figure 16 shows an alternative to the circuit in Figure 13 [10]. In this design, two counterbalance valves, Vp and Va, are placed at the cap- and rod-sides of the cylinder, so that a minimum pressure is created at the pump ports before the cylinder starts moving in either direction. The circuit layout is similar to the one shown in Figure 13, and, again, introduces inline flow resistances in the main circuit. Because of the similarities between this design and the previous design, we do not show the simulation results in this case.
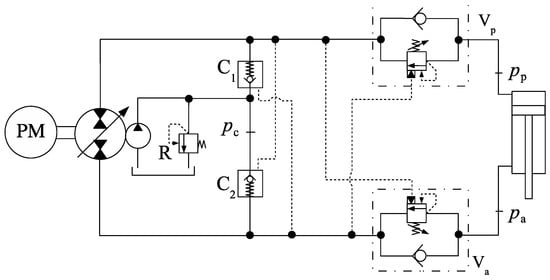
Figure 16.
Circuit augmented with two counterbalance valves.
So far, all the attempts to solve the differential cylinder area problem using piloted check valves have failed at low loads. Some circuits can operate better at higher loads, but problems always show up during the transition between quadrants II and I. Let us now study the circuits in Figure 1c,d.
4. Alternatives to Circuit with Pilot-Operated Check Valves
In this section, we introduce circuits where flow is compensated through directional valves. Typical configurations use 2 × 2 and 3 × 3 valves, as in Figure 1c,d, respectively. We begin with the circuit in Figure 1c, where a couple of two-position/two-way valves is employed.
4.1. Circuit Using Two-Position, Two-Way Directional Valves
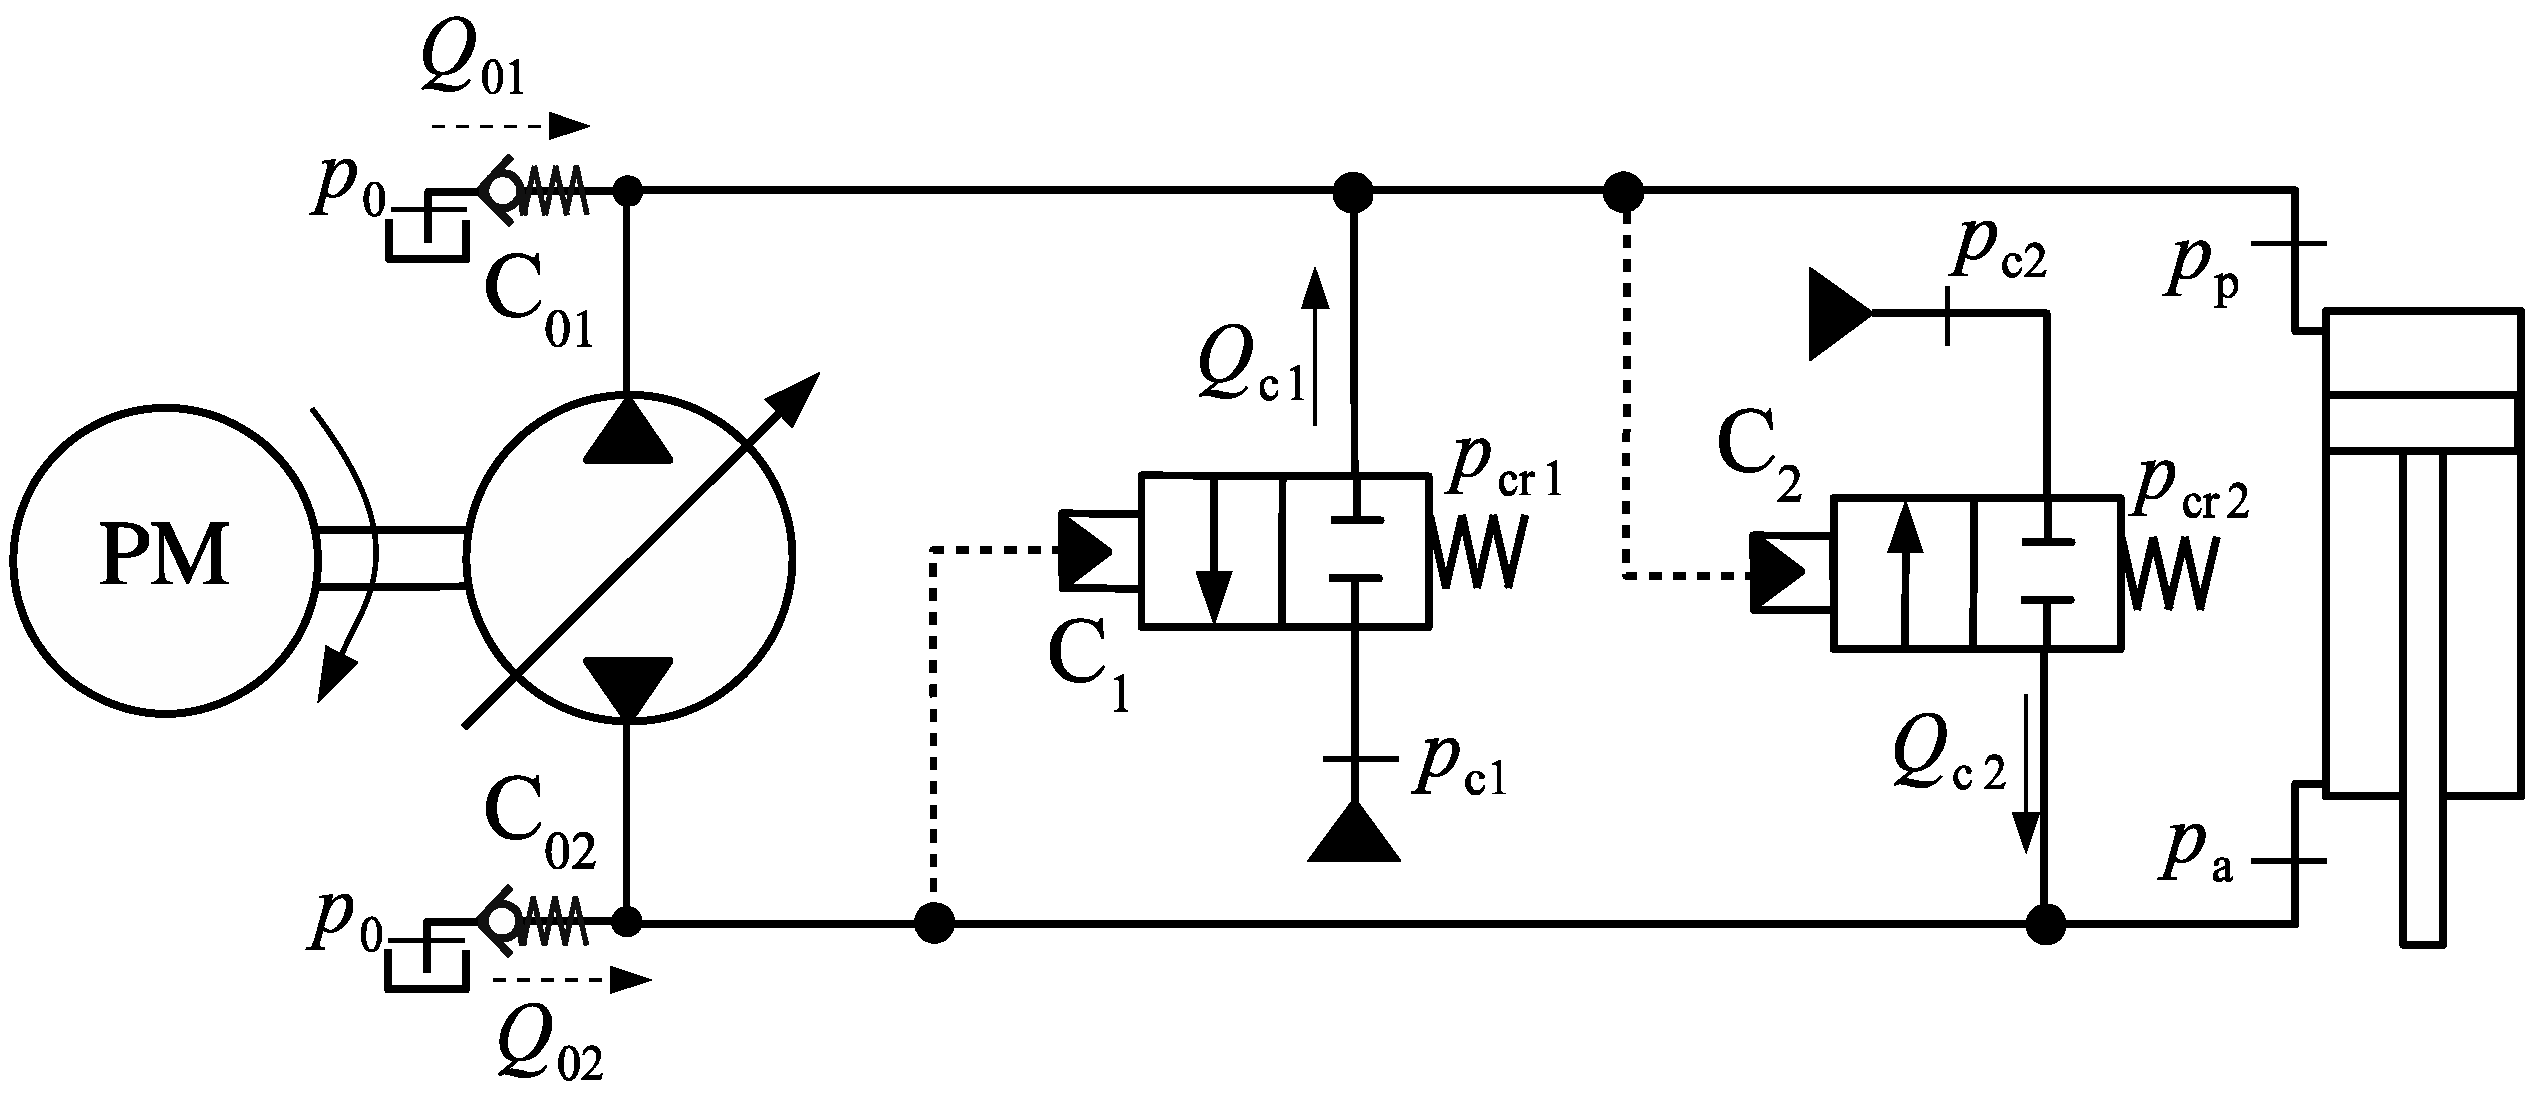
Consider the design shown in Figure 17, based on Figure 1c, where the compensation valves, C1 and C2 are adjusted to open at different cracking pressures, and , respectively. The tank is also replaced with two constant pressure flow sources operating at pressures and . The following conditions apply
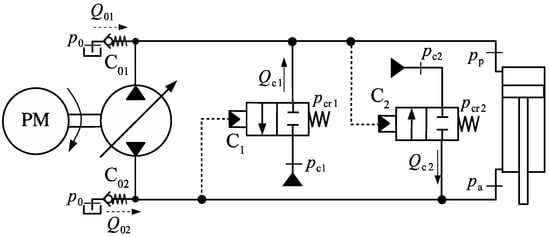
Figure 17.
Circuit with two directional valves.
When and do not fulfil conditions (22), valves C1 and C2 do not open. In this case, major problems are not expected to occur during the first and second quadrants of operation, because of the anti-cavitation valves C01 and C02. However, third quadrant operation is impossible, since, in that case, valves C01 and C1 are simultaneously closed.
The compensation flows, and , can be obtained from the following variation of Equations (11)
To simulate the circuit in Figure 16, we used Equations (22) and (23) using identical compensation valves but with different charge and cracking pressures. A modified version of Equations (10) has also been used to include the anti-cavitation flows and , as follows:
The anti-cavitation flows, and , in Equations (24), can be modelled by the following equations:
where has been chosen as so that a very small pressure differential is created for the anti-cavitation valves.
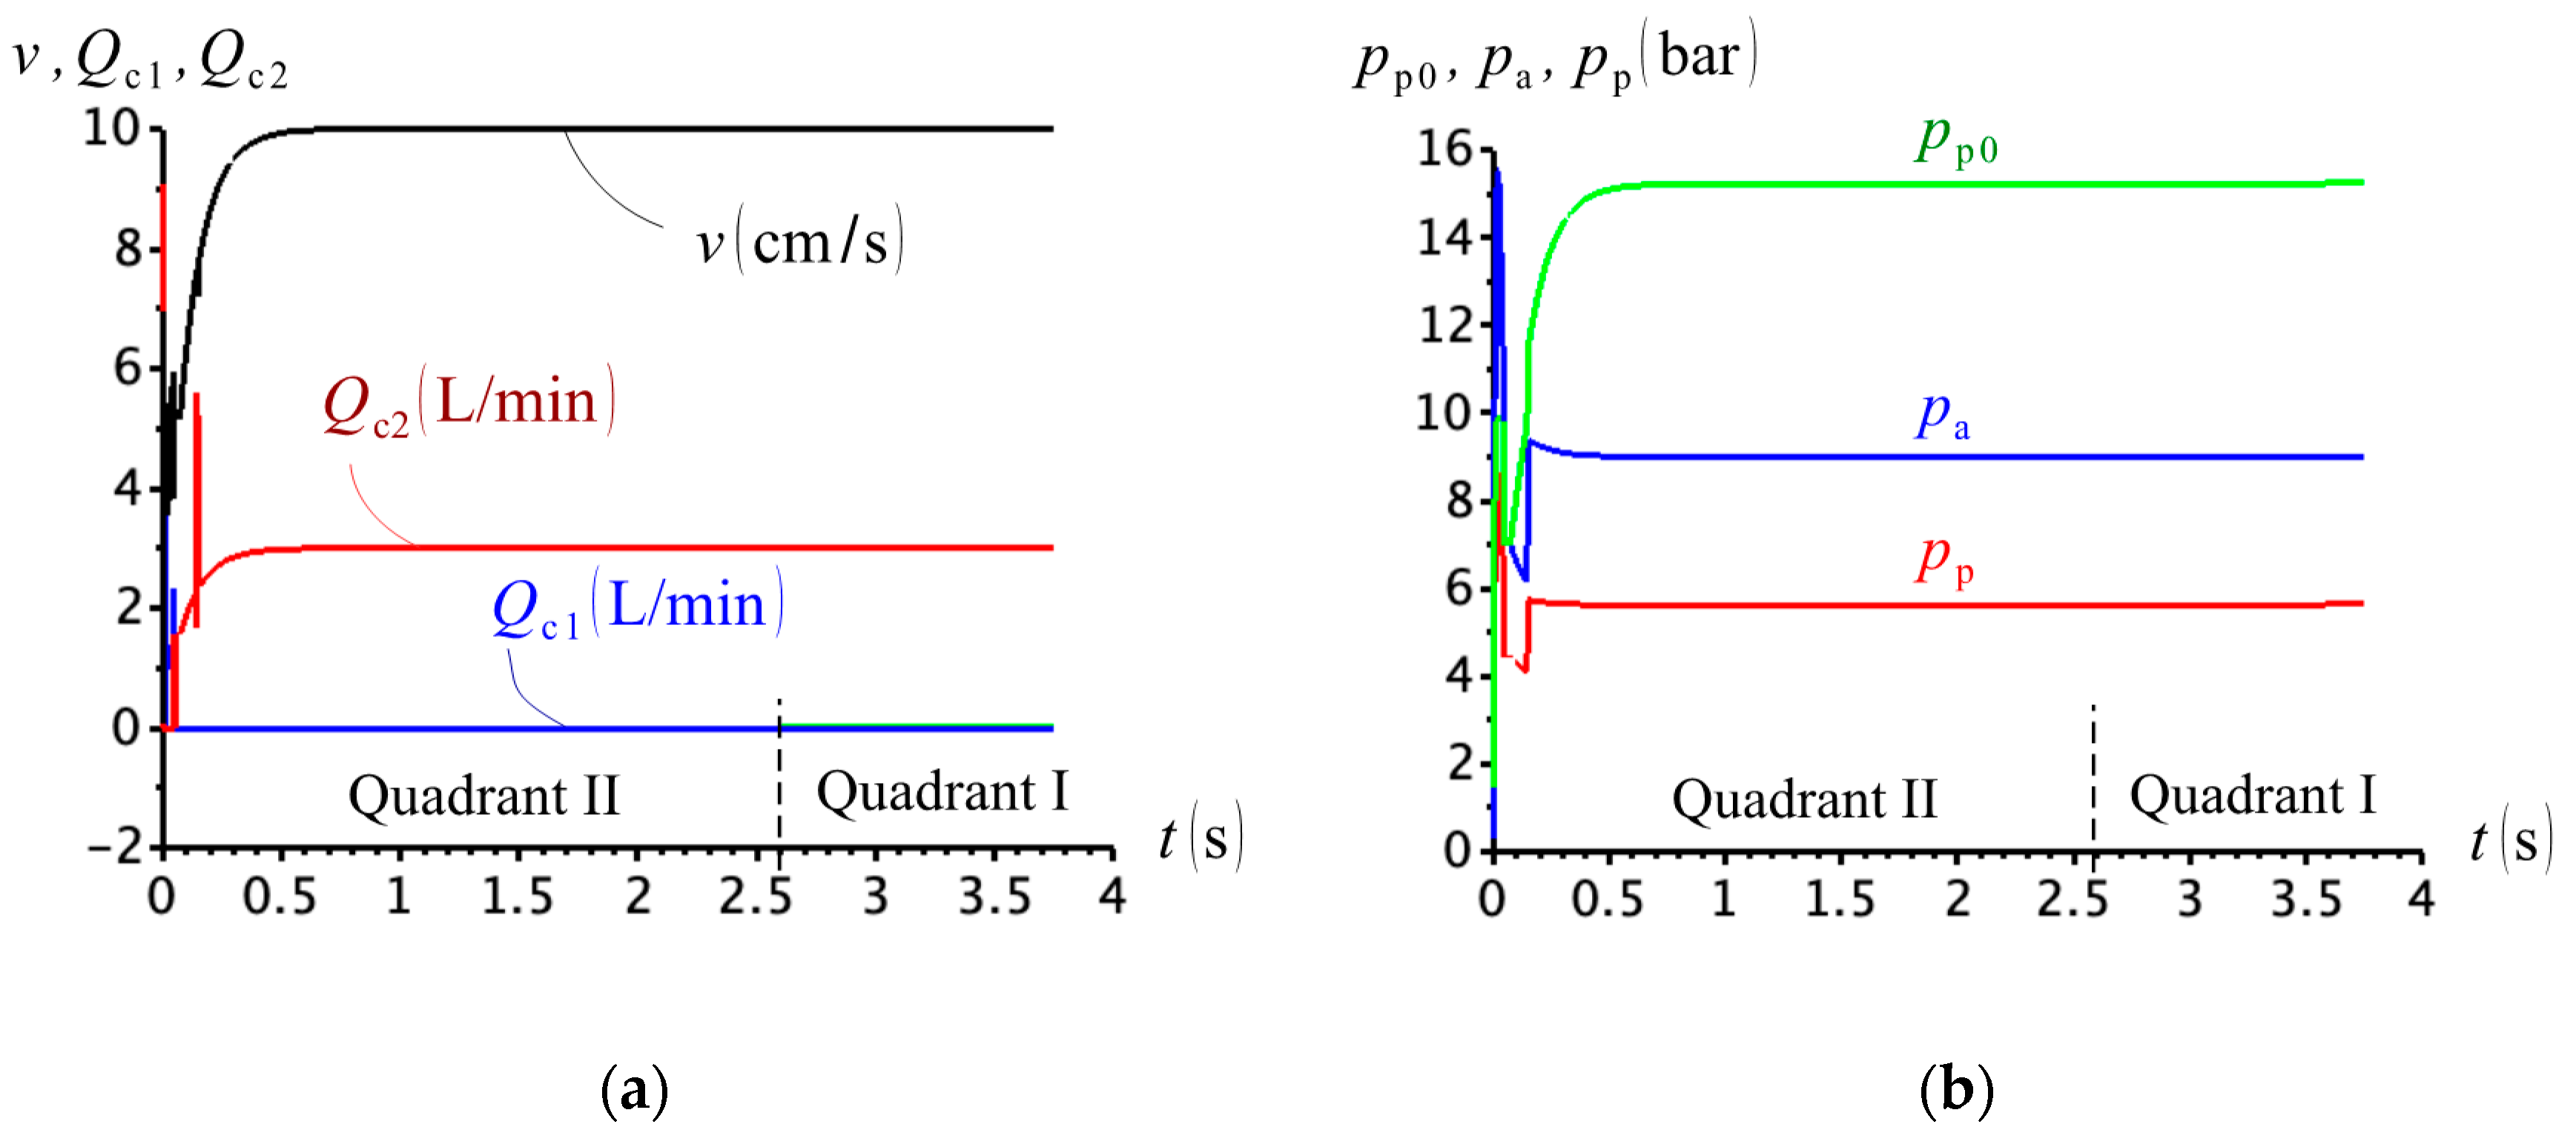
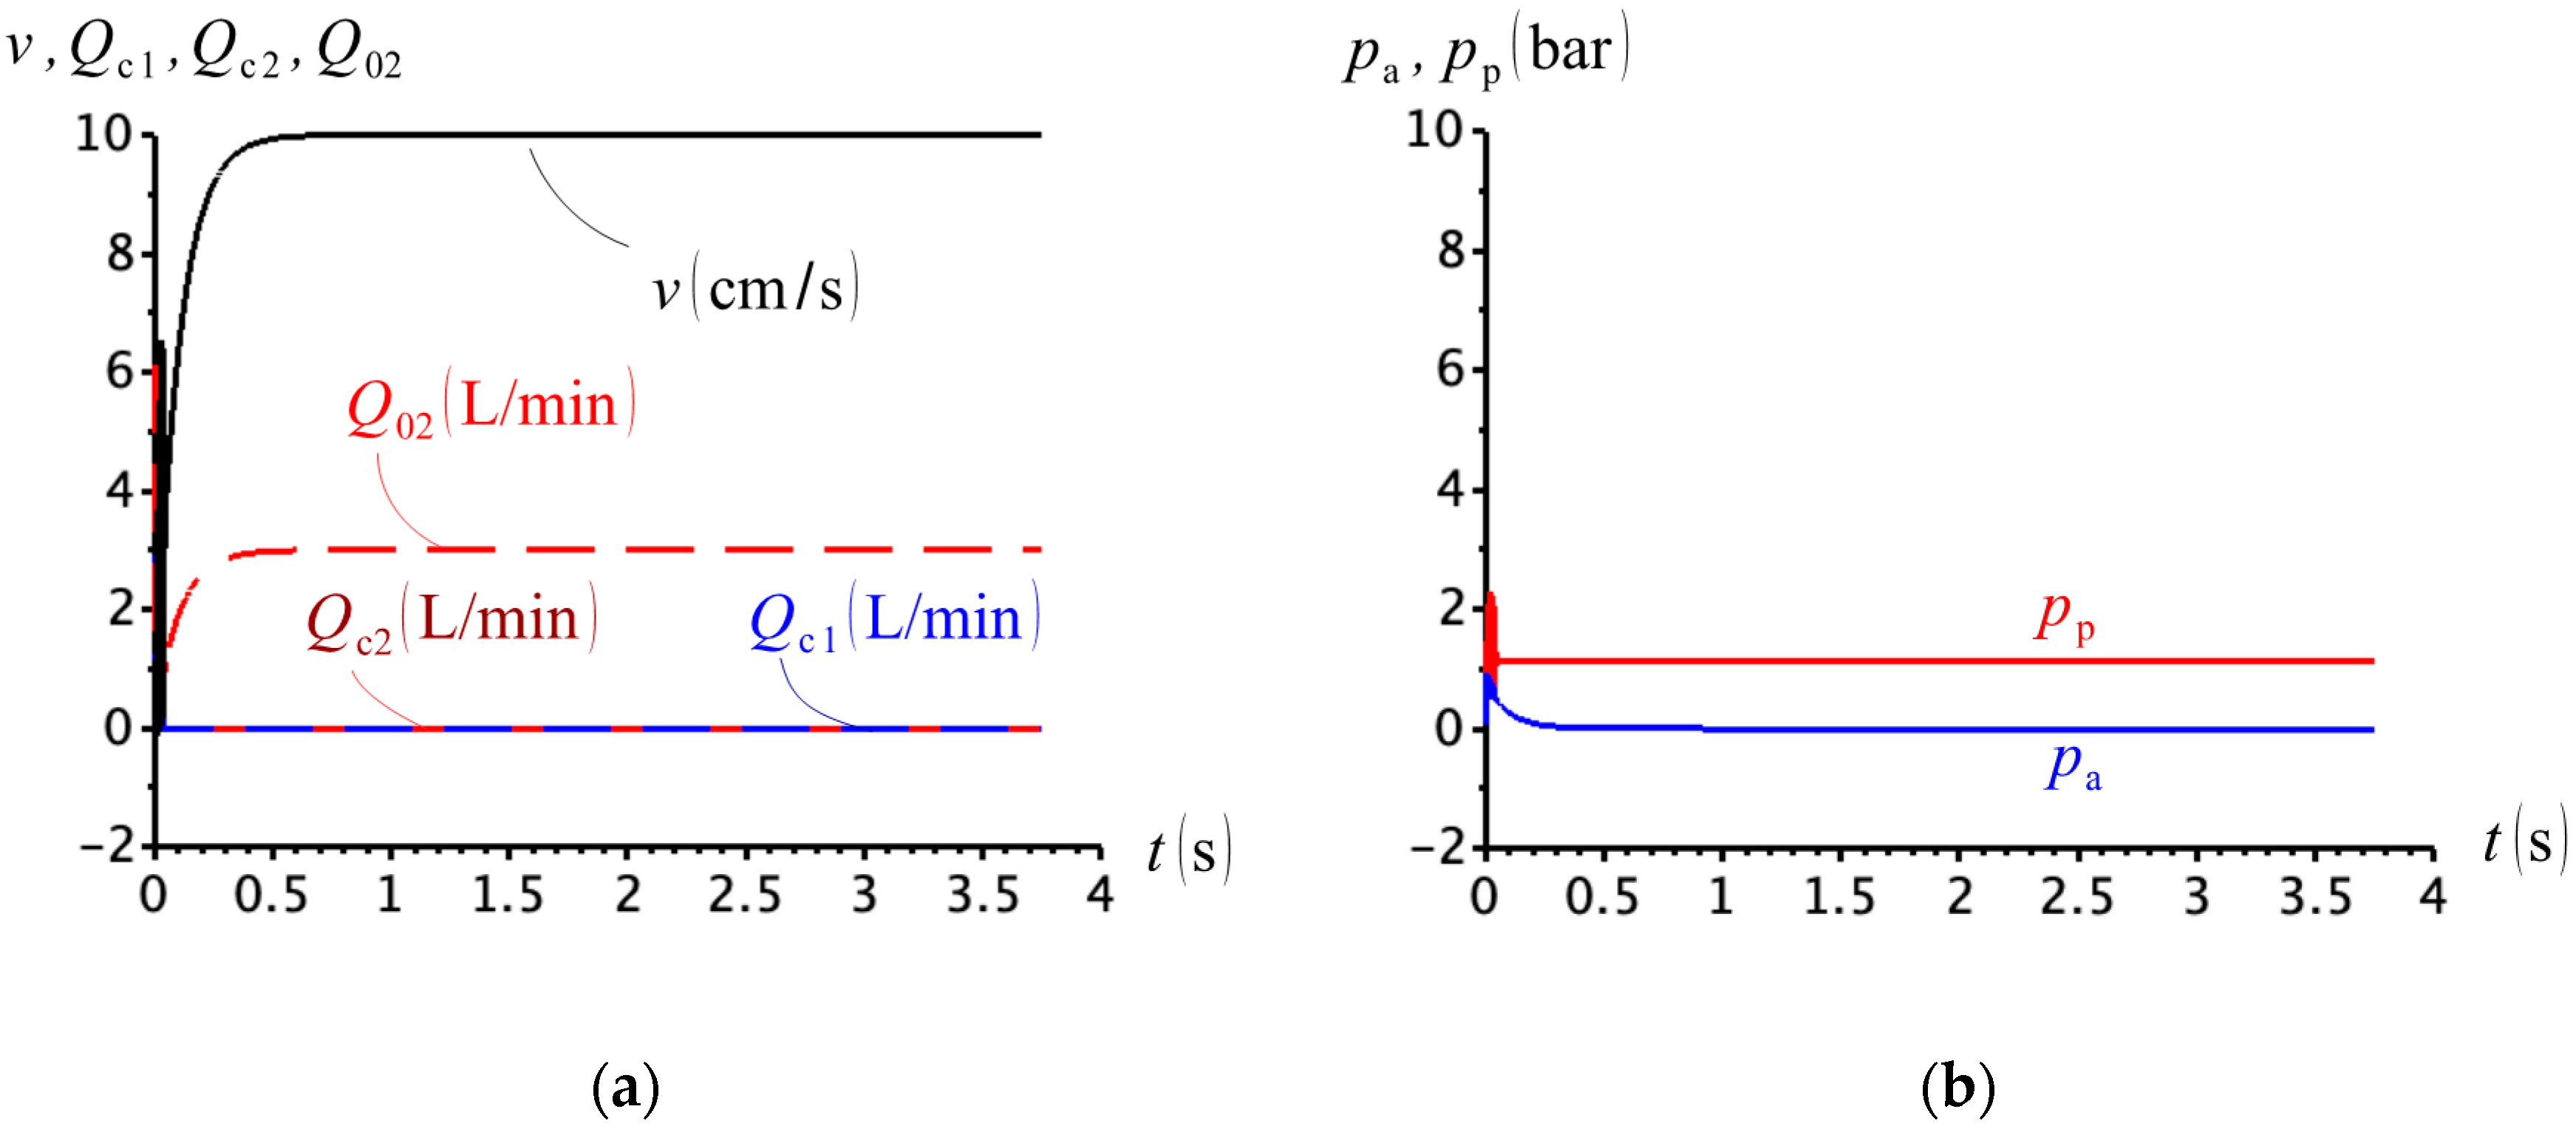
Simulation results for , , and are shown in Figure 18. Apparently, the solution proposed in Figure 16 produces a smooth velocity during cylinder extension (Figure 18a). However, observe that both valves, C1 and C2, remain closed and the only reason why the cylinder extends smoothly is the opening of anti-cavitation valve C02, because of the lower pressure , at the cylinder rod-side (Figure 18b).
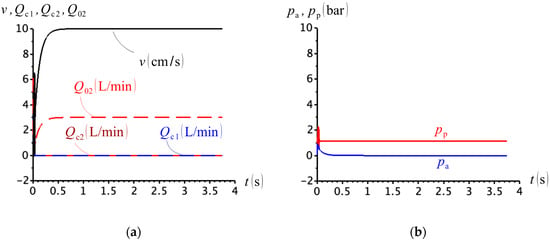
Figure 18.
(a) Cylinder velocity and compensation flows; (b) cap- and rod-side pressures .
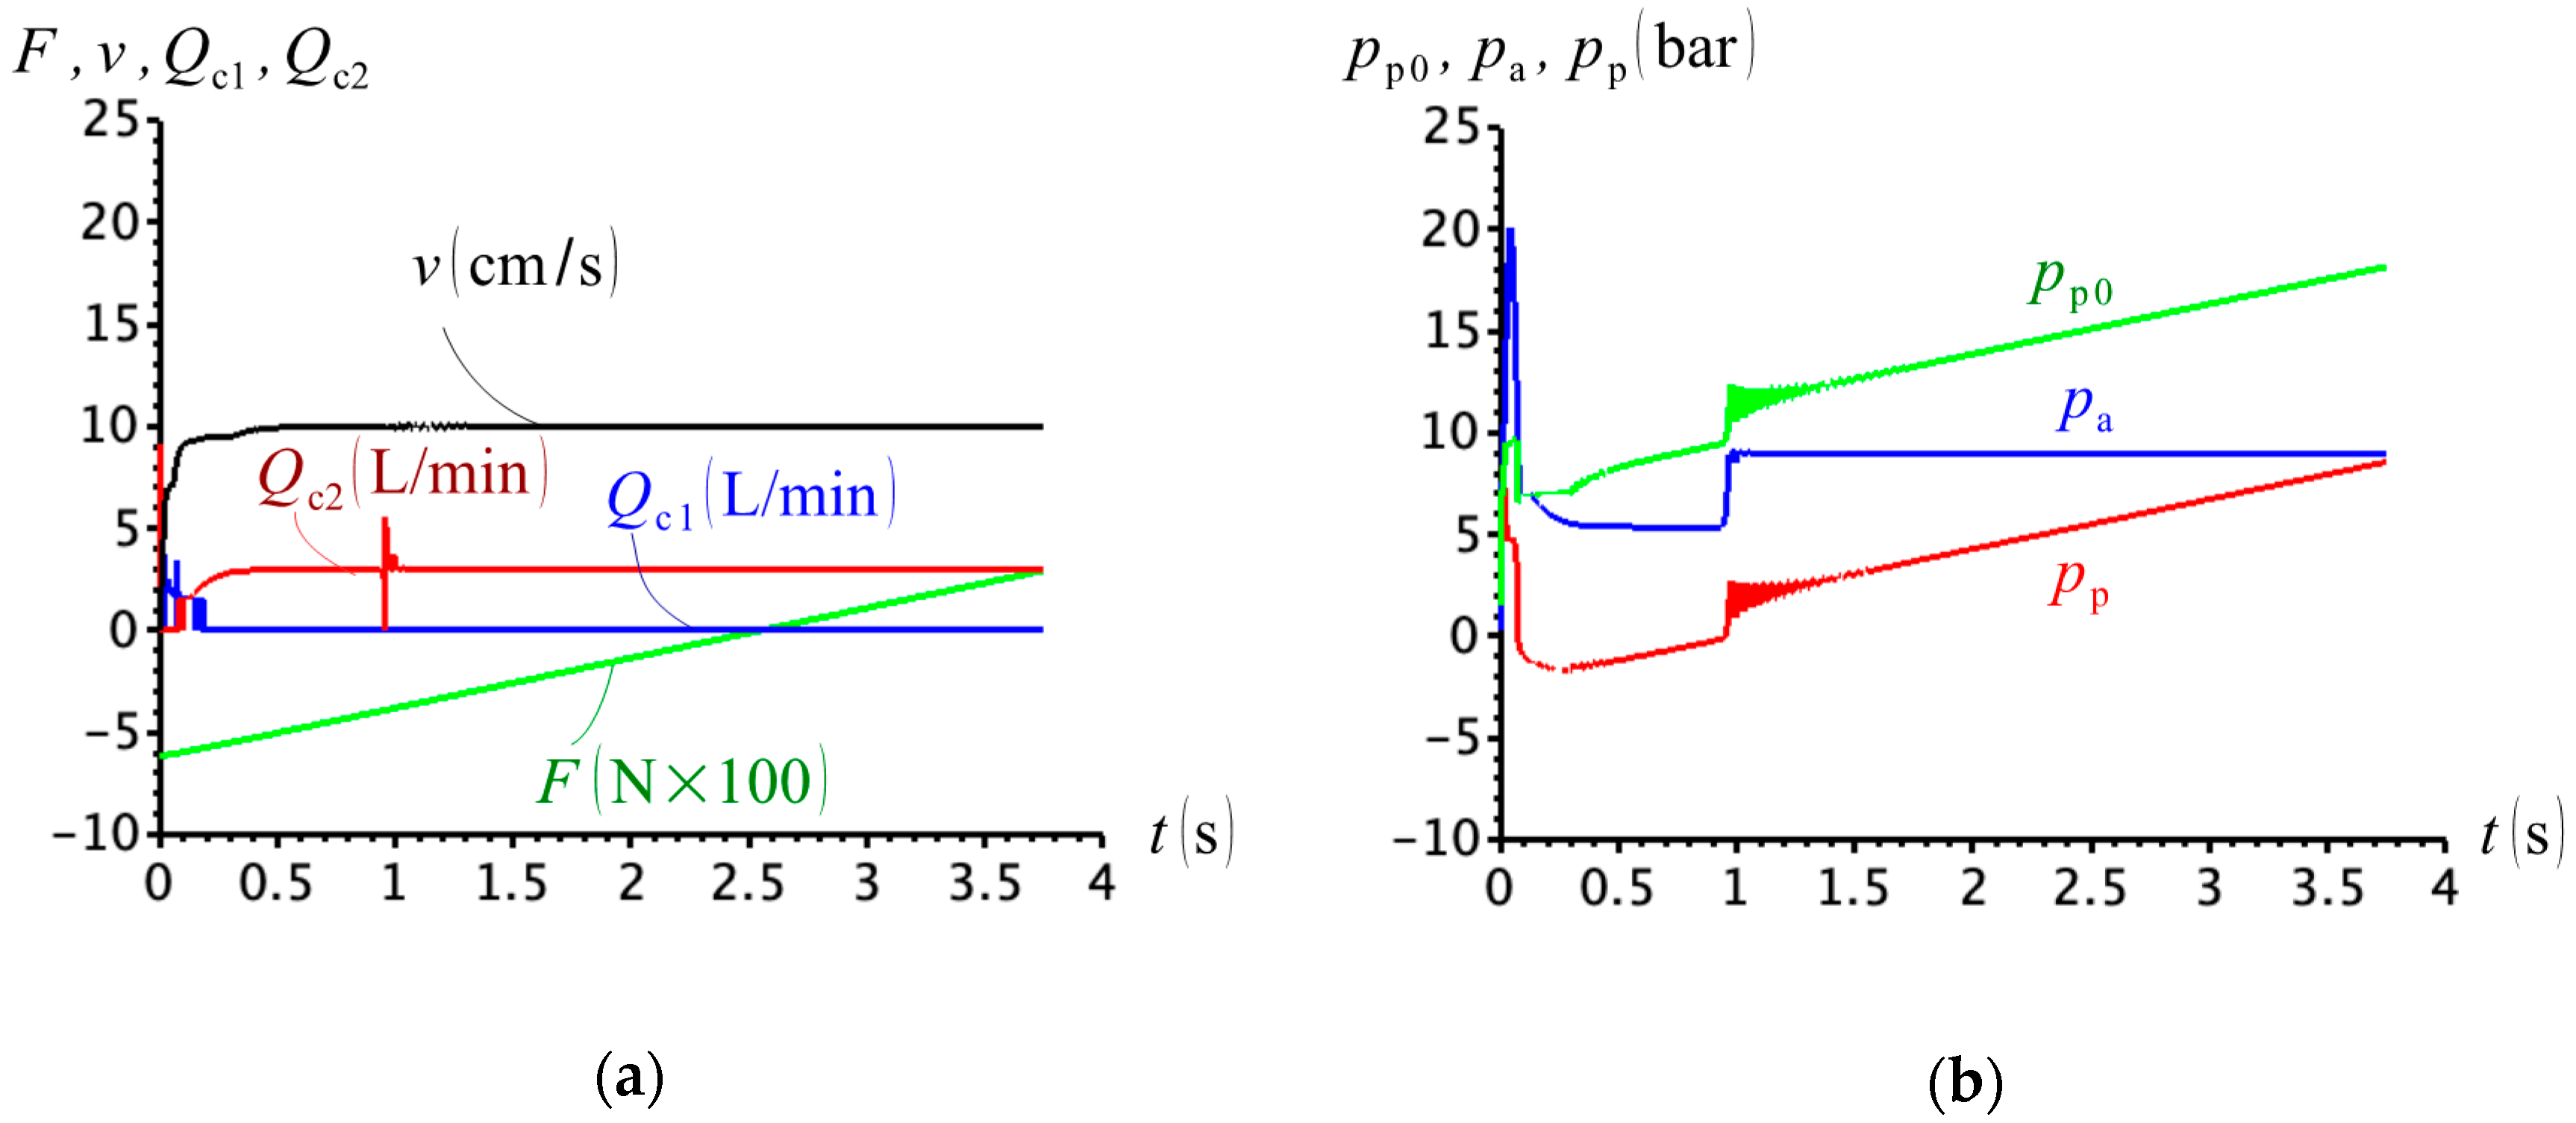
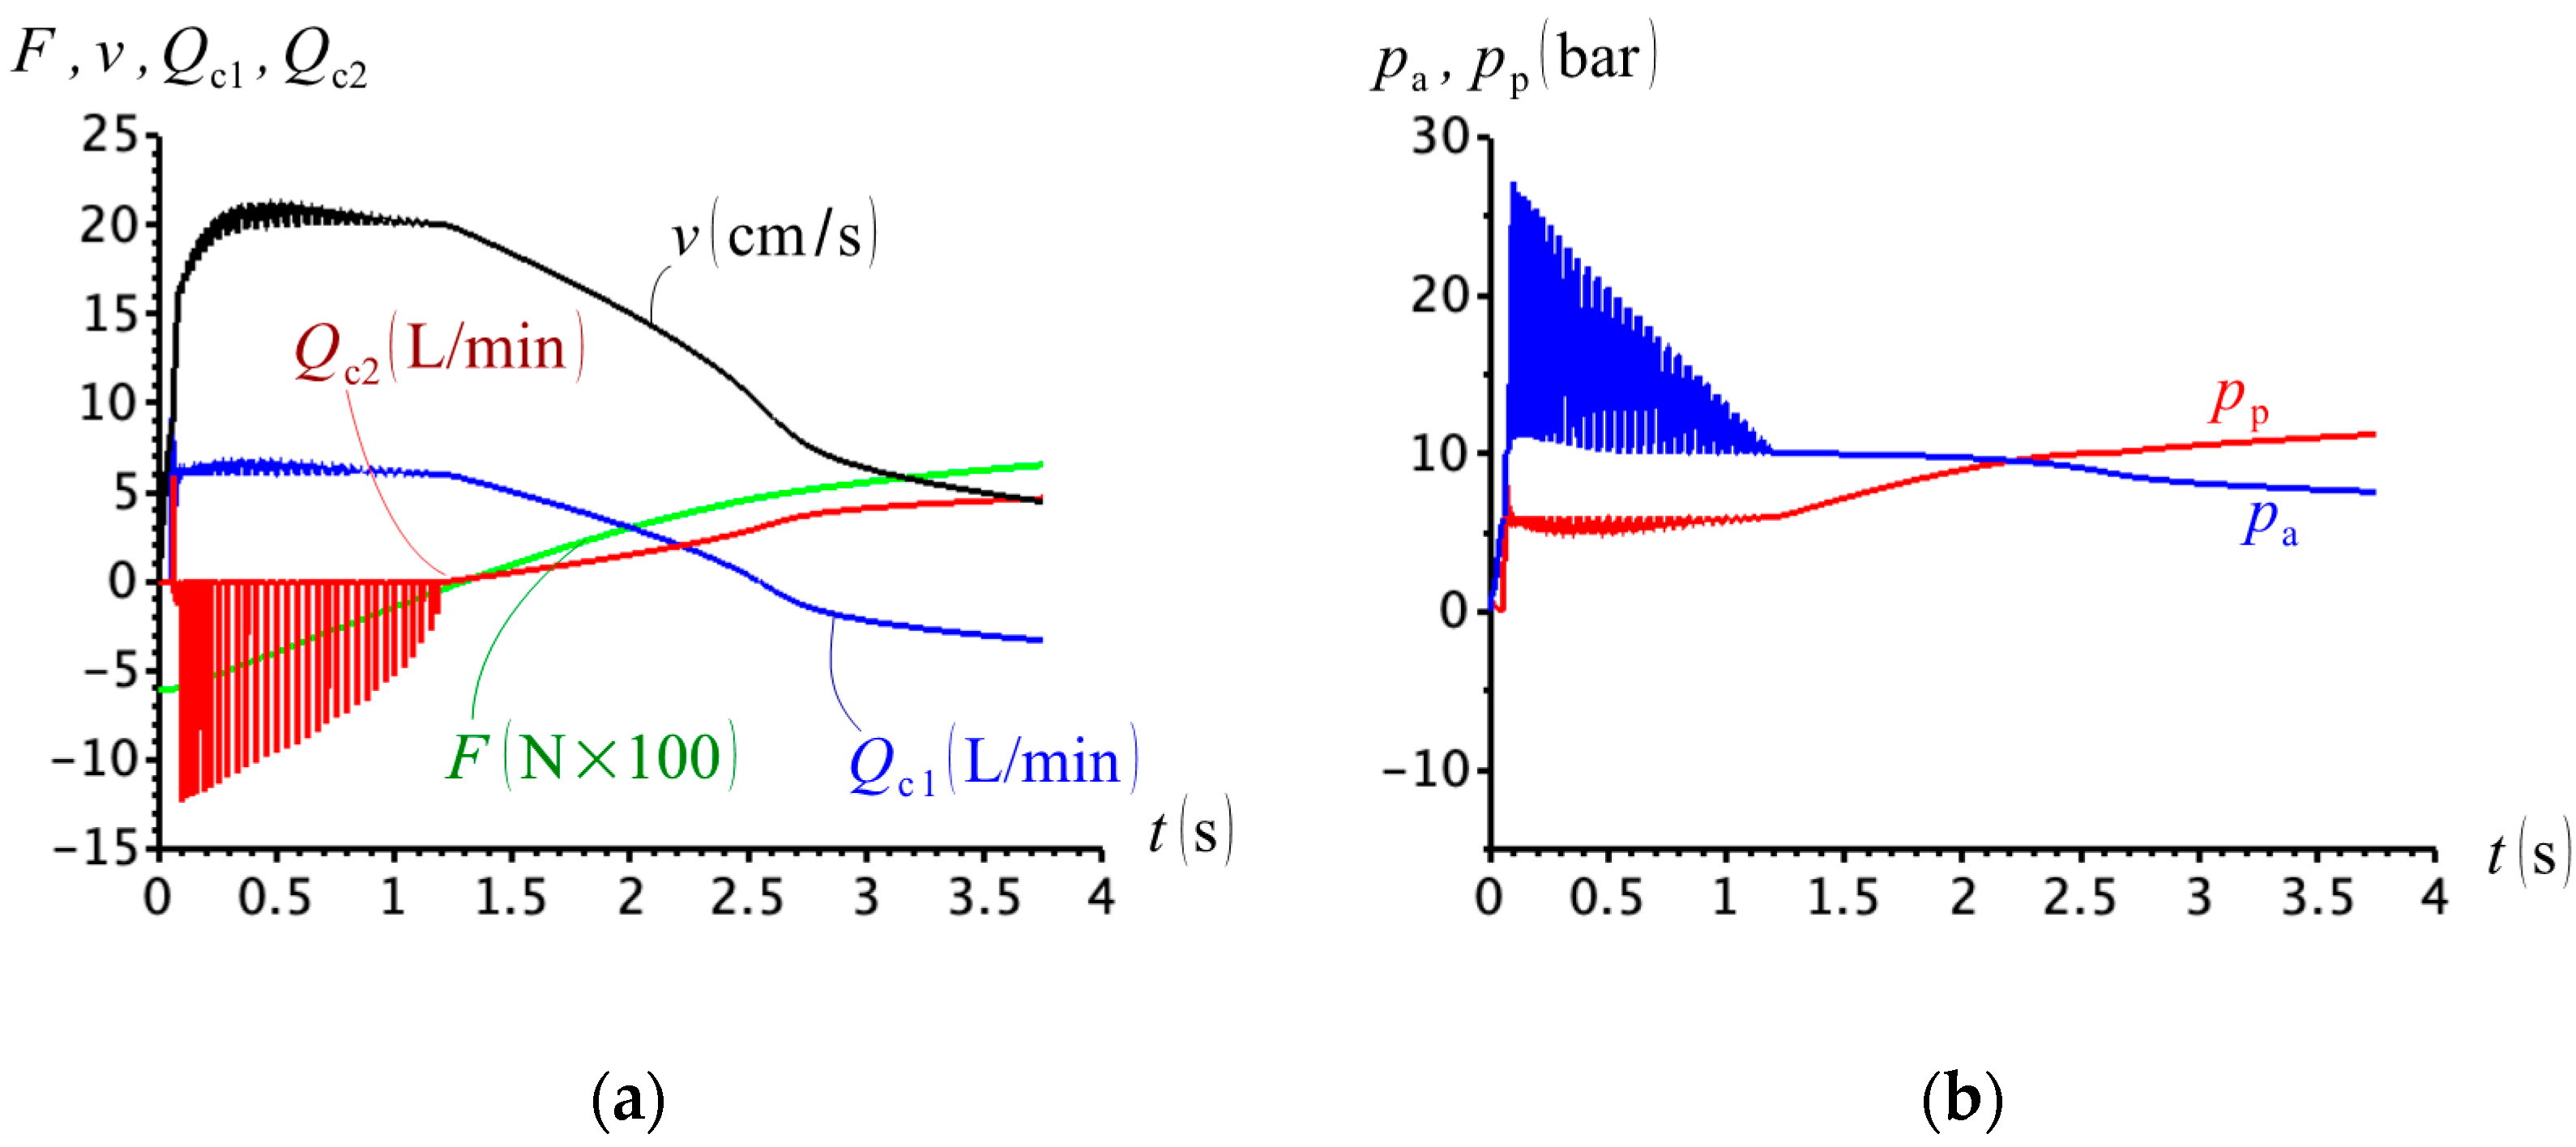
As the load mass is increased to , the behaviour of the circuit deteriorates during the first quadrant, when both valves C1 and C2 open simultaneously (Figure 19a). The reason why the circuit behaves so erratically can be understood from the pressure curves in Figure 19b, where both cap- and rod-side pressures, and , remain above the minimum activation pressure level for valves C1 and C2 () as soon as the external force, , becomes positive. The cylinder, therefore, extends in a controlled manner by the pump, only during the second quadrant of operation.
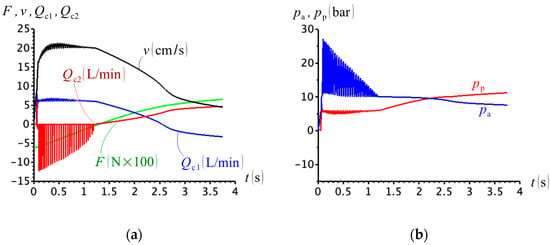
Figure 19.
(a) External force, cylinder velocity and compensation flows; (b) cap- and rod-side pressures (.
The previous results indicate that simultaneous control of two independent valves is not a good solution for asymmetric flow problems. Thus, one can think of replacing the two valves, C1 and C2, with one single valve, so that when one side of the cylinder is connected to the compensation circuit, the other side is hydraulically disconnected. This is the idea behind the circuit in Figure 1d and will be analysed next.
4.2. Circuit Using Three-Position, Three-Way Directional Valve with Different Activation Pressure Settings
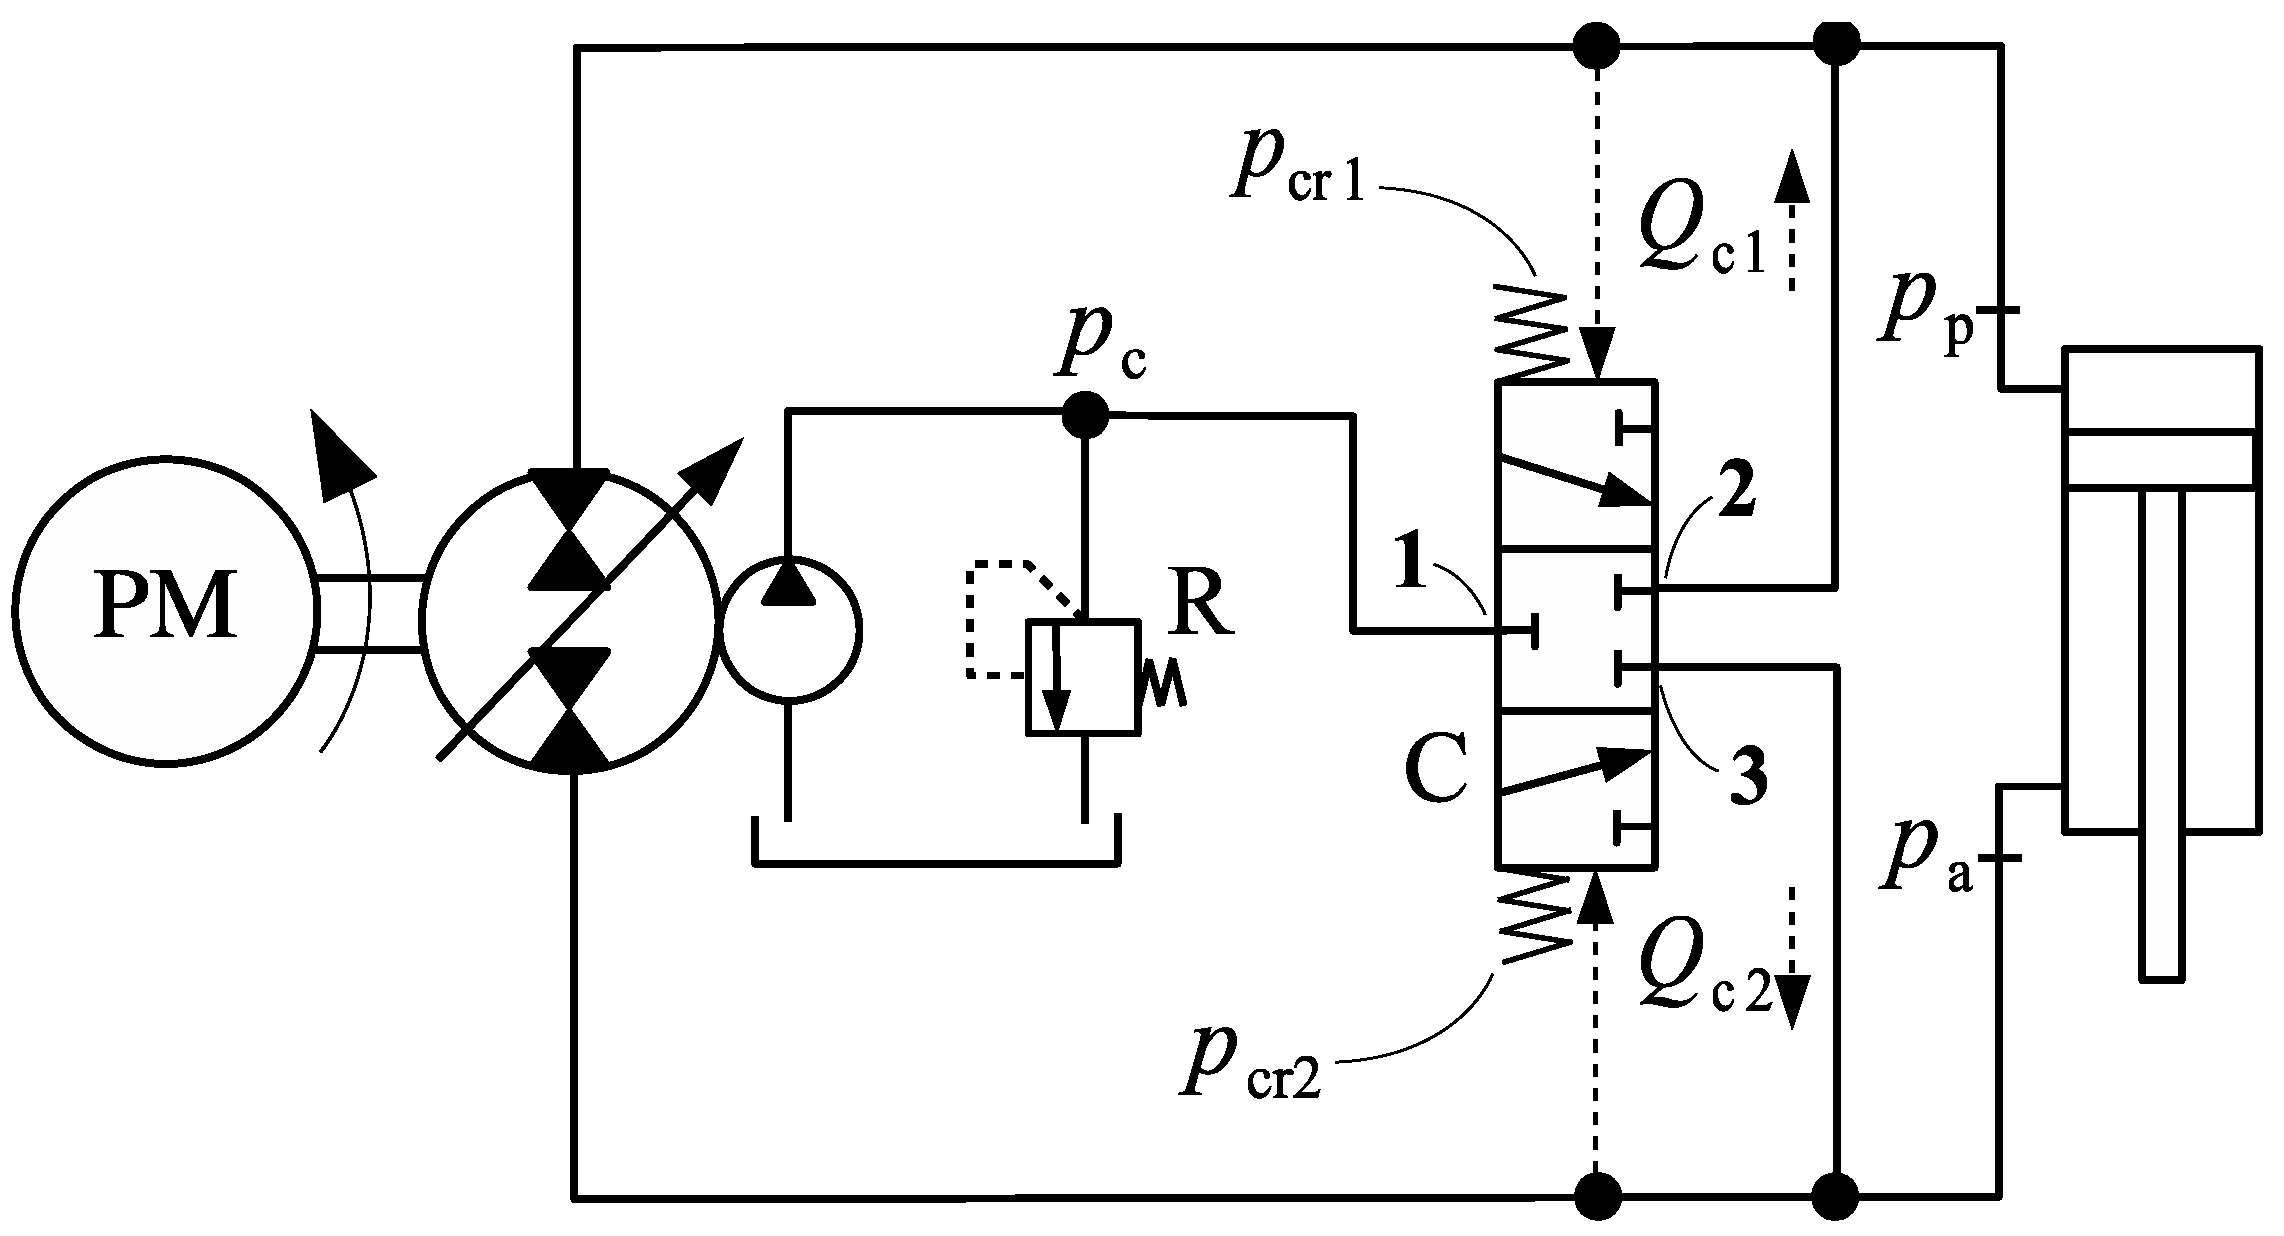
Figure 20 reproduces the circuit shown in Figure 1d, and employs a three-position, three-way directional valve with two different springs on each end [10]. Observe that it is the pressure differential , not the individual pressures, and , which is responsible for the valve activation. By building the valve with two different springs in which the cracking pressures are and , the conditions for connecting the cap and rod-sides of the cylinder to the charge circuit become
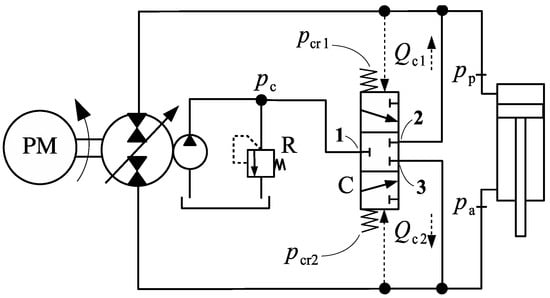
Figure 20.
Circuit using directional valve with different pressure sets.
If none of the conditions above hold, the valve remains in centred-position, cutting the communication between the charge circuit and the cylinder.
It has been understood that the ratio between the two charge pressures as well as the ratio between the two spring stiffnesses should relate to the ratio of the piston areas to ensure a smooth operation [10]. Let us assume therefore, that the relation between the spring stiffnesses, or, equivalently, between the cracking pressures and , obey the following equation
We now show that choosing and according to Equations (27) does not guarantee a correct distribution of the compensation flows. To make things simple, let us choose a deferential cracking pressure, , so that we can write = and . Therefore, the condition for connecting the charge circuit to the cap-side becomes . If such condition is verified, the spool of valve C starts moving towards connecting ports 1 and 2 in Figure 20. We then assume that when , with the spool is completely displaced inside the valve case and the way between ports 1 and 2 is fully open. When , the spool does not move any longer and the valve behaves as a fixed orifice. With these considerations, we can write the following expressions for flows and
Likewise, when , the rod-side is connected to the charge circuit and we have
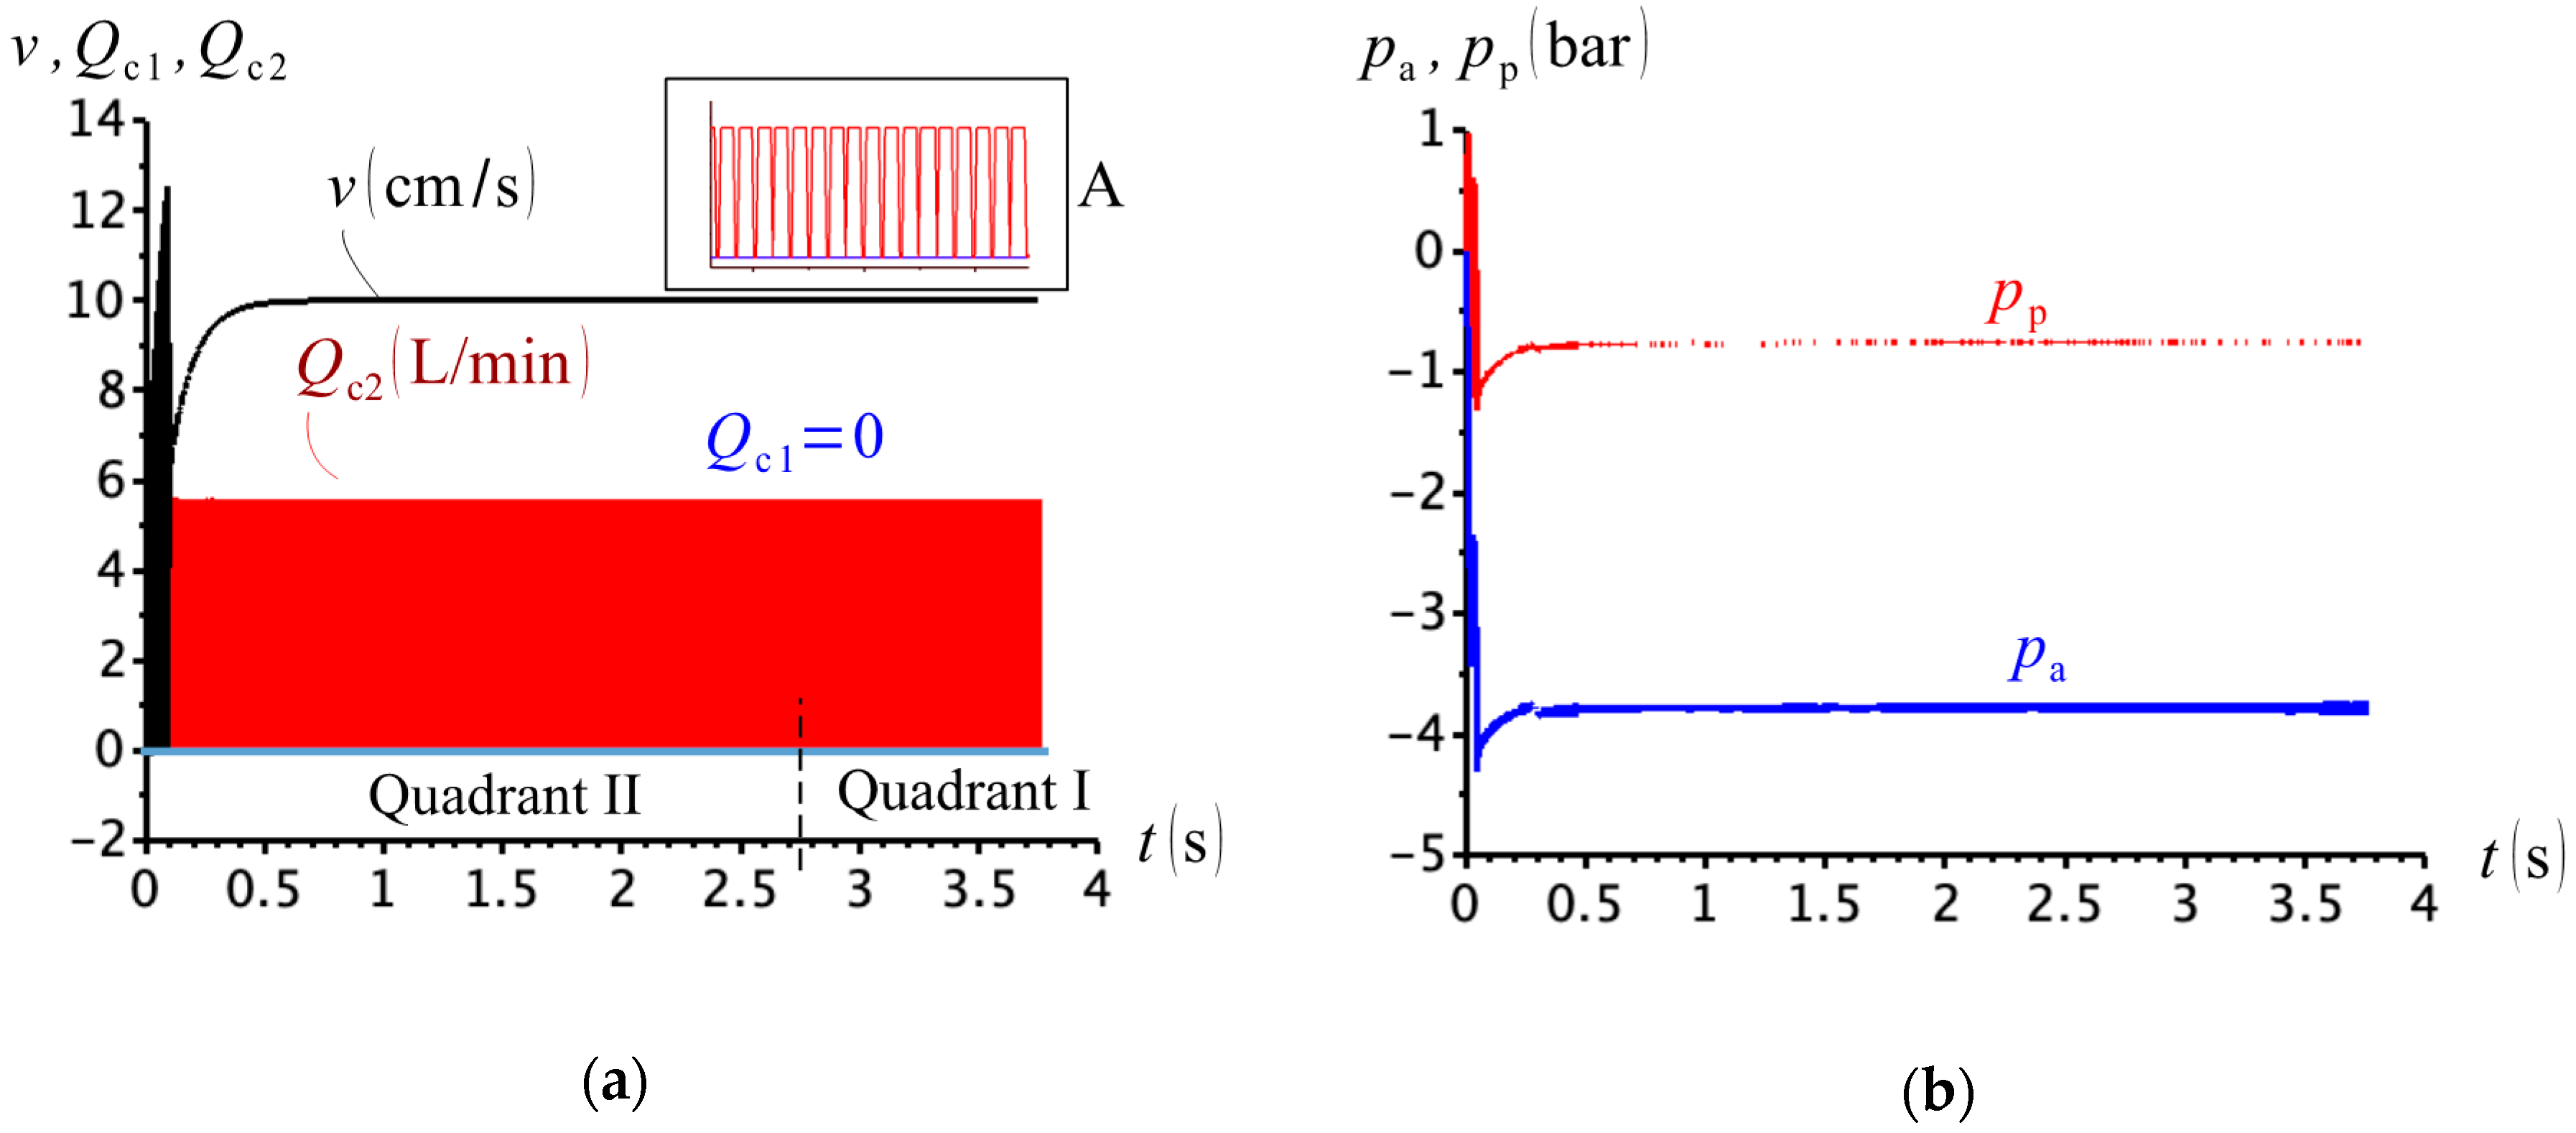
Figure 21a shows the simulations results for , , and , where we observe that valve C closes and opens at a high frequency (see close-up view A).
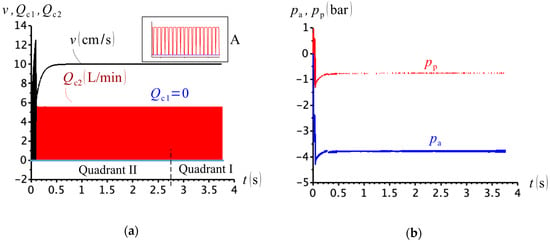
Figure 21.
(a) Cylinder velocity and compensation flows; (b) cap- and rod-side pressures ( and ).
The situation shown in Figure 21b cannot be physically justified, which renders the circuit unpractical at low values of the external load. This is partially because of the flow-resistance created at valve C. Reducing the value of the cracking pressure,, and/or increasing the value of the flow coefficient,, would favour the compensation flow into and out of the cylinder chambers, increasing the levels of both pressures, and . However, modifying the values of and is not easy, since they are design-dependant and naturally subject to technical limitations.
To see how the value of the cracking pressure influences the results, we have simulated the circuit in Figure 20 once again with and . The limiting case would be to use , but, in such case, Equation (27) could not be applied. In fact, neither of these assumptions, or , are possible to be attained in an actual hydraulic valve (at least, in commercially produced valves). Figure 22 shows the simulation results. Apparently, this situation produces much better results when compared to those shown in Figure 21. However, according to the quadrant division proposed in Figure 3a and shown in Figure 22a, valve C should behave differently, connecting the rod-side to the charge circuit during the first quadrant. Note that the quadrant division was based on the shifting of the external force sign; however, due to scaling, it was not possible to observe such division by plotting as a function of in Figure 22.
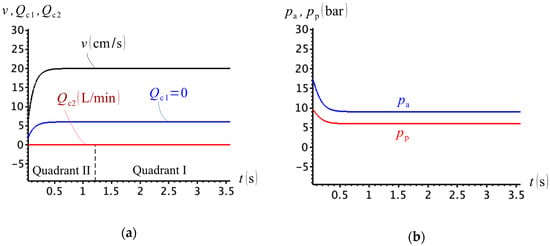
Figure 22.
(a) Cylinder velocity and compensation flows; (b) cap- and rod-side pressures ( and ).
We further observe the following:
- There is an ambiguity as to where the border between second and first quadrant divisions is located. Strangely enough, if we base such division as in Figure 3a, which has been the case in many publications [4,19,20], two different quadrant divisions arise given the same physical situation, as shown in Figure 21a and Figure 22a. This is simply because the spring stiffness and the flow resistance of the compensation valve directly influence the cap- and rod-side pressures. These pressures, on the other hand, affect the cylinder velocity and displacement, which is ultimately responsible for the external force (see Equations (6) and (7)).
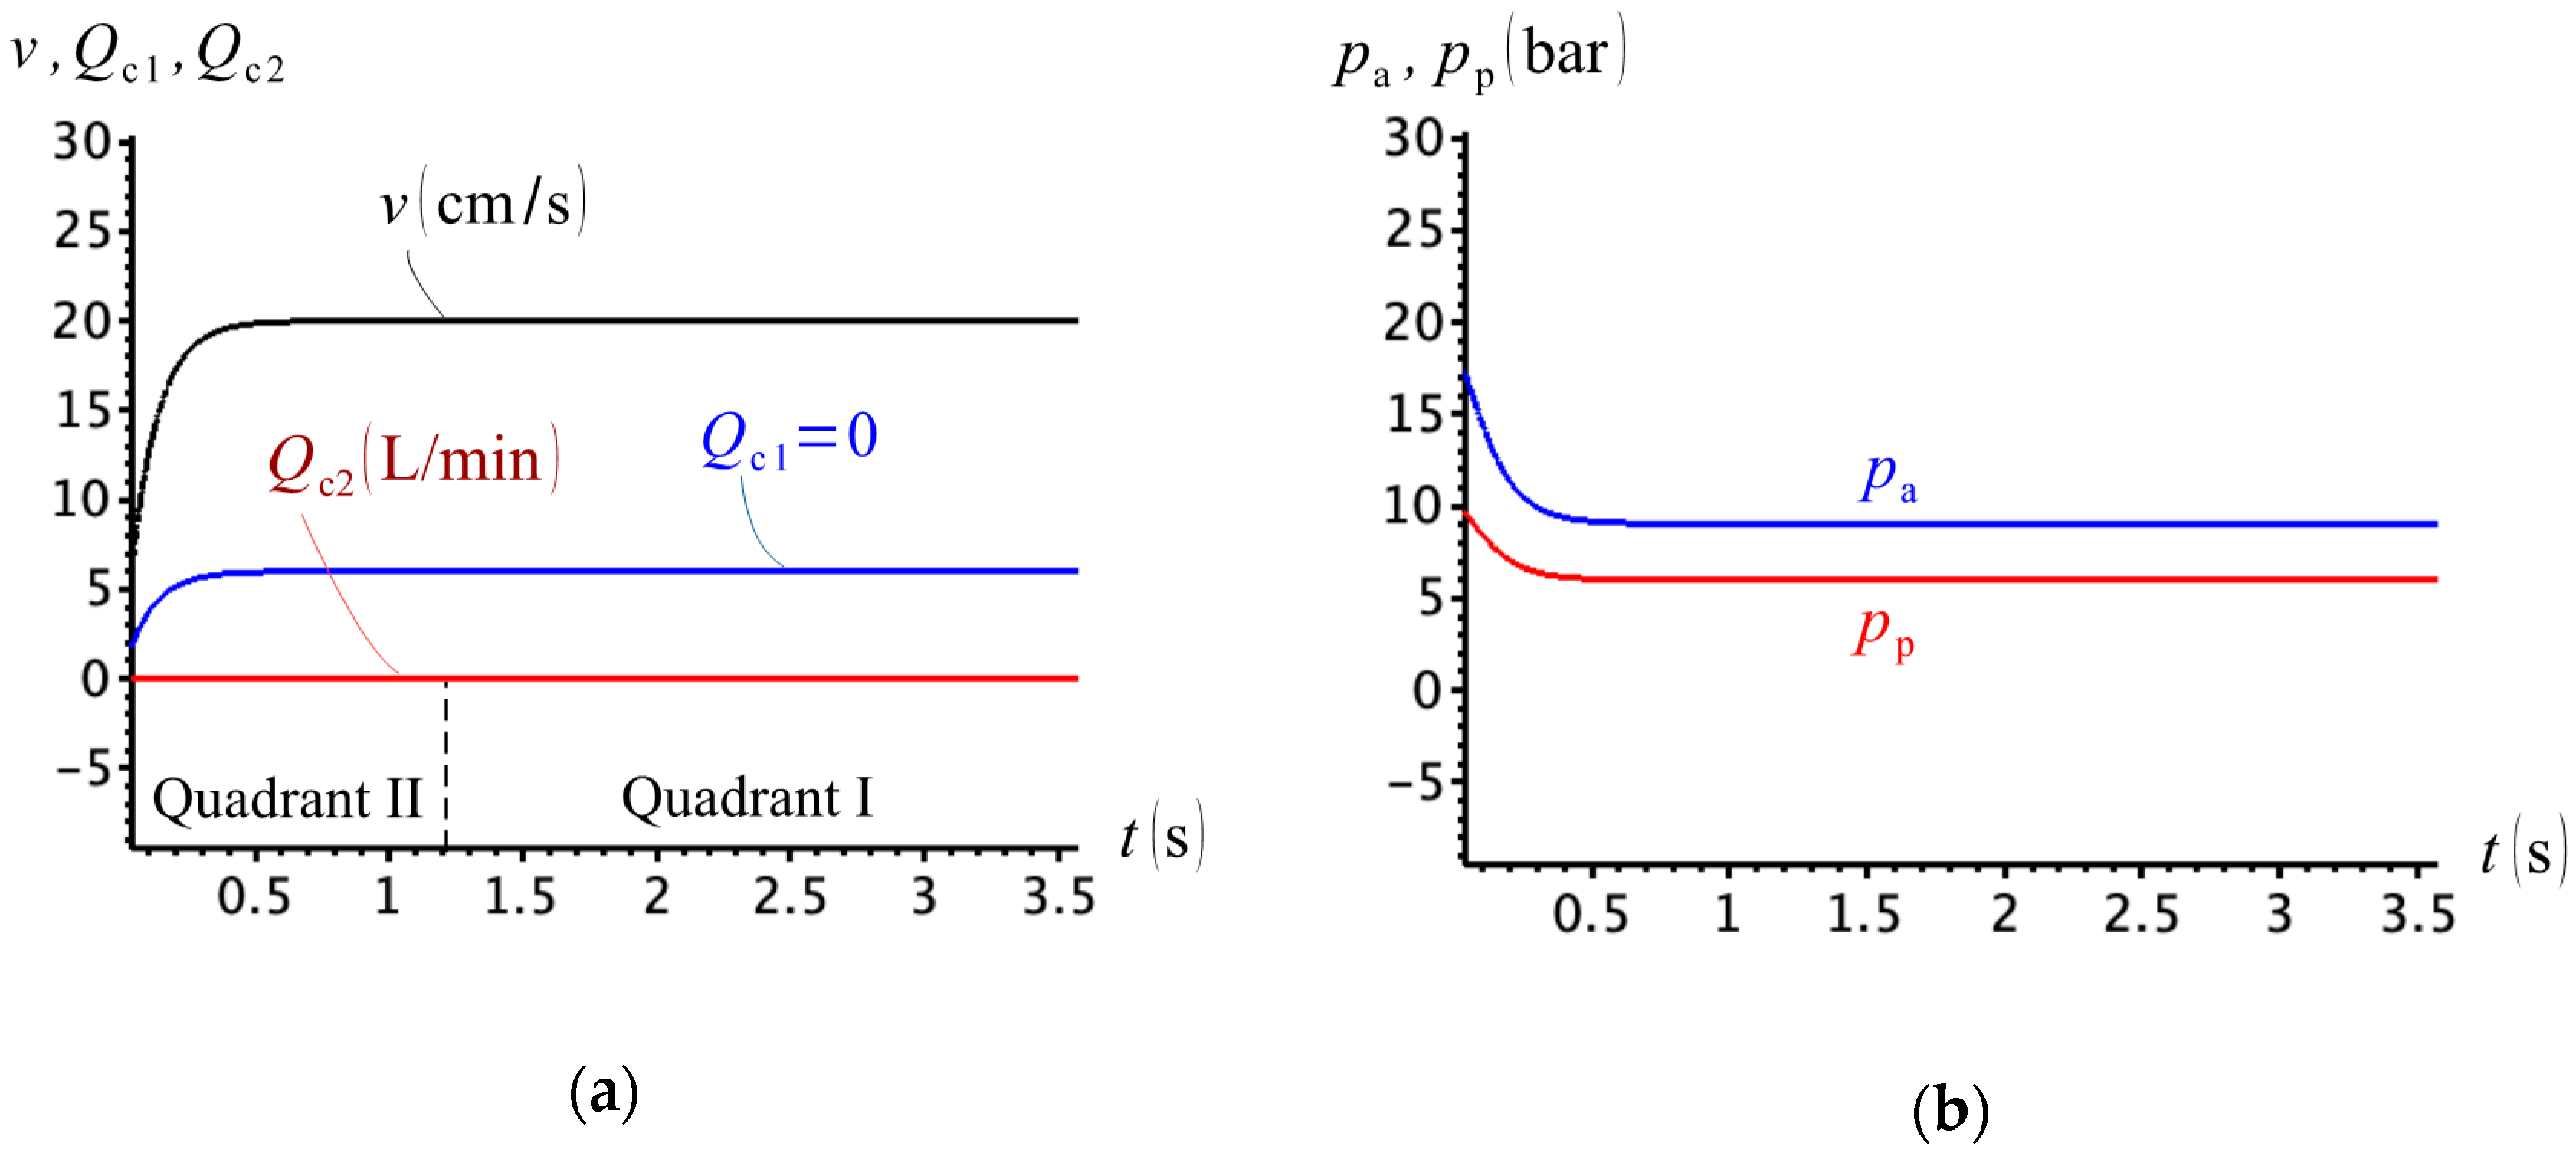
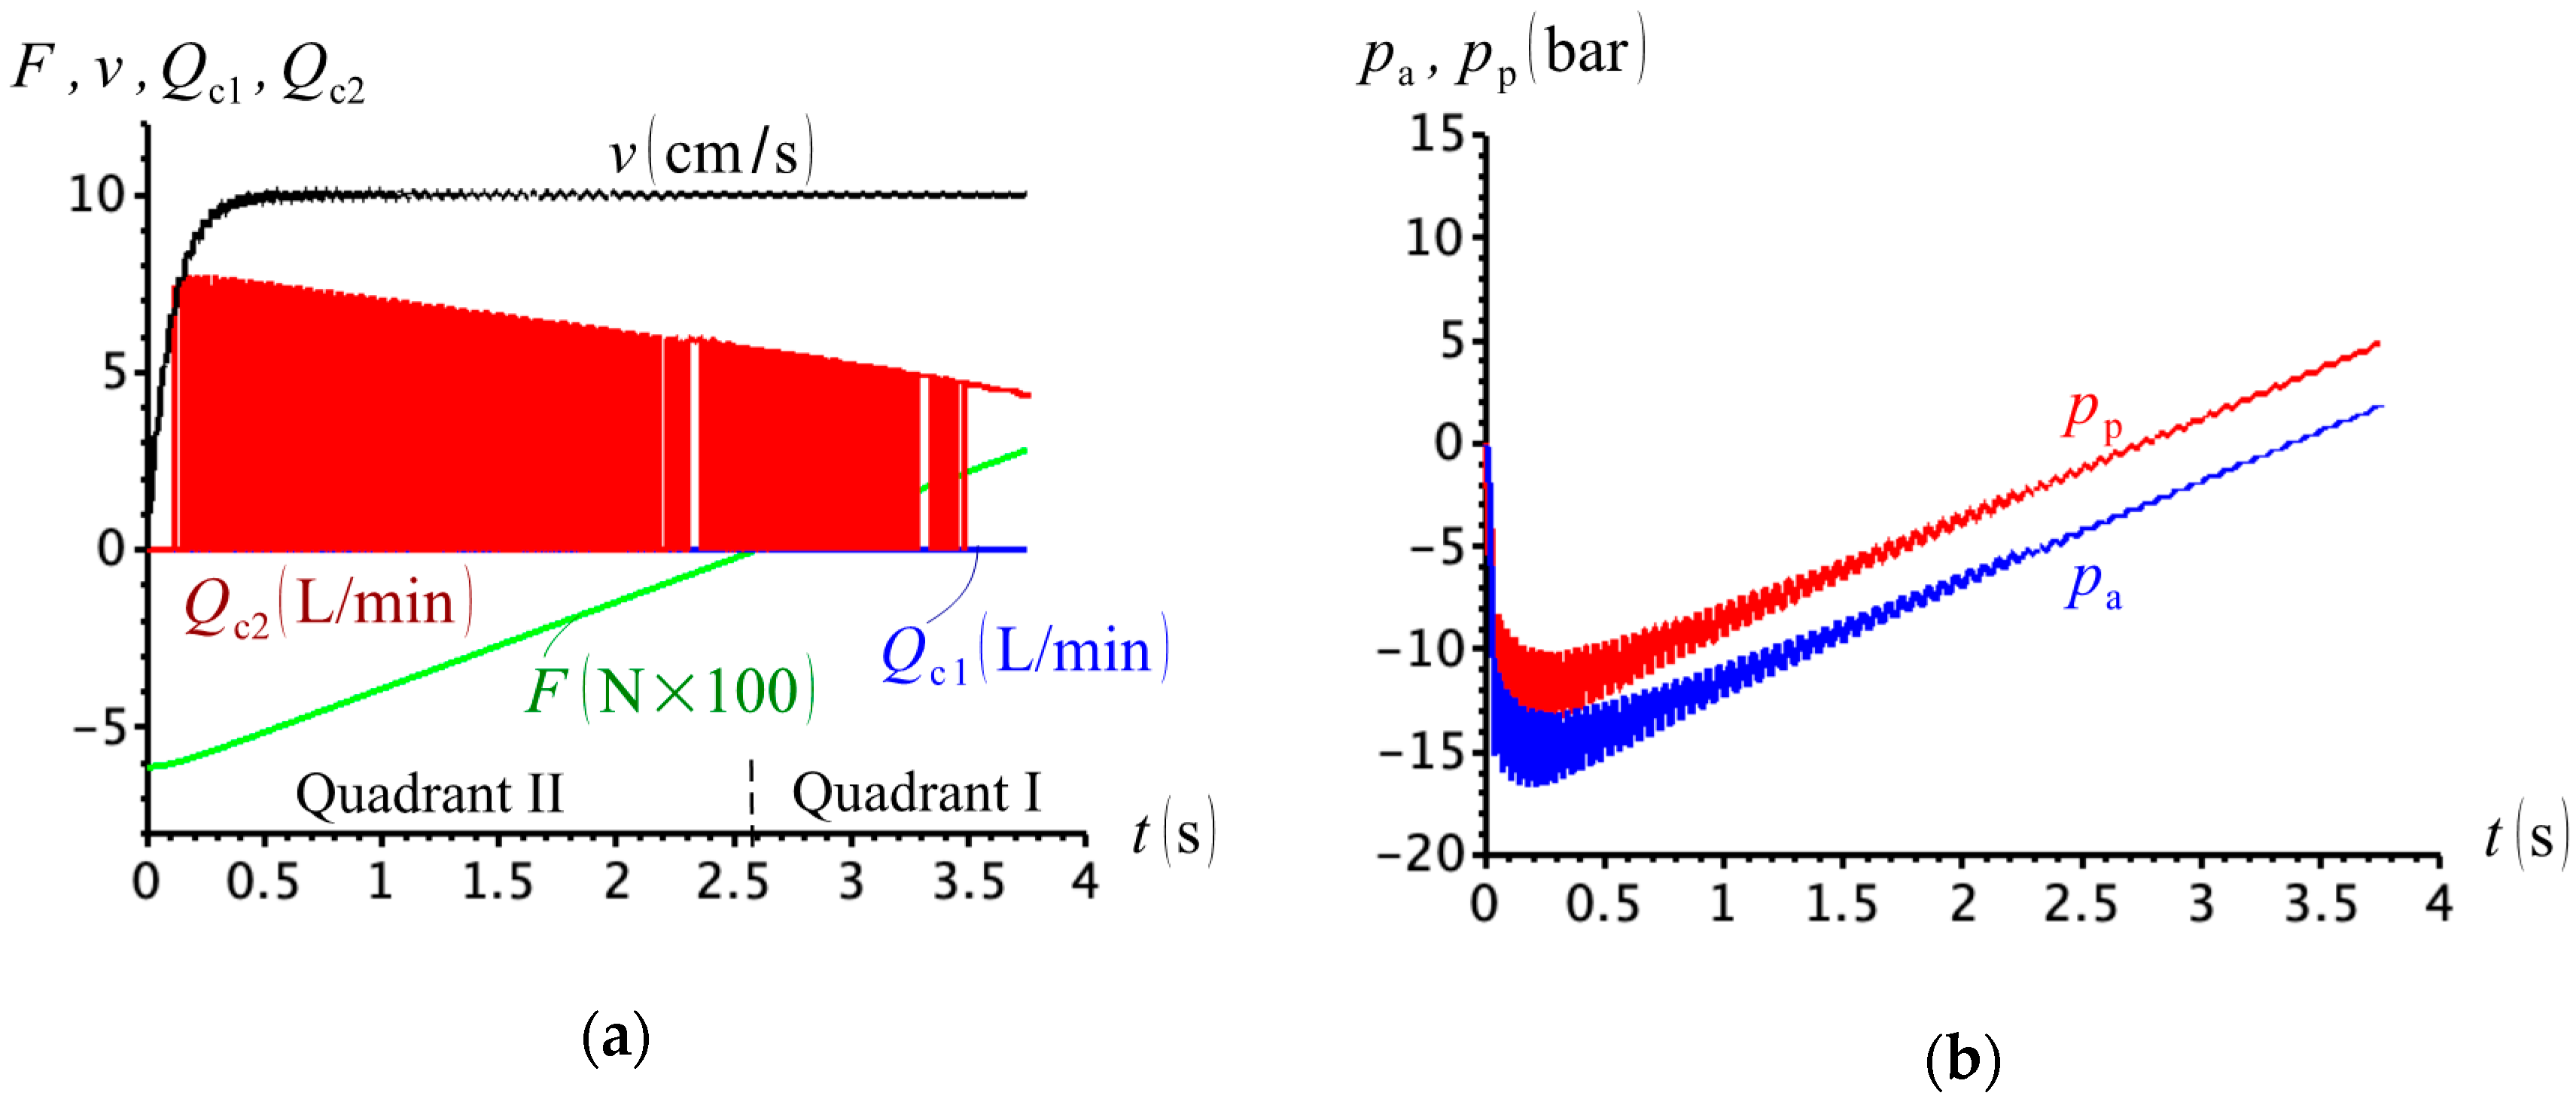
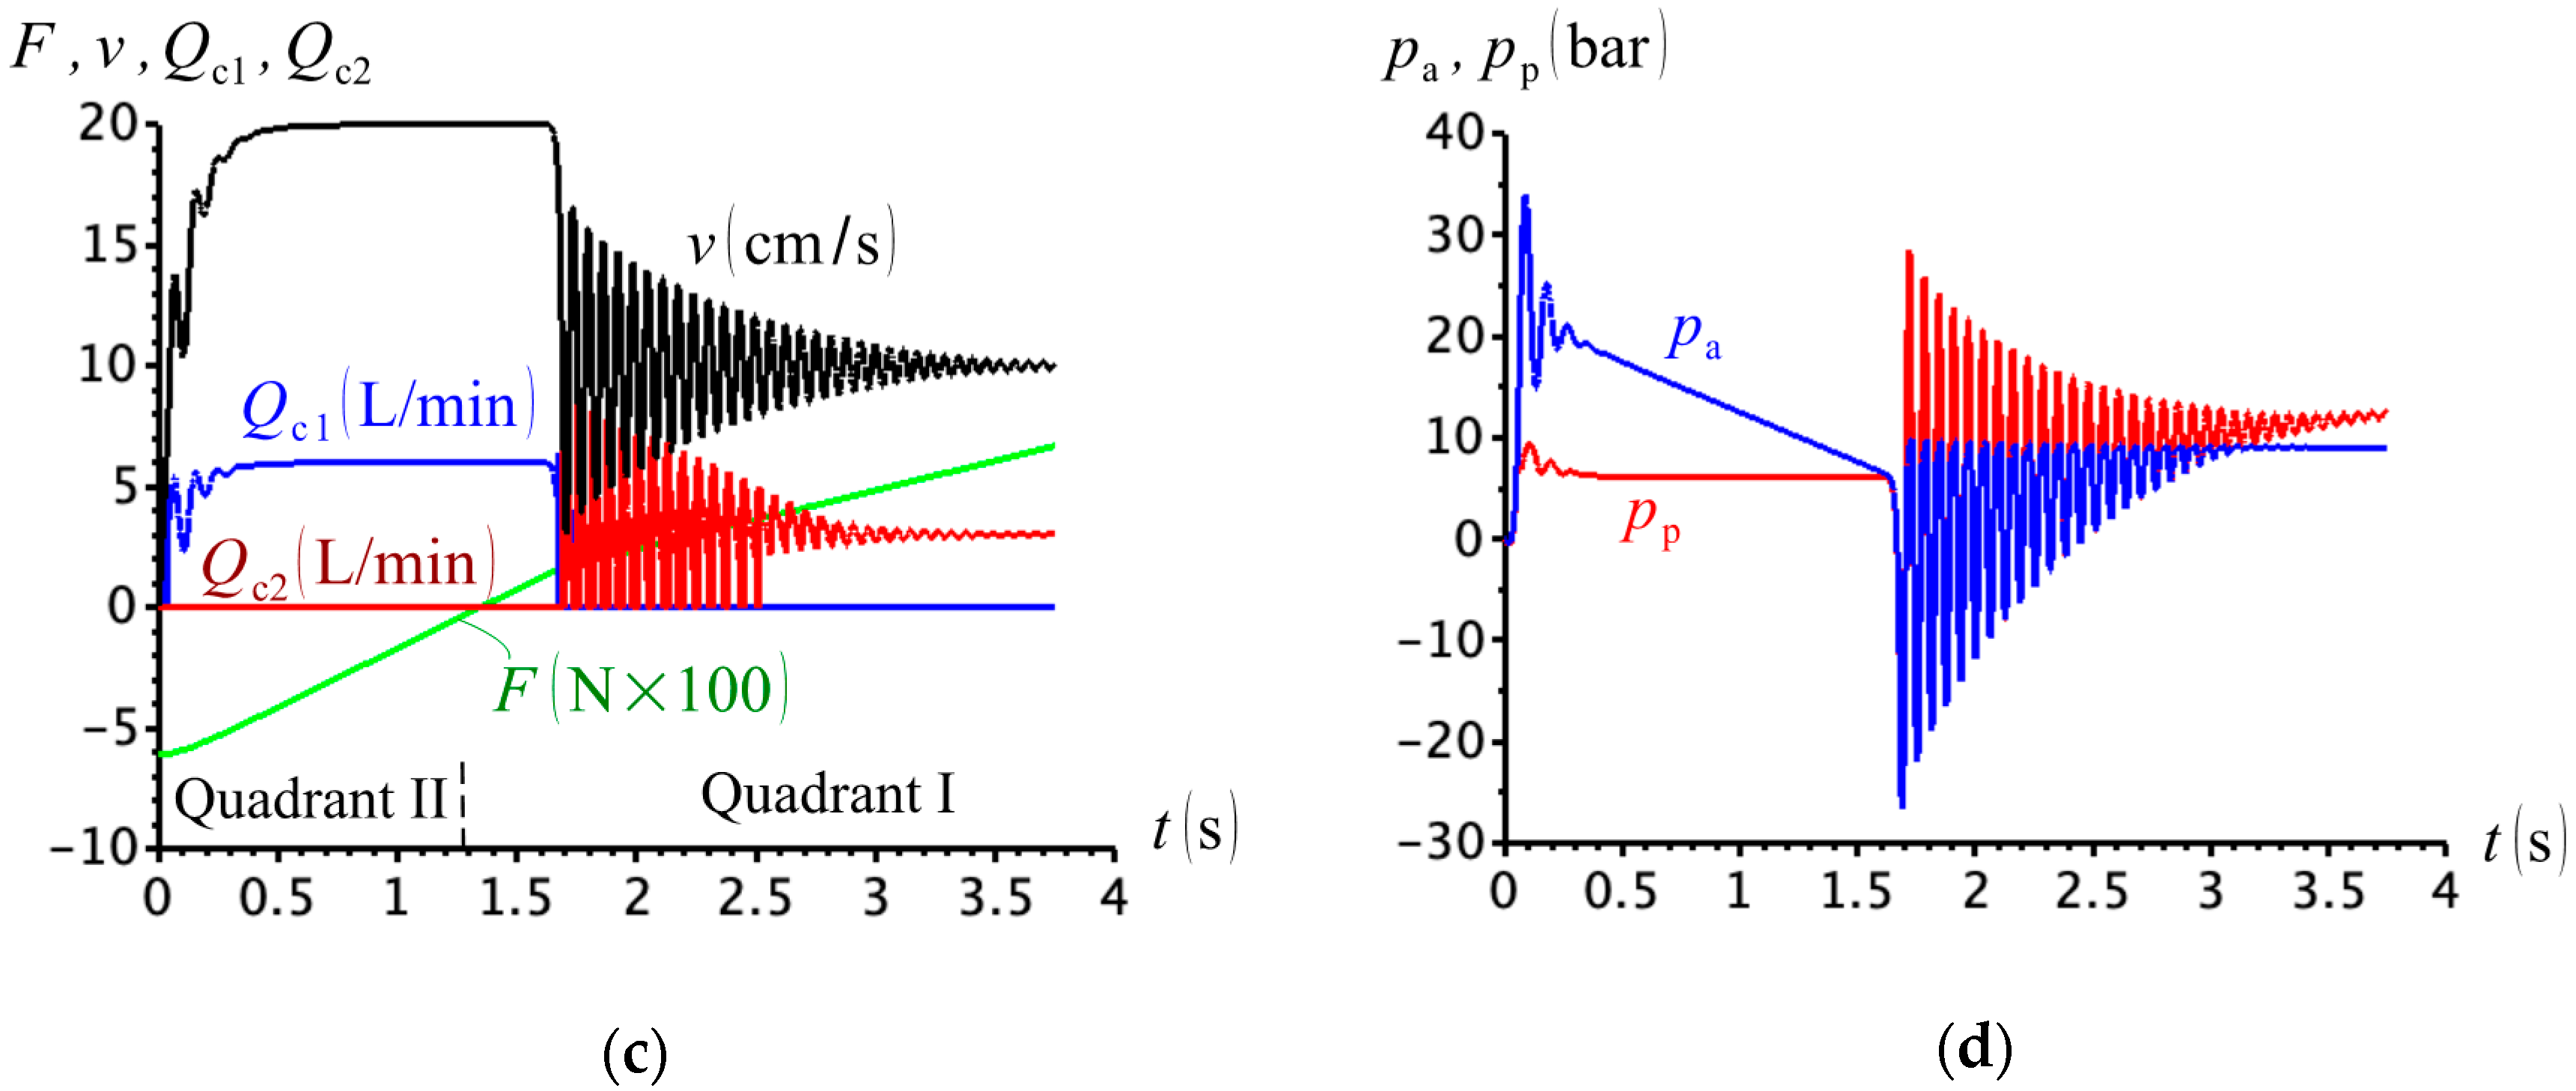
Finally, we simulated the case where a mass is attached to the arm (Figure 4). The circuit behaved poorly when , as seen in Figure 23a, for the same reason it behaved poorly in Figure 21a, and previously explained in Item 1 above. We can see that, as the cylinder accelerates to the right, the cap- and rod-side pressures drop together (Figure 23b), and valve C opens partially under the small pressure differential. The situation is apparently remedied when we use , as indicated in Figure 23c. However, note that the rod-side pressure drops low and unrealistic values at the beginning of the first quadrant (Figure 23d).
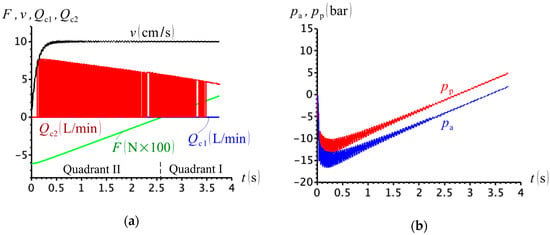
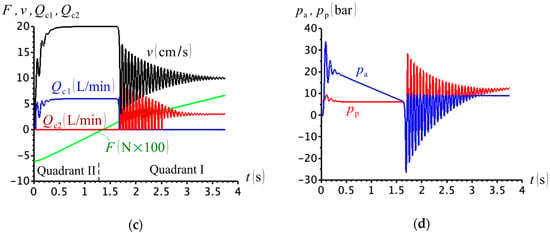
Figure 23.
(a) External force, cylinder velocity and compensation flows (); (b) cap- and rod-side pressures (); (c) external force, cylinder velocity and compensation flows (); (d) cap- and rod-side pressures ().
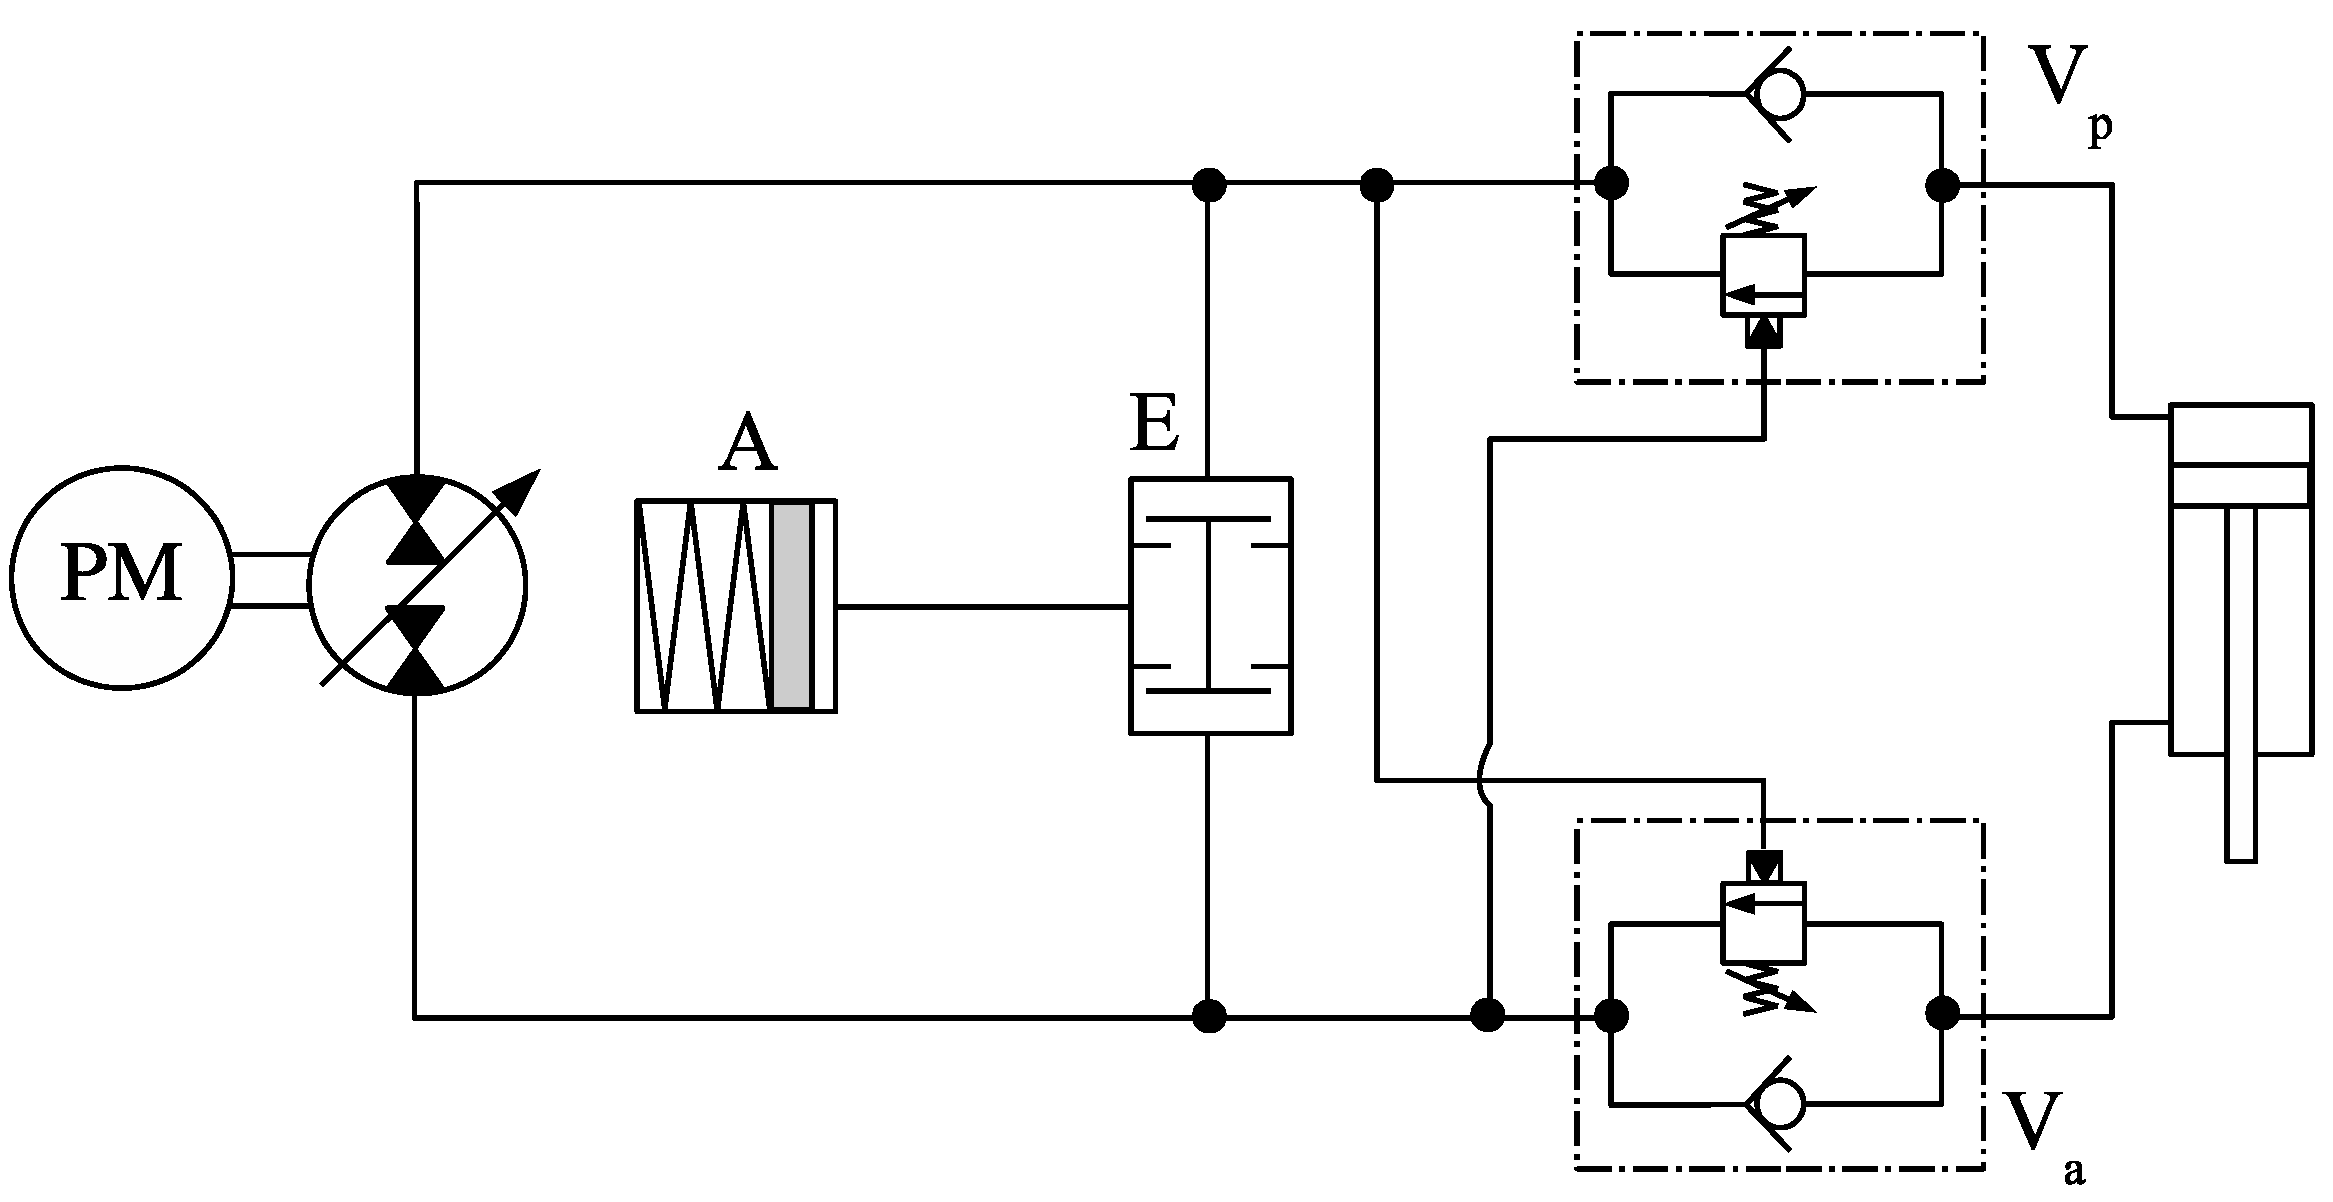
Recently, the circuit shown in Figure 24 was proposed [11], where the directional valve C in Figure 20 was replaced with a logical valve E, and a spring-type accumulator A was used as the compensation flow source. In practice, the circuit is similar to the circuit in Figure 20, operating in the hypothetical scenario, where (i.e., no springs in valve C), and with changing linearly from a maximum to a minimum, as the accumulator discharges. The circuit has the drawback of adding two inline counterbalance valves, Vp and Va, thus introducing throttling losses.
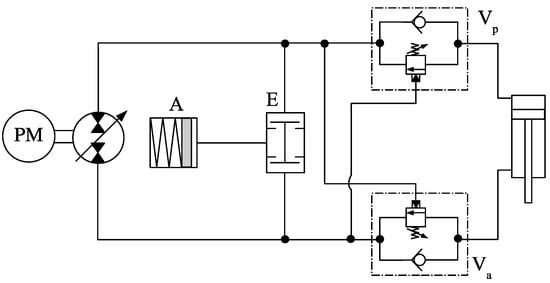
Figure 24.
Circuit using a logic valve.
It would be interesting to see how the circuit in Figure 24 would perform in the absence of valves Vp and Va. As mentioned before, the circuits in Figure 20 and Figure 24 are equivalent when in Figure 20. Therefore, we have chosen to simulate the situation where the circuit in Figure 20 is used to drive a mass using (remember that we cannot use , in Equations (28) and (29)).
Figure 25a shows that, although the quadrant division based on Figure 3a indicates that the circuit operates in two quadrants, the load pulls the cylinder all the way through, and the cylinder extends at (second quadrant operation). There is, therefore, a conflict between the quadrant definition and the circuit behaviour. On the other hand, the pressures at the cap- and rod-sides remain above zero, as shown in Figure 25b.
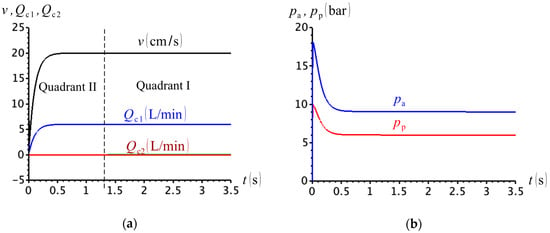
Figure 25.
(a) Cylinder velocity and compensation valve flows; (b) cap- and rod-side pressures ( and ).
To see why the results in Figure 25 are inconsistent, consider the power flows into and out of the cylinder, and . These are conveniently represented in Figure 26. Observe that, according to the figure, the net power flow at the cylinder, , is positive, indicating that the pump is supplying energy to the cylinder and not the other way around. We would therefore expect a rod-side connection between the cylinder and the charge circuit, leaving the pump directly responsible for pushing the cylinder onwards.
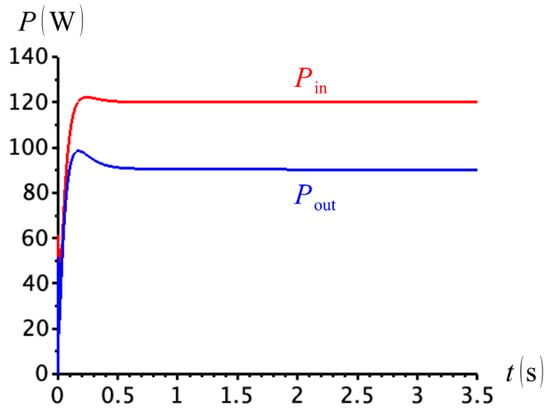
Figure 26.
Power flows into and out of the cylinder.
We have argued that, although the operation of the circuit shown in Figure 24 is smooth at low loads, the compensation flow distribution is incompatible with the power balance at the cylinder. The problem extends to higher loads as well. Figure 27 shows the simulation using and . If we look at Figure 27a, we might conclude that the circuit performs well, having smooth velocity reduction and with the compensation flow shifting from cap- to rod-side when . However, the results in Figure 27b reveal that when , the power input to the load, , is higher than the power transferred from load to pump, . In other words, it is the pump that should be driving the load between and , although, during this period the cap-side communicates with the charge circuit (flow and ). The charge pump must, therefore, be providing the cylinder with the needed power to move forward between and . This is not desirable by any means because the role of the charge circuit is not to drive the cylinder, but to compensate for the differential flows.
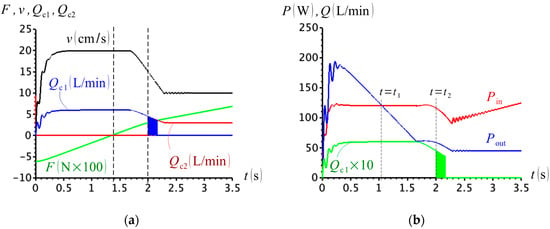
Figure 27.
(a) External force, cylinder velocity and compensation flows; (b) input and output powers at the cylinder and cap-side compensation flow ( and ).
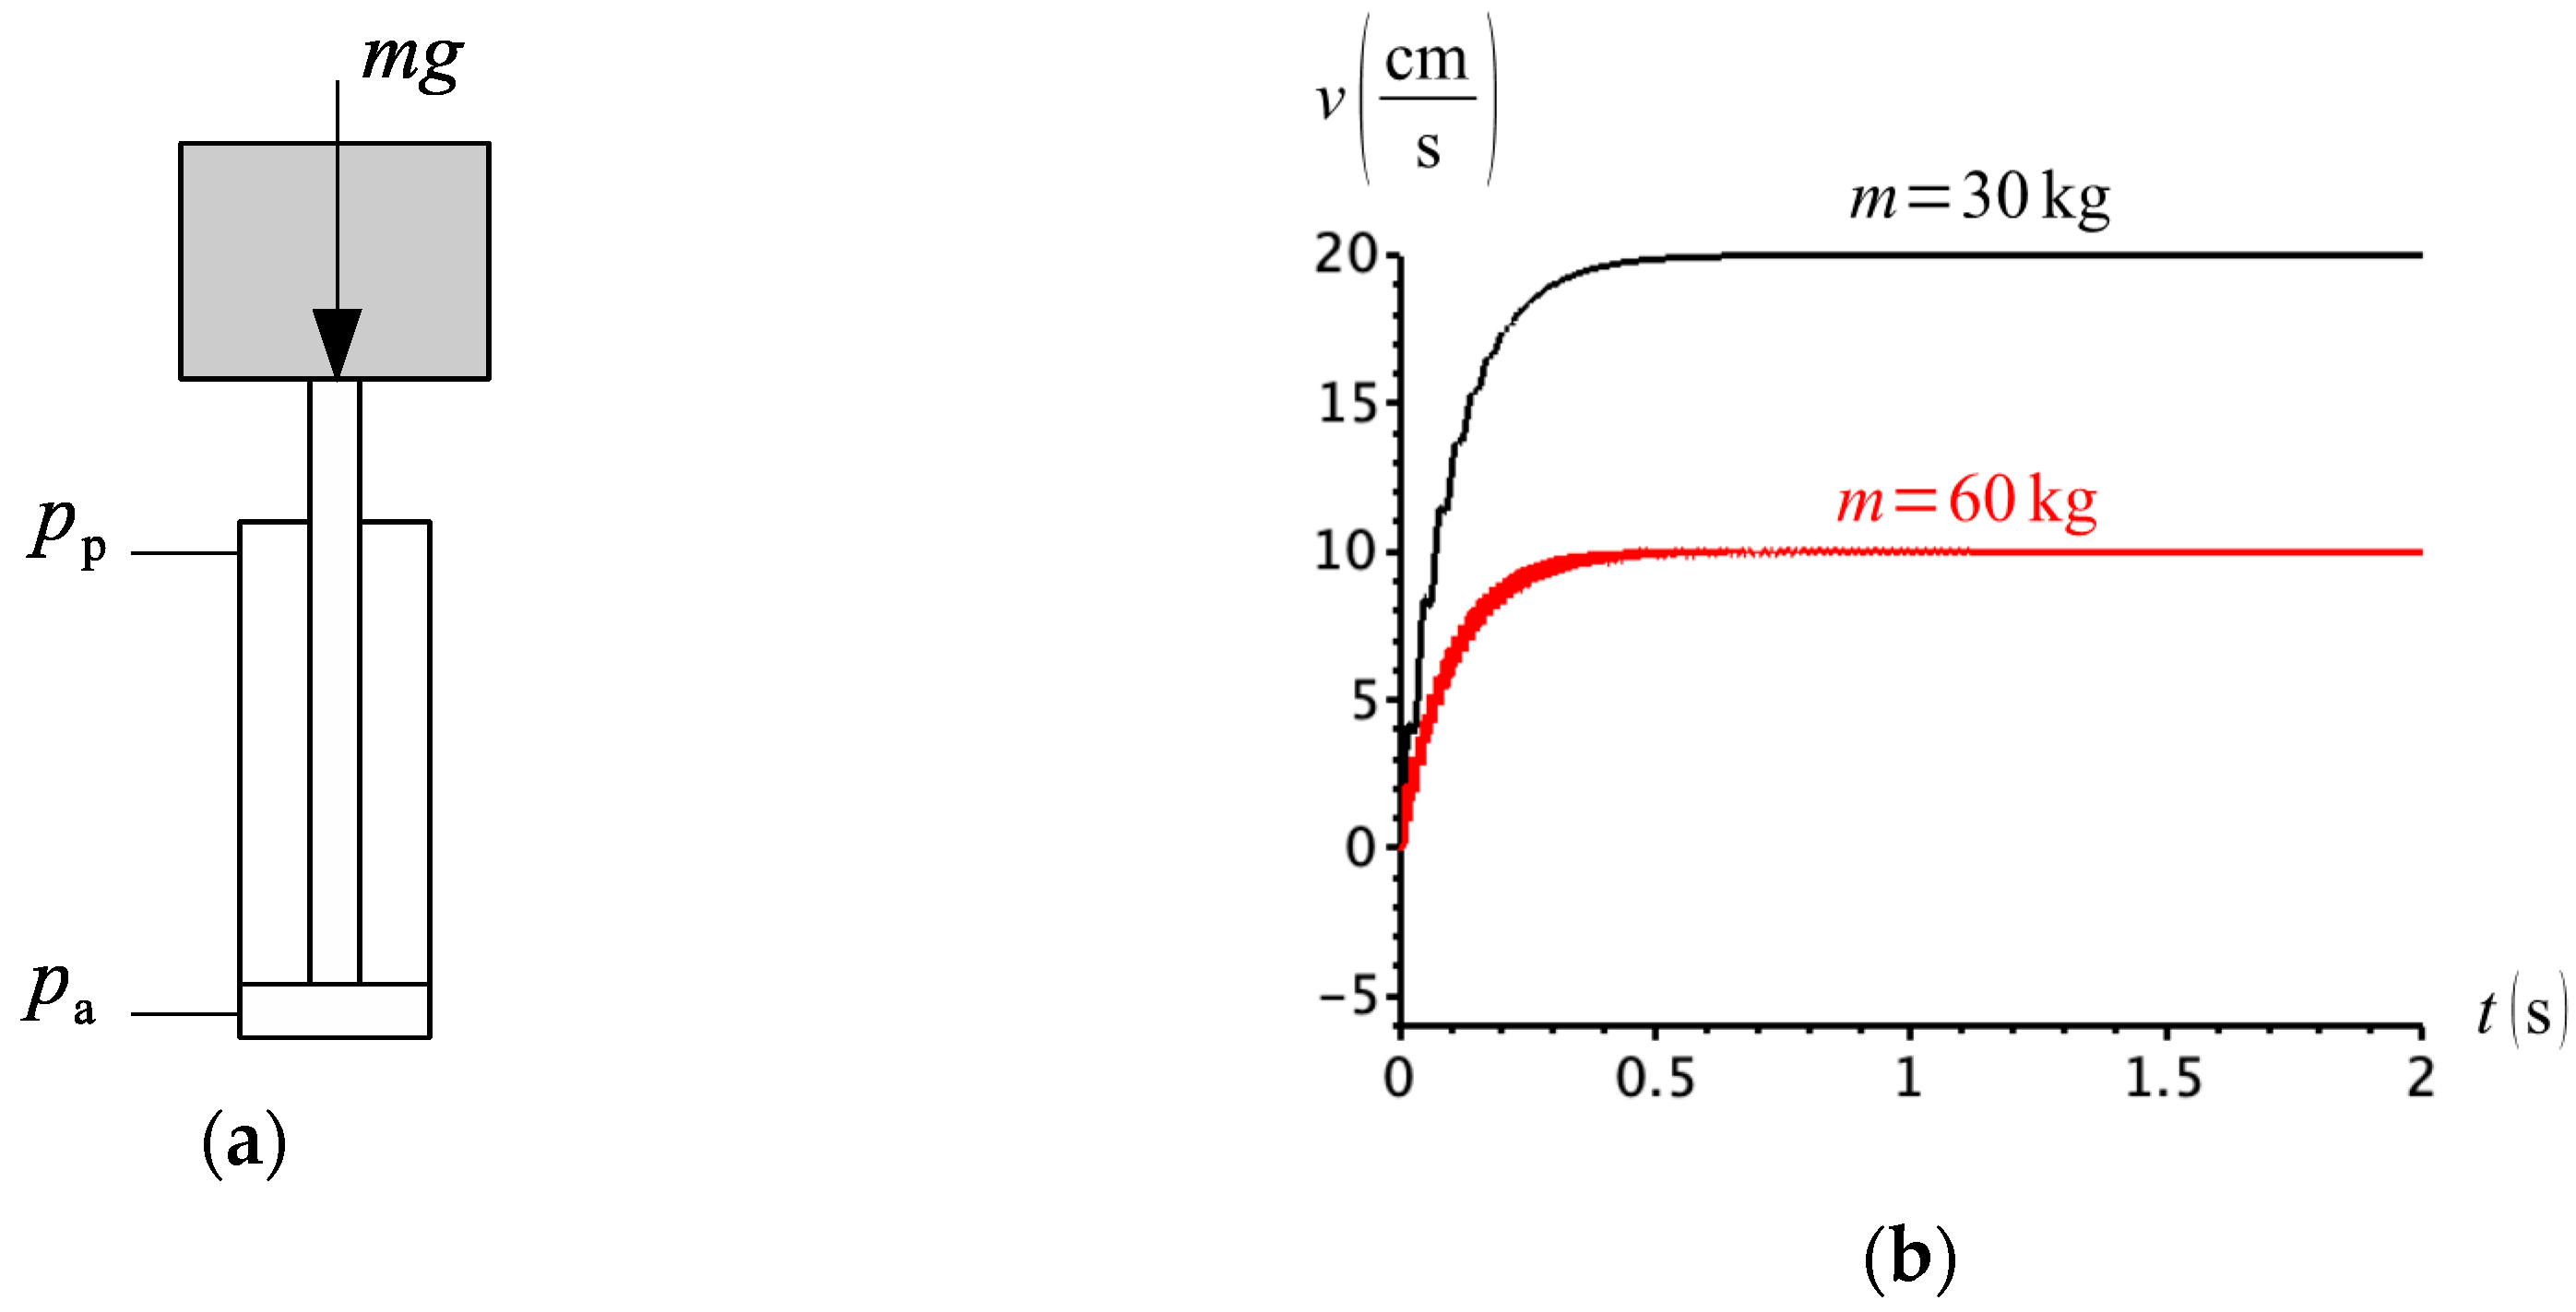
The fact that the compensation flow does not follow the net power flow sign in the actuator has serious consequences. To further demonstrate this, consider Figure 28a that shows a simple example of a cylinder lifting a weight. The intention is to control the cylinder velocity by changing the pump flow. We would, therefore, expect the cylinder to extend at for a flow . However, for different weight values, the cylinder will extend at different velocities, as shown in Figure 28b. This is simply because, depending on the rod-side pressure, valve C in Figure 20, can either communicate the cap- or the rod-side to the charge circuit.
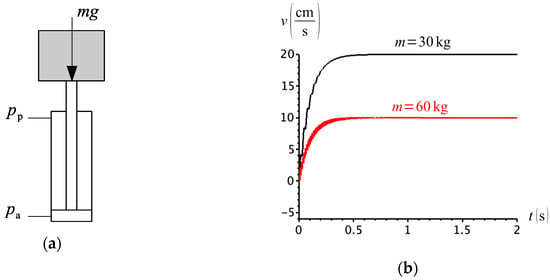
Figure 28.
(a) Actuator lifting a weight; (b) extension velocity for different load masses.
We finish this section by concluding that the circuit in Figure 24 represented the best attempt to solve the hydrostatic motion challenge in differential cylinders so far. However, as shown in Figure 25 through Figure 28, the compensation flow supply is inconsistent with the very notion of motoring and pumping. The following section presents the solution to all these problems by redefining pumping and motoring quadrants accordingly to Figure 3b and creating a consistent and definitive method of activating the compensation valve (or valves).
5. New Operational Quadrant Division and the Solution for the Compensation Flow Shifting
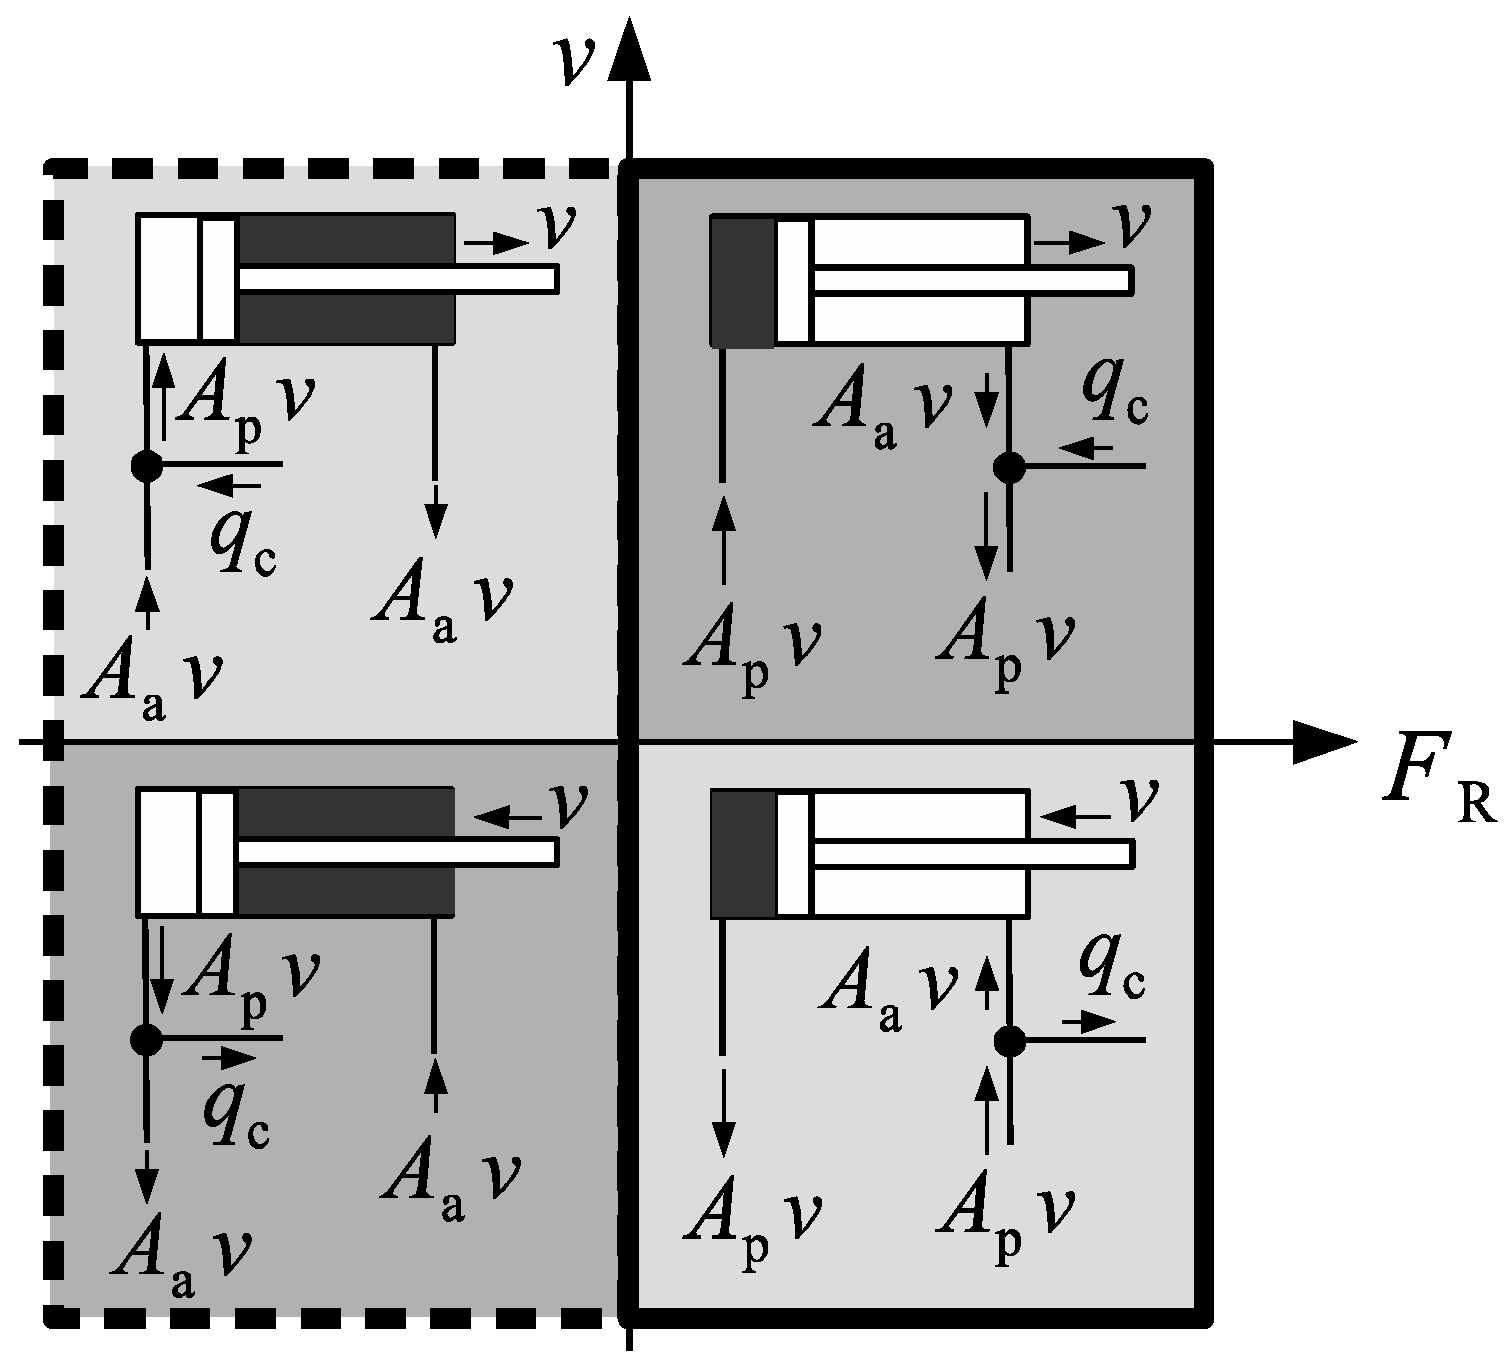
Recently, Costa and Sepehri [1,12] discussed the theoretical background for the operational quadrant division shown in Figure 3a. They argued that the quadrant diagram should be built on the power flow into and out of the cylinder, rather than the external force and the velocity. They redefined the terms “pumping” and “motoring”, usually identified with quadrants I–III and II–IV of the diagram in Figure 3a, by explaining that “pumping” is indeed the mode where the cylinder consumes power from the circuit and “motoring” is the mode where the circuit receives power from the cylinder. This led to the correct quadrant representation shown in Figure 3b with the cylinder force (or hydraulic force, as suggested in [21]), , given by Equation (5). Figure 29 shows the required circuit flow configuration given this new quadrant definition.
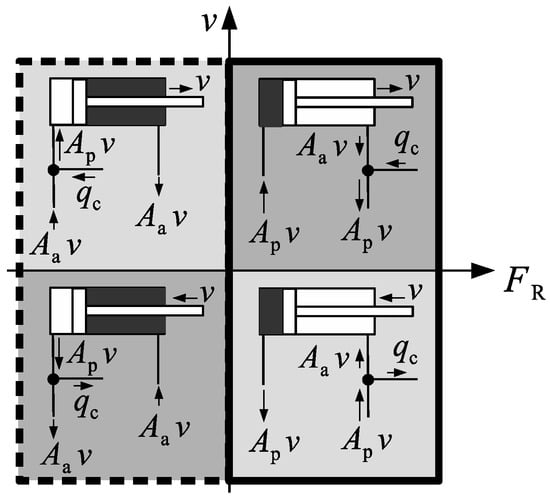
Figure 29.
Expected circuit flows at each quadrant of operation. Pumping quadrants are shown in darker grey and motoring quadrants are shown in lighter grey.
It can be shown [1] that the product represents the hydraulic power into the cylinder ( or into the circuit (. Thus, the sign of uniquely defines the quadrants where energy is transferred from the circuit into the cylinder (pumping quadrants) and the quadrants where energy is transferred from the cylinder into the circuit (motoring quadrants). The compensation flow direction is, therefore, precisely set as in Figure 29, with no critical regions between quadrants.
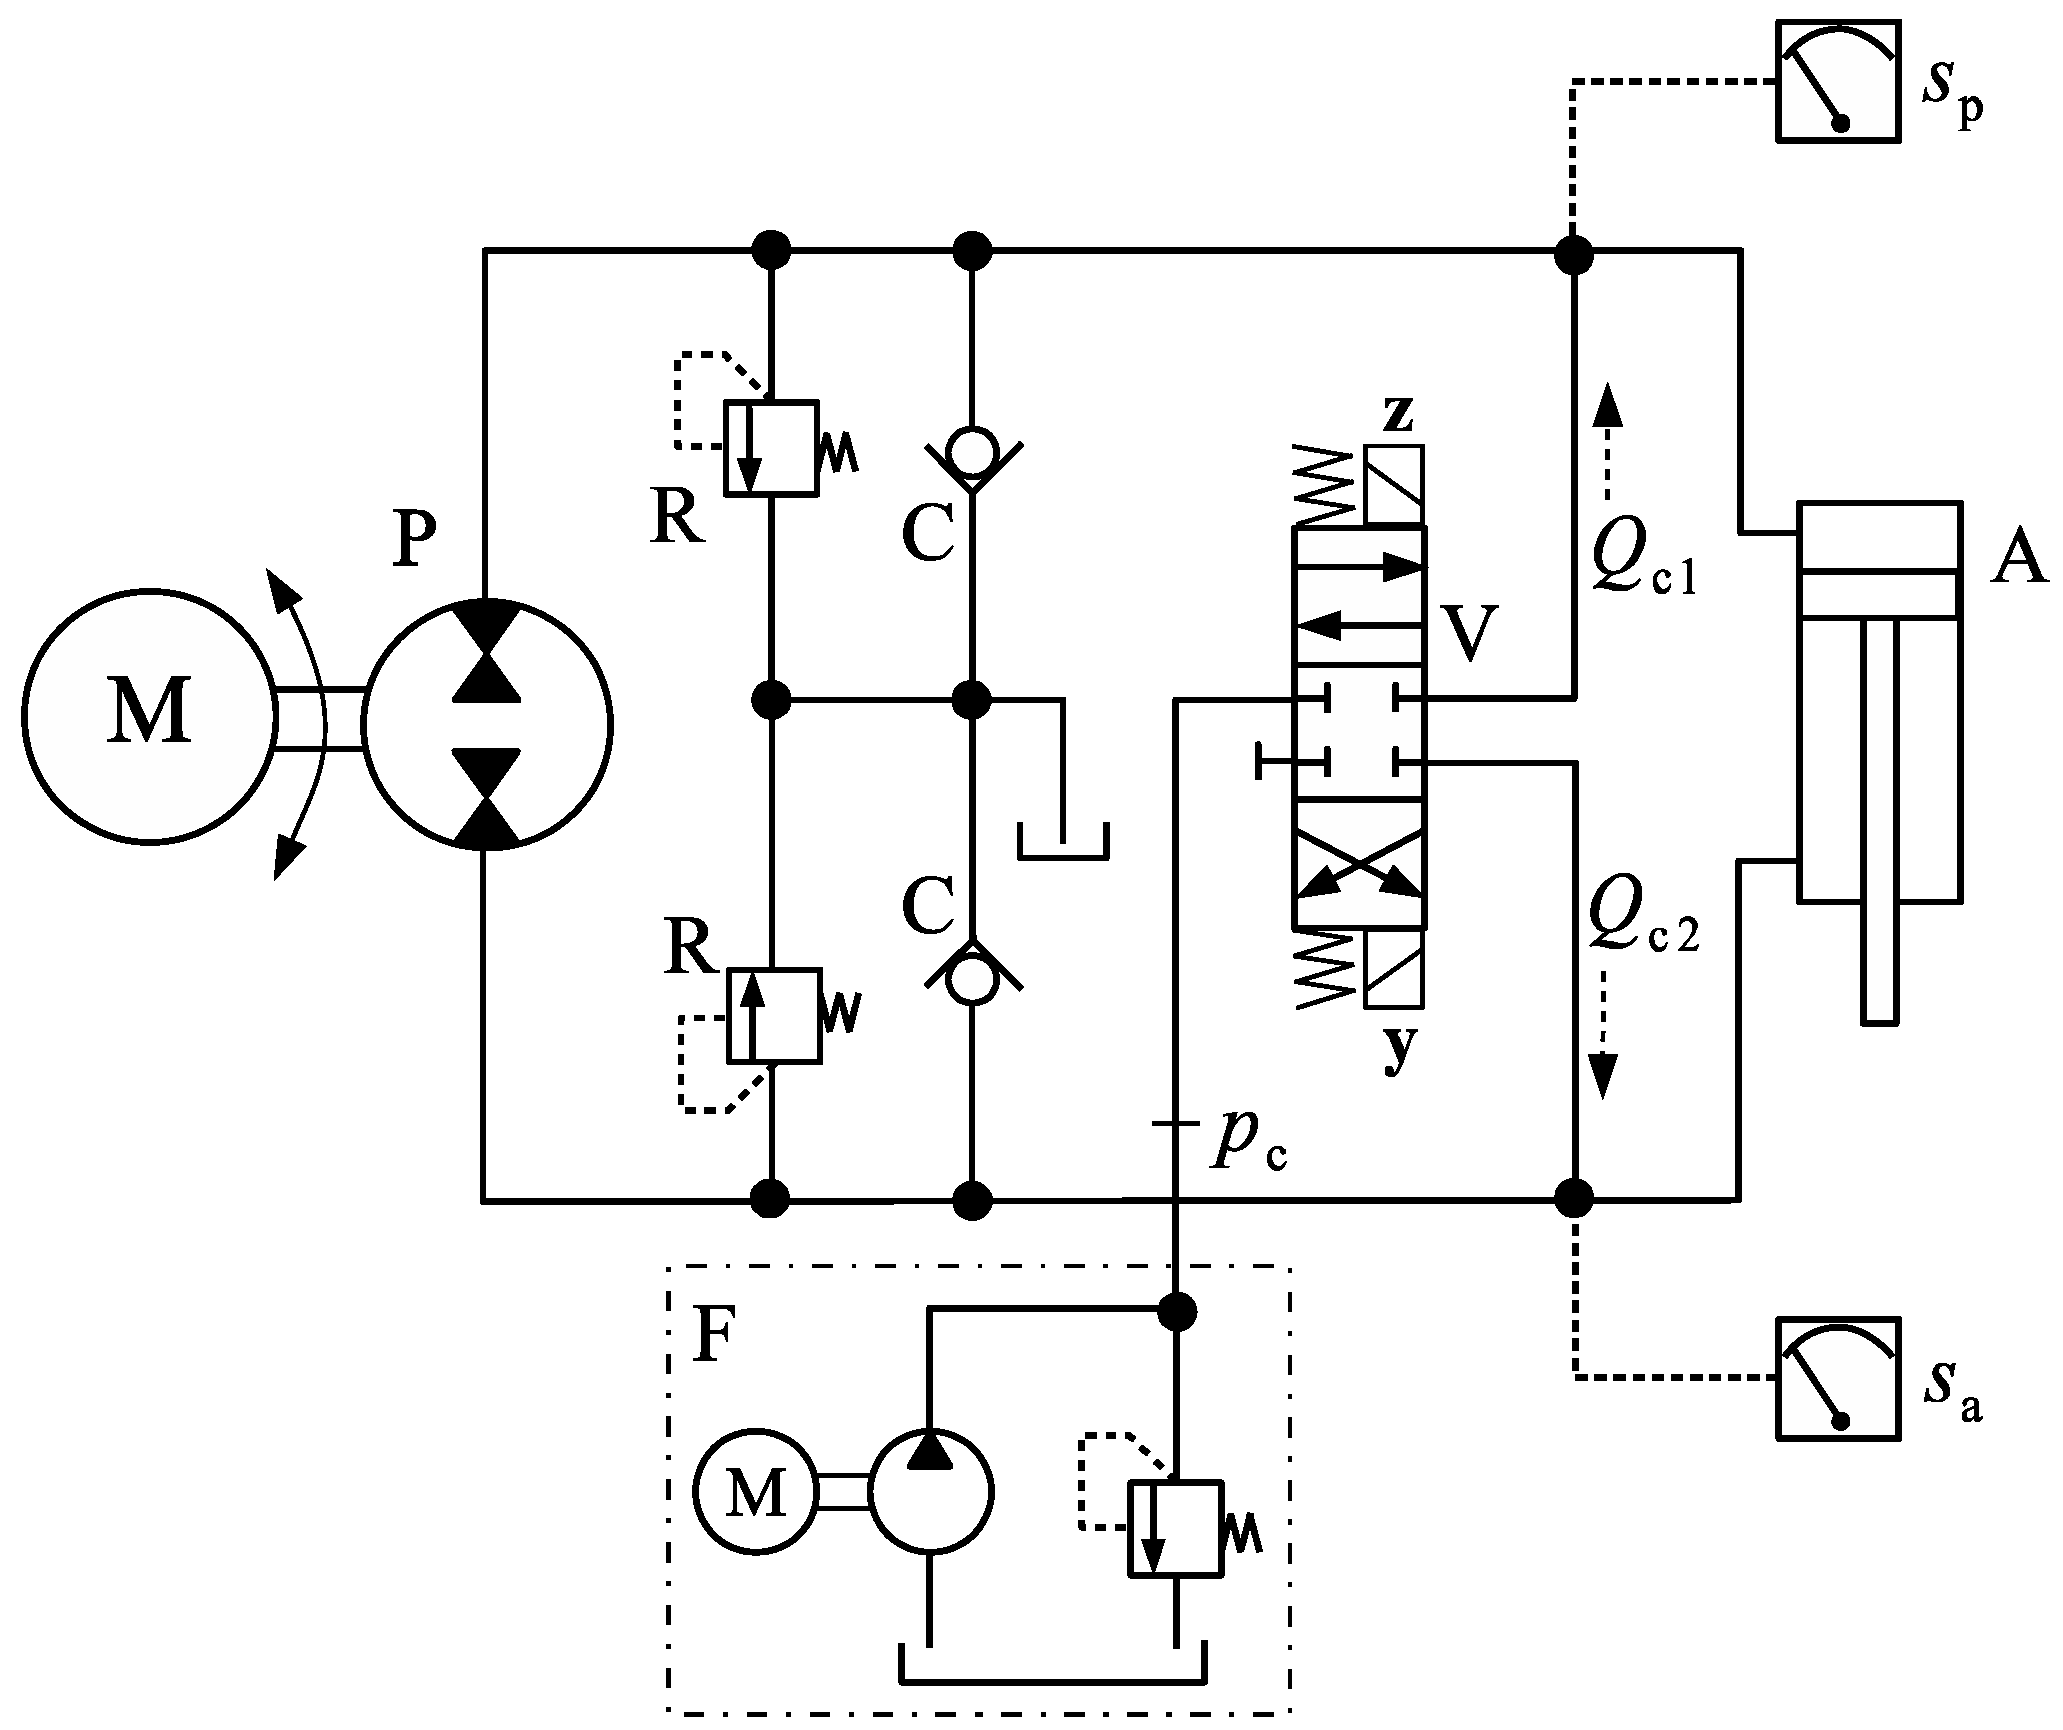
The shift between compensation flow connections in Figure 29, must be of an on-off kind. This led to the circuit shown in Figure 30, where the solenoids y and z are activated by the following logical equations:
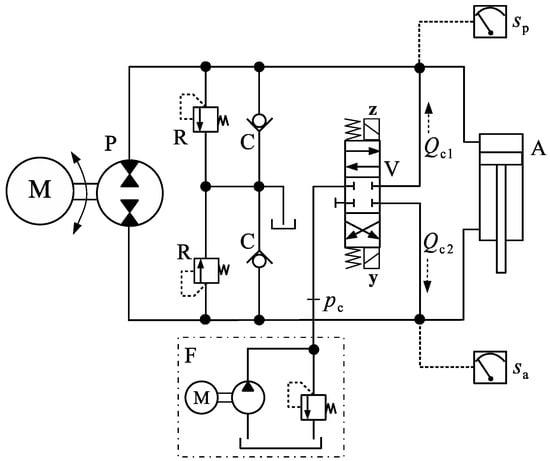
Figure 30.
Circuit with logic-controlled flow compensation.
Note that there is a discontinuity at (, where the connection to the charge circuit is undefined. Of particular importance is the situation when the cylinder is completely unloaded at the beginning of the motion. In such case, , and it is reasonable to close the connection between the charge circuit and both sides of the cylinder. This is done by the closed-centre valve, V. As soon as there is a flow in the circuit, a pressure differential will build up and one of the two inequalities in (30) will automatically be satisfied. For all other situations, the transition between and happens so fast that valve V practically only takes one of the two possible states indicated by inequalities (30). However, high frequency shifting can occur, especially in the numerical simulations, when the values of and are very close to one another.
With reference to Figure 30, as soon as the cylinder starts moving, two pressure sensors, and send the pressure values to an external controller, which activates coils y and z of the directional valve, V, accordingly to the logical equations (30). Two anti-cavitation check valves, C, and two relief valves, R, connect both sides of the circuit to the tank for safety. An external compensation circuit, F, is connected to the compensation valve V.
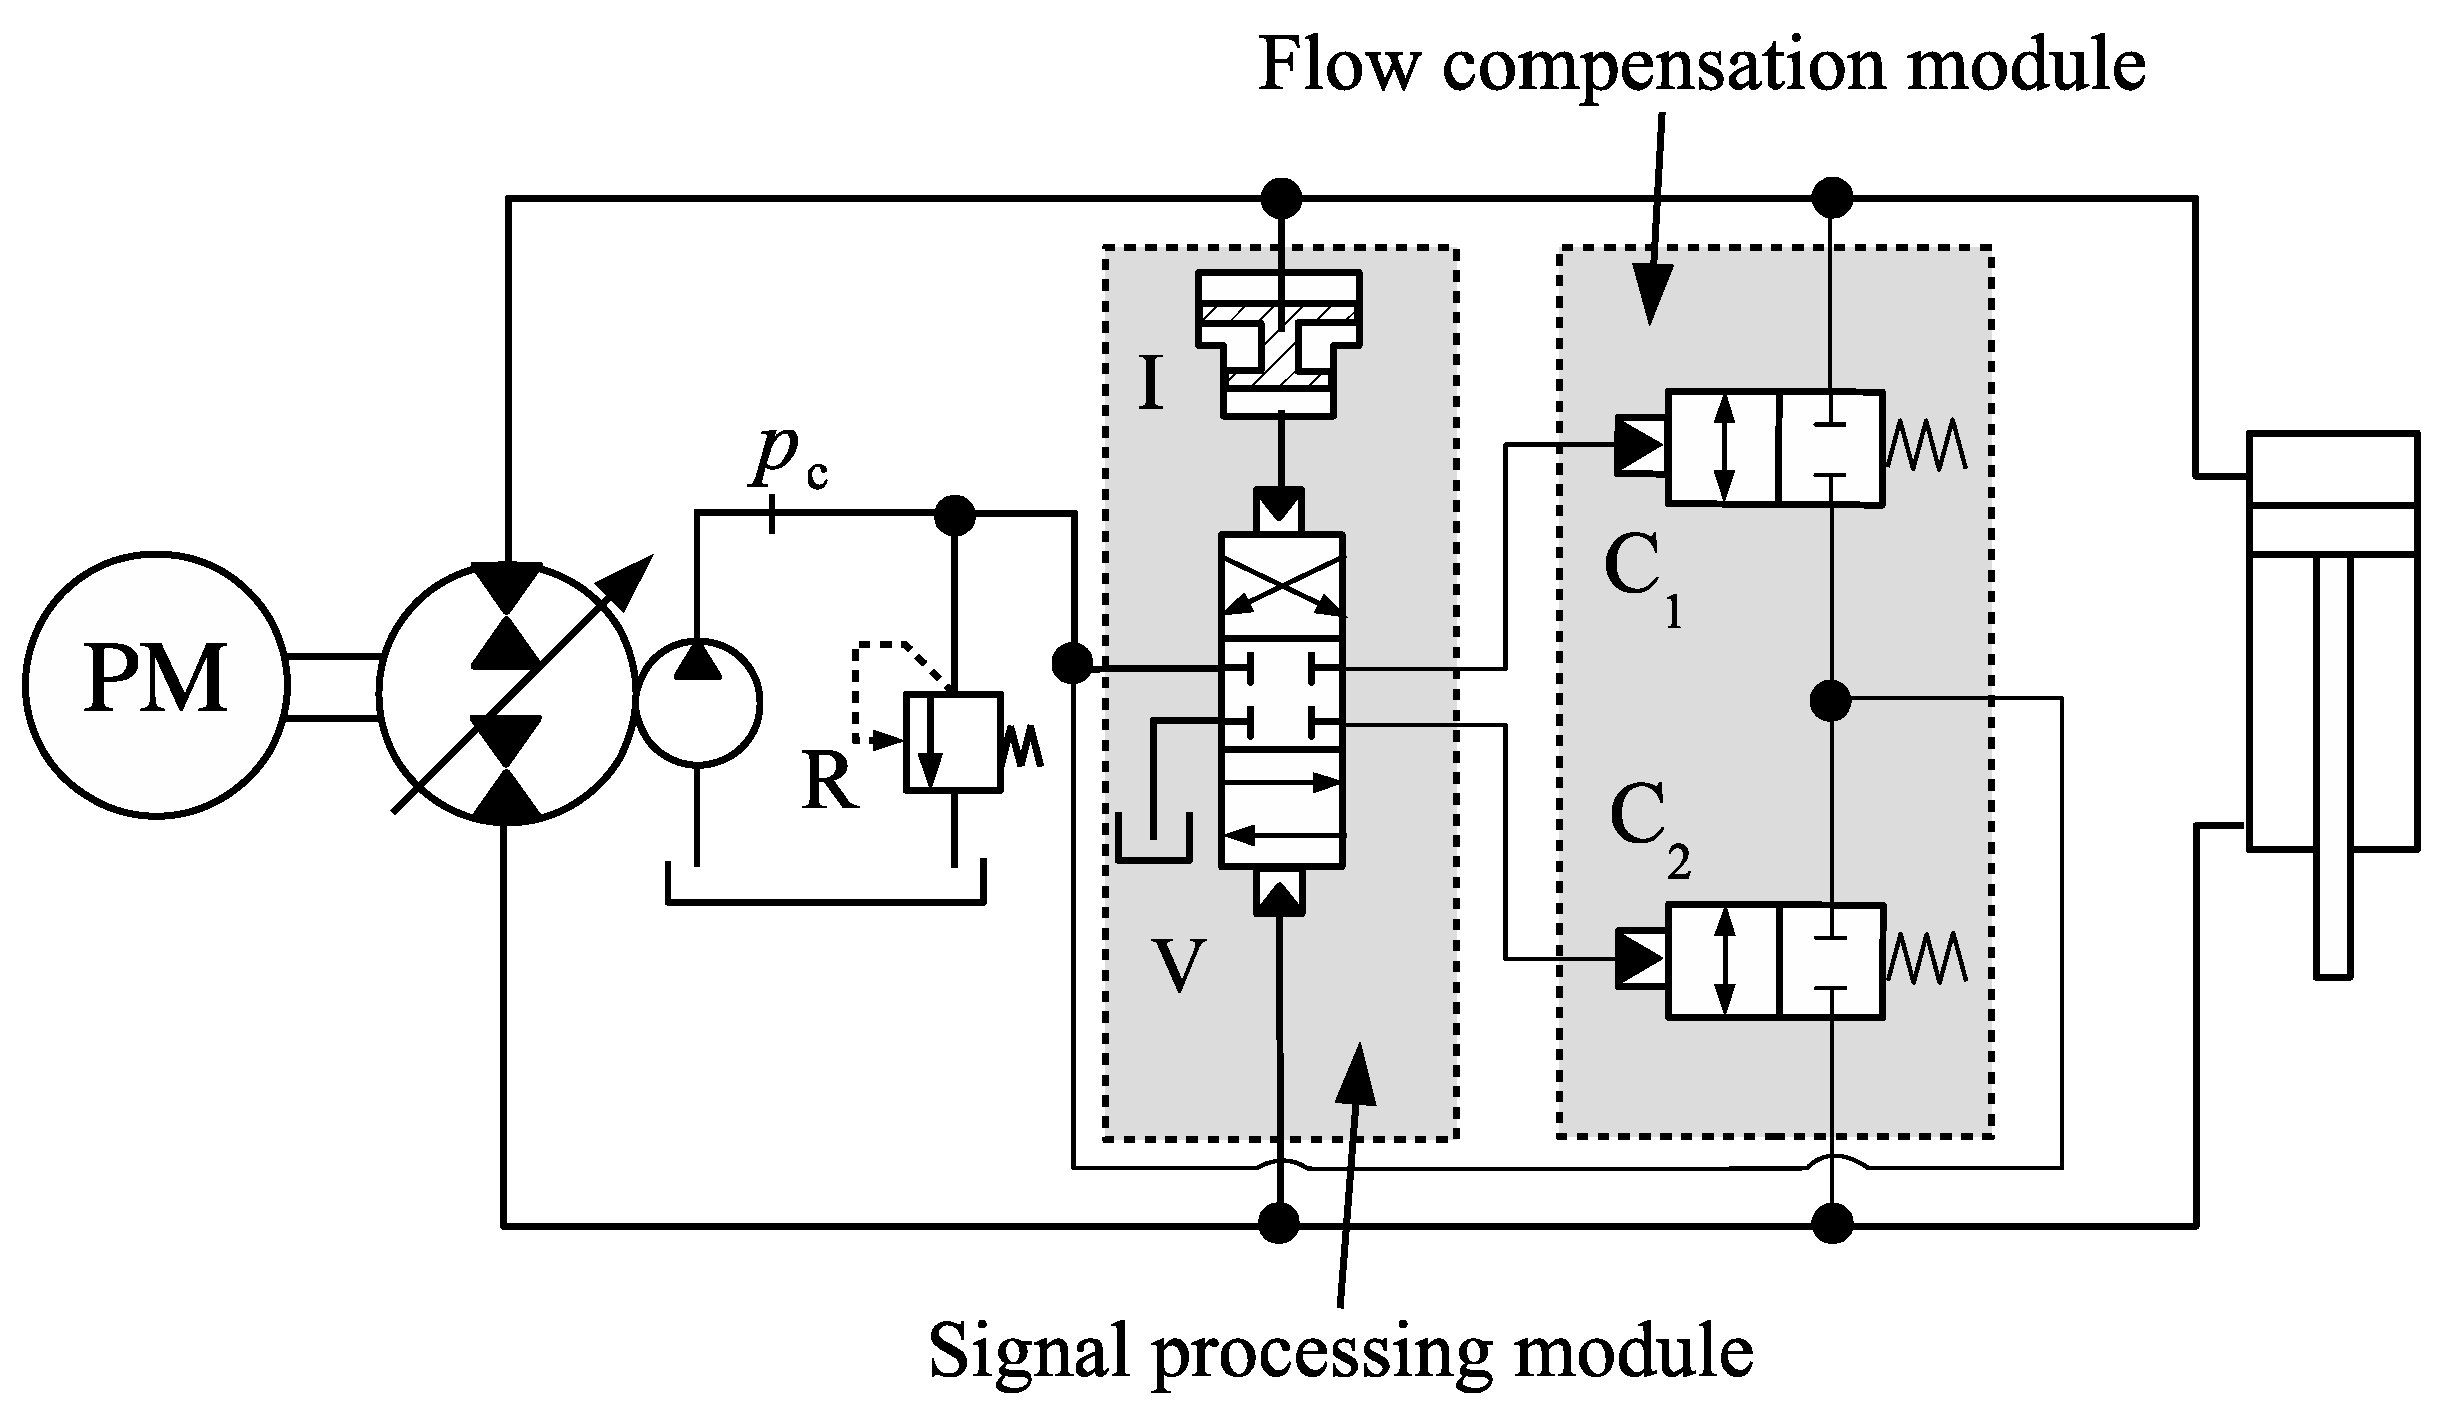
The circuit proposed in Figure 30 is not the only layout for this new actuator. A complete hydraulic layout solution is also possible [12]. This is shown in Figure 31, where we see one hydraulic amplifier, I, the gain of which is , two compensation valves C1 and C2 and a signal processing valve V. These valves comprise two distinct modules: a flow compensation module and a signal processing module. The modules operate independently, in such a way that one can design a very small signal processing module, while the compensation valves are chosen according to the cylinder size.
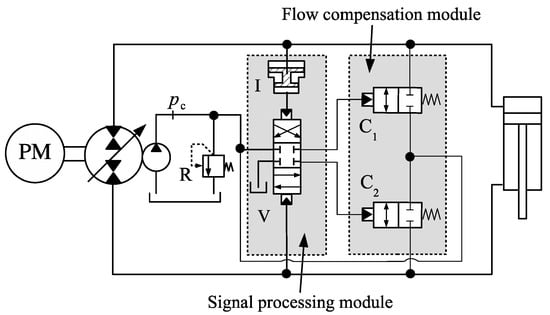
Figure 31.
Circuit with logic-controlled flow compensation using hydraulic hardware.
Let us now proceed with the numerical simulations of the circuit in Figure 30. In all that follows, we used a charge pressure and a valve coefficient . The compensation flow, , is generically given by the orifice equation
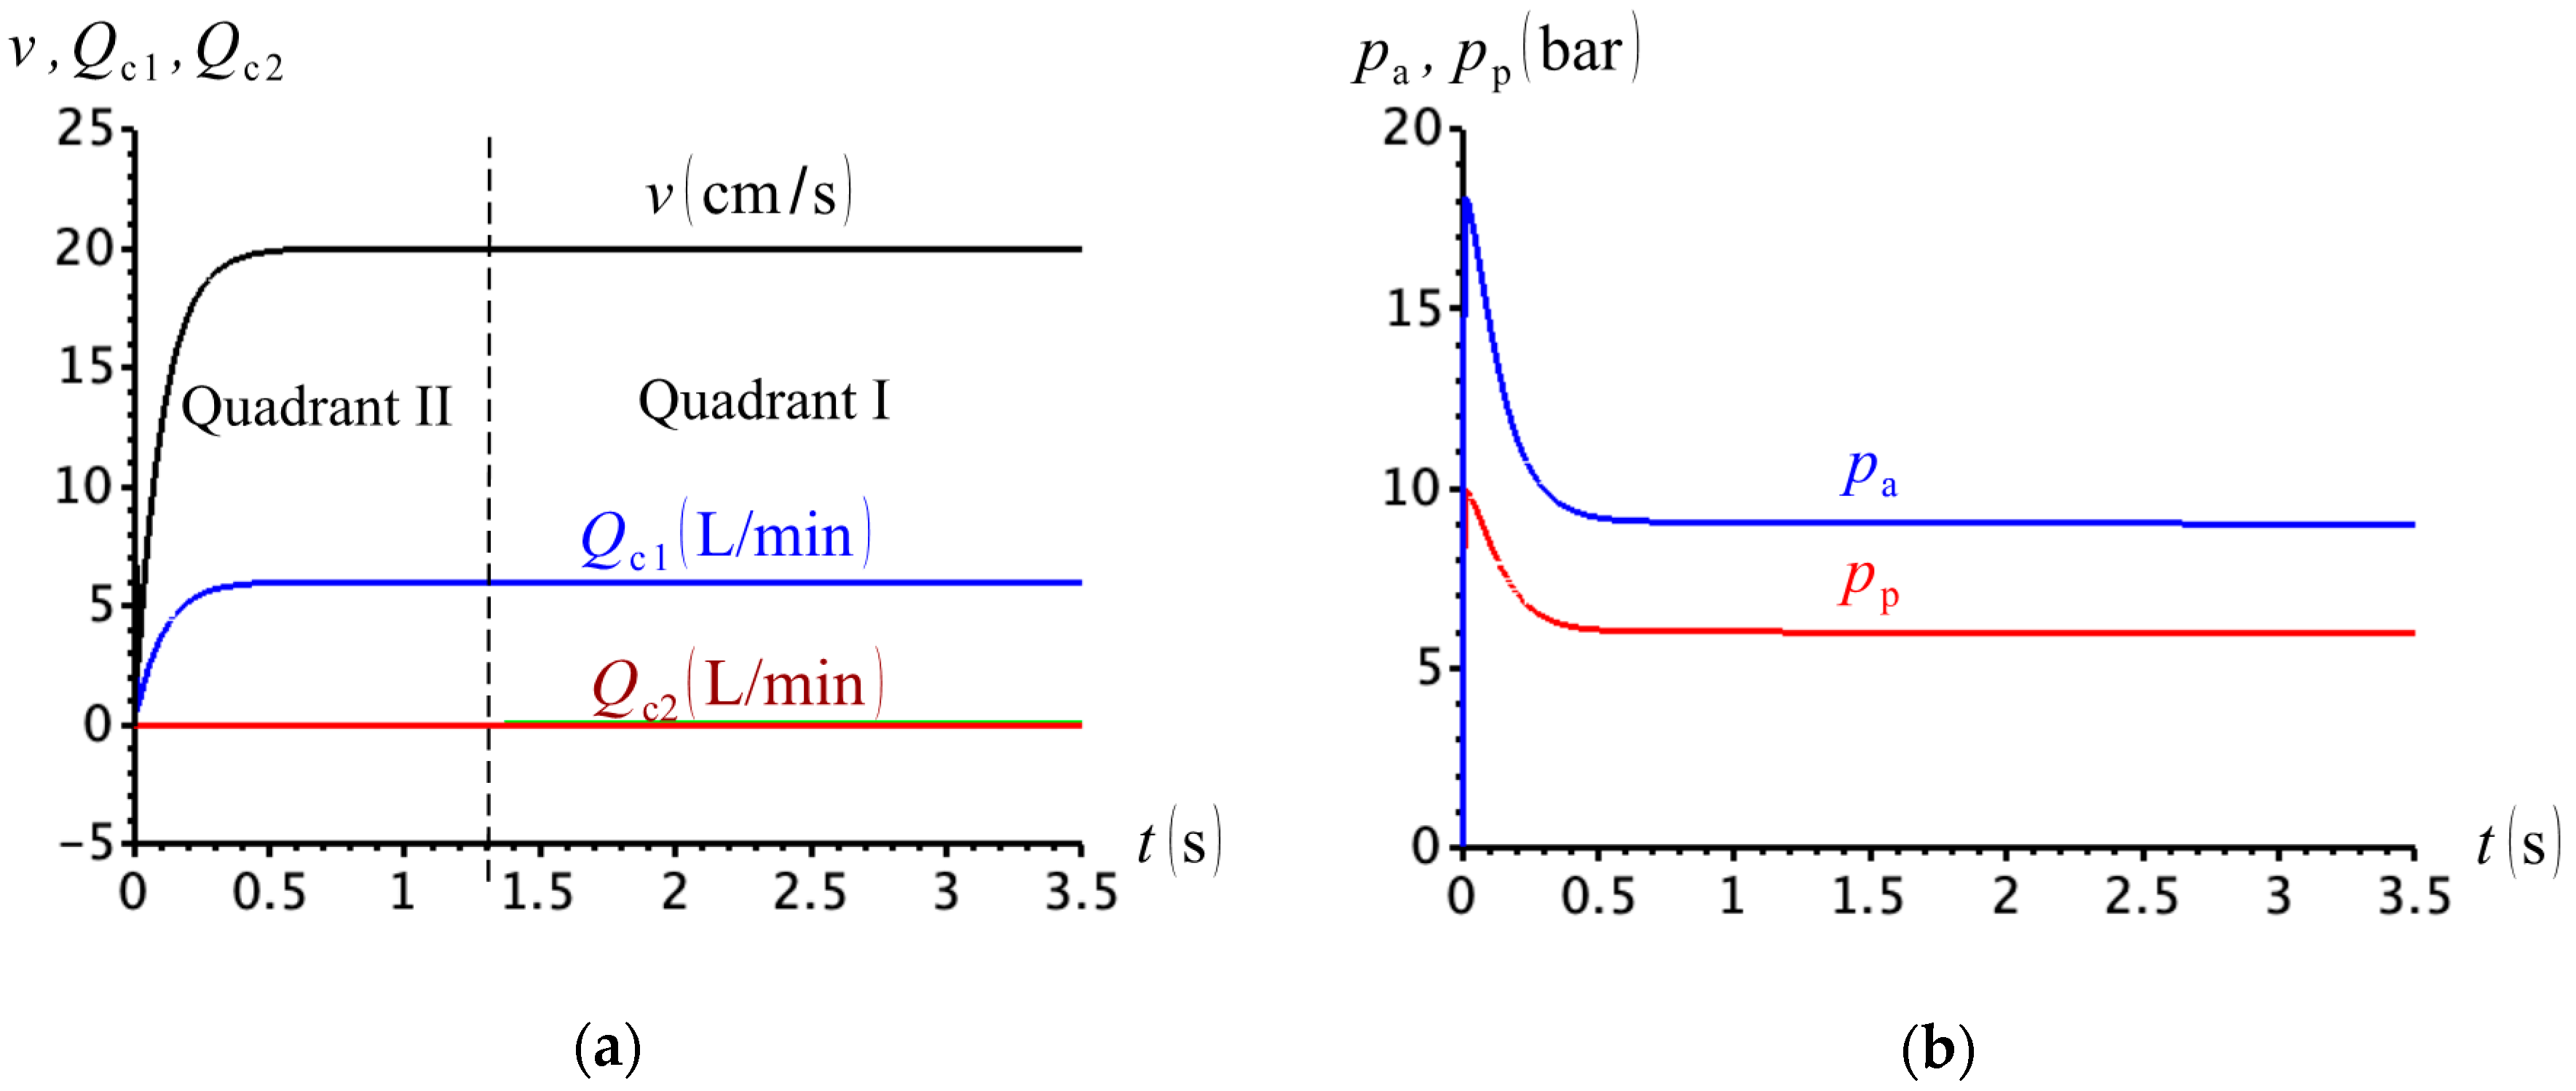
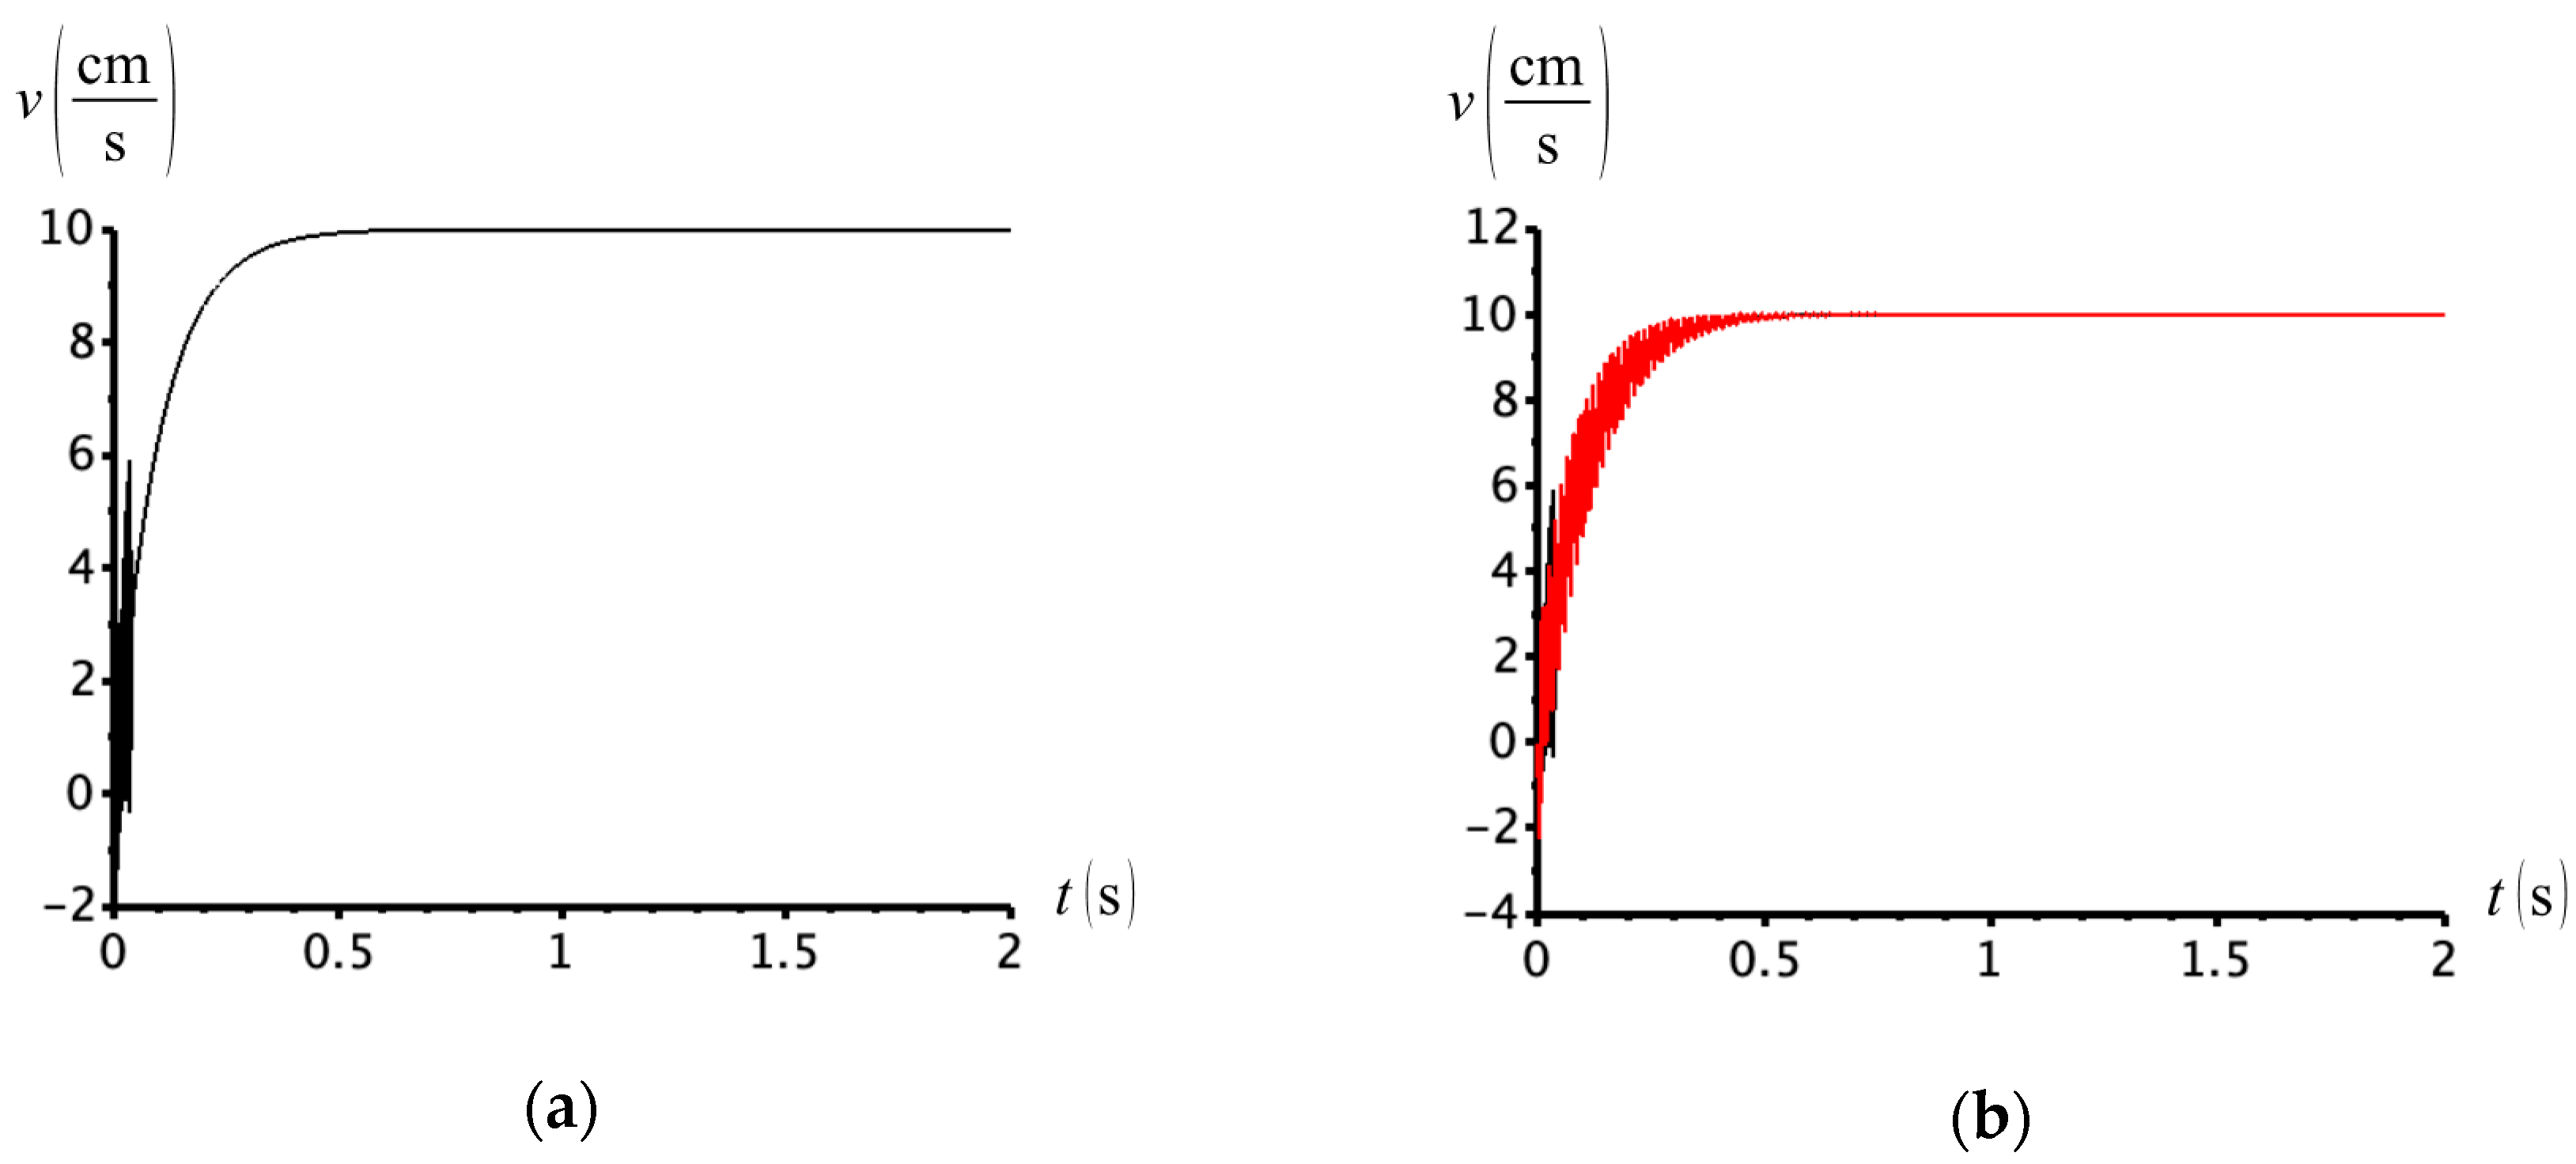
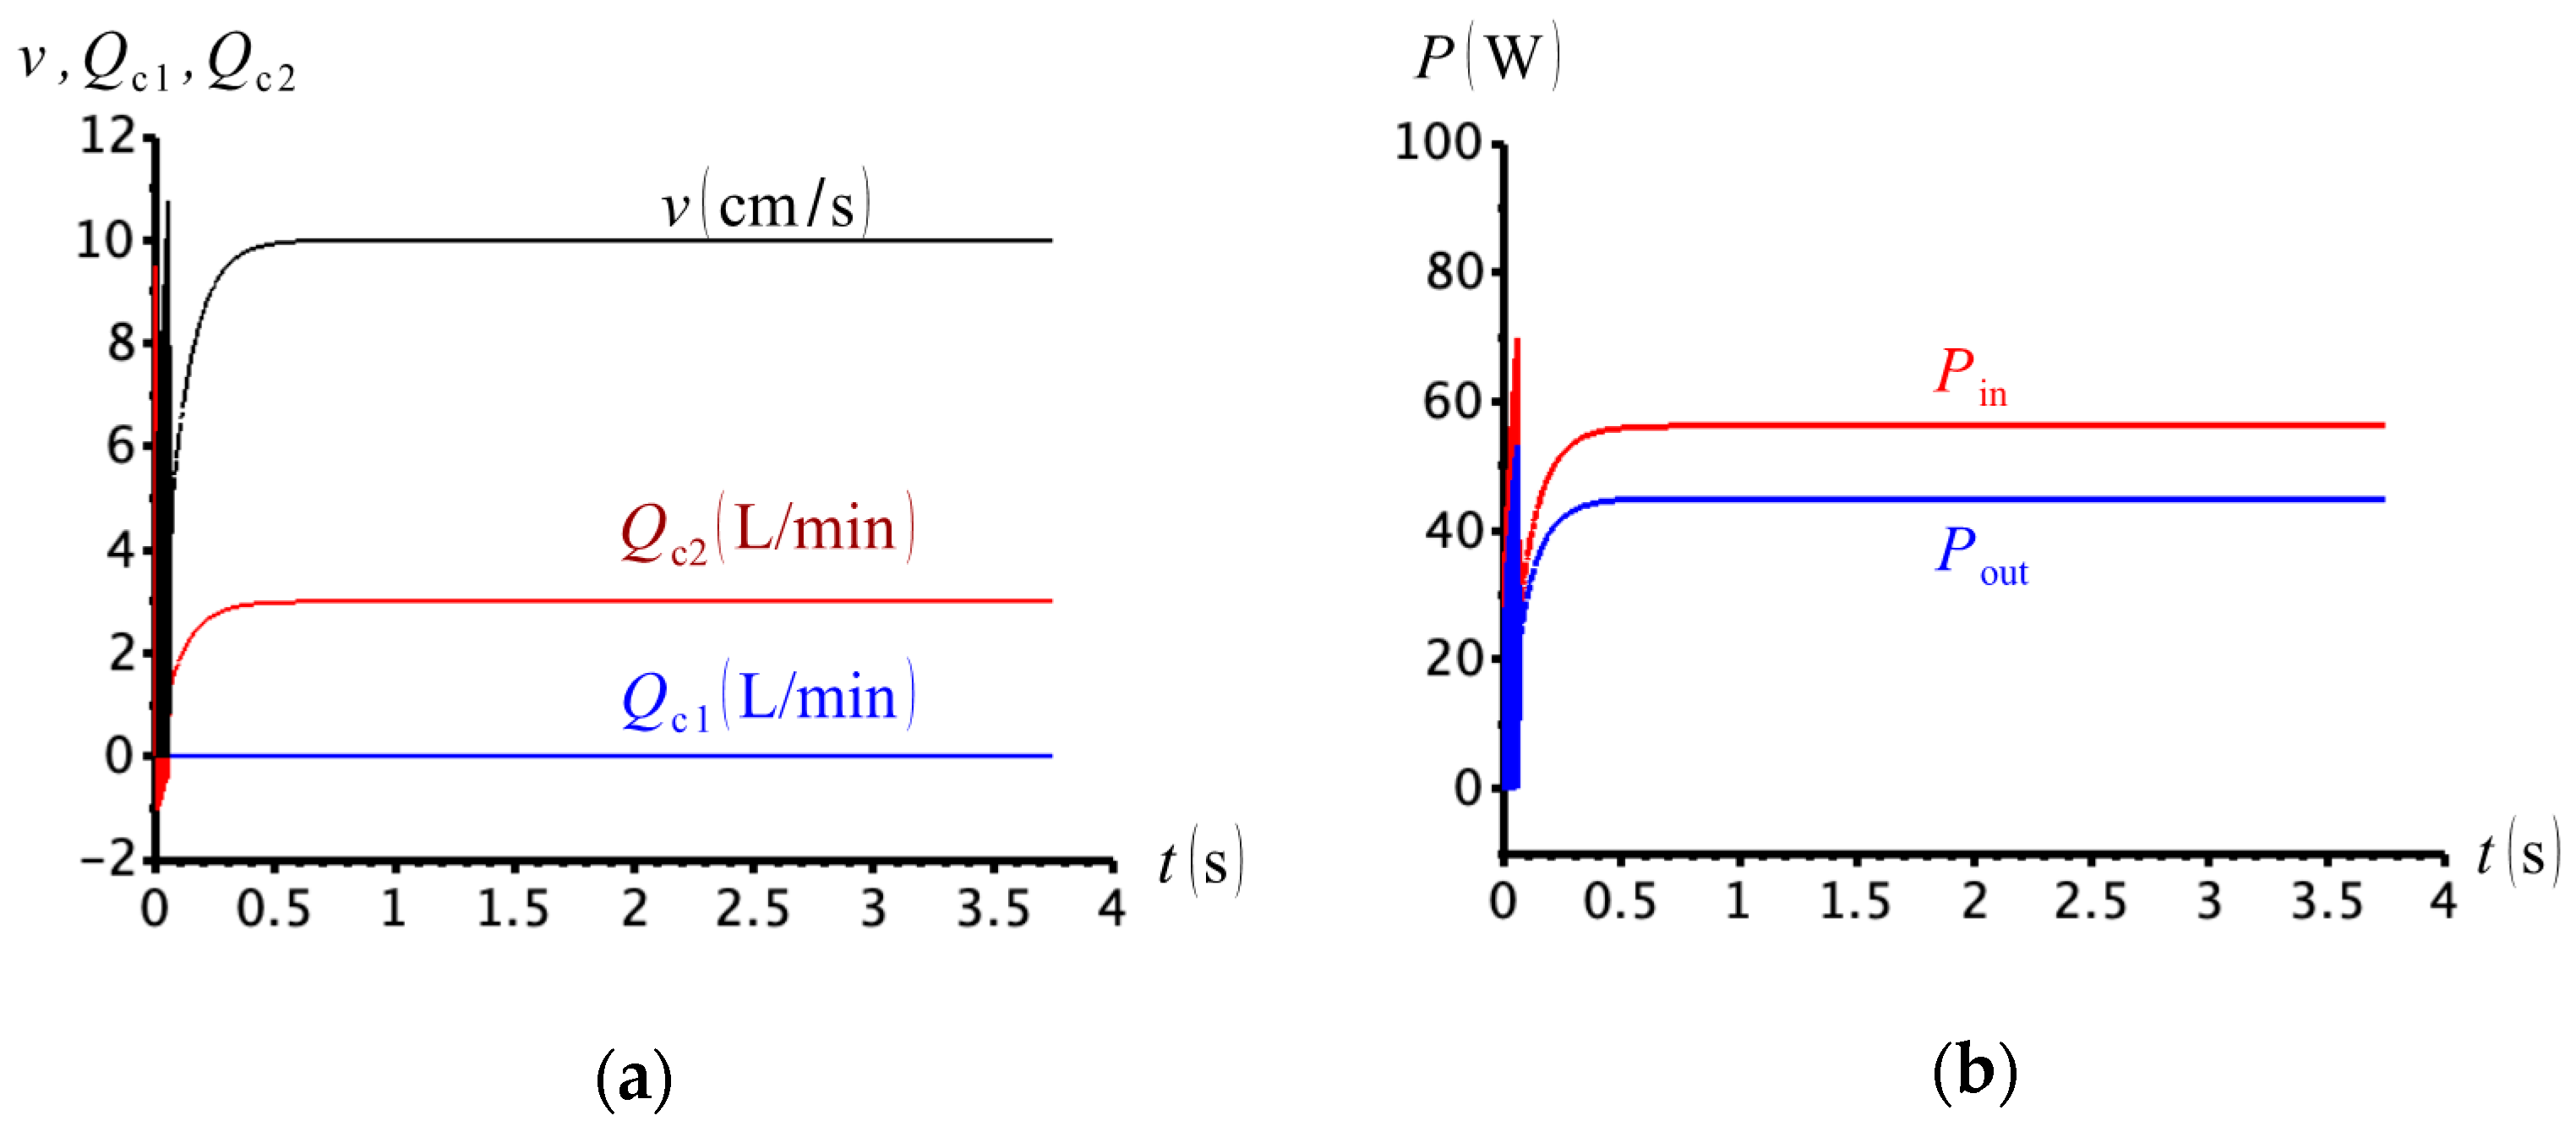
We begin our simulations with the problem shown in Figure 28a. Here, we consider the cases where and . In both situations, the cylinder extended against the weight at the expected velocity (), meaning that the rod-side is connected to the charge circuit and the pump is responsible for driving the weight. Note the precision in which the compensation valve responds to the cylinder force, even for the load as small as 0.1 kg in Figure 32a. The dependence of the cylinder velocity on the external force is, thus, completely removed.
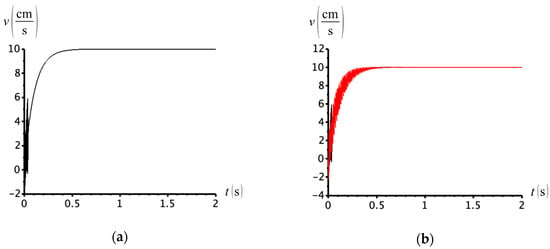
Figure 32.
Cylinder velocity for (a) and (b) .
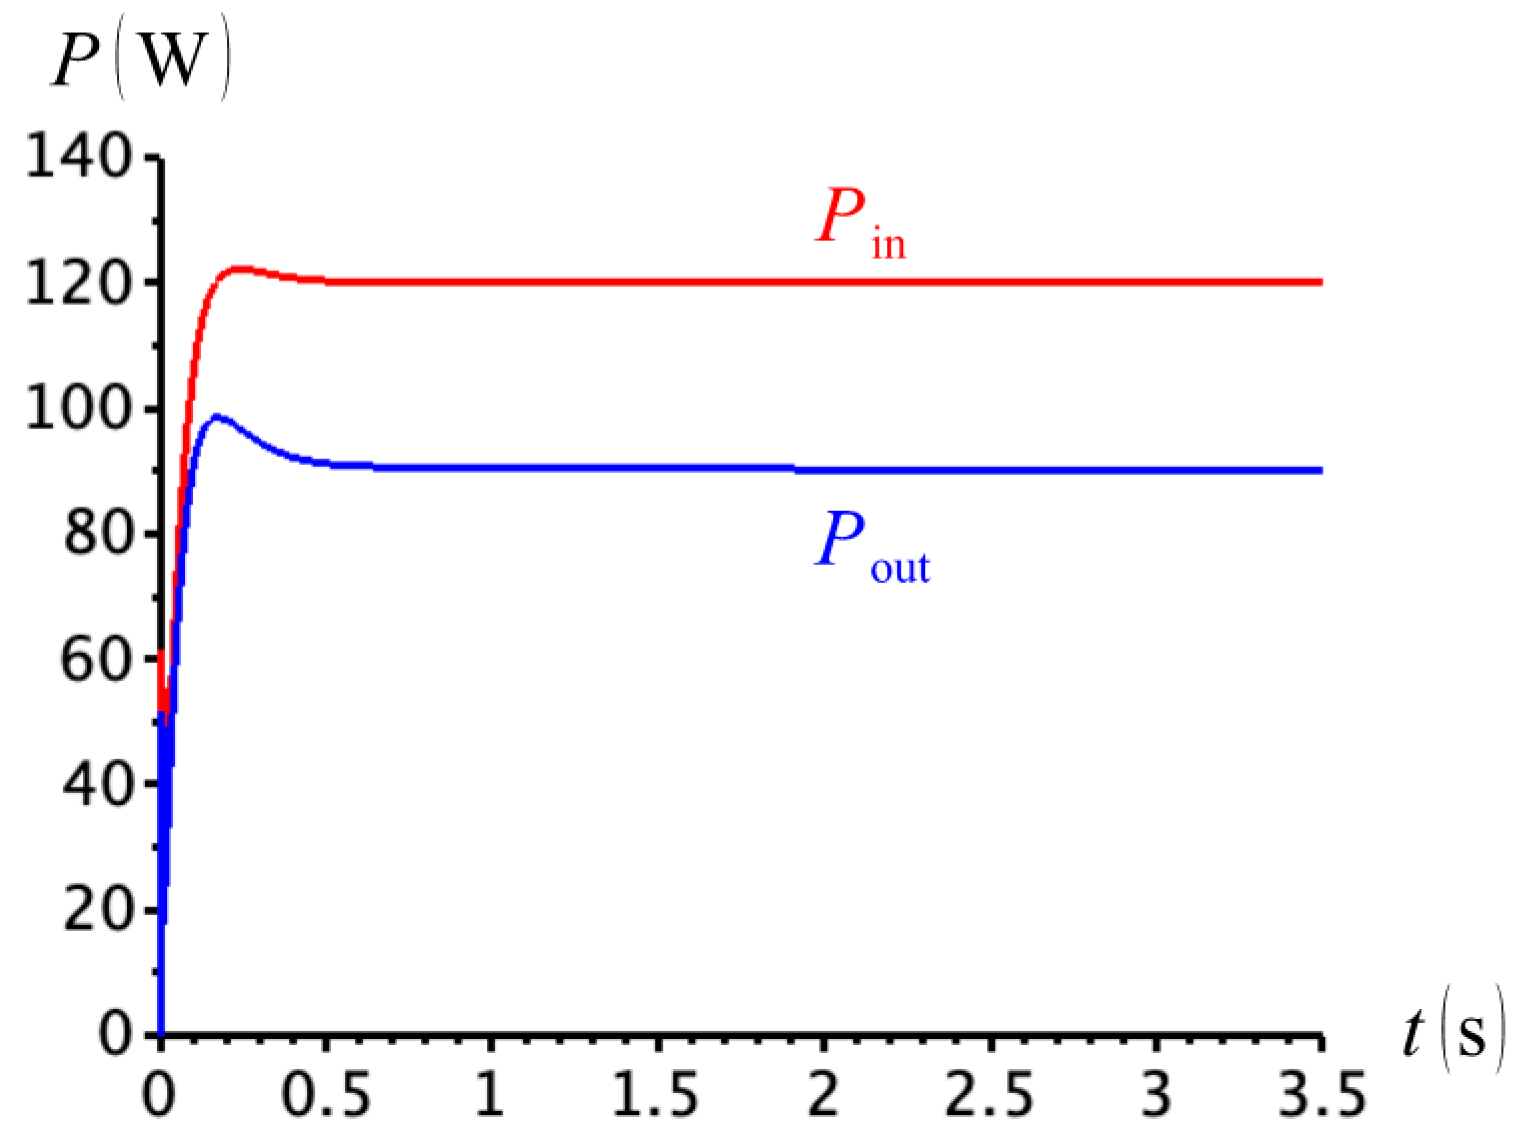
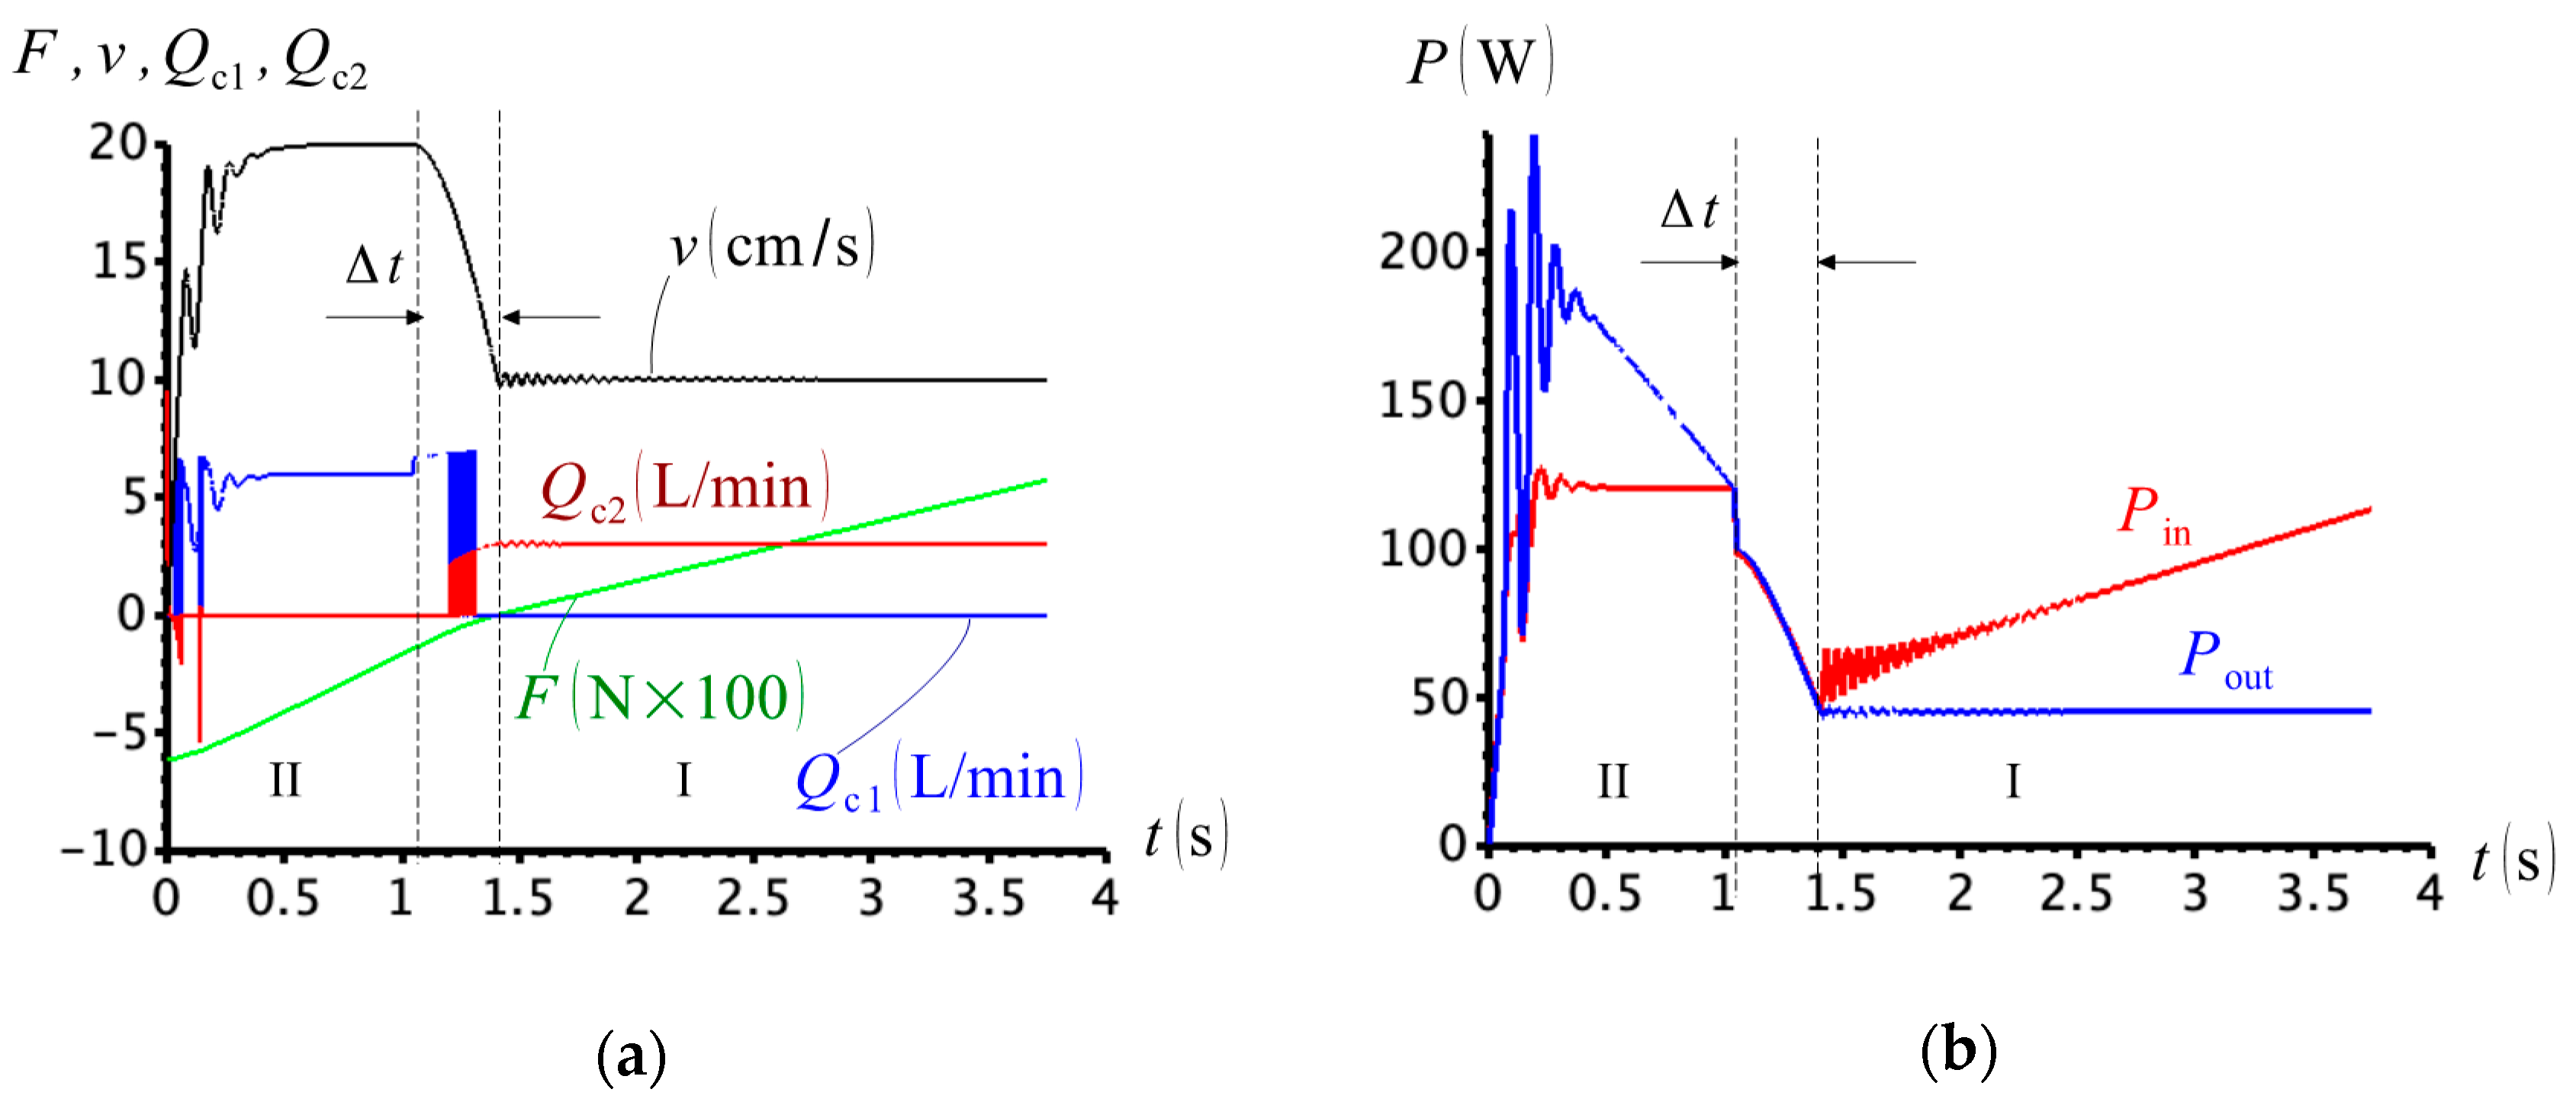
For the simulation in two quadrants (Figure 4), we considered the cases where and . Figure 33 shows the results for . The quadrant division is now based on the power flow, according to Figure 33b. We observe that the circuit operates in the first quadrant throughout , as expected, given that the weight at the pendulum is not sufficient to overcome friction and drive the pump.
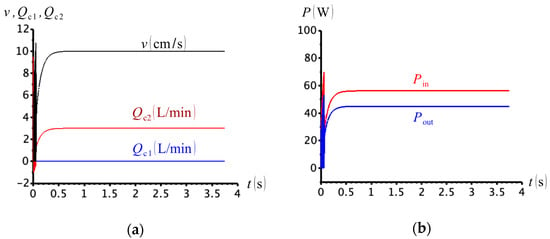
Figure 33.
(a) Cylinder velocity and compensation flows; (b) input and output powers ().
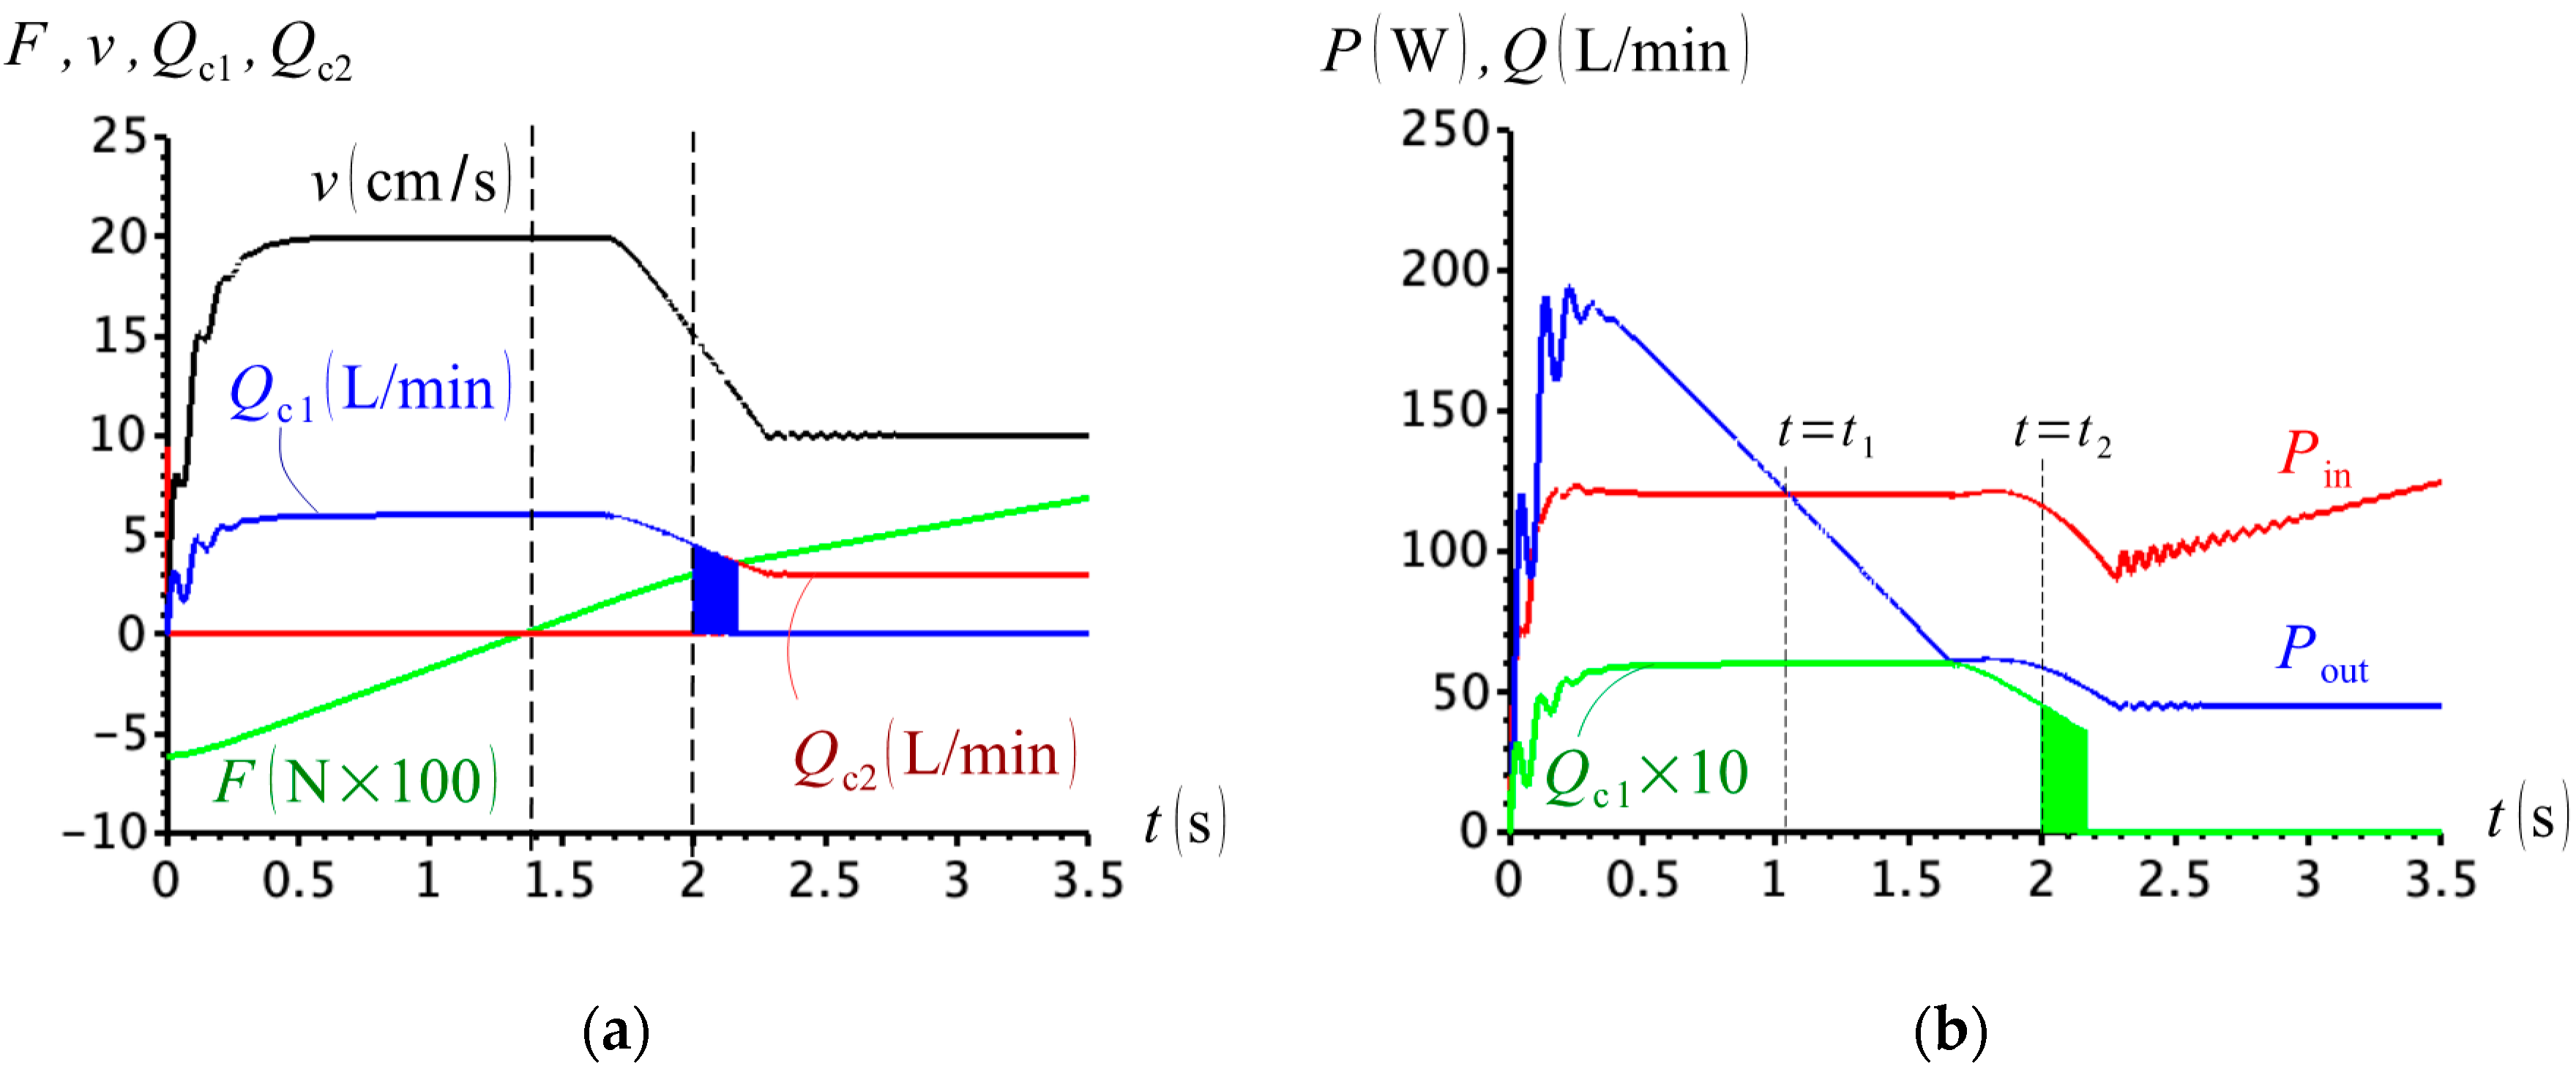
The results for are shown in Figure 34. We observe that compensation flows change as expected. There is a small region, , however, where the differential is extremely small, which produces a high-frequency shift in the cap- and rod-side connection to the charge circuit. This situation is inevitable, due to the on-off nature of the shifting algorithm and must be addressed separately [1,21,22]. Nevertheless, as was the focus of this research, the problem of compensation flow redirection is now addressed in this paper.
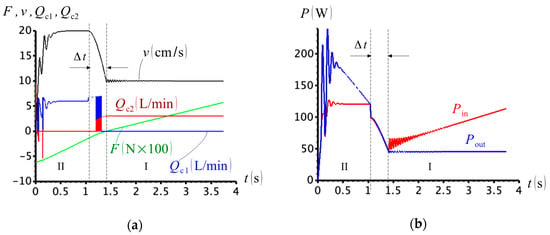
Figure 34.
(a) External force, cylinder velocity and check valve flows; (b) input and output powers .
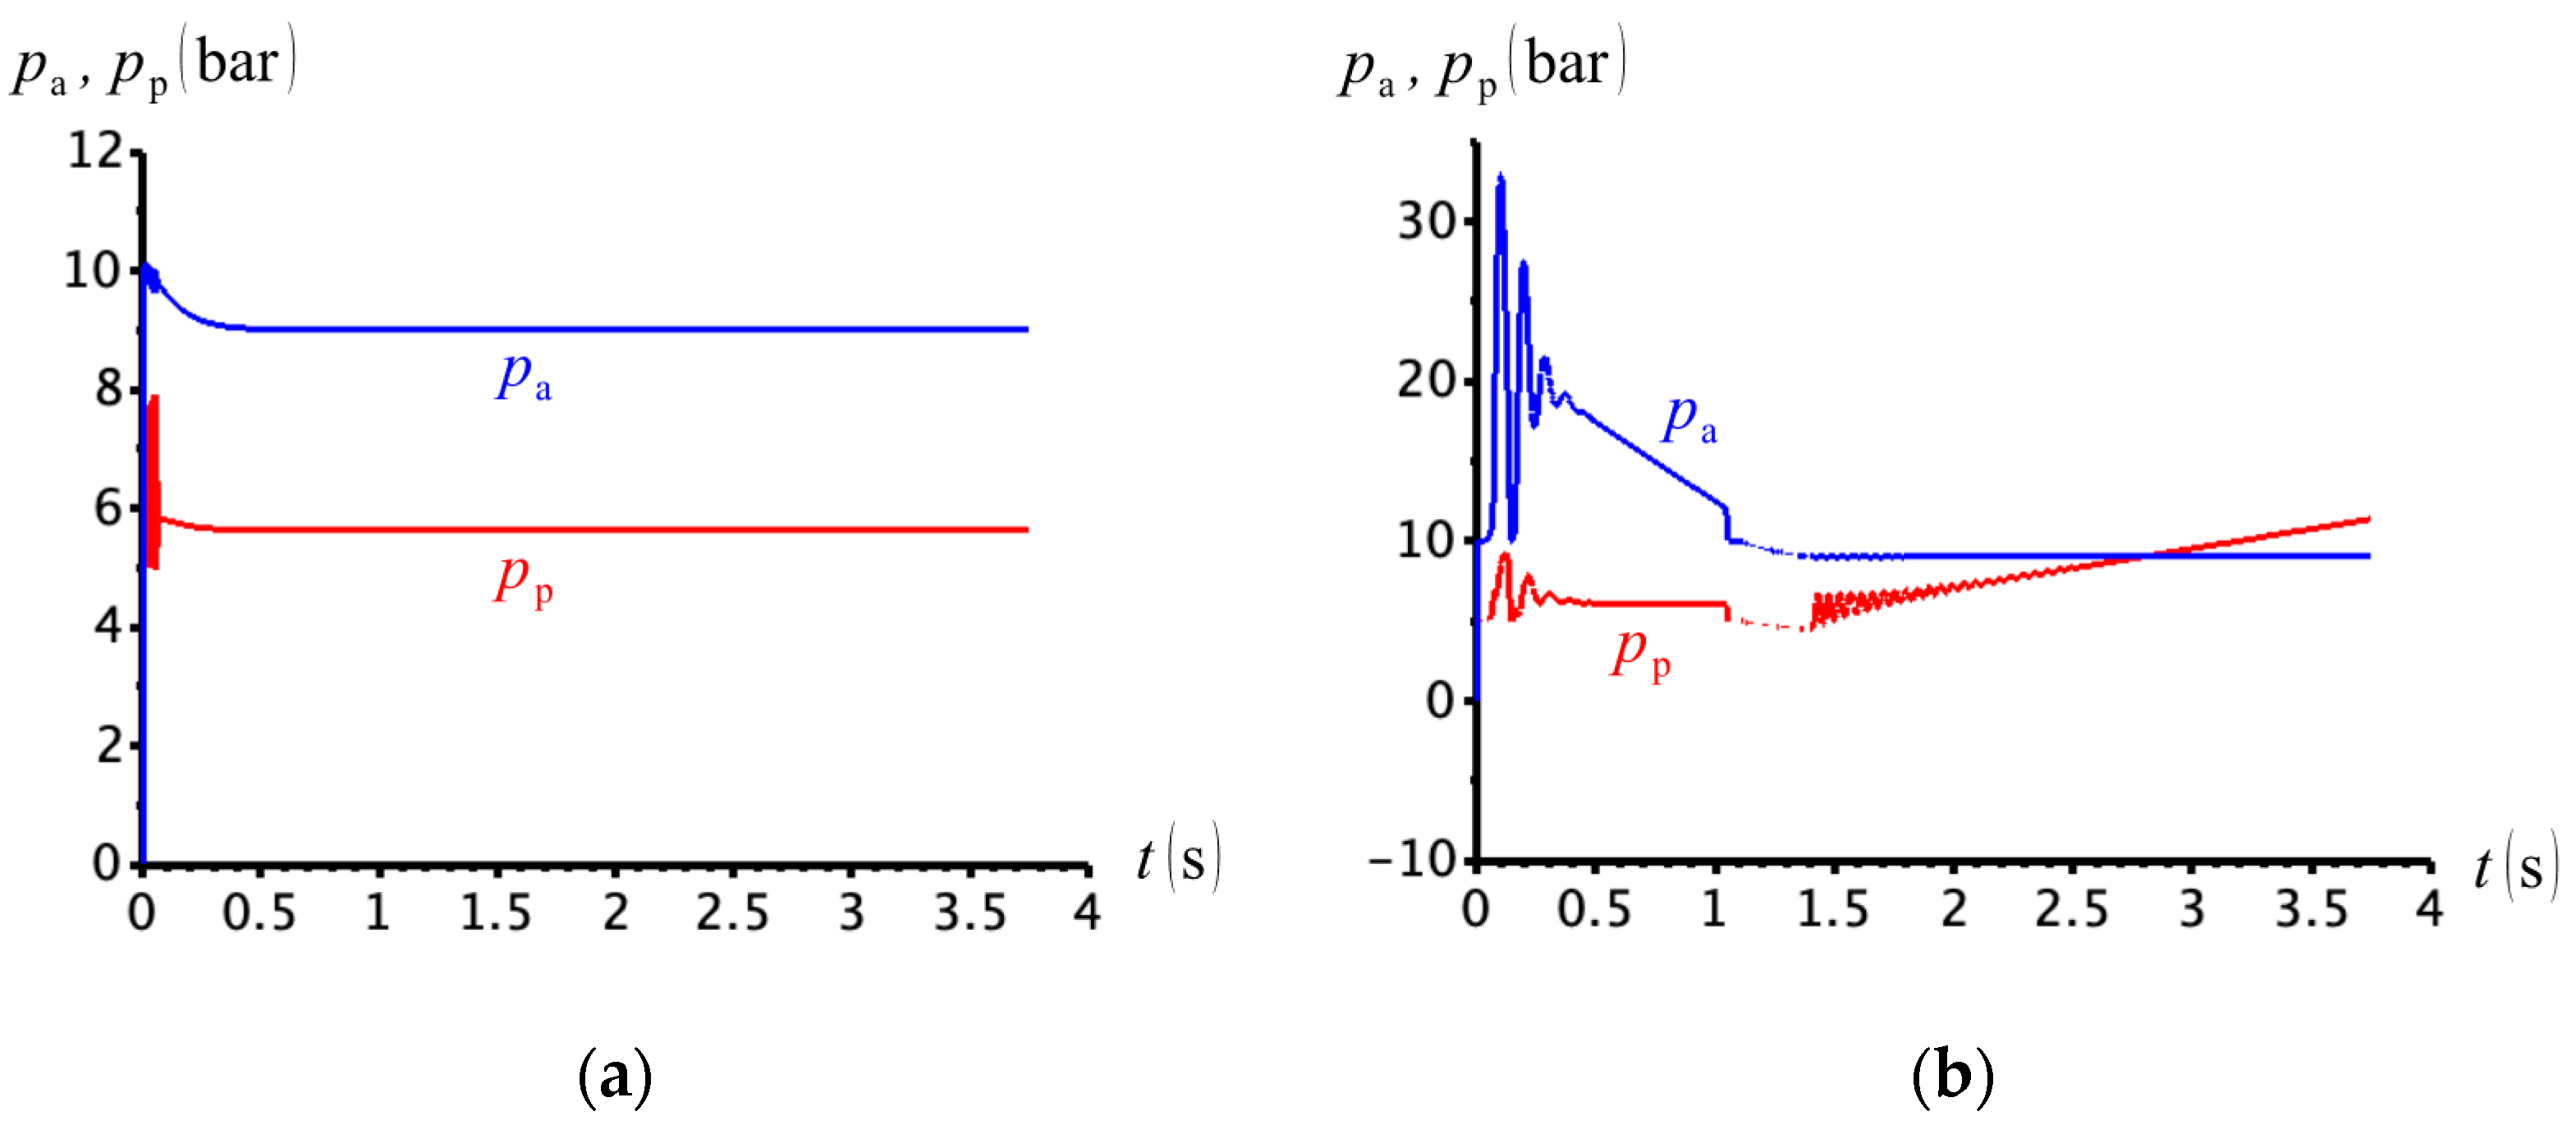
Finally, Figure 35 shows the cap- and rod-side pressure evolution for both situations. Observe that no low pressures are developed, as was the case with the circuit in Figure 20, the results of which were shown in Figure 23.
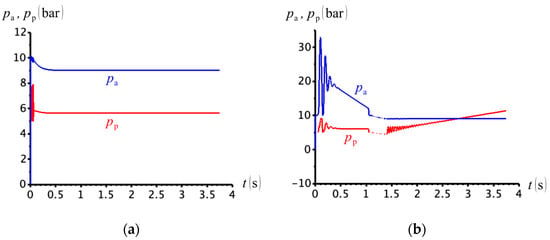
Figure 35.
Cap- and rod-side pressures for (a) and (b) .
In summary, the new quadrant division discussed in this section, together with the solution proposed in Figure 30 and Figure 31, constitute a reliable way of solving the compensation flow problem, in the sense that parameters such as charge pressure, spring constants or pressure losses do not influence the shifting of the compensation valves. This is, perhaps, the most important advantage of using the new design proposed in [1,12].
6. Conclusions
In this paper, we investigated the performances of some of the most relevant and promising attempts to solve the differential area problem in hydrostatic single-rod actuators by means of compensating for the uneven flows into an out of the pump. The analyses, augmented with numerical simulations, followed a progressive order, leading to redefining operational quadrants based on the energy exchange between circuit and actuator. Given the revised definition, the problem of compensation flow instability was largely addressed with a new hydraulic layout design. This paper presented a reliable solution for operating single-rod hydrostatic actuators that can well be used in real world applications.
Author Contributions
G.K.C. contributed in the development of the concepts, analyses of designs, formulation of the problem, preparation and visualization of data, and writing of the original draft. N.S. contributed in the discussions leading to concepts, reviewing of results and editing the paper, project administration and funding acquisition. All authors have read and agreed to the published version of the manuscript.
Funding
This research was funded by NSERC (Natural Sciences and Engineering Research Council) of Canada; Grant number: RGPIN-2018-05352.
Acknowledgments
This work was supported by the Natural Sciences and Engineering Research Council (NSERC) of Canada.
Conflicts of Interest
The authors declare no conflict of interest.
References
- Costa, G.K.; Sepehri, N. Four-Quadrant Analysis and System Design for Single-Rod Hydrostatic Actuators. J. Dyn. Syst. Meas. Control 2019, 141, 1–15. [Google Scholar] [CrossRef]
- Stelson, K.A. Saving the World’s Energy with Fluid Power. In Proceedings of the 8th JFPS International Symposium on Fluid Power, Okinawa, Japan, 25–28 October 2011; pp. 1–7. [Google Scholar]
- Costa, G.K.; Sepehri, N. Hydrostatic Transmissions and Actuators—Operation, Modelling and Applications, 1st ed.; John Wiley & Sons: Chichester, UK, 2015. [Google Scholar]
- Quan, Z.; Quan, L.; Zhang, J. Review of energy efficient direct pump controlled cylinder electro-hydraulic technology. Renew. Sustain. Energy Rev. 2014, 35, 336–346. [Google Scholar] [CrossRef]
- Jalayeri, E.; Imam, A.; Zeljko, T.; Sepehri, N. A throttle-less single-rod hydraulic cylinder positioning system: Design and experimental evaluation. Adv. Mech. Eng. 2015, 7, 1–14. [Google Scholar] [CrossRef]
- Rahmfeld, R.; Ivantysynova, M. Energy Saving Hydraulic Actuators for Mobile Machines, 1st ed.; Bratislavian Fluid Power Symposium: Casta Pila, Slovakia, 1998; pp. 47–57. [Google Scholar]
- Imam, A.; Rafiq, M.; Jalayeri, E.; Sepehri, N. Design, Implementation and Evaluation of a Pump-Controlled Circuit for Single Rod Actuators. Actuators 2017, 6, 10. [Google Scholar] [CrossRef]
- Caliskan, H.; Balkan, T.; Platin, E.B. A Complete Analysis and a Novel Solution for Instability in Pump Controlled Asymmetric Actuators. J. Dyn. Syst. Meas. Control 2015, 137, 091008. [Google Scholar] [CrossRef]
- Wang, L.; Book, W.J.; Huggins, J.D. A Hydraulic Circuit for Single Rod Cylinder. J. Dyn. Syst. Meas. Control ASME 2012, 134, 011019. [Google Scholar] [CrossRef]
- Imam, A.; Sepehri, N. Pump-Controlled Hydraulic Circuits for Operating a Differential Hydraulic Actuator. US Patent 2018/0266447, 20 September 2018. [Google Scholar]
- Altare, G.; Vacca, A. A design solution for efficient and compact electro-hydraulic actuators. Procedia Eng. 2015, 106, 8–16. [Google Scholar] [CrossRef]
- Costa, G.K.; Sepehri, N. Logic-Controlled Flow Compensation Circuit for Operating Single-Rod Hydrostatic Actuators. International Patent WO/2019/051582, 21 March 2019. [Google Scholar]
- Costa, G.K.; Sepehri, N. A Critical Analysis of Valve-Compensated Hydrostatic Actuators: Qualitative Investigation. Actuators 2019, 8, 59. [Google Scholar] [CrossRef]
- Stringer, J. Hydraulic System Analysis: An Introduction; John Wiley & Sons: New York, NY, USA, 1976. [Google Scholar]
- Yanada, H.; Khaing, W.H.; Tran, X.B. Effect of friction model on simulation of hydraulic actuator. In Proceedings of the 3rd International Conference on Design Engineering and Science, Pilsen, Czech Republic, 31 August–3 September 2014; pp. 175–180. [Google Scholar]
- Ren, G.; Esfandiari, M.; Song, J.; Sepehri, N. Position control of an electrohydrostatic actuator with tolerance to internal leakage. IEEE Trans. Control Syst. Technol. 2016, 24, 6. [Google Scholar] [CrossRef]
- Parker, H. Hydraulic Valves Industrial Standard; Catalogue MSG11-3500/UK; Parker Hannifin Corporation: Warwick, UK, 2019. [Google Scholar]
- Costa, G.K.; Sepehri, N. A critical review of the existing models for direct operated hydraulic relief valves with the proposal of a new modelling approach. Int. J. Fluid Power 2017. [Google Scholar] [CrossRef]
- Vukovic, M.; Sgro, S.; Murrenhoff, H. STEAM—A mobile hydraulic system with engine integration. In Proceedings of the ASME/BATH 2013 Symposium on Fluid Power & Motion Control FPMC2013, Sarasota, FL, USA, 6–9 October 2013. [Google Scholar]
- Heybroek, K. Saving Energy in Construction Machinery Using Displacement Control Hydraulics: Concept Realization and Validation. Licentiate Thesis, Linköping University, Linköping, Sweden, 2008. [Google Scholar]
- Gøytil, P.H.; Padovani, D.; Hansen, M.R. A Novel Solution for the Elimination of Mode Switching in Pump-Controlled Single-Rod Cylinders. Actuators 2020, 9, 20. [Google Scholar] [CrossRef]
- Ren, G.; Costa, G.K.; Sepehri, N. Position control of an electro-hydrostatic asymmetric actuator operating in all quadrants. Mechatronics 2020, 67, 102344. [Google Scholar] [CrossRef]
© 2020 by the authors. Licensee MDPI, Basel, Switzerland. This article is an open access article distributed under the terms and conditions of the Creative Commons Attribution (CC BY) license (http://creativecommons.org/licenses/by/4.0/).

