Abstract
Polymer electrolyte membrane (PEM) fuel cells demonstrate potential as a comprehensive and general alternative to fossil fuel. They are also considered to be the energy source of the twenty-first century. However, fuel cell systems have non-linear output characteristics because of their input variations, which causes a significant loss in the overall system output. Thus, aiming to optimize their outputs, fuel cells are usually coupled with a controlled electronic actuator (DC-DC boost converter) that offers highly regulated output voltage. High-order sliding mode (HOSM) control has been effectively used for power electronic converters due to its high tracking accuracy, design simplicity, and robustness. Therefore, this paper proposes a novel maximum power point tracking (MPPT) method based on a combination of reference current estimator (RCE) and high-order prescribed convergence law (HO-PCL) for a PEM fuel cell power system. The proposed MPPT method is implemented practically on a hardware 360W FC-42/HLC evaluation kit. The obtained experimental results demonstrate the success of the proposed method in extracting the maximum power from the fuel cell with high tracking performance.
1. Introduction
Fossil fuel is considered to be one of the main causes of environmental problems related to global warming. Therefore, the need for using alternative sources of energy from petroleum substances and their derivatives is necessary. To this end, many scientists and researchers have been conducting studies and research to obtain alternative clean energies.
During the last few years, several clean energy sources such as solar, wind, geothermal etc., have been developed to generate electric energy and replace conventional fuel [1,2,3,4,5,6,7]. However, these alternative sources necessitate sophisticated and high-cost technologies, and they are not suitable for many applications. Moreover, most of these sources are depending on certain climatic and geographical conditions. For example, solar energy needs the sun and it could not be used in overcasted areas. The same for the wind energy which could also be used only when the wind blows. The use of tidal phenomenon and waves movement require to be near the sea and this is also not available everywhere. By virtue of its abundance in the earth, hydrogen has emerged as an available and advantageous fuel. In this sense, PEM fuel cells which use hydrogen as the main fuel have shone the horizon as a comprehensive and general alternative to fossil fuel. They are considered to be the energy source of the twenty-first century due to their high power densities, lightweight, low operating temperature (quick start-up), long cycle life, as well as zero pollution [8,9,10]. Therefore, they have been used in many fields such as transportation, aircraft, distributed generation, and especially in stationary and mobile applications [11,12,13,14,15,16,17,18]. In these applications, the PEMFC is usually coupled with a DC-DC power electronic converter that provides an efficient power conversion to the load, and also offers highly regulated output voltage [19,20,21,22,23]. Therefore, the control loop is needed so as to obtain an applicable output dc voltage. Besides, since the fuel cell is largely influenced by the load and its inputs variations (temperature, oxygen, and hydrogen), the application of the MPPT algorithm is desired so as to keep the PEMFC operating at the optimal power point.
Usually, the MPPT algorithms are used for PV and wind systems. Thus, different techniques have been designed including fractional open-circuit voltage (FOCV) [24,25], hill climbing (HC) [25], perturb and observe (P&O) [24,26,27], incremental conductance (INC) [24,27], golden section search (GSS) [28], newton’s quadratic interpolation (NQI) [28], extremum seeking control (ESC) [29], sliding mode control (SMC) [27], model predictive control (MPC) [30], fuzzy logic control (FLC) [24,26], backstepping algorithm (BSA) [10], genetic algorithms (GAs) [24,31], particle swarm optimization (PSO) [27], cuckoo search (CS) [32], nature-inspired algorithms (NIA) [25], recurrent learning gradient algorithm (RLGA) [33], flower pollination algorithm (FPA) [34], etc. Although the great research occurred on the MPPT methods, only a few of these techniques have been designed for fuel cell systems. For instance, authors of [35] proposed a smart MPPT algorithm based on FLC aiming to track the maximum power of the PEMFC. Comparative results with the well-known P&O have demonstrated the effectiveness of the proposed algorithm. Thus, a ripple reduction of 90% in the steady-state oscillations could be attained using the proposed MPPT algorithm. In [36], a variable step-size FLC was used to track the output power of a 7KW PEMFC power system. Comparative results with fixed step-size FLC, variable step-size INC, and fuzzy scaled INC, have shown that reductions of 82.35% in response time, 100% in overshoot and current ripple could be attained using the proposed MPPT algorithm. An MPPT-based SMC control was proposed by authors of [37] so as to overcome the drawbacks of the PI application in non-linear systems. Robustness and fast converging to the maximum power point (MPP) are achieved through the proposed method. This latter also was proposed by authors of [38] aiming to extract the maximum power from a fuel cell/battery storage system. Satisfactory results in terms of robustness and tracking accuracy have been achieved. A neural network algorithm (NNA) was designed by authors of [39] for 1.26KW PEMFC electric vehicle power-train. Simulations results have shown that the proposed NNA track the MPP faster when compared with FLC. The NNA also was developed by authors of [40]. However, an intelligent algorithm-based chaotic particle swarm optimization (CPSO) is used to optimize the weights of the proposed algorithm. Simulation results have demonstrated the effectiveness of the proposed algorithm to track the MPP with high robustness and low steady-state oscillations. The authors of [41] proposed neural generalized model predictive control (NGMPC) aiming to track the maximum efficiency or the MPP of a grid-connected fuel cell power system. Simulation results have proved the effectiveness of the proposed method to track the desired power point. The authors of [42] used PSO algorithm for a 53KW PEMFC interfaced with a high step-up dc-dc converter aiming to maintain the stack power extremely close to the maximum operating power point. Comparative results have indicated that the proposed PSO algorithm shows better tracking efficiency, slightly shorter rise time, and an overshoot of 2% lower than the FLC. In [43], a novel single sensor algorithm was designed to track the MPP of a 7KW PEMFC. Comparative results with conventional two sensors algorithm have demonstrated the effectiveness of the proposed algorithm to enhance the efficiency and the lifetime of the PEMFC. In [44], an extremum seeking control (ESC) is used for a hybrid fuel cell power system. The maximum efficiency power point is achieved by controlling the hydrogen flow-rate through the boost converter. Satisfactory results such as an increase of 2% in the average efficiency of the system and 12% in the fuel economy have been obtained. A novel PID-based grey wolf optimizer PID-GWM was proposed by authors of [45] to track the maximum power. The authors used the feedback control scheme. The presented results have indicated the effectiveness of the proposed MPPT algorithm over the P&O, INC, and PID-based PSO. The PID also was used by authors of [46] aiming to maximize the power of the PEMFC. However, a slap swarm algorithm (SSA) was designed to determine the optimal gain of the PID. The obtained results were compared with FLC, GWM, grey antlion optimization (GAO), incremental resistance algorithm (IRA), and mine-blast algorithm (MBA). It has been demonstrated that the proposed MPPT algorithm shows better results in terms of reliability and efficiency. A robust MPPT-based backstepping algorithm was proposed by [47]. Comparative results with PI, one of the most studied, have indicated the outperformance of the proposed method in terms of robustness, settling time, and control precision. Despite the effectiveness of these methods, they have been validated only by simulation work. Actually, the use of the MPPT algorithm in a real fuel cell could be a hard task for many cells topologies and this is due to the application of the security systems that prevent them to operate in the concentration zone at which the locale of the MPP. In other words, for many cells, the current that corresponds to the MPP could be near to the fuel cell maximum current at which the security system turns off the system so as to prevent the damage of the membrane. To overcome these barriers, an effective operating zone was built in our previous work [48] to keep the fuel cell operating near to its MPP. The operating zone could provide up to more than 90% of the MPP for lower temperatures. However, due to the fixed reference, it only could provide around 72% of the MPP for higher temperatures. Therefore, this paper presents an effective solution to overcome these restrictions. Thus, based on the P-I characteristic curves of the fuel cell, the authors construct an MPPT method that keeps the system operating at the maximum possible power point. The highest power point provided by the fuel cell could be attained using the reference current estimator (RCE) method. The corresponding current of this MPP was taken by the HO-PCL algorithm as a reference current and it generates the adequate command signal so as to drive the power converter device.
This rest of the paper is organized as follows: a brief review of the PEM fuel cell model and its operating principle are given in Section 2. The MPPT-based HO-PCL technique is designed in Section 3. The hardware system is explained in Section 4. Section 5 is devoted to the discussion of the experimental results. Finally, some conclusions are indicated in Section 6.
2. PEM Fuel Cell Stack
2.1. Operating Principle
A fuel cell is composed of two electrodes (known as anode and cathode) and an electrolyte membrane which is the main component in a fuel cell device. It is supplied by pressurized oxygen and hydrogen to produce electricity. The operating principle of the PEMFC is detailed in Figure 1.
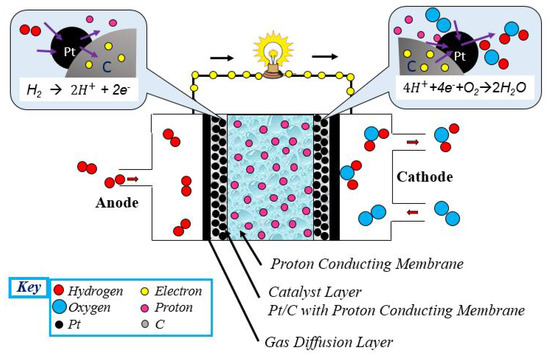
Figure 1.
Fuel cell operation diagram.
In the anode, the hydrogen dissociates into electrons and protons as described by Equation (1). Since the electrolyte membrane allows only the protons to pass, then the electrons flow through the external load to produce electricity and come to the cathode side at which will join the protons. In the cathode, as described by Equation (2), hydrogen dissociations react with the oxygen to produce heat and water (vapor). Therefore, the overall electrochemical reaction of a fuel cell can be given as Equation (3) [48,49,50].
2.2. Model and Analysis
Figure 2 shows the performance of an individual cell operating at a standard temperature and pressures. Besides, this graph represents the variations of the real operating voltage in comparison with the ideal voltage value. It is noticed that the voltage decreases in the beginning, then it behaves as linear, and finally, a sudden fall is occurred at a higher current density. This voltage difference is a result of three main polarization losses: activation, ohmic and concentration.
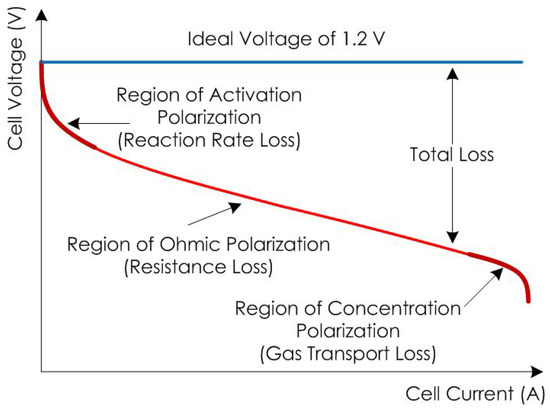
Figure 2.
Ideal and real Fuel Cell Voltage Variations.
The activation polarization loss is characterized by a strong non-linear demeanour. This is due to the reaction kinetics at the electrode of the PEMFC. The activation polarization is important at low current densities (mostly affect in the initial part of the polarization curve) due to the slowness and maintenance of the chemical reaction. The ohmic polarization loss is affected by the ohmic losses of energy derived from the impedance of the membrane. It is also influenced by the resistances of the construction materials (collecting plates and carbon electrodes). The concentration polarization loss (also called mass transportation loss) is the phenomenon that occurs due to the propagation of ions through the electrolyte membrane which leads to the lack of reactants mass transfer at the electrode caused by the rapid consumption of the respective reactant. This loss is important especially at higher current densities. Therefore, according to the empirical equation developed by Amphlett et al. [51] and Kim et al. [52], the cell voltage is given by Equation (4).
where E is the electrochemical thermodynamic potential; , , and , respectively, are activation, ohmic, and concentration loss. Each term of the above equation is defined in Equation (5) [51,52,53].
where T, I, J, , , and B, respectively, are the cell temperature, the cell operating current, the current density, the hydrogen partial pressure, the oxygen partial pressure, and a constant parameter depends on the cell type. The parameters , , , , were developed and calculated in [53] which represent, respectively, the proton resistance and the equivalent resistance of the electron flow, the oxygen concentration, and the parametric coefficients.
3. MPPT Control Design
MPPT is a technique used for maximizing the power extraction from any source of energy. The main feature of this technique is that the produced power could be maximized under any operating conditions. It has been widely used for systems such as wind turbines, PV, and fuel cells. The MPPT method used in this work is built based on a combination of an RCE and an HO-PCL algorithm. The control process including the RCE, the HO-PCL algorithm, the power converter, as well as the fuel cell, is presented in Figure 3. The RCE has the objective of researching the highest power point provided by the fuel cell. The corresponding current of this maximum power point is taken by the HO-PCL algorithm as a reference current and it generates the adequate command signal so as to drive the power converter device.
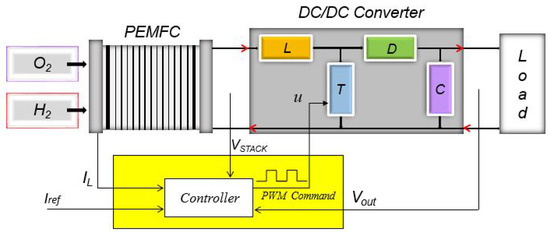
Figure 3.
Synoptic diagram of the PEMFC control design.
3.1. DC/DC Boost Converter
Boost converter circuits are devices that step-up an unregulated DC input low voltage and generates a regulated DC output at a higher voltage. As presented in Figure 4, the device is composed of a filtering capacitor C, an inductor L, and two switches (transistor T and diode D) [54,55].
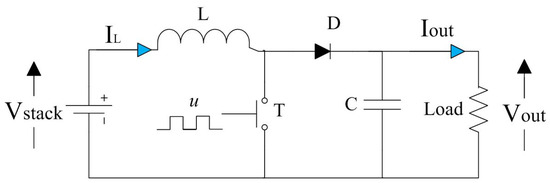
Figure 4.
Boost converter circuit diagram.
According to [56], the relationship between the input voltage and the output voltage is determined by Equation (6), where u is a duty cycle signal generated by the controller.
The boost converter circuit presented in Figure 4 operates in two fundamental different modes: Continuous-Conduction Mode (CCM) and Discontinuous-Conduction Mode (DCM) [54,57,58,59]. However, in this work, the boost converter is assumed to operate in CCM. In this sense, the electronic circuit shifts between two states for each switching cycle T. The first state is called the ON state () at which the transistor switch is close and the diode switch is open. The configuration of the boost converter circuit in the ON state is shown in Figure 5A. Hence, the inductor is connected to the source voltage for energy storage. In this case, the boost converter circuit can be expressed as Equation (7).
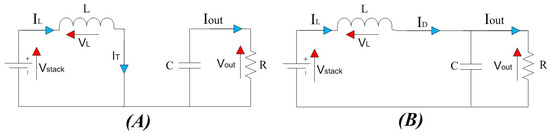
Figure 5.
Configurations of the boost converter circuit: (A) ON state; (B) OFF state.
The state-space representation of the ON state circuit can be written as Equation (8).
where , , , , , and . The waveforms of the inductor voltage , inductor current , transistor current , and diode current during the ON state, are presented in Figure 6.
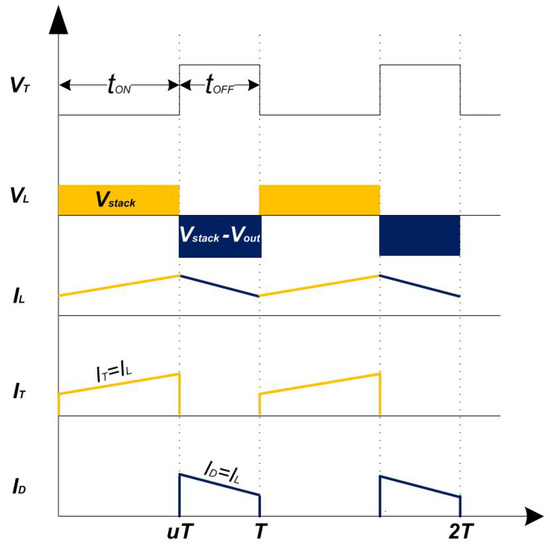
Figure 6.
Waveforms of voltages and currents under CCM.
On the other side, the configuration of the boost converter circuit in the OFF state is shown in Figure 5B. Thus, the inductor will be connected to the output filtering capacitor C and to the resistance R. In this case, the boost converter circuit can be expressed as Equation (9).
The state-space representation of the OFF state circuit can be written as Equation (10).
where , , , and . The waveforms of , , , and during the OFF state, are presented in Figure 6.
3.2. Reference Current Estimator
To determine which will recently be used as a reference current (), the performance of the fuel cell at different operating conditions must be studied. In any fuel cell, variation in temperature, oxygen, or hydrogen has an influence in its performance. However, the fuel cell used in this work is FC-42 Evaluation Kit 360W, and is equipped with an internal control system which provides the required quantities of hydrogen and air (oxygen) for each operating condition. In other words, variations in the ambient temperature will automatically result in variation in supplied hydrogen and air. Therefore, to study the performance of the fuel cell at different operating conditions, experiment tests were executed at several temperature values as presented in Figure 7. The MPP bold red curve depicted in this figure is constructed using Matlab Curve Fitting ToolboxTM (CFT) which provides functions and applications for fitting curves and surfaces to data. The CFT bolsters non-parametric modeling techniques such as smoothing, splines, and interpolation. It also provides optimized solver parameters so as to improve the quality of the fit. In order to construct the MPP curve, the following steps should be performed:
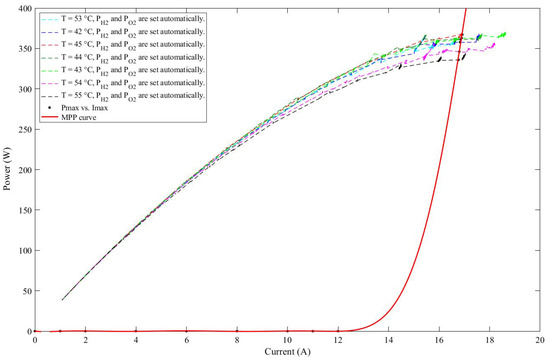
Figure 7.
P-I polarization curves at different operating temperatures.
- Gather the data of and for each P-I polarization curve in two vectors and load this data at the MATLAB command line. The experimental data obtained from the FC-42 Evaluation Kit is enlisted in Table 1.
 Table 1. Experimental Pmax and Imax values obtained from the FC-42 Evaluation Kit.
 - Execute CFT by entering the function “sftool” or “cftool” in the Command Window.
- Select as X data, and as Y data so as to import the database. The CFT will create a default interpolation to fit the loaded data.
- Using the fit category drop-down list (Interpolant, Polynomial, Fourier, Gaussian, Weibull…), select various types and try to find the best curve by comparing the graphical and numerical fit results including fitted coefficients and the goodness of fit (GOF). Regarding to the latter mentioned, it includes the sum of squared due to error (SSE), the R-square, the adjusted R-square and the root mean squared error (RMSE); these metrics are tools that contribute to find the best curve that fits the data, for instance, a small SSE indicates a good fitting.
- Export the best fit to the Matlab workspace.
In this work, assorted tests were performed in order to achieve excellent statistics of the GOF. Hence, the MPP fitting curve constructed using the CFT is presented in Equation (14).
were the coefficients (i = 1…10) and the goodness of the function are given in Table 2.
Table 2.
Goodness and coefficient parameters of the fitting function.
Figure 8 explains the operation of the RCE. Thus, by occurring several projections on MPPT curve (red curve), the PEMFC will be brought from the operating power point to the desired point at which the stack will deliver its maximum power. In other words, assuming that the stack is operating at with an operating current . The tracking control will force to be projected onto the MPPT curve which results in changing its operating current from to and as a consequence, the operating power point will be . The same process is occurred with and and many other power operating points until the stack achieves the point at which the MPPT curve crossed the P vs. I curve.
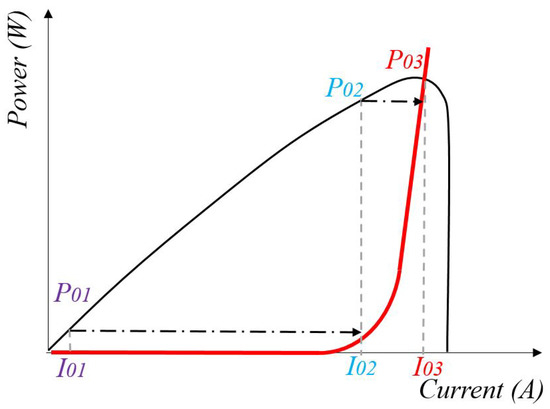
Figure 8.
Principle of the RCE.
This intersection point is called the MPP and its current “” is used as a reference current for the control algorithm.
3.3. Current Regulation
The sliding surface of the PCL algorithm could be written as Equation (15):
where and .
Based on the state-space model given in Equation (13), an uncertain second-order system could be written as Equation (16):
where , , is the derivative of the control u. In order to calculate the two smooth functions and , first, the calculation of the second derivative (with respect to time) can be done as in Equation (15).
Assuming that and are bounded as:
where , and are positive scalars.
The general formulation of the HO-PCL control scheme is given by Equation (21) [60]:
where is a continuous smooth function defined as:
and are two positive designed parameters. They should be determined according to the sufficient condition given in Equation (23) so as to guarantee the convergence in finite time to the sliding surface [60]:
The implementation of the HO-PCL command law in MATLAB/Simulink is shown in Figure 9. Whereas the convergence trajectory of the continuous function is presented in Figure 10.
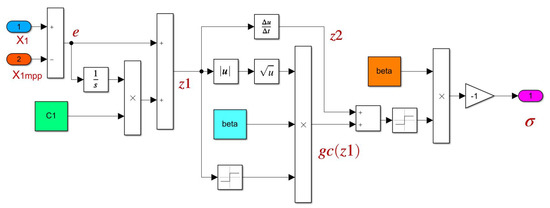
Figure 9.
Synoptic diagram of HO-PCL algorithm.
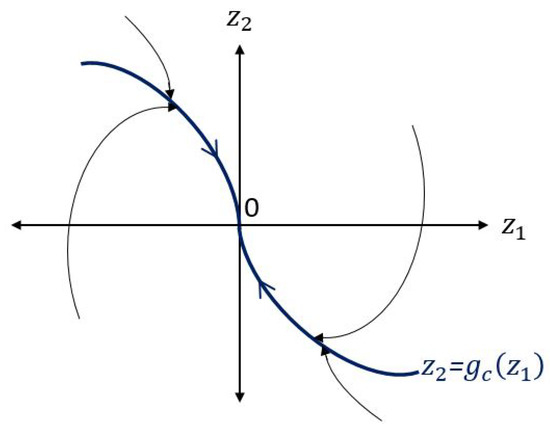
Figure 10.
Phase trajectories of HO-PCL algorithm.
4. Description of the Experimental System
The experimental system presented in Figure 11 consist of: FC-42 Evaluation Kit 360W, FC-42 Control unit, DC/DC converter, slide adjustable power resistor, programmable DC power supplies (BK Precision 1788), MicroLabBox dSPACE DS1202 and a host computer.
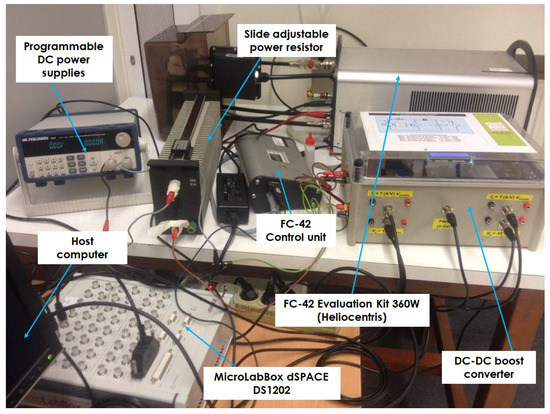
Figure 11.
Experimental setup.
The FC-42 Evaluation Kit is a system that operates fuel cell stacks. It provides reliable and easy operation for FC-42/HLC stack series module, which is manufactured by Schunk Bahn industry. The technical data of this system are shown in Table 3.
Table 3.
Technical data of the FC-42 Evaluation Kit.
The FC-42/HLC stack is composed of 42 cells supplied by hydrogen and cooled with water. It delivers 360 W as a rated power with a current of 15 A and voltage 24 V. The FC-42 360 W Evaluation Kit is equipped with complex hydrogen and air supply system, cooling system, as well as protection and regulation system. The main role of the protection system allows for low range variations in quantities of temperature and supplied air. One of the most important factors which influence the stack effectiveness is moistening the membrane. This latter is required for assuring the conductivity of protons in the membrane and prevent the dryness. On the other hand, high humidity results in water condensation in the membrane surface which leads to limit the bonding between oxygen and hydrogen. However, proper moistening could be done by supplying an adequate amount of air via the cathode side. Since the supplied air is dependent on the stack temperature, then, a proper setting of temperature leads to proper moistening which will result in an increase in the overall stack efficiency. A cooling tank can be used to achieve a proper humidity of supplied air (RH ≈ ). Hydrogen inlet pressure is supplied at the anode side with a constant level (≈ 28 kPa). The outlet of the anode is kept closed using a valve. This latter opens periodically in pulses so as to perform the purging of the anode. Regulation and protection systems also have the role of avoiding the destruction of the stack by preventing the exceeding values of temperature, current, and voltage. Thus, an automatic disconnection is done when the cooling water temperature is above 55 , voltage below 20 V and current above 35 A.
The FC-42 360 W Evaluation Kit is also equipped with measuring and control system as shown in Figure 12. It is used to determine the following quantities:
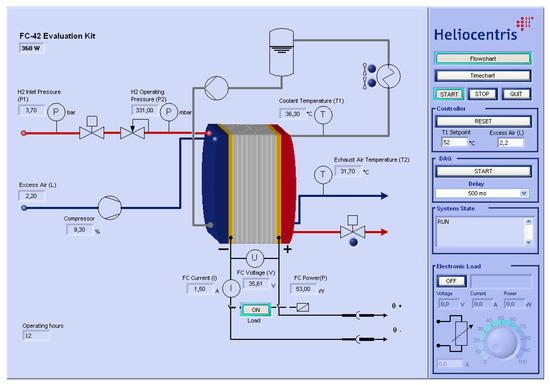
Figure 12.
PEM fuel cell measuring system.
- Stack current (with an accuracy of 0.8 A)
- Stack voltage (with an accuracy of 0.1 A)
- Stack power (calculated)
- Cooling temperature (with an accuracy of )
- Exhaust air temperature (with an accuracy of )
- hydrogen inlet pressure
- hydrogen operating pressure
- Excess air (calculated)
It should be noted that the authors also have used external devices for current and voltage measurements so as to avoid the low accuracy of the measuring system.
The DC/DC converter was designed and constructed by the TEP-192-Research Group of Huelva university. It is equipped with a PWM switching input (20 kHz) which allows the user to perform the control process. Technical data and some detailed specifications concerning the used converter are listed in Table 4.
Table 4.
Technical data of the DC/DC converter.
The host computer has an important role in the experimental systemsince it organizes and exchanges the data between the software (Simulink, Controldesk, etc.)and the hardware (dSPACE, FC-42 Control unit, etc.). The characteristics of the host computer used in the experiments are as follows; operating system: windows 10; processor: Intel CoreTM i7 CPU; RAM:16 GB; Hard disk space: 500 GB; ports: 6 free USB ports; graphical user interface with resolution of 1920 × 1200 pixels; and I/O boards interface for physical interactions with the DS1202.
The dSpace used in this experiment is MicroLabBox dSPACE-DS1202, which is a compact system that offers excellent performance and versatility. It helps the user to turn the theoretical concepts into reality, as well as it enables the user to setup the experiments quickly and easily. MicroLabBox has more than 100 channels with different I/O types which make it a versatile development system that could be used in many fields such as development areas and mechatronic applications. Besides, it has a dual-core processor with 2 GHz and a programmable FPGA which allow the user to test even exceedingly fast control loops. It is supported by Real-Time Interface (RTI) and ControlDesk software packages so as to enable the linkage with Simulink. The integration of the MicroLabBos with the host computer and the power converter is shown in Figure 13.
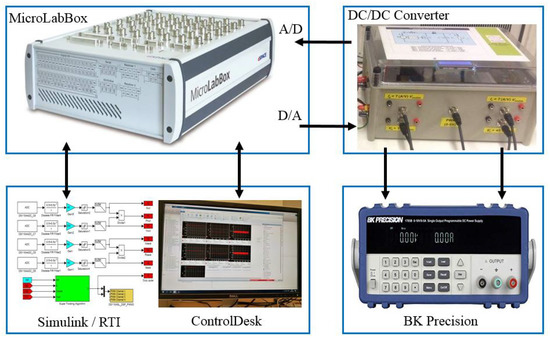
Figure 13.
System implementation.
Once the Simulink model is compiled, the RTI sends the generated C code to the MicroLabBox. This latter will convert this code to PWM pulses and they will be sent to the power converter so as to track the desired operating power point. The power converter signals are supplied to the MicroLabBox via its analog-to-digital converter (ADC), and they will be linked with the Simulink model using the RTI library. The evolution of all the obtained signals are recorded and visualized online using the Controldesk monitoring software. This latter has the ability to measure and adjust all the model parameters at run time. Besides, it provides different graphical tools which help the user to obtain clear results. Therefore, the observation and evaluation of the parameters changes can be easily done at run time.
The fuel cell system is linked with a programmable electronic load (PEL) called “BK Precision”. It is constructed by Fotronic Corporation Company (USA) with the following characteristics: DC Power Supply, = 115 V, = [0 V–32 V], = [0 A–6 A], = 47 Hz, = [ − 1000 ]. The PEL could be programmed via the “PV-1785B-1788” software.
5. Results and Discussion
The experimental power and potential Vs current characteristic curves of the FC-42 Evaluation Kit are shown in Figure 14. According to this figure, it is clear that the potential characteristic curves validate the theoretical results which already presented in Figure 2. Besides, it is notable that the performance of the FC-42 is enhanced by boosting the operating temperature from 42 to 45 , while they are dropped for temperatures above than 53 . The increase in the performance could be explained by the rise in membrane conductivity and the exchange current density which leads as a consequence to reduce the activation losses. However, for higher temperatures, the conductivity of the membrane reduces because of the diminishing of the relative humidity in the cell membrane. It is also observed from the characteristic curves that the appearance of the activation and the concentration zones is inconspicuous and this is due to the measurement sensitivity at low and high currents.
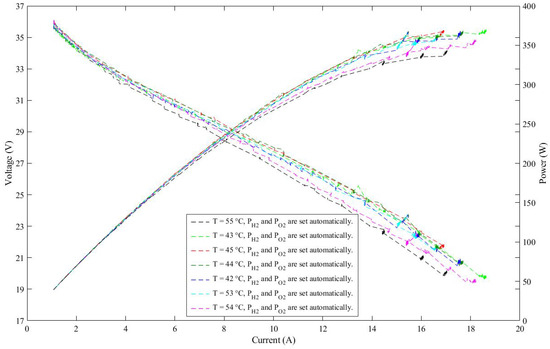
Figure 14.
Experimental power and potential Vs current characteristic curves of the FC-42 Evaluation Kit.
The performance of the FC-42 under the use of the proposed MPPT control method is presented in Figure 15 which shows, respectively, the waveforms of stack current, stack voltage and stack power. It should be noticed that the noise occurred in the obtained signals is due to the impact of the control signal time-delay. The noise also could be a result of the parasite signals that come from the hardware system components. Therefore, according to these results, it is clearly demonstrated that the proposed control method succeeded to extract the maximum power from the fuel cell. Thus, by running the fuel cell for up to more than 200 s, the MPP can be extracted for temperature variation in a range of [42–55 ]. Before starting the control process and aiming to achieve the influence of the temperature on the MPPT control method, the fuel cell was heated manually until 54 using the FC-40 control unit which shown in Figure 11. Then, by applying the controller, the FC-42 power could reach about 375 W as shown in Figure 15C. However, with temperature variations, this amount decreases until 355 W or less. This validates that the proposed control method tracks the MPP curve which was presented in Figure 7.
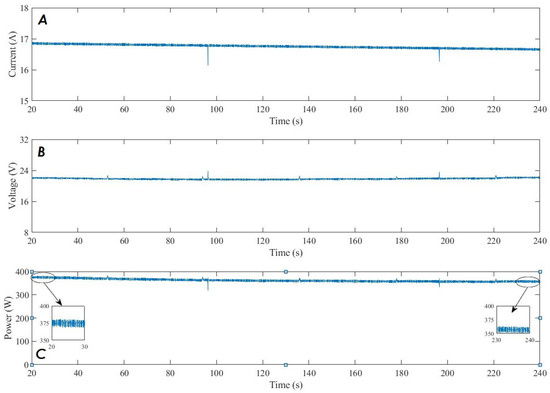
Figure 15.
Control results: (A) stack current; (B) stack voltage; (C) stack power.
On the other hand, aiming to find out the behavior of the HO-PCL against the unexpected disturbances, a variation of 20 in the load resistance was applied each 25s. These variations, as shown in Figure 16A, were done using the programmable electronic load (PEL) that commutes between 30 and 50 . Despite these sharp variations, it is clearly shown in Figure 15, Figure 16B,C and Figure 17, that the proposed HO-PCL shows robustness against external unexpected disturbances. Thus, soft signals with high accuracy and without any overshoots are obtained. Besides, a smooth and fast rise to the desired value also can be seen in Figure 17A,B. Consequently, high tracking performance with proper dynamic behavior and global system stability are obtained.
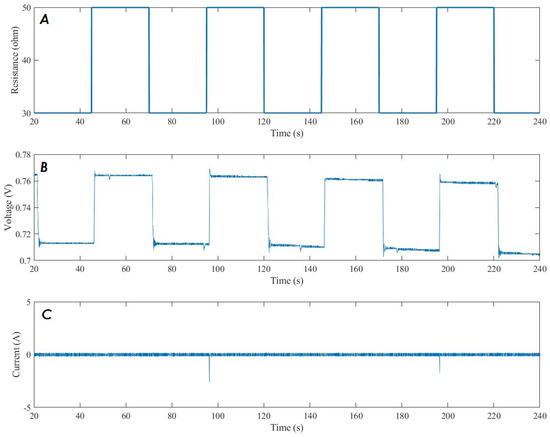
Figure 16.
Control results: (A) load variations; (B) duty cycle; (C) error signal.
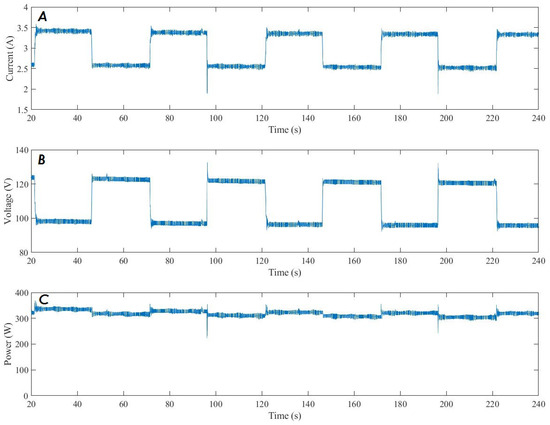
Figure 17.
Control results: (A) the converter output current; (B) the converter output voltage; (C) the converter output power.
6. Conclusions
In this paper, a novel MPPT method based on a combination of RCE and HO-PCL has been proposed for an FC-42 Evaluation Kit 360W to extract the maximum power under load and system parameter variations. The experimental system including the FC-42, the converter, the programmable electronic load and the host computer, have been installed with the MicroLabBox dSPACE DS1202. The performance of the FC-42 Evaluation Kit under different operating temperatures was studied. The power and potential Vs current characteristic curves have demonstrated that the performance of the FC-42 is enhanced by boosting the operating temperature. The proposed MPPT method has been designed and built on MATLAB/Simulink and linked with the MicroLabBox using the DS1202 linkage blocks. The performance of the MPPT method has been evaluated and discussed. The obtained experimental results have proven the success of the proposed method in extracting the maximum power from the FC-42 with high tracking performance. Thus, robustness, high tracking accuracy, proper dynamic behavior, and global system stability are obtained even under large load variation. Finally, since the MPPT methods are significantly important for clean energy sources such as Heliocentris FC-42 Evaluation Kit, this work will pave the way for more progressing and sophisticated research on this topic.
Author Contributions
Conceptualization, M.D.; methodology, M.D. and O.B.; software, M.D.; validation, M.D. and O.B.; formal analysis, M.D.; investigation, M.D.; resources, O.B.; data curation, M.D.; writing—original draft preparation, M.D.; writing—review and editing, M.D., M.Y.S., C.N. and O.B.; visualization, M.D.; supervision, O.B.; project administration, O.B.; funding acquisition, O.B. All authors have read and agreed to the published version of the manuscript.
Funding
This work was partially supported by Eusko Jaurlaritza/Gobierno Vasco [grant number SMAR3NAK ELKARTEK KK-2019/00051]; the Provincial Council of Alava (DFA) [grant number CONAVAUTIN 2] (Collaboration Agreement).
Acknowledgments
The authors would like to thank the UPV/EHU and the Basque Government for supporting this work.
Conflicts of Interest
The authors declare no conflict of interest.
Abbreviations
The following abbreviations are used in this manuscript:
| PEM | Proton Exchange Membrane |
| MPPT | Maximum Power Point Tracker |
| HOSM | High-order sliding mode |
| RCE | Reference Current Estimator |
| HO-PCL | High-Order Prescribed Convergence Law |
| FOCV | Fractional Open Circuit Voltage |
| HC | Hill Climbing |
| P&O | Perturb and Observation |
| IC | Incremental Conductance |
| GSS | Golden Section Search |
| NQI | Newton’s Quadratic Interpolation |
| ESC | Extremum Seeking Control |
| SMC | Sliding Mode Control |
| MPC | Model Predictive Control |
| FLC | Fuzzy Logic Control |
| BSA | Backstepping Algorithm |
| GAs | Genetic Algorithms |
| PSO | Particle Swarm Optimization |
| CS | Cuckoo Search |
| NIA | Nature-Inspired Algorithms |
| RLGA | Recurrent Learning Gradient Algorithm |
| FPA | Flower Pollination Algorithm |
| NNC | Neural Network Control |
| CPSO | Chaotic Particle Swarm Optimization |
| MPC | Model Predictive Control |
| NGMPC | Neural Generalized MPC |
| MPP | Maximum Power Point |
| PID | Proportional-Integral Derivative |
| GWO | Grey Wolf Optimizer |
| SSA | Slap Swarm Algorithm |
| GAO | Grey Antlion Optimization |
| IRA | Incremental Resistance algorithm |
| MBA | Mine Blast Algorithm |
| PI | Proportional-Integral |
| CCM | Continuous-Conduction Mode |
| DCM | Discontinuous-Conduction Mode |
| CFT | Curve Fitting Toolbox |
| GOF | Goodness Of Fit |
| SSE | Sum of Squared due to Error |
| RMSE | Root Mean Squared Error |
| RTI | Real-Time Interface |
| ADC | Analog to Digital Converter |
| PEL | programmable electronic load |
| UPV | Universidad del Pais Vasco |
| EHU | Euskal Herriko Uniberstsitatea |
References
- Charaabi, A.; Barambones, O.; Zaidi, A.; Zanzouri, N. A Novel Two Stage Controller for a DC-DC Boost Converter to Harvest Maximum Energy from the PV Power Generation. Actuators 2020, 9, 29. [Google Scholar] [CrossRef]
- Boschetto, A.; Bottini, L.; Costanza, G.; Tata, M.E. Shape Memory Activated Self-Deployable Solar Sails: Small-Scale Prototypes Manufacturing and Planarity Analysis by 3D Laser Scanner. Actuators 2019, 8, 38. [Google Scholar] [CrossRef]
- Lampreia, S.; Vairinhos, V.; Lobo, V.; Requeijo, J. A Statistical State Analysis of a Marine Gas Turbine. Actuators 2019, 8, 54. [Google Scholar] [CrossRef]
- Matuszewska, D.; Kuta, M.; Olczak, P. Techno-Economic Assessment of Mobilized Thermal Energy Storage System Using Geothermal Source in Polish Conditions. Energies 2020, 13, 3404. [Google Scholar] [CrossRef]
- Vargas, C.A.; Tinoco, H.A. Electrical Performance of a Piezo-inductive Device for Energy Harvesting with Low-Frequency Vibrations. Actuators 2019, 8, 55. [Google Scholar] [CrossRef]
- Ai, R.; Monteiro, L.L.S.; Monteiro, P.C.C., Jr.; Pacheco, P.M.C.L.; Savi, M.A. Piezoelectric Vibration-Based Energy Harvesting Enhancement Exploiting Nonsmoothness. Actuators 2019, 8, 25. [Google Scholar] [CrossRef]
- Wei, W.; Li, Q.; Xu, F.; Zhang, X.; Jin, J.; Sun, F. Research on an Electromagnetic Actuator for Vibration Suppression and Energy Regeneration. Actuators 2020, 9, 42. [Google Scholar] [CrossRef]
- Boukrich, N.; Derbeli, M.; Farhat, M.; Sbita, L. Smart auto-tuned regulators in electric vehicule PMSM drives. In Proceedings of the 2017 International Conference on Green Energy Conversion Systems (GECS), Hammamet, Tunisia, 23–25 March 2017; pp. 1–5. [Google Scholar] [CrossRef]
- Silaa, M.Y.; Derbeli, M.; Barambones, O.; Cheknane, A. Design and Implementation of High Order Sliding Mode Control for PEMFC Power System. Energies 2020, 13, 4317. [Google Scholar] [CrossRef]
- Derbeli, M.; Barambones, O.; Sbita, L. A Robust Maximum Power Point Tracking Control Method for a PEM Fuel Cell Power System. Appl. Sci. 2018, 8, 2449. [Google Scholar] [CrossRef]
- Yaacoubi, S.; McKeon, P.; Ke, W.; Declercq, N.F.; Dahmene, F. Towards an Ultrasonic Guided Wave Procedure for Health Monitoring of Composite Vessels: Application to Hydrogen-Powered Aircraft. Materials 2017, 10, 1097. [Google Scholar] [CrossRef]
- Mohamed, A.-A.A.; Ali, S.; Alkhalaf, S.; Senjyu, T.; Hemeida, A.M. Optimal Allocation of Hybrid Renewable Energy System by Multi-Objective Water Cycle Algorithm. Sustainability 2019, 11, 6550. [Google Scholar] [CrossRef]
- Atawi, I.E.; Kassem, A.M.; Zaid, S.A. Modeling, Management, and Control of an Autonomous Wind/Fuel Cell Micro-Grid System. Processes 2019, 7, 85. [Google Scholar] [CrossRef]
- Derbeli, M.; Barambones, O.; Farhat, M.; Ramos, J.A.; Sbita, L. Robust high order sliding mode control for performance improvement of PEM fuel cell power systems. Int. J. Hydrogen Energy 2020. [Google Scholar] [CrossRef]
- Wilberforce, T.; Alaswad, A.; Palumbo, A.; Dassisti, M.; Olabi, A.G. Advances in stationary and portable fuel cell applications. Int. J. Hydrogen Energy 2016, 41, 16509–16522. [Google Scholar] [CrossRef]
- Boulmrharj, S.; Khaidar, M.; Bakhouya, M.; Ouladsine, R.; Siniti, M.; Zine-dine, K. Performance Assessment of a Hybrid System with Hydrogen Storage and Fuel Cell for Cogeneration in Buildings. Sustainability 2020, 12, 4832. [Google Scholar] [CrossRef]
- Bass, P.S.; Zhang, L.; Tu, M.; Cheng, Z. Enhancement of Biodegradable Poly(Ethylene Oxide) Ionic–Polymer Metallic Composite Actuators with Nanocrystalline Cellulose Fillers. Actuators 2018, 7, 72. [Google Scholar] [CrossRef]
- Kweon, B.C.; Sohn, J.S.; Ryu, Y.; Cha, S.W. Energy Harvesting of Ionic Polymer-Metal Composites Based on Microcellular Foamed Nafion in Aqueous Environment. Actuators 2019, 9, 71. [Google Scholar] [CrossRef]
- Torki, W.; Derbeli, M. Modeling and control of a stand-alone PEMFC for AC load-PMSM application. In Proceedings of the 2017 International Conference on Green Energy Conversion Systems (GECS), Hammamet, Tunisia, 23–25 March 2017; pp. 1–6. [Google Scholar] [CrossRef]
- Derbeli, M.; Mrad, I.; Sbita, L.; Barambones, O. PEM fuel cell efficiency boosting—Robust MPP tracking. In Proceedings of the 2018 9th International Renewable Energy Congress (IREC), Hammamet, Tunisia, 20–22 March 2018; pp. 1–5. [Google Scholar] [CrossRef]
- Lin, C.-L.; Hung, H.-C.; Li, J.-C. Active Control of Regenerative Brake for Electric Vehicles. Actuators 2018, 7, 84. [Google Scholar] [CrossRef]
- Chen, E.-P.; Cheng, J.; Tu, J.-H.; Lin, C.-L. Sensorless Driving/Braking Control for Electric Vehicles. Actuators 2020, 9, 22. [Google Scholar] [CrossRef]
- Lund, S.H.J.; Billeschou, P.; Larsen, L.B. High-Bandwidth Active Impedance Control of the Proprioceptive Actuator Design in Dynamic Compliant Robotics. Actuators 2019, 8, 71. [Google Scholar] [CrossRef]
- Ko, J.-S.; Huh, J.-H.; Kim, J.-C. Overview of Maximum Power Point Tracking Methods for PV System in Micro Grid. Electronics 2020, 9, 816. [Google Scholar] [CrossRef]
- Pathy, S.; Subramani, C.; Sridhar, R.; Thamizh Thentral, T.M.; Padmanaban, S. Nature-Inspired MPPT Algorithms for Partially Shaded PV Systems: A Comparative Study. Energies 2019, 12, 1451. [Google Scholar] [CrossRef]
- Kim, J.-C.; Huh, J.-H.; Ko, J.-S. Optimization Design and Test Bed of Fuzzy Control Rule Base for PV System MPPT in Micro Grid. Sustainability 2020, 12, 3763. [Google Scholar] [CrossRef]
- Rezk, H.; Fathy, A. Performance Improvement of PEM Fuel Cell Using Variable Step-Size Incremental Resistance MPPT Technique. Sustainability 2020, 12, 5601. [Google Scholar] [CrossRef]
- Andrean, V.; Chang, P.C.; Lian, K.L. A Review and New Problems Discovery of Four Simple Decentralized Maximum Power Point Tracking Algorithms—Perturb and Observe, Incremental Conductance, Golden Section Search, and Newton’s Quadratic Interpolation. Energies 2018, 11, 2966. [Google Scholar] [CrossRef]
- Mahmod Mohammad, A.N.; Mohd Radzi, M.A.; Azis, N.; Shafie, S.; Atiqi Mohd Zainuri, M.A. A Novel Hybrid Approach for Maximizing the Extracted Photovoltaic Power under Complex Partial Shading Conditions. Sustainability 2020, 12, 5786. [Google Scholar] [CrossRef]
- Ahmed, M.; Abdelrahem, M.; Kennel, R. Highly Efficient and Robust Grid Connected Photovoltaic System Based Model Predictive Control with Kalman Filtering Capability. Sustainability 2020, 12, 4542. [Google Scholar] [CrossRef]
- Hadji, S.; Gaubert, J.-P.; Krim, F. Real-Time Genetic Algorithms-Based MPPT: Study and Comparison (Theoretical an Experimental) with Conventional Methods. Energies 2018, 11, 459. [Google Scholar] [CrossRef]
- Basha, C.H.; Rani, C. Different Conventional and Soft Computing MPPT Techniques for Solar PV Systems with High Step-Up Boost Converters: A Comprehensive Analysis. Energies 2020, 13, 371. [Google Scholar] [CrossRef]
- Viloria-Porto, J.; Robles-Algarín, C.; Restrepo-Leal, D. A Novel Approach for an MPPT Controller Based on the ADALINE Network Trained with the RTRL Algorithm. Energies 2018, 11, 3407. [Google Scholar] [CrossRef]
- Yousri, D.; Babu, T.S.; Allam, D.; Ramachandaramurthy, V.K.; Beshr, E.; Eteiba, M.B. Fractional Chaos Maps with Flower Pollination Algorithm for Partial Shading Mitigation of Photovoltaic Systems. Energies 2019, 12, 3548. [Google Scholar] [CrossRef]
- Derbeli, M.; Sbita, L.; Farhat, M.; Barambones, O. Proton exchange membrane fuel cell—A smart drive algorithm. In Proceedings of the 2017 International Conference on Green Energy Conversion Systems (GECS), Hammamet, Tunisia, 23–25 March 2017; pp. 1–5. [Google Scholar] [CrossRef]
- Harrag, A.; Messalti, S. How fuzzy logic can improve PEM fuel cell MPPT performances? Int. J. Hydrogen Energy 2018, 43, 537–550. [Google Scholar] [CrossRef]
- Derbeli, M.; Barambones, O.; Farhat, M.; Sbita, L. Efficiency Boosting for Proton Exchange Membrane Fuel Cell Power System Using New MPPT Method. In Proceedings of the 10th International Renewable Energy Congress (IREC), Sousse, Tunisia, 26–28 March 2019; pp. 1–4. [Google Scholar] [CrossRef]
- Derbeli, M.; Charaabi, A.; Barambones, O.; Sbita, L. Optimal Energy Control of a PEM Fuel Cell/Battery Storage System. In Proceedings of the 10th International Renewable Energy Congress (IREC), Sousse, Tunisia, 26–28 March 2019; pp. 1–5. [Google Scholar] [CrossRef]
- Reddy, K.J.; Sudhakar, N. High voltage gain interleaved boost converter with neural network based MPPT controller for fuel cell based electric vehicle applications. IEEE Access 2018, 6, 3899–3908. [Google Scholar] [CrossRef]
- Al-Araji, A.S.; Dhahad, H.A.; Jaber, E.A. A Neural Networks based Predictive Voltage-Tracking Controller Design for Proton Exchange Membrane Fuel Cell Model. J. Eng. 2019, 25, 26–48. [Google Scholar] [CrossRef]
- Pereira, D.F.; da Costa Lopes, F.; Watanabe, E.H. Neural Generalized Predictive Control for Tracking Maximum Efficiency and Maximum Power Points of PEM Fuel Cell Stacks. In Proceedings of the IECON 2018 44th Annual Conference of the IEEE Industrial Electronics Society, Washington, DC, USA, 21–23 October 2018; pp. 1878–1883. [Google Scholar] [CrossRef]
- Luta, D.N.; Raji, A.K. Fuzzy rule-based and particle swarm optimisation MPPT techniques for a fuel cell stack. Energies 2019, 12, 936. [Google Scholar] [CrossRef]
- Harrag, A.; Bahri, H. A Novel Single Sensor Variable Step Size Maximum Power Point Tracking for Proton Exchange Membrane Fuel Cell Power System. Fuel Cells 2019, 19, 177–189. [Google Scholar] [CrossRef]
- Bizon, N.; Thounthong, P. Energy efficiency and fuel economy of a fuel cell/renewable energy sources hybrid power system with the load-following control of the fueling regulators. Mathematics 2020, 8, 151. [Google Scholar] [CrossRef]
- Rana, K.P.S.; Kumar, V.; Sehgal, N.; George, S. A Novel dPdI feedback based control scheme using GWO tuned PID controller for efficient MPPT of PEM fuel cell. ISA Trans. 2019, 93, 312–324. [Google Scholar] [CrossRef]
- Fathy, A.; Abdelkareem, M.A.; Olabi, A.G.; Rezk, H. A novel strategy based on salp swarm algorithm for extracting the maximum power of proton exchange membrane fuel cell. Int. J. Hydrogen Energy 2020, 8, 2449. [Google Scholar] [CrossRef]
- Derbeli, M.; Farhat, M.; Barambones, O.; Sbita, L. A robust MPP tracker based on backstepping algorithm for Proton Exchange Membrane Fuel Cell power system. In Proceedings of the 2017 11th IEEE International Conference on Compatibility, Power Electronics and Power Engineering (CPE-POWERENG), Cadiz, Spain, 4–6 April 2017; pp. 424–429. [Google Scholar] [CrossRef]
- Derbeli, M.; Barambones, O.; Ramos-Hernanz, J.A.; Sbita, L. Real-Time Implementation of a Super Twisting Algorithm for PEM Fuel Cell Power System. Energies 2019, 12, 1594. [Google Scholar] [CrossRef]
- Derbeli, M.; Farhat, M.; Barambones, O.; Sbita, L. Control of Proton Exchange Membrane Fuel Cell (PEMFC) power system using PI controller. In Proceedings of the 2017 International Conference on Green Energy Conversion Systems (GECS), Hammamet, Tunisia, 23–25 March 2017; pp. 1–5. [Google Scholar] [CrossRef]
- Derbeli, M.; Sbita, L.; Farhat, M.; Barambones, O. PEM fuel cell green energy generation—SMC efficiency optimization. In Proceedings of the 2017 International Conference on Green Energy Conversion Systems (GECS), Hammamet, Tunisia, 23–25 March 2017; pp. 1–5. [Google Scholar] [CrossRef]
- Amphlett, J.C.; Baumert, R.M.; Mann, R.F.; Peppley, B.A.; Roberge, P.R.; Harris, T.J. Performance modeling of the Ballard Mark IV solid polymer electrolyte fuel cell II. Empirical model development. J. Electrochem. Soc. 1995, 142, 9. [Google Scholar] [CrossRef]
- Kim, J.; Lee, S.M.; Srinivasan, S.; Chamberlin, C.E. Modeling of proton exchange membrane fuel cell performance with an empirical equation. J. Electrochem. Soc. 1995, 142, 2670. [Google Scholar] [CrossRef]
- Derbeli, M.; Farhat, M.; Barambones, O.; Sbita, L. Control of PEM fuel cell power system using sliding mode and super-twisting algorithms. Int. J. Hydrogen Energy 2017, 42, 8833–8844. [Google Scholar] [CrossRef]
- Davoudi, A.; Jatskevich, J.; De Rybel, T. Numerical state-space average-value modeling of PWM DC-DC converters operating in DCM and CCM. IEEE Trans. Power Electron. 2006, 21, 1003–1012. [Google Scholar] [CrossRef]
- Amir, S.; van der Zee, R.; Nauta, B. An improved modeling and analysis technique for peak current-mode control-based boost converters. IEEE Trans. Power Electron. 2014, 30, 5309–5317. [Google Scholar] [CrossRef]
- Kazimierczuk, M.K. Pulse-Width Modulated DC-DC Power Converters; John Wiley & Sons: Hoboken, NJ, USA, 2015; p. 960. [Google Scholar]
- Suntio, T. Average and small-signal modeling of self-oscillating flyback converter with applied switching delay. IEEE Trans. Power Electron. 2006, 21, 479–486. [Google Scholar] [CrossRef]
- Cheng, C.H.; Chen, C.J.; Wang, S.S. Small-signal model of flyback converter in continuous-conduction mode with peak-current control at variable switching frequency. IEEE Trans. Power Electron. 2017, 33, 4145–4156. [Google Scholar] [CrossRef]
- Luchetta, A.; Manetti, S.; Piccirilli, M.C.; Reatti, A.; Kazimierczuk, M.K. Comparison of DCM operated PWM DC-DC converter modelling methods including the effects of parasitic components on duty ratio constraint. In Proceedings of the 2015 IEEE 15th International Conference on Environment and Electrical Engineering (EEEIC), Rome, Italy, 10–13 June 2015; pp. 766–771. [Google Scholar] [CrossRef]
- Fridman, L.; Levant, A. High-Order Sliding Modes Sliding Modes Control in Engineering; Perruquetti, W., Barbot, J.P., Eds.; Marcel Dekker: New York, NY, USA, 2002. [Google Scholar]


Publisher’s Note: MDPI stays neutral with regard to jurisdictional claims in published maps and institutional affiliations. |
© 2020 by the authors. Licensee MDPI, Basel, Switzerland. This article is an open access article distributed under the terms and conditions of the Creative Commons Attribution (CC BY) license (http://creativecommons.org/licenses/by/4.0/).