Bedding Application to Feedlot Steers: Influence on Growth Performance, Estimated Maintenance Coefficient, Carcass Characteristics, and Circulating Metabolites in Beef Steers


Abstract
:Simple Summary
Abstract
1. Introduction
2. Materials and Methods
2.1. Use of Animal Subjects
2.2. Animal Description and Initial Processing
2.3. Experimental Design and Treatments
2.4. Dietary Management
2.5. Growth Performance Calculations and Carcass Data Collection
2.6. Blood Sample Collection
2.7. Serum Hormone and Metabolite Quantification
2.8. Management of Pulls and Removals
2.9. Statistical Analysis
3. Results
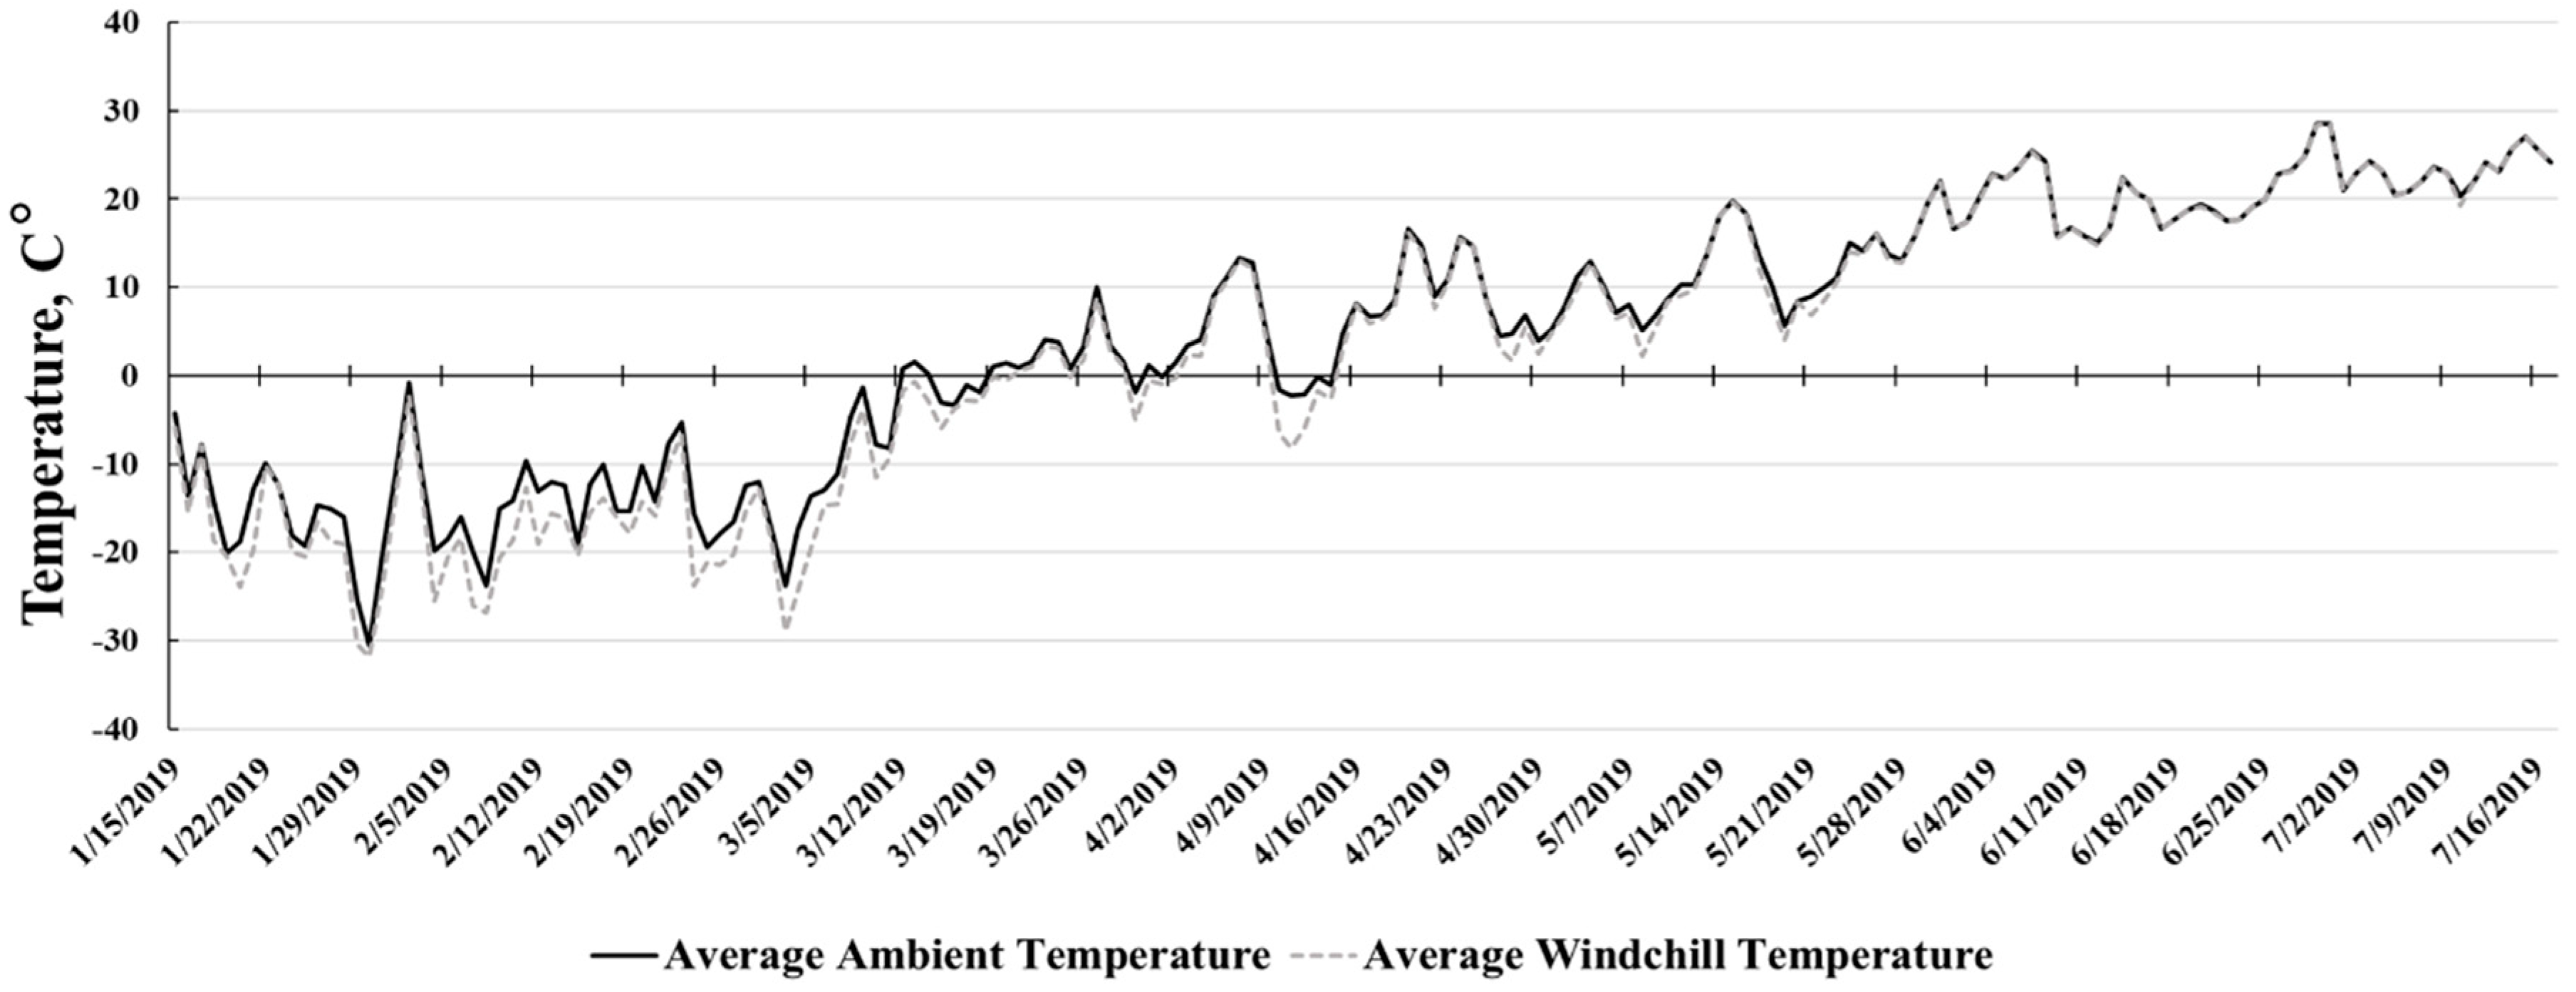
3.1. Weather
3.2. Growth Performance—Experiment 1
3.2.1. Initial—Day 1 to Day 36
3.2.2. Cumulative
3.2.3. Carcass Characteristics—Experiment 1
3.2.4. Serum Hormones and Metabolites—Experiment 1
3.3. Growth Performance—Experiment 2
3.3.1. Cumulative
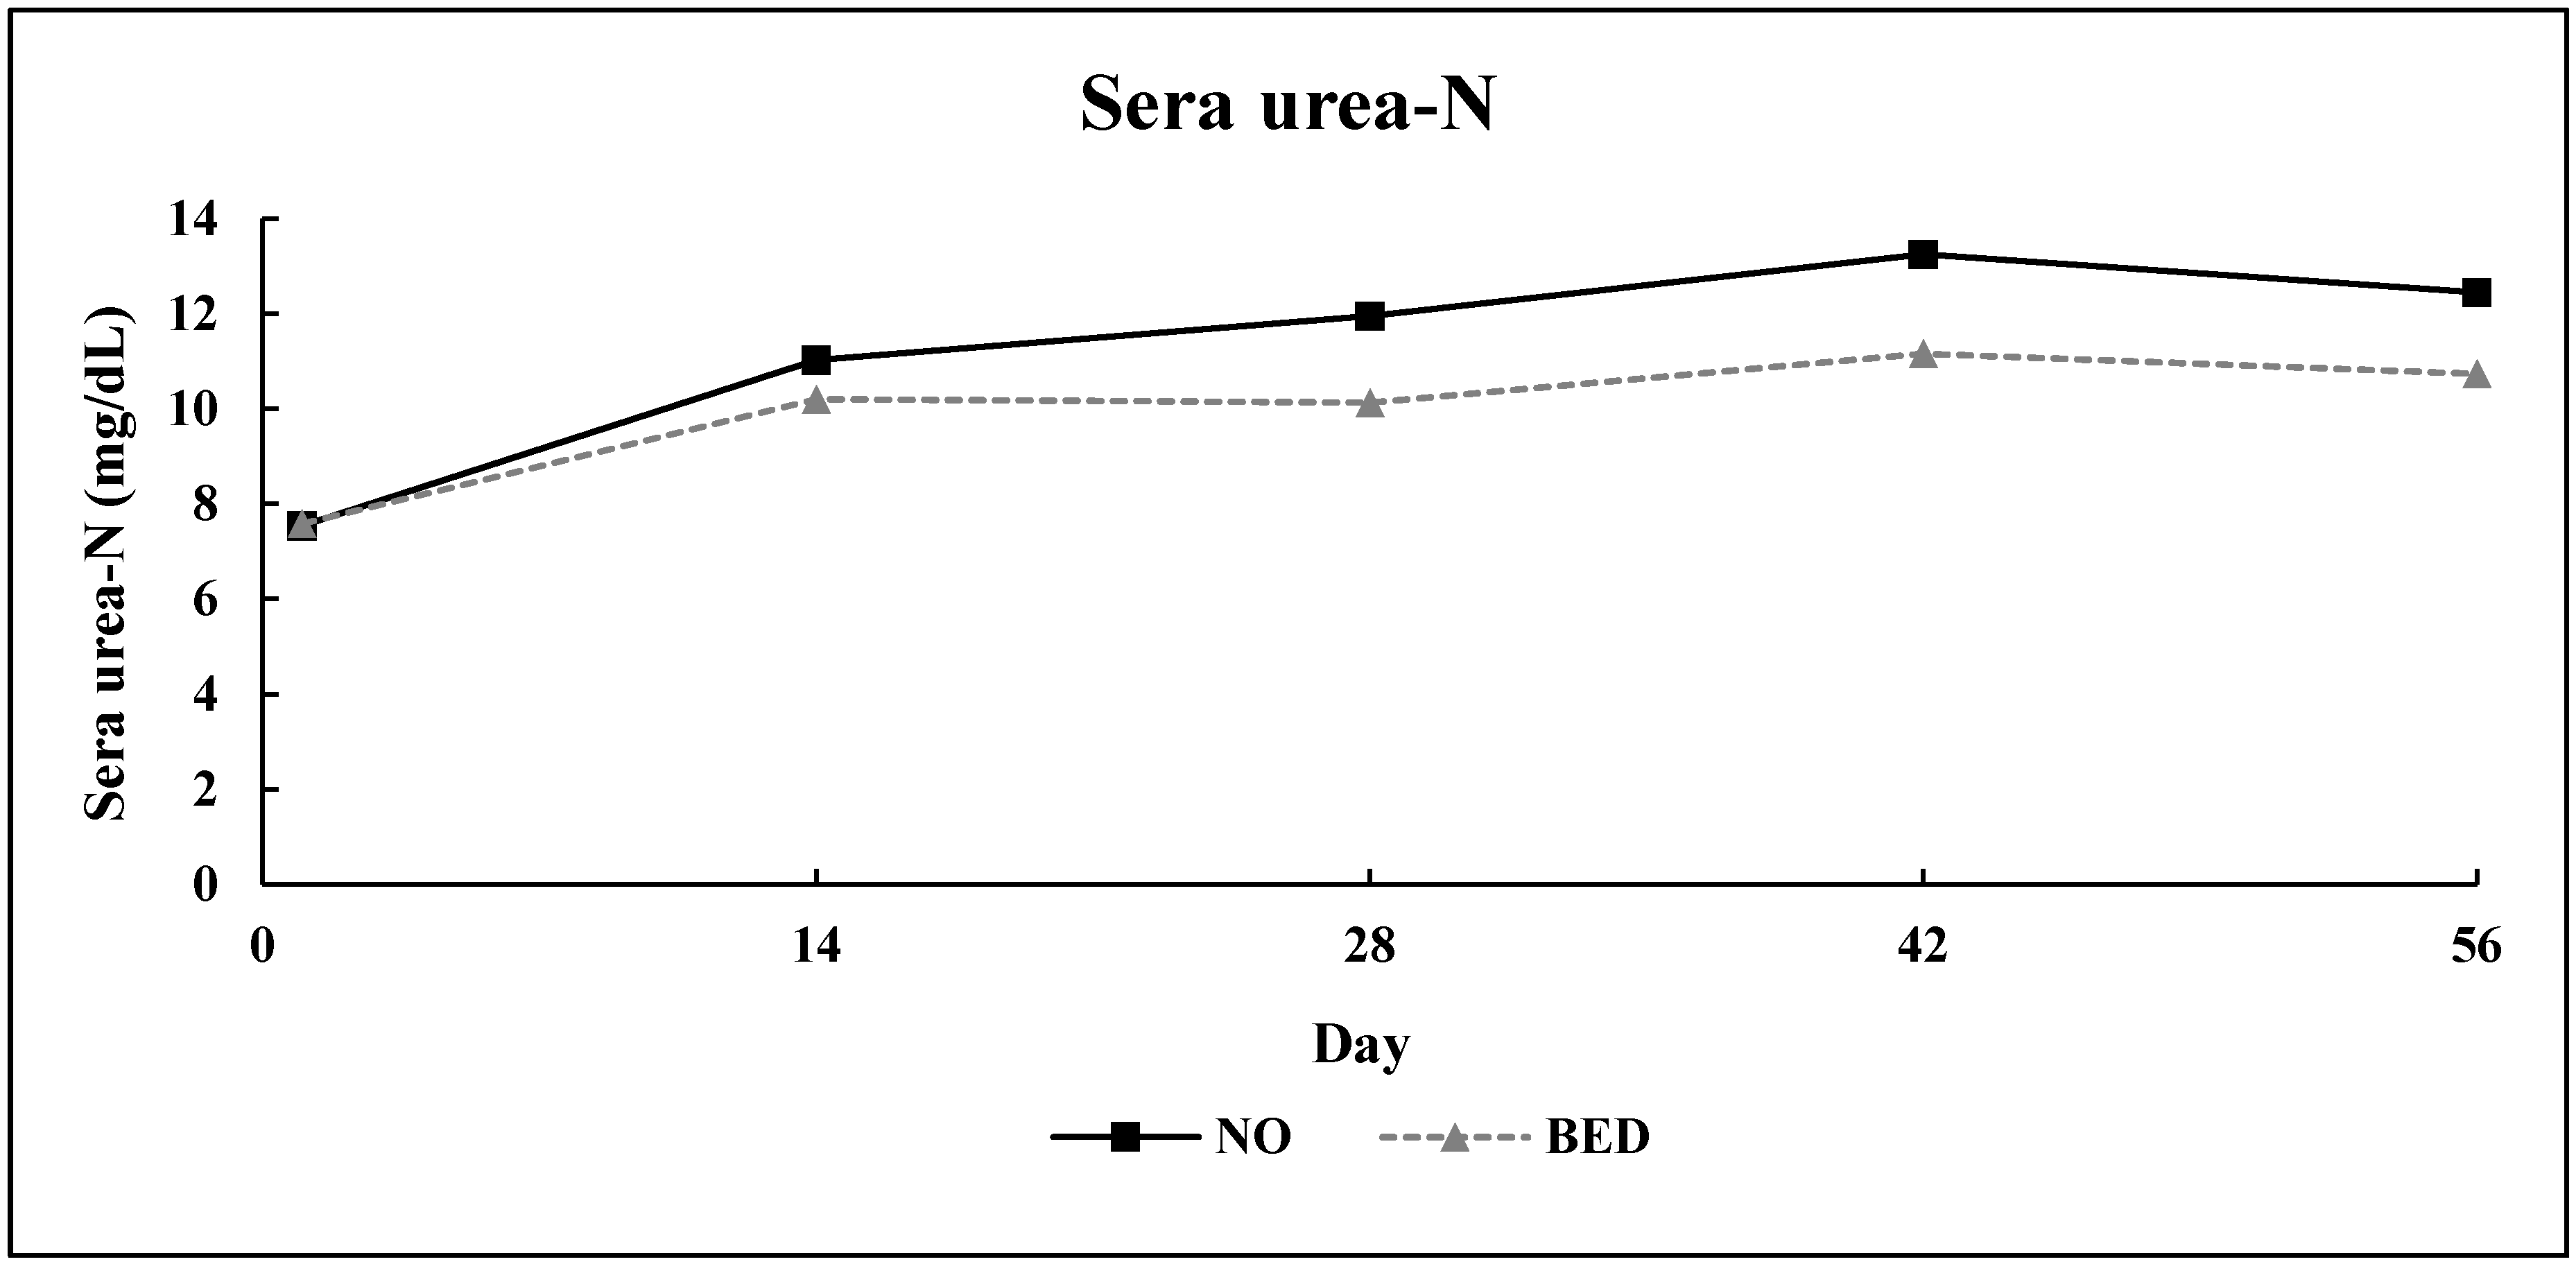
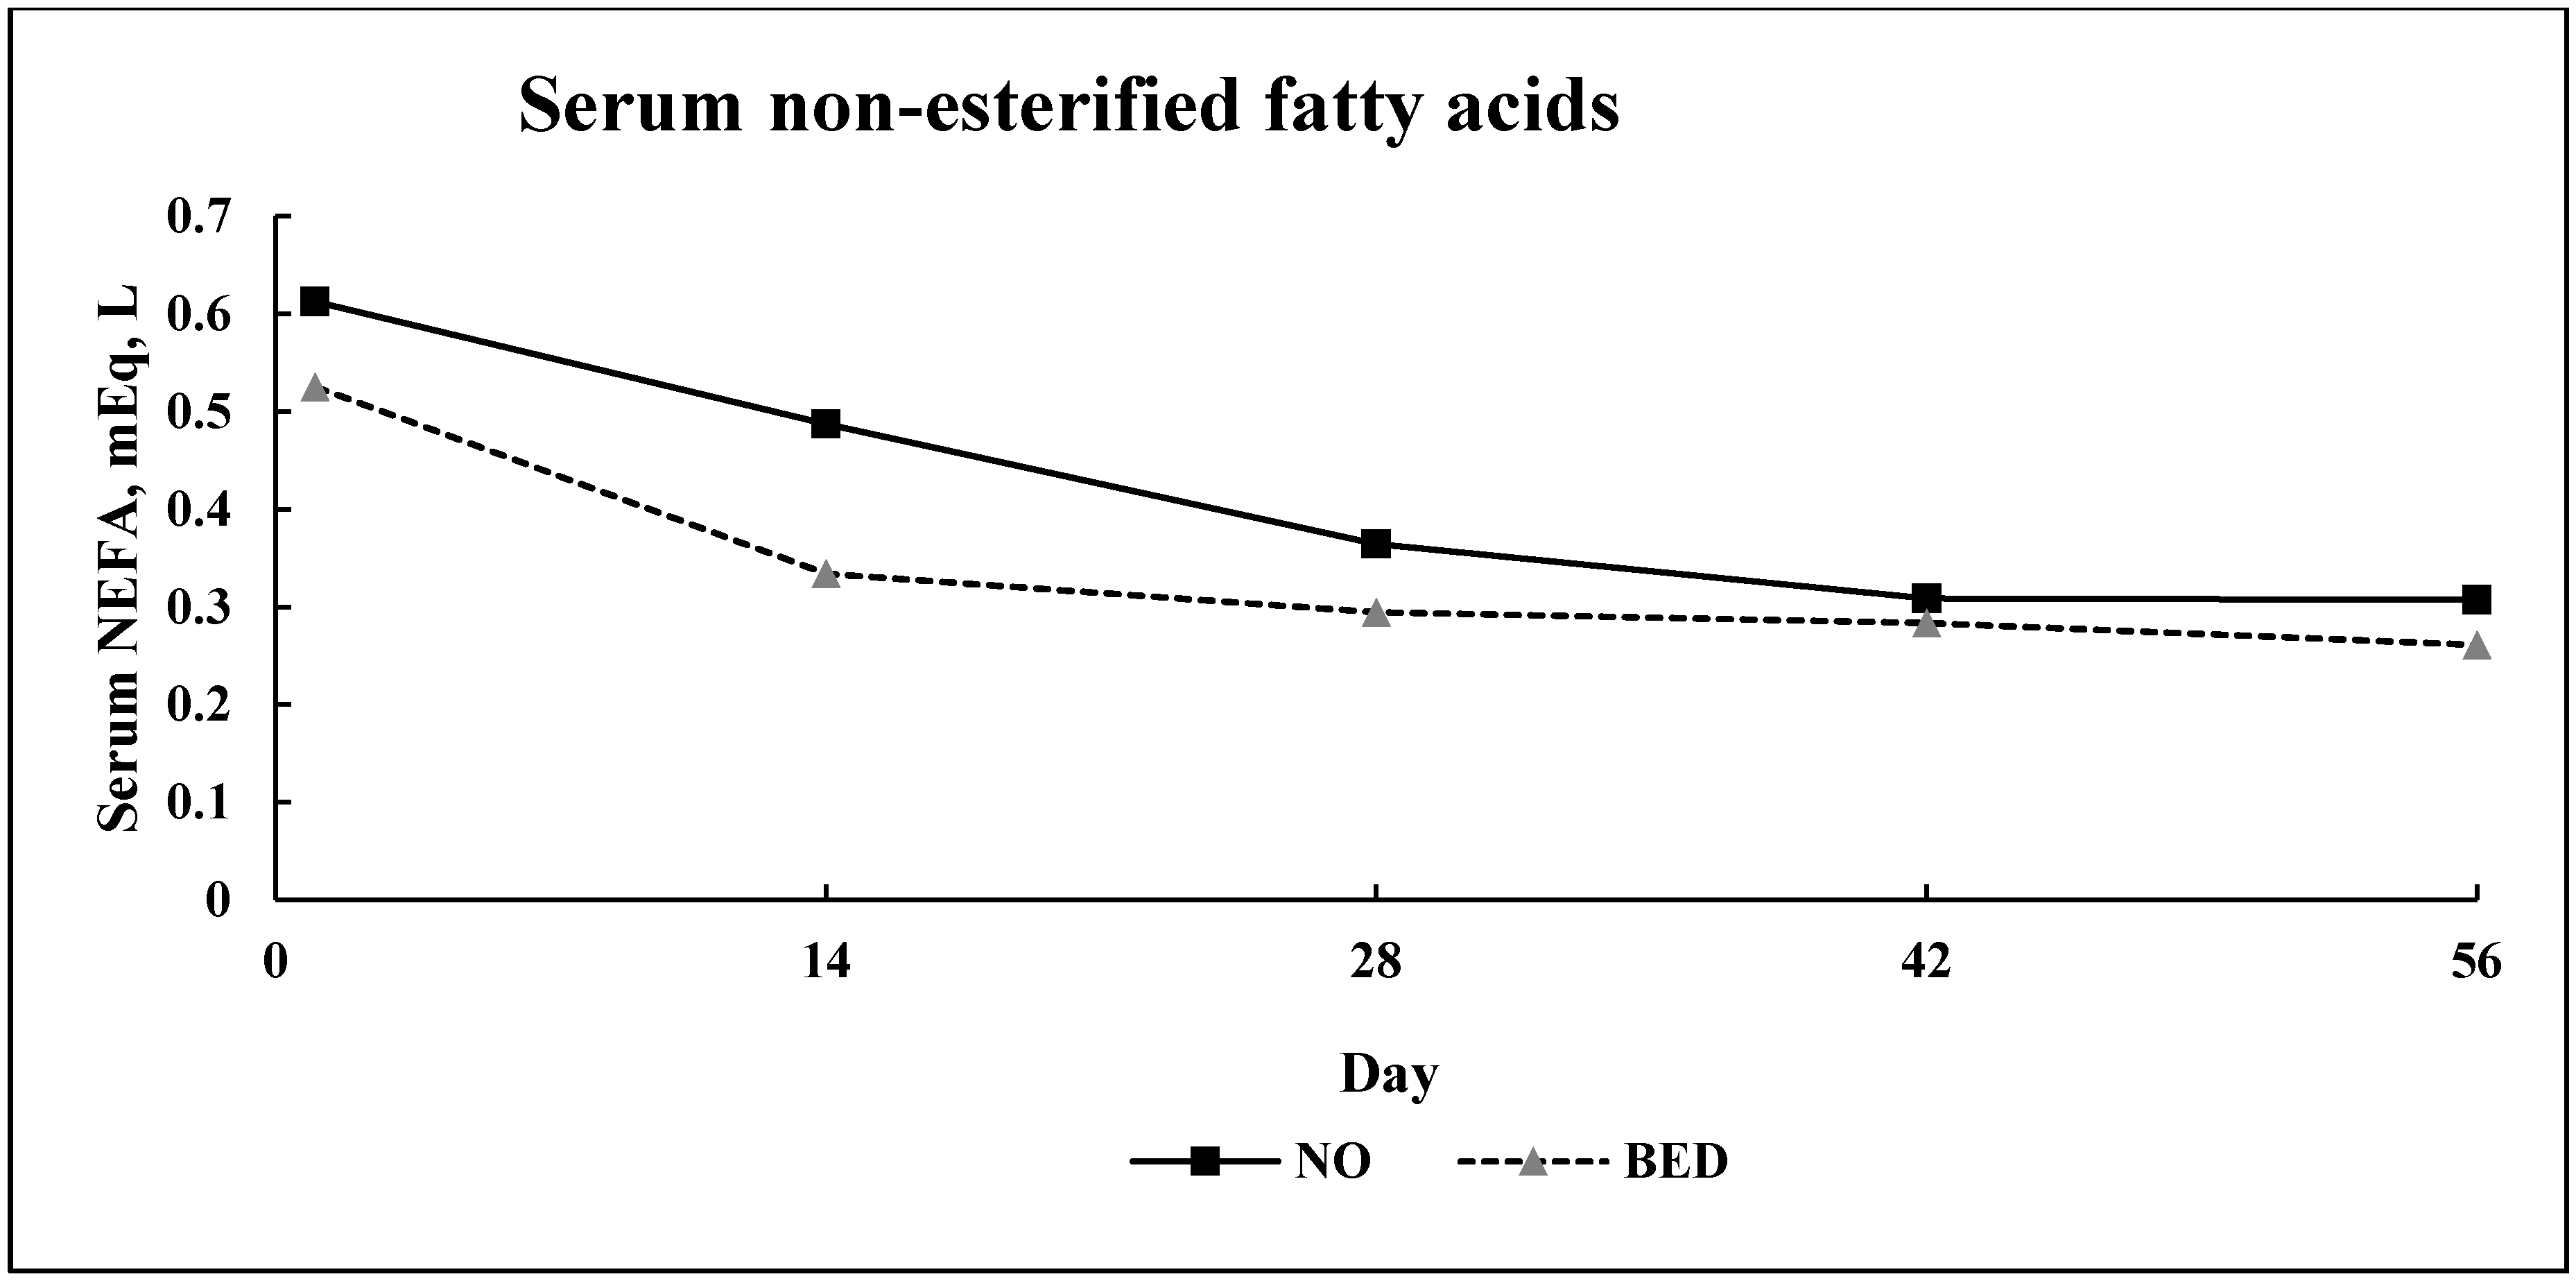
3.3.2. Serum Metabolites—Experiment 2
4. Discussion
4.1. Experiment 1
4.1.1. Growth Performance Day 1 to Day 36
4.1.2. Cumulative Growth Performance
4.1.3. Carcass Characteristics—Experiment 1
4.1.4. Serum Hormones and Metabolites—Experiment 1
4.2. Experiment 2
4.2.1. Growth Performance
4.2.2. Serum Metabolites
5. Conclusions
Author Contributions
Funding
Acknowledgments
Conflicts of Interest
References
- Young, B.A. Ruminant Cold Stress: Effect on Production. J. Anim. Sci. 1983, 57, 1601–1607. [Google Scholar] [CrossRef] [PubMed]
- Garrett, W.N. Factors Influencing Energetic Efficiency of Beef Production. J. Anim. Sci. 1980, 51, 1434–1440. [Google Scholar] [CrossRef]
- Birkelo, C.P.; Lounsberry, J. Effect of Straw and Newspaper Bedding on Cold Season Feedlot Performance in Two Housing Systems; South Dakota State University: Brookings, SD, USA, 1992. [Google Scholar]
- Stanton, T.L.; Schutz, D.N.; Anderson, D.C.; Guthrie, L.D. Effect of Bedding on Finishing Cattle Performance and Carcass Characteristics. Prof. Anim. Sci. 1994, 10, 153–155. [Google Scholar] [CrossRef]
- Anderson, V.L.; Wiederholt, R.J.; Schoonmaker, J.P. Effects of Bedding Feedlot Cattle during the Winter on Performance, Carcass Quality, and Nutrients in Manure; Carrington Research Extension Center Beef Report; Carrington Research Extension Center: Carrington, ND, USA, 2006. [Google Scholar]
- Mader, T.L.; Colgan, S.L. Pen Density and Straw Bedding During Feedlot Finishing Nebraska Beef Cattle Reports; University of Nebraska: Lincoln, NE, USA, 2007. [Google Scholar]
- Lofgreen, G.P.; Garrett, W.N. A system for expressing net energy requirements and feed values for growing and finishing beef cattle. J. Anim. Sci. 1968, 27, 793–806. [Google Scholar] [CrossRef]
- Blom, E.J. Receiving and Backgrounding Phase Management: The Effects of Receiving diet Roughage Source and Backgrounding Phase Rate of Gain on Performance of Feedlot Cattle. Ph.D. Thesis, Electronic Theses and Dissertations No. 3175. South Dakota State University, Brookings, SD, USA, 2019. [Google Scholar]
- Preston, R.L. 2016 Feed Composition Table. BEEF Mag. 2016. Available online: https://www.beefmagazine.com/sites/beefmagazine.com/files/2016-feed-composition-tables-beef-magazine.pdf (accessed on 1 June 2020).
- Goering, H.K.; Soest, P.J.V. Forage Fiber Analysis (Apparatus, Reagents, Procedures, and Some Application); Agric. Handbook 1970, No. 379; ARS, USDA: Washington, DC, USA, 1970.
- AOAC. Official Methods of Analysis, 15th ed.; Association of Official Analytical Chemists: Arlington, VA, USA, 1990. [Google Scholar]
- NASEM. Nutrient Requirements of Beef Cattle, 8th ed.; The National Academies Press: Washington, DC, USA, 2016. [Google Scholar]
- NRC. Nutrient Requirements of Beef Cattle, 6th ed.; The National Academies Press: Washington, DC, USA, 1984.
- NRC. Nutrient Requirements of Beef Cattle, 7th ed.; The National Academies Press: Washington, DC, USA, 1996.
- USDA. United States Standards for Grades of Carcass Beef; Agriculture Marketing Service USDA: Washington, DC, USA, 1997.
- Guiroy, P.; Tedeschi, L.; Fox, D.; Hutcheson, J. The effects of implant strategy on finished body weight of beef cattle. J. Anim. Sci. 2002, 80, 1791–1800. [Google Scholar] [CrossRef] [PubMed] [Green Version]
- Murphey, C.E.; Hallett, D.K.; Tyler, W.E.; Pierce, J.C. Estimating yields of retail cuts from beef carcass. Proc. Am. Soc. Anita. Prod. Chic. 1960, 19, 1240. [Google Scholar]
- Fawcett, J.K.; Scott, J.E. A rapid and precise method for the determination of Urea. J. Clin. Pathol. 1960, 13, 156–159. [Google Scholar] [CrossRef] [PubMed] [Green Version]
- Echternkamp, S.E.; Spicer, L.J.; Gregory, K.E.; Canning, S.F.; Hammond, J.M. Concentrations of Insulin-Like Growth Factor-I in Blood and Ovarian Follicular Fluid of Cattle Selected for Twins1. Biol. Reprod. 1990, 43, 8–14. [Google Scholar] [CrossRef] [PubMed]
- Funston, R.N.; Moss, G.E.; Roberts, A.J. Insulin-like growth factor-I (IGF-I) and IGF-binding proteins in bovine sera and pituitaries at different stages of the estrous cycle. Endocrinology 1995, 136, 62–68. [Google Scholar] [CrossRef] [PubMed]
- Daughaday, W.H.; Mariz, I.K.; Blethen, S.L. Inhibition of Access of Bound Somatomedin to Membrane Receptor and Immunobinding Sites: A Comparison of Radioreceptor and Radioimmunoassay of Somatomedin in Native and Acid-Ethanol-Extracted Serum. J. Clin. Endocrinol. Metab. 1980, 51, 781–788. [Google Scholar] [CrossRef] [PubMed]
- Lofgreen, G.P.; Dunbar, J.R.; Addis, D.G.; Clark, J.G. Energy Level in Starting Rations for Calves Subjected to Marketing and Shipping Stress. J. Anim. Sci. 1975, 41, 1256–1265. [Google Scholar] [CrossRef]
- Galyean, M.; Gunter, S.; Malcolm-Callis, K.; Garcia, D. Effects of Crude Protein Concentration in the Receiving Diet on Performance and Health of Newly Received Beef Calves; Clayton Livestock Research Center Progress Report; Clayton Livestock Research Center: Clayton, NM, USA, 1993. [Google Scholar]
- Wagner, J.J.; Grubb, P.T.; Engle, T.E. Case Study: The Effects of Severe Winter Weather on Net Energy for Maintenance Required by Yearling Steers. Prof. Anim. Sci. 2008, 24, 494–499. [Google Scholar] [CrossRef]
- Young, B.A. Cold Stress as it Affects Animal Production. J. Anim. Sci. 1981, 52, 154–163. [Google Scholar] [CrossRef] [PubMed]
- Birkelo, C.P.; Johnson, D.E.; Phetteplace, H.P. Maintenance requirements of beef cattle as affected by season on different planes of nutrition. J. Anim. Sci. 1991, 69, 1214–1222. [Google Scholar] [CrossRef] [PubMed]
- Mader, T.L. Environmental stress in confined beef cattle1. J. Anim. Sci. 2003, 81, E110–E119. [Google Scholar] [CrossRef]
- Westra, R.; Christopherson, R.J. Effects of cold on digestibility, retention time OF digesta, reticulum motility and thyroid hormones in sheep. Can. J. Anim. Sci. 1976, 56, 699–708. [Google Scholar] [CrossRef]
- Florini, J.R.; Ewton, D.Z.; Magri, K.A. Hormones, growth factors, and myogenic differentiation. Annu. Rev. Physiol. 1991, 53, 201–216. [Google Scholar] [CrossRef]


| Finisher 1 | Finisher 2 e | |
|---|---|---|
| Item | ||
| Dry-rolled corn, % | 69.70 | 70.33 |
| Dried distillers grains, % | 17.00 | 16.85 |
| Oatlage, % | 8.37 | - |
| Grass Hay, % | - | 7.89 |
| Liquid supplement b, % | 4.93 | 4.93 |
| Nutrient Composition f | ||
| Dry Matter, % | 77.50 | 85.26 |
| Crude Protein, % | 14.20 | 12.88 |
| Neutral detergent fiber, % | 16.60 | 17.76 |
| Acid detergent fiber, % | 6.84 | 7.14 |
| Ash, % | 5.25 | 5.30 |
| NEm c, Mcal/kg | 2.10 | 2.10 |
| NEg d, Mcal/kg | 1.40 | 1.40 |
| Item | |
|---|---|
| Corn Silage b | 63.69 |
| Dried distillers grains plus solubles | 20.31 |
| Grass Hay | 10.00 |
| Pelleted Supplement c | 6.00 |
| Soybean Meal | (3.777) |
| Soybean Hulls | (0.353) |
| Trace Mineralized Salt | (0.30) |
| Calcium Carbonate | (1.11) |
| Premix d | (0.072) |
| Nutrient Composition e | |
| Dry Matter, % | 41.99 |
| Crude Protein, % | 13.09 |
| Neutral detergent fiber (NDF), % | 40.00 |
| Acid detergent fiber (ADF), % | 28.17 |
| Ash, % | 6.29 |
| Net energy for maintenance (NEM), Mcal/kg | 1.74 |
| net energy for gain (NEG), Mcal/kg | 1.12 |
| Item | Bedding Treatment | SEM | p-Values | |
|---|---|---|---|---|
| NO | BED | |||
| Pens, n | 15 | 15 | - | - |
| Initial Growth Performance (d 1—36) | ||||
| Initial body weight (BW), kg | 365 | 365 | 0.4 | 0.95 |
| d 36 BW | 402 | 419 | 1.5 | 0.01 |
| Average daily gain (ADG), kg/day | 1.02 | 1.51 | 0.044 | 0.01 |
| Dry matter intake (DMI), kg/day | 8.19 | 8.22 | 0.047 | 0.57 |
| ADG/DMI, kg/kg | 0.124 | 0.185 | 0.0047 | 0.01 |
| Maintenance Coefficient, Mcal/W0.75 | 0.146 | 0.104 | 0.003 | 0.01 |
| Cumulative Growth Performance (d 1—harvest) | ||||
| Days on Feed | 178 | 143 | - | - |
| Final Shrunk BW, kg b | 575 | 569 | 2.0 | 0.07 |
| Average daily gain (ADG), kg/day | 1.18 | 1.43 | 0.019 | 0.01 |
| Dry matter intake (DMI), kg/day | 9.30 | 9.84 | 0.124 | 0.01 |
| ADG/DMI, kg/kg | 0.127 | 0.146 | 0.002 | 0.01 |
| Maintenance Coefficient, Mcal/W0.75 | 0.109 | 0.098 | 0.010 | 0.01 |
| Carcass Characteristics | ||||
| Dressing percentage, %c | 63.29 | 62.30 | 0.140 | 0.01 |
| Hot carcass weight (HCW), kg | 359 | 356 | 1.3 | 0.07 |
| Ribeye area, cm2 | 83.16 | 82.71 | 0.76 | 0.69 |
| Rib fat, cm | 1.20 | 1.09 | 0.02 | 0.01 |
| Marbling d | 475 | 437 | 6.6 | 0.01 |
| Estimated empty body fat, % e | 28.95 | 28.29 | 0.140 | 0.01 |
| Calculated yield grade | 2.95 | 2.81 | 0.045 | 0.03 |
| Retail yield, % f | 50.53 | 50.92 | 0.100 | 0.01 |
| Item | Bedding Treatment | SEM | p-Values | |
|---|---|---|---|---|
| NO | BED | |||
| Pens, n | 9 | 9 | - | - |
| Days on feed | 56 | 56 | - | - |
| Growth Performance (day 1–56) | ||||
| Initial body weight (BW), kg | 278 | 278 | 0.22 | 0.69 |
| Final Shrunk BW b | 353 | 355 | 2.2 | 0.70 |
| Average daily gain (ADG), kg/day | 1.36 | 1.38 | 0.04 | 0.67 |
| Dry matter intake (DMI), kg/day | 6.9 | 6.6 | 0.09 | 0.06 |
| ADG/DMI, kg/kg | 0.198 | 0.209 | 0.005 | 0.03 |
| Maintenance Coefficient, Mcal/W0.75 | 0.052 | 0.044 | 0.002 | 0.03 |
© 2020 by the authors. Licensee MDPI, Basel, Switzerland. This article is an open access article distributed under the terms and conditions of the Creative Commons Attribution (CC BY) license (http://creativecommons.org/licenses/by/4.0/).
Share and Cite
Smerchek, D.T.; Smith, Z.K. Bedding Application to Feedlot Steers: Influence on Growth Performance, Estimated Maintenance Coefficient, Carcass Characteristics, and Circulating Metabolites in Beef Steers. Animals 2020, 10, 1766. https://doi.org/10.3390/ani10101766
Smerchek DT, Smith ZK. Bedding Application to Feedlot Steers: Influence on Growth Performance, Estimated Maintenance Coefficient, Carcass Characteristics, and Circulating Metabolites in Beef Steers. Animals. 2020; 10(10):1766. https://doi.org/10.3390/ani10101766
Chicago/Turabian StyleSmerchek, Dathan Thomas, and Zachary Kidd Smith. 2020. "Bedding Application to Feedlot Steers: Influence on Growth Performance, Estimated Maintenance Coefficient, Carcass Characteristics, and Circulating Metabolites in Beef Steers" Animals 10, no. 10: 1766. https://doi.org/10.3390/ani10101766
APA StyleSmerchek, D. T., & Smith, Z. K. (2020). Bedding Application to Feedlot Steers: Influence on Growth Performance, Estimated Maintenance Coefficient, Carcass Characteristics, and Circulating Metabolites in Beef Steers. Animals, 10(10), 1766. https://doi.org/10.3390/ani10101766