Article

Effects of Different Dietary Vegetable Lipid Sources on Health Status in Nile Tilapia (Oreochromis niloticus): Haematological Indices, Immune Response Parameters and Plasma Proteome

by
Chatsirin Nakharuthai
1,
Pedro M. Rodrigues
2,
Denise Schrama
2,
Suksan Kumkhong
1 and
Surintorn Boonanuntanasarn
1,*
1
School of Animal Technology and Innovation, Institute of Agricultural Technology, Suranaree University of Technology, 111 University Avenue, Muang, Nakhon Ratchasima 30000, Thailand
2
Universidade do Algarve, Centro de Ciências do Mar do Algarve (CCMAR), Campus de Gambelas, Edificio 7, 8005-139 Faro, Portugal
*
Author to whom correspondence should be addressed.
Animals 2020, 10(8), 1377; https://doi.org/10.3390/ani10081377
Submission received: 11 July 2020 / Revised: 4 August 2020 / Accepted: 4 August 2020 / Published: 8 August 2020
(This article belongs to the Special Issue Proteomics in Veterinary Research and Zoonotic Diseases)

Abstract

:

Simple Summary

This study presents the effects of different dietary vegetable lipid sources (DLs) on several blood parameters, which may indicate the health status of Nile tilapia (Oreochromis niloticus). The tested DLs had no effects on haematological indices. However, the immune response analysis showed that DLs promoted immune systems via different processes. Dietary polyunsaturated fatty acids (PUFAs) increased expression of several proteins involved in coagulation activity, while saturated fatty acids (SFAs) might influence heme lipid-oxidation. Overall, different DLs had effects on several parameters corresponding to health status in Nile tilapia, and dietary PUFAs appear to promote health in this fish.

Abstract

This study aimed to investigate the effects of DLs, including palm oil (PO; an SFAs), linseed oil (LO; n-3 PUFAs) and soybean oil (SBO; n-6 PUFAs) on the health status of Nile tilapia (Oreochromis niloticus) during adulthood. Three experimental diets incorporating PO, LO or SBO were fed to adult Nile tilapia for a period of 90 days, and haematological and innate immune parameters were evaluated. Proteome analysis was also conducted to evaluate the effects of DLs on plasma proteins. The tested DLs had no significant effects on red blood cell (RBC) count, haematocrit, haemoglobin, and total immunoglobulin and lysozyme activity. Dietary LO led to increased alternative complement 50 activity (ACH50), and proteome analysis revealed that PO and SBO enhanced A2ML, suggesting that different DLs promote immune system via different processes. Dietary LO or SBO increased the expression of several proteins involved in coagulation activity such as KNG1, HRG and FGG. Increased HPX in fish fed with PO suggests that SFAs are utilised in heme lipid-oxidation. Overall, DLs with distinct fatty acids (FAs) affect several parameters corresponding to health status in Nile tilapia, and dietary LO and SBO seemed to strengthen health in this species.

1. Introduction

Dietary lipids (DLs) are important sources of metabolic energy, which provide essential fatty acids (FAs) and assist in carrying and absorbing fat-soluble vitamins. Adequate FAs is one of the most important factors influencing various biological processes, such as growth, reproduction and immune responses [1,2]. Furthermore, polar lipids and particularly phospholipids are the main components of the cellular membrane and are responsible for maintaining its flexibility and structure. Eicosanoids are molecules derived from 20-carbon (n-3 and n-6) Polyunsaturated fatty acids PUFAs. Eicosanoids consist of prostanoids, prostacyclins, thromboxanes and leukotrienes, which act as bioactive signalling lipids to regulate inflammation and immunity [1,3,4]. DLs have been shown to affect haematological parameters, such as red blood cell (RBC) number, the haematocrit and haemoglobin, which are essential in vertebrates, particularly in fish [5,6]. Lipids are involved in heme-driven oxidative stress [7]. The effects of DLs in both FA composition and the level of intake is related to blood coagulation [8]. DLs or FAs are; therefore, crucial for the correct functioning of a number of vital physiological processes, which significantly influence the health of vertebrates.
In inland aquaculture, tilapia is the second most important finfish species cultured worldwide, with Nile tilapia (Oreochromis niloticus) dominating global tilapia production. The global production of tilapia was reported to be 5.89 metric tonnes (mt) in 2016 [9] and is estimated to constitute 62% of total global aquaculture production in 2030 [10]. Nile tilapia is an omnivorous fish, which use carbohydrates as their primary energy source. However, DL are necessary to provide essential fatty acids (EFAs) for various physiological processes, in order to achieve normal growth and maintain their health status. For example, in Thailand, commercial diets for Nile tilapia, from fingerlings to marketable size, contain 4%–5% of DL, 31%–41% of carbohydrates and 25%–40% of protein. The recommended levels of DL are between 5% and 12%, and EFAs, including linolenic acid (C18:3n-3) and linoleic acid (C18:2n-6), are required for tilapia. In addition, the requirement for dietary n-6 PUFAs has been estimated at 0.5% to 1% [11]. Like other freshwater fish, Nile tilapia is able to synthesize n-6 LC-PUFAs and n-3 LC-PUFAs [12,13]. Therefore, incorporation of proper vegetable oil in diets for Nile tilapia is adequate without n-3 LC-PUFA supplementation, such as eicosapentaenoic acid (EPA) and docosahexaenoic acid (DHA). Extensively, most feed fats used from vegetable oils in aquaculture include palm oil (PO), soybean oil (SBO) and linseed oil (LO). Previous studies of Nile tilapia during adulthood have demonstrated that different DLs including saturated fatty acids (SFAs) in PO, n-6 PUFAs in SBO and n-3 PUFAs in LO result in normal growth with no sign of abnormalities. Nevertheless, more studies of health impact of DLs are required for further applications for benefits associated with DLs in Nile tilapia.
Recently, several molecular biology techniques have been applied to gain insight into the health impact of DLs. For example, the gene encoding delta-6 desaturase (fads2) was cloned in Nile tilapia, and was demonstrated to be able to convert linoleic acid (C18:2n-6) and α-linolenic acid (C18:3n-3) to gamma-linolenic acid (C18:3n-6) and stearidonic acid (C18:4n-3), respectively [14]. Evaluation of the expression of cyclooxygenase (cox-2) (overexpression) and eicosanoid receptor (ep4) (down-regulation) genes was used to reveal the inductive effect of SBO-based diet on inflammatory-like process in gut of Senegalese sole (Solea senegalensis) [15] In addition, epigenetic analysis was conducted to interpret that methylation in the promoter of fads2 in offspring was correlated with DL of broodstock [16]. In this study, a high-throughput proteomics technology was used to enable a comprehensive investigation into the biological processes affected by dietary intake of FAs. Proteomics is a useful tool in nutritional research as it can provide large-scale information on the effects of particular nutrients on physiologic and metabolic pathways [17,18,19]. Previous proteomic analysis of liver tissue revealed that different DLs, including SFAs, n-6 PUFAs and n-3 PUFAs, resulted in distinct protein expression in liver tissue. While dietary SFAs provide an energy source, dietary n-6 PUFAs and n-3 PUFAs appeared to be involved in sustaining normal health [18].
To determine how DLs influence the health status of Nile tilapia, we investigated the effects of palm oil (PO), linseed oil (LO) and soybean oil (SBO) on haematological and immune parameters. Growth also was determined. In addition, a comparative proteomic analysis of plasma was carried out to evaluate the effect of DLs on the overall health. Moreover, the effects of DL sources on mRNA levels corresponding to proteins identified as being significantly different in the proteome analysis were determined.

2. Materials and Methods

2.1. Experimental Design, Diet Formulation and Fish Culture

All experimental protocols were accepted by the Ethics Committee of Suranaree University of Technology, Animal Care and Use Committee (approval No. 1731050). In addition, organisms handling and subsequent procedures complied with European laws (2010/63/EU) and Portuguese legislation for the use of laboratory animals (DL n°113/2013, 7 August). Male tilapia (n = 120) (initial body weight 221.7–275.8 g) were maintained at Suranaree University of Technology (Nakhon Ratchasima, Thailand). Ten fish were randomly distributed into each of the 12 cement ponds (1.8 × 1.8 × 0.8 m3). Fish were acclimatised to the experimental conditions for two weeks and cultured under continuous aeration, and a flow-through water change system, implemented to replace one-third of the water in each pond with de-chlorinated water every week.
To test the effects of feed fats used in aquaculture, three different enriched DLs (PO, LO or SBO) diets were fed to fish, randomly allocated to the experimental ponds (four replicates per DLs treatment, n = 40). Table 1 shows the composition of the experimental diets. All feed ingredients were obtained from commercial companies and mixed to produce pelleted diets. The composition of moisture, crude protein, crude fat and ash content were determined following the standard methods [20]. The experimental feeds were stored at −20 °C until use. Fish were fed the experimental diet until satiety twice daily for 90 days. By the end of this period, weight gain, feed intake and survival rate were measured. Throughout the experimental period, ponds were kept at natural temperature (27–28 °C) and photoperiod, dissolved oxygen at 4.68–6.84 mg L1 and pH at 7.19–8.54.

2.2. Fish Sampling and Blood Collection

At the end of the experimental period (90 days), fish were starved for 17 h prior to sampling of blood, liver and muscle samples. Two fish per tank (n = 8 per treatment) were used for haematological indices and innate humoral parameters. Fish were euthanized with 2-phenoxyethanol (0.2%) and blood samples were collected from the caudal vein of fish using a 21-gauge needle and transferred into a tube containing 1% of 15%EDTA (v/v) for determination of haematological indices. Blood plasma for determination of humoral innate immune parameters was collected by centrifugation at 9000× g for 10 min at 4 °C. In addition, one fish from each tank (n = 4 per treatment) was collected for proteomic analysis and gene expression determination. Fish were euthanized, and blood was collected into a tube containing 1% of 15% EDTA (v/v). After centrifugation at 9000× g for 10 min at 4 °C, blood plasma was collected for proteome analysis. After bleeding, the liver and muscle were collected for qRT-PCR analysis. All samples were frozen first in liquid nitrogen and then kept at −80 °C until further use.

2.3. Haematological and Immune Assays

Immediately following the blood sampling, EDTA blood was used for analysis of haematological parameters. RBC count, haematocrit and haemoglobin were measured, following methods described by Tiengtam et al. [21]. Immune parameters, including total immunoglobulin, lysozyme activity and alternative complement haemolytic 50 (ACH50) activity, were also measured. Total immunoglobulin (Ig) was determined using a modified method previously described [22,23]; the total protein (Biuret method; Erba, Mannheim) was used for total Ig measurement. Briefly, 10 µl of diluted plasma was mixed with an equal volume of 12% PEG solution (polyethylene glycol, Sigma) in a 1.5 mL microcentrifuge tube. Incubation was performed at room temperature (25 °C) for 30 min and centrifuged at 3000× g for 5 min at 4 °C, to precipitate the immunoglobulin. Next, 4 µl of supernatant (non-Igs), diluted plasma (total protein) and standard bovine serum albumin (Sigma) were placed into a flat-bottomed 96-well plate in triplicate and protein content was determined following the manufacturer’s instructions. The optical density (OD) was read at 546 nm in a plate reader (BioTekTM EPOCH). Total Igs were calculated by subtraction of the total protein from non-Igs after precipitation. Protein concentrations were obtained from the standard curve made with bovine serum albumin.
Serum lysozyme activity was determined using a turbiditic assay as previously described [22,24] with some modifications. Briefly, different concentrations of lyophilized hen egg white lysozyme (0, 2.5, 5, 10, 15 and 20 µg mL−1) in 0.06 M phosphate citrate buffer, pH 6.0 were used as reference standards to construct a standard curve. Nile tilapia plasma (10 µL) and each concentration of standard lysozyme were added into wells of a flat-bottomed 96-well plate, in triplicate. To initiate enzymatic assay, a suspension of 190 µl of 0.2 mg/mL dried Micrococcus lysodeikticus (Sigma-Aldrich, Germany) cells was added into all the wells to a final volume of 200 µl per well. The reaction was carried out at room temperature (25 °C) and OD read at 450 nm at times 0 and 30 min. Nile tilapia lysozyme concentrations were quantified from a standard curve of known hen egg white concentrations.
ACH50 activity ACH50 was measured using the method of Milla et al. [25] with modifications. Briefly, goat red blood cells (GRBC) were used as targets at a final concentration of 5 × 10⁷ cells/mL. Triplicates of tested plasma (50 µL) as a complement source were 2-fold serial diluted in EGTA-GVB buffer (gelatin veronal buffered saline, 10 mM ethyleneglycol-bis (beta-amino-ethyl ether) N-N’-tetraacetate). Then, 50 μL of GRBC suspension was added to the diluted plasma and incubated for 90 min at room temperature (25 °C). Mixtures were then centrifuged at 3000× g for 10 min at 4 °C. The OD of the supernatant was read at 415 nm. The volume of complement causing 50% haemolysis (ACH50) of GRBCs was determined, and the number of ACH50 units/mL was calculated for each experimental group.

2.4. Plasma Proteome Analysis

2.4.1. Protein Preparation, Labelling and Two-Dimension Gel Electrophoresis

Protein quantifications were carried out with Quick StarTM. Bradford Protein Assay using bovine serum albumin (Bio-Rad Laboratories) as a standard. Plasma samples were diluted for concentration determination in DIGE lysis/labelling buffer containing 7 M urea, 2 M thiourea, 30 mM Tris0HCl (pH 8.5), 1 mM EDTA, 4% w/v CHAPS (3-((3-cholamidopropyl) dimethylammonio)-1-propanesulfonate), and 1% v/v protease inhibitor cocktail (Sigma-Aldrich Corporation, St. Louis, MO, USA). To perform DIGE minimal labelling, 50 µg of proteins (pH adjusted to 8.5 by addition of 0.3 M NaOH) of each sample were labelled with 400 pmol of fluorescent amine reactive cyanine dyes reconstituted in anhydrous dimethyl formamide, following the manufacturer’s instructions (5 nmol labelling kit, GE Healthcare, Little Chalfont, UK). Labelling was carried out according to a previously described method [18]. Samples were randomly labelled with Cy3 and Cy5 to prevent confounding of an eventual “dye effect” with the biological effect. As an internal control, equal quantities of protein from all samples were pooled and labelled with Cy2. Subsequently, a mixture of labelled proteins (50 µg) of one sample from each dietary treatment and 50 µg of internal standard were added in rehydration buffer (8 M urea, 2% w/v CHAPS, biolyte (pH 3-10) and 0.2% (w/v) dithiothreitol) to a final volume of 450 µL and then applied to 24 cm ImmobilineTM. Drystrip gels, pH 4-7 linear gradient (GE Healthcare). Subsequently, passive rehydration was performed for 15 h on 24 cm ImmobilineTM Drystrips (GE Healthcare, Little Chalfont, UK) with linear pH 4-7. Isoelectric focusing (IEF) was conducted in 5 steps: 500 V gradient 1 h, 500 V step-n-hold 1 h, 1000 V gradient 1 h, 8000 V gradient 3 h and 8000 V step-n-hold 5 h for a total of 60,265 Vhr using Ettan IPGphor at 20 °C (GE Healthcare, Little Chalfont, UK). Focused strips were reduced with 6 mL of equilibration buffer (50 mM Tris-HCl pH 8.8, 6 M urea, 30% (v/v) glycerol and 2% SDS) with 1% (w/v) dithiothreitol for 15 min in dark. Subsequently, the focused strips were alkylated with 6 mL of equilibration buffer with iodoacetamide (IAA) for 15 min in dark. For the second dimension, the strips were then loaded onto 12.5% Tris-HCl SDS-PAGE gels and ran in an Ettan DALTsix Large Vertical System (GE Healthcare, Little Chalfont, UK) at 10 mA/gel for 1 h followed by 60 mA/gel until the bromophenol blue line reaches the end of the gel in dark, using a standard Tris-Glycine-SDS running buffer.

2.4.2. Gel Image Acquisition and Analysis and Protein Identification by MALDI-TOF/TOF

Following electrophoresis, all gels were scanned with a Typhoon TrioTM Variable Mode Imager (GE Healthcare) using three laser emission filters (520BP40 for Cy2, 580BP30 for Cy3 and 670BP30 for Cy5) with a photomultiplier voltage of 540V, at a resolution of 100 µm. Image analysis was conducted using the SameSpotsTM software (Totallab, Newcastle-Upon-Tyne, UK). Significant different spots were detected using a one-way ANOVA followed by post-Hoc Tukey and exported as normalized volumes.
Protein spots showing a significant difference in expression between conditions were manually excised from Coomassie blue stained gels and identified at the GIGA proteomics facility (Liege, Belgium). Trypsin in gel digestion and purification of protein samples were performed according to [18]. Protein identification and tandem mass spectrometry (MSMS) analysis was performed on a MALDI-TOF-TOF-MS UltrafleXtreme (Bruker). Automatic spectra acquisition was piloted with the software Flex controlTM v 3.4 and real time analysis by Flex analysisTM v 3.4 (Bruker). Database searches were carried out in real time with BioToolsTM v 3.2 (Bruker) on the Mascot server v 2.2.06 (Matrix Science, Tokyo, Japan). A SwissProt database search was restricted to Actinopterygii taxonomies, with 100 ppm of mass error tolerance in MS and MSMS precursor and 0.3 Da tolerance on MSMS fragments. A second search was made with the same parameters on National Center for Biotechnology Information (NCBI) database, restricted to Actinopterygii taxonomies.

2.5. Quantitative Reverse Transcription Polymerase Chain Reaction (qRT-PCR) Analysis

2.5.1. Molecular Cloning of Genes

The expression of mRNA from the corresponding proteins was analysed using real-time quantitative reverse transcription polymerase chain reaction (qRT-PCR), to investigate whether the effects of DLs are also detectable at the transcript level. Total RNA was extracted from 100 mg of liver using Trizol® reagent (Invitrogen Corporation, Carlsbad, CA, USA) and RNase free DNase I (Promega Corporation, Madison, WI, USA) according to the manufacturer’s instructions. First strand cDNA was synthesized using the ImProm-IITM Reverse Transcription System kit (Promega Corporation). Table 2 shows the primers and the expected sizes of amplicons that were used for amplification of the partial cDNA of target genes. Reverse transcription polymerase chain reaction (RT-PCR) was performed in a total volume of 50 µl, which contained 200 μM of each dNTP, 5 pmol of each primer, 2.5 mM MgCl2, 1.0 × buffer Ex TaqTM, and 1.25 U Ex TaqTM (Takara Shuzo Co., Ltd., Shiga, Japan). For the PCR reaction, initial denaturation was conducted at 95 °C for 3 min followed by 40 reaction cycles, each consisting of a denaturation step at 95 °C for 30 s, annealing at 55–68 °C for 30 s, and extension at 72 °C for 45 s, with a final elongation step at 72 °C for 10 min. PCR products of the expected sizes were isolated and purified using the UltraCleanTM 15 DNA Purification Kit (MO Bio Laboratories, Solana Beach, CA, USA). The PCR-amplified DNA fragments were cloned into the pGEM® T-Easy plasmid (Promega Corporation). The plasmids were sequenced by Macrogen, Inc. (Seoul, Korea) and stored for further use as a standard for quantitative RT-PCR (qRT-PCR).

2.5.2. qRT-PCR Analysis Gene Expression

Total RNA was isolated from 100 mg of liver or muscle (four replicates per treatment), and cDNA was prepared as described above. qRT-PCR amplification (in duplicate) was carried out using LightCycler® 480 SYBR Green I Master Mix (Roche Applied Science, Indianapolis, IN, USA). The 18s rRNA mRNA was used as an internal reference for normalisation of data. The primers and annealing temperatures used in this study are shown in Table 2. In order to evaluate mRNA levels corresponding to proteins identified as being significantly different in the proteome analysis, the mRNA level of a2ml, kng1, hpx, fgg, hrg, cdh, c19orf53 and znf501 were quantitatively analysed as described in [18].

2.6. Statistical Analysis

All statistical analyses (growth rates, haematological and innate immune parameter and mRNA levels) were carried out using SPSS, v 12 (SPSS Inc., Chicago, IL, USA). A one-way analysis of variance was used followed by the post hoc Tuckey’s test on significant values, to rank the groups. Throughout the experiment, effects and differences were considered significant at p < 0.05. In addition, mean protein abundance was considered to be significantly different between dietary groups when q-value <0.05. Preliminary assessment of data quality was performed using a principal component analysis with auto scaling. Pearson’s correlation coefficient was performed to determine the relationship of the expression of the plasma protein abundance and its corresponding mRNA level in the liver or muscle.

3. Results

After the experimental period, weight gain and feed efficiency were not different (p > 0.05) between the experimental groups (Figure 1). The survival rate of all experimental groups was 100%. The effects of DLs on haematological indices and innate immune parameters are shown in Table 3. There were not differences in RBC counts, haemoglobin and haematocrit among experimental groups (p > 0.05). DLs did not significantly influence lysozyme activity or total immunoglobulin (p > 0.05). Fish fed dietary LO had significantly higher ACH50 levels (p < 0.05) (Table 3).
The proteomic analysis of plasma showed that a total of 1307 protein spots were detectable (pH gel range of 4–7). Thirty-nine protein spots were significantly different in their abundances between the different DLs (Figure 2A). PCA analysis of the significantly different proteins shows that three distinct clusters of plasma proteins were associated with different DLs (Figure 2B). Fourteen protein spots were excised from the gels and submitted for protein identification using MS. Subsequently, the Mascot search program was used to compare the mass of the peptide fragment against those in the Genbank database (https://www.ncbi.nlm.nih.gov/genbank/). Protein homologies from protein databases were identified for 4 spots (MS) and 7 (MSMS) spots that were modulated according to the PO, LO, and SBO diets (Figure 2C; Table 4; Table S1). Hierarchical clustering of proteins shows that the relative abundances of proteins were significantly different (p < 0.05) depending on the DL source (Figure 2D). Most of the identified proteins were involved in several biological processes including humoral innate immunity, coagulation, and transcription factors. Figure 3 shows the mean normalised values of the identified proteins, including alpha-2-macroglobulin-like (A2ML), kininogen-1-like isoform X1 (KNG1), Leydig cell tumour 10 kDa protein (C19orf53), histidine-rich glycoprotein-like (HRG), blastomere cadherin-like (CDH), zinc finger protein 501-like (ZNF501), fibrinogen gamma chain (FGG) and hemopexin-like (HPX), which were significantly different as a result of PO, LO, and SBO diets (p < 0.05). Note that, protein spots (spot no.459 and 477) and (spot No.400 and 886) were identified as CDH and HRG, respectively. In addition, uncharacterized protein was observed for protein spot 980.
In this study, qRT-PCR was carried out to determine the expression levels of transcripts in the liver and muscle, which had been identified from proteomics as being significant modulated by DLs (Table 5). There were significant correlations between hepatic mRNAs and plasma protein levels of c9orf53 (0.592; p = 0.043) and znf501 (0.579; p = 0.048). Our results showed that increased expression of hepatic kng1, hrg, cdh and znf501 were observed in fish fed PO. Elevation of muscular kng1, hpx and znf501 expression was founded in fish fed SBO or LO (p < 0.05). However, DLs had no effect on mRNA levels of a2ml, fgg and c19orf53 in either liver or muscle tissue (p > 0.05).

4. Discussion

DLs are important, not only for providing energy, but also for a number of biological processes. In poikilothermic animals, particularly fish, the nutritional requirement for FAs varies across species. Therefore, DLs, which contain different FAs, influence growth as well as have an impact on an organism’s health. DLs containing PO, SBO and LO contain different FA content, which has an effect on the liver proteome of fish fed the different DLs. Liver function is crucial for a range of vital physiological and metabolic functions [18]. In accordance with other studies, our results showed that DLs had no significant effects on growth, suggesting that the FA content in all experimental diets were adequate for the requirement of EFA for growth in Nile tilapia. In addition, this study examined the effects of DLs by demonstrating how different DL influenced haematological indices and humoral innate parameters. Furthermore, using a proteomic analysis of plasma, we provide evidence of how DL contributes to the health status of Nile tilapia. Although the functions of all the proteins detected are not fully determined, different DLs modulated several proteins that are associated with fish health including coagulation, immunity and oxidative stress. Our findings provide valuable information on the health impacts of DLs containing different FAs.
Haematological parameters are useful indicators of fish health and nutritional status. Several reports demonstrated that DLs had direct effects on membrane lipid composition of RBC which influenced RBC functions [26,27,28]. Our study showed that there were no significant differences in haematological parameters among experimental DL groups. These findings suggested that different DLs containing different composition of FAs had no detectable effects on haematological function in Nile tilapia during adult phase. Similarly, Nile tilapia fed different lipid sources such as LO, corn coil and beef tallow for 12 weeks showed no change in RBC numbers, haematocrit and haemoglobin levels [5]. In addition, Nile tilapia fed with different levels of DL (6%, 10% and 14%); a mixture of corn oil and menhaden fish oil, for 12 weeks showed no variation in these haematological parameters [6]. However, in Nile tilapia, dietary SBO for 60 days led to elevated haematocrit, when compared with fish fed dietary LO, corn oil, fish oil and olive oil [29]. Therefore, in Nile tilapia, different DLs (SFAs, n-6 PUFAs, n-3 PUFAs) have little effect on haematological parameters, and the extent of effect might depend on the duration of feeding.
The innate immune system is a fundamental defence system in fish, particularly humoral innate components [30]. In this study, we evaluated the effects of different DLs on several humoral immune-related parameters such as lysozymes, total immunoglobulin and plasma ACH50. Lysozymes are bacteriolytic enzymes with specific hydrolytic activity, which act against peptidoglycan of bacterial cell walls. Total immunoglobulin, which is a total protein related to immunoglobulin, has been an indicator of immune status in fish. ACH50 acts as a link between the innate and adaptive immune responses, promoting the ability of both antibodies and phagocytic cells to eliminate pathogenic bacteria, damaged cells and foreign cells [reviewed in 30]. Our results showed that although different DLs influenced neither lysozyme nor total immunoglobulin levels, adult fish fed LO had highest ACH50 compared to those fed the others. The positive effects of LO on innate immune response might be due to beneficial influence of n-3 PUFAs on cellular membrane of several immune cells [31], which consequently promote the secretion of humoral innate components. Indeed, DLs containing different FAs showed variable effects on the activities of these innate immune parameters. For instance, there were no significant differences in lysozyme levels in Nile tilapia fed different levels of fish oil and PO, but serum protein was significantly higher with increasing PO levels [32]. Different DLs (6%, 10% and 14%); a mixture of corn oil and menhaden fish oil had no significant effects on lysozyme activity in Nile tilapia. However, increased levels of lipid intake led to an increase in serum protein and decreased alternative complement activity [6]. Reductions in serum protein, lysozyme and natural haemolytic complement activities were measured in Nile tilapia fed beef tallow oil, which was deficient in both n-6 and n-3 PUFAs. Fish fed with different oils containing n-6 and n-3 PUFAs maintained higher levels of these immune parameters [5]. Different DLs (SBO, LO, corn oil, fish oil, olive oil) had no effects on alternative complement activity; however, dietary olive oil led to decreased lysozyme activity in Nile tilapia [29]. However, while dietary vegetable oil did not significant influence lysozyme activity, it significantly decreased alternative complement activity in Japanese seabass [33]. Overall, although DLs containing different FAs have variable effects on immune-related responses, depending on the fish species (most likely due to differences in feeding habits), both n-3 and n-6 PUFAs appear to promote these humoral innate immunity parameters.
Studying the proteomic profile in plasma is a valuable tool to investigate the effects of different DLs on the protein-related humoral immune system. A2ML is a major protease inhibitor in plasma and is involved in multiple physiological functions. One of its most important functions is related to humoral innate immunity [34], reviewed in [35]. Indeed, A2ML acts as the cytokine-binding protein in plasma [36]. Serum A2ML upregulation is involved in a metabolic disorder, which could potentially be used as a clinical marker in subjects with diabetes [37]. A proteome analysis comparing fish oil to dietary LO showed a higher expression level of A2ML in the Chinese mitten crab (Eriocheir sinensis) after feeding with LO [38]. In contrast, the proteomic analysis presented here shows that dietary PO and SBO increase plasma A2ML levels compared to LO. Despite these contradictory results, proteome analysis has revealed that DLs influence A2ML, and the effects are variable between organisms. In Nile tilapia, dietary n-6 PUFAs and SFAs led to increased plasma levels of A2ML, which would affect humoral innate immunity.
By studying proteomics in plasma, we were also able to investigate the effects of different DLs on other physiological processes, which also influence health status. Our findings demonstrated that different DLs modulated several plasma proteins involved in coagulation and heme-lipid oxidation. For instance, three proteins, which were significantly affected by DLs, were demonstrated as key factors associated with coagulation activity; FGG, KNG1 and HRG. FGG is a gamma component of fibrinogen. Mutations of this protein can lead to hypofibrinogenemia [39]. Kininogen is essential for blood coagulation. Previous investigations demonstrated that high fat feeding decreased kininogen content in the liver of mice, and different FAs differentially regulate expression of kininogen [40,41]. Histidine-rich glycoprotein (HRG) is capable of binding to a wide range of ligands and are able to modulate various biological processes such as blood coagulation, fibrinolysis, antimicrobial activity and innate immune systems [42,43]. This study found that dietary LO and PO led to an increase in FGG in plasma. In addition, fish fed dietary SBO and LO had higher kininogen and HRG compared to those fed PO. Hemopexin (HPX) is a glycoprotein in plasma which binds to free heme and; therefore, plays an important role in detoxifying heme and lipid oxidation [44]. Plasma HPX level is; therefore, an important biomarker for inflammatory and oxidative stress [45,46]. Our results showed that dietary PO increased plasma HPX levels. This suggests that dietary SFAs lead to increased HPX levels in plasma, indicating that HPX is necessary to attenuate heme lipid-oxidative capacity by SFAs. These findings suggest that all lipid sources might influence coagulation pathways. Both n-3 and n-6 PUFAs appear to promote health in Nile tilapia, compared with SFAs, via elevation of coagulation proteins and lowering of heme lipid-oxidative capacities.
Proteome analysis also showed that a number of proteins related to several biological processes were modulated by different DLs. For instance, zinc finger proteins are involved in various biological processes including transcriptional regulation, DNA recognition and lipid binding. In addition, zinc finger proteins are involved in the Golgi morphology and function [47] and interaction of zinc finger protein with lipids facilitates several biological processes. For example, several zinc finger proteins such as zbtb20 and ZNF202 are associated with lipid metabolism [48,49]. Leydig cell tumour protein homolog (c19orf53) is associated with various biological pathways, such as rRNA biogenesis, ovarian cancer and replication of Zika virus [50,51,52]. Cadherins are transmembrane proteins which play an important role in cell-cell adhesion, morphogenesis and maintenance of cellular structure [53,54]. Our observations showed that dietary PO and LO significantly increased plasma ZNF501 and c19orf53. In addition, dietary SBO led to an increase in blastomere cadherin-like. Similarly, gamma-linolenic acid was reported to induce expression of E-cadherin in human cancer cells, and a reduction in E-cadherin was observed in DHA-treated cell lines [55,56]. These findings suggest that SFAs, n-6 PUFAs and n3-PUFAs are associated with various biological processes via these proteins, which warrant further investigation.
In addition to the findings related to the comparative proteomic analysis, this study demonstrated the effect of different DLs on the expression of genes in liver and muscle that were identified from the proteome. Our results showed that the expression levels of mRNAs in liver and muscle, and levels of proteins in the plasma were not correlated, with the exception of c19orf53 and znf501. Indeed, dissimilar transcription of genes and protein abundances is in agreement with the findings of previous studies [57,58]. The distinct patterns of mRNA and protein levels are potentially due to the sampling time after induction [59], which results in different levels of transcripts and translated protein. In addition, the plasma protein levels might be translated from other tissues which is a presentation of whole-body protein expression, not only liver and muscle. Moreover, the half-life of mRNA in particular tissues, and variable post-translational processes might partly explain the differences between mRNA and its corresponding protein levels.

5. Conclusions

While different DLs had no effects on haematological parameters, all DLs increased humoral immune processes, via A2ML and/or ACH50. Our findings also raise hypotheses for further investigation that both n-6 and n-3 PUFAs appeared to promote coagulation activity via the increase of FGG, KNG1 and HRG. In addition, SFAs appear to be involved in heme lipid-oxidation (as indicated by HPX expression). Therefore, different lipid sources, which include distinct FAs have an impact on several parameters related to the health status of Nile tilapia.

Supplementary Materials

The following are available online at https://www.mdpi.com/2076-2615/10/8/1377/s1, Table S1: Predicted biological functions of the identified proteins.

Author Contributions

Conceptualization, S.B. and P.M.R.; methodology, C.N., S.K. and D.S.; validation, D.S. and S.B.; data curation, S.B. and P.M.R.; writing—original draft preparation, C.N. and S.B.; writing—review and editing, S.B. and P.M.R.; supervision, P.M.R. Please turn to the CRediT taxonomy for the term explanation. Authorship must be limited to those who have contributed substantially to the work reported. All authors have read and agreed to the published version of the manuscript.

Funding

This study was co-supported by grants from the Thailand Research Fund Co funding with Suranaree University of Technology (RSA5882252) and the Higher Education Research Promotion and National Research University Project of Thailand, Office of the Higher Education Commission. The work was also supported by national funds from FCT - Foundation for Science and Technology through project UIDB/04326/2020 and Operational Human Potential Programmes.

Acknowledgments

We gratefully acknowledge Sunai Plymee (SUT Farm) for their technical help throughout this work.

Conflicts of Interest

The authors declare no conflict of interest.

References

  1. Tocher, D.R. Metabolism and Functions of Lipids and Fatty Acids in Teleost. Rev. Fish Sci. 2003, 11, 107–184. [Google Scholar] [CrossRef]
  2. De Pablo, M.A.; Álvarez De Cienfuegos, G.A. Modulatory effects of dietary lipids on immune system functions. Immunol. Cell Biol 2000, 78, 31–39. [Google Scholar] [CrossRef] [PubMed]
  3. Arts, M.T.; Kohler, C.C. Health and condition in fish: The influence of lipids on membrane competency and immune response. In Lipids in Aquatic Ecosystems; Arts, M.T., Brett, M.T., Kainz, M.J., Eds.; Springer: New York, NY, USA, 2009; pp. 237–256. ISBN 978-0-387-89366-2. [Google Scholar]
  4. Dennis, E.A.; Norris, P.C. Eicosanoid Storm in Infection and Inflammation. Nat. Rev. Immunol. 2015, 15, 511–523. [Google Scholar] [CrossRef] [PubMed] [Green Version]
  5. Yildirim-Aksoy, M.; Lim, C.; Davis, D.A.; Shelby, R.; Klesius, P.H. Influence of Dietary Lipid Sources on the Growth Performance, Immune Response and Resistance of Nile Tilapia, Oreochromis niloticus, to Streptococcus iniae Challenge. J. Appl. Aquac. 2007, 19, 29–49. [Google Scholar] [CrossRef]
  6. Lim, C.; Yildirim-Aksoy, M.; Li, M.H.; Welker, T.L.; Klesius, P.H. Influence of dietary levels of lipid and vitamin E on growth and resistance of Nile tilapia to Streptococcus iniae challenge. Aquaculture 2009, 298, 76–82. [Google Scholar] [CrossRef]
  7. Papuc, C.; Goran, G.V.; Predescu, C.N.; Nicorescu, V. Mechanisms of Oxidative Processes in Meat and Toxicity Induced by Postprandial Degradation Products: A Review. Compr. Rev. Food Sci. Food Saf. 2017, 16, 96–123. [Google Scholar] [CrossRef]
  8. Miller, G.J. Effects of diet composition on coagulation pathways. Am. J. Clin. Nutr. 1998, 67, 542S–545S. [Google Scholar] [CrossRef] [Green Version]
  9. Rakocy, J.E. Cultured Aquatic Species Information Programme. Oreochromis niloticus. Cultured Aquatic Species Information Programme; FAO Fisheries and Aquaculture Department: Rome, Italy, 18 February 2005; [Cited 27 June 2020]. [Google Scholar]
  10. FAO. The State of World Fisheries and Aquaculture 2018 - Meeting the sustainable development goals. Rome. Licence: CC BY-NC-SA 3.0 IGO.
  11. Lim, C.; Yildirim-Aksoy, M.; Klesius, P.H. Lipid, Fatty Acid Requirements of Tilapia. N. Am. J. Aquac. 2011, 73, 188–193. [Google Scholar] [CrossRef]
  12. Olsen, R.E.; Henderson, R.J.; McAndrew, B.J. The conversion of linoleic acid and linolenic acid to longer chain polyunsaturated fatty acids by Tilapia (Oreochromis) nilotica in vivo. Fish Physiol. Biochem. 1990, 8, 261–270. [Google Scholar] [CrossRef]
  13. Tocher, D.R. Fatty acid requirements in ontogeny of marine and freshwater fish. Aquac. Res. 2010, 41, 717–732. [Google Scholar] [CrossRef]
  14. Tanomman, S.; Ketudat-Cairns, M.; Jangprai, A.; Boonanuntanasarn, S. Characterization of fatty acid delta-6 desaturase gene in Nile tilapia and heterogenous expression in Saccharomyces cerevisiae. Comp. Biochem. Physiol. Part B 2013, 166, 148–156. [Google Scholar] [CrossRef] [PubMed]
  15. Montero, D.; Torrecillas, S.; Benítez-Dorta, V.; Caballero, M.J.; Izquierdo, M.S.; Zamorano, M.J. Effects of dietary vegetable oils on the expression of eicosanoid receptors genes in Senegalese sole (Solea senegalensis) intestine. Aquaculture Rep. 2019, 15, 100201. [Google Scholar] [CrossRef]
  16. Turkmen, S.; Perera, E.; Zamorano, M.J.; Simó-Mirabet, P.; Xu, H.; Pérez-S#xE1;nchez, J.; Izquierdo, M. Effects of Dietary Lipid Composition and Fatty Acid Desaturase 2 Expression in Broodstock Gilthead Sea Bream on Lipid Metabolism-Related Genes and Methylation of the fads2 Gene Promoter in Their Offspring. Int. J. Mol. Sci. 2019, 20, 6250. [Google Scholar] [CrossRef] [PubMed] [Green Version]
  17. Richard, N.; Silva, T.S.; Wulff, T.; Schrama, D.; Dias, J.P.; Rodrigues, P.M.L.; Conceicao, L.E.C. Nutritional mitigation of winter thermal stress in gilthead seabream: Associated metabolic pathways and potential indicators of nutritional state. J. Proteomics 2016, 142, 1–14. [Google Scholar] [CrossRef] [Green Version]
  18. Boonanuntanasarn, S.; Nakharuthai, C.; Schrama, D.; Duangkaewa, R.; Rodrigues, P.M. Effects of dietary lipid sources on hepatic nutritive contents, fatty acid composition and proteome of Nile tilapia (Oreochromis niloticus). J. Proteomics 2019, 192, 208–222. [Google Scholar] [CrossRef]
  19. Schrama, D.; Cerqueira, M.; Raposo, C.S.; da Costa, A.M.R.; Wulff, T.; Gonçalves, A.; Camacho, C.; Colen, R.; Fonseca, F.; Rodrigues, P.M. Dietary Creatine Supplementation in Gilthead Seabream (Sparus aurata): Comparative Proteomics Analysis on Fish Allergens, Muscle Quality, and Liver. Front. Physiol. 2018, 9. [Google Scholar] [CrossRef] [Green Version]
  20. AOAC (Ed.) AOAC Official methods of Analysis. In Association of Official Analytical Chemists, 14th ed.; AOAC: Arlington, VA, USA, 1990. [Google Scholar]
  21. Tiengtam, N.; Khempaka, S.; Paengkoum, P.; Booanuntanasarn, S. Effects of inulin and Jerusalem artichoke (Helianthus tuberosus) as prebiotic ingredients in the diet of juvenile Nile tilapia (Oreochromis niloticus). Anim. Feed Sci. Technol. 2016, 207, 120–129. [Google Scholar] [CrossRef]
  22. Pitaksong, T.; Kupittayanant, P.; Boonanuntanasarn, S. The effects of vitamins C and E on the growth, tissue accumulation and prophylactic response to thermal and acidic stress of hybrid catfish. Aquac Nutr 2013, 19, 148–162. [Google Scholar] [CrossRef]
  23. Siwicki, A.K.; Anderson, D.P. Nonspecific defence mechanisms assay in fish. II. Potential killing activity of neutrophils and macrophages, lysozyme activity in serum and organs and total immunoglobulin (T- Ig) levels in serum. In Fish Diseases Diagnosis and Prevention’s Methods; FAO-Project GCP/INT/526/JPN; IFI: Olsztyn, Poland, 1993; pp. 105–112. [Google Scholar]
  24. Siwicki, A.K.; Studnicka, M. The phagocytic activity of neutrophils and serum lysozyme activity in experimentally infected carp, Cyprinus carpio L. J. Fish Biol. 1987, 31, 57–60. [Google Scholar] [CrossRef]
  25. Milla, S.; Mathieu, C.; Wang, N.; Lambert, S.; Nadzialek, S.; Massart, S.; Henrotte, E.; Douxfils, J.; Mélard, C.; Mandiki, S.N.M.; et al. Spleen immune status is affected after acute handling stress but not regulated by cortisol in Eurasian perch, Perca fluviatilis. Fish Shellfish Immunol. 2010, 28, 931–941. [Google Scholar] [CrossRef]
  26. Ricci, S.; Patoia, L.; Berrettini, M.; Binaglia, L.; Bucaneve, G.; Vecchini, A.; Carloni, I.; Carloni, I.; Agostini, L.; Parise, P. Fatty acid pattern of red blood cell membranes and risk of ischemic brain infarction: A case-control study. Stroke 1987, 18, 575–578. [Google Scholar] [CrossRef] [PubMed] [Green Version]
  27. Dougherty, R.M.; Galli, C.; Ferro-Luzzi, A.; Iacono, J.M. Lipid and phospholipid fatty acid composition of plasma, red blood cells, and platelets and how they are affected by dietary lipids: A study of normal subjects from Italy, Finland, and the USA. Am. J. Clin. Nutr. 1987, 45, 443–455. [Google Scholar] [CrossRef] [PubMed]
  28. Revskij, D.; Haubold, S.; Viergutz, T.; Kröger-Koch, C.; Tuchscherer, A.; Kienberger, H.; Rychlik, M.; Tröscher, A.; Hammon, H.M.; Schuberth, H.J.; et al. Dietary Fatty Acids Affect Red Blood Cell Membrane Composition and Red Blood Cell ATP Release in Dairy Cows. Int. J. Mol. Sci. 2019, 20, 2769. [Google Scholar] [CrossRef] [Green Version]
  29. Ferreira, M.W.; Costa, D.V.d.; Leal, C.A.G.; Figueiredo, H.C.P.; Rosa, P.V. Dietary oil sources on the innate immunity and resistance of Nile tilapia, Oreochromis niloticus, to Streptococcus agalactiae challenge. J. World Aquacult. Soc. 2015, 46, 252–262. [Google Scholar] [CrossRef]
  30. Secombes, C.J.; Wang, T. The innate and adaptive immune system of fish. In Infectious Disease in Aquaculture; Austin, B., Ed.; Woodhead Publishing: Cambridge, UK, 2012; pp. 3–68. [Google Scholar]
  31. Gutiérrez, S.; Svahn, S.L.; Johansson, M.E. Effects of Omega-3 Fatty Acids on Immune Cells. Int. J. Mol. Sci. 2019, 20, 5028. [Google Scholar] [CrossRef] [Green Version]
  32. Ayisi, C.L.; Zhao, J.; Wu, J.W. Replacement of fish oil with palm oil: Effects on growth performance, innate immune response, antioxidant capacity and disease resistance in Nile tilapia (Oreochromis niloticus). PLoS ONE 2018, 13, e0196100. [Google Scholar] [CrossRef] [Green Version]
  33. Tan, P.; Dong, X.; Xu, H.; Mai, K.; Ai, Q. Dietary Vegetable Oil Suppressed Non-Specific Immunity and Liver Antioxidant Capacity but Induced Inflammatory Response in Japanese Sea Bass (Lateolabrax Japonicus). Fish Shellfish Immunol. 2017, 63, 139–146. [Google Scholar] [CrossRef]
  34. Borth, W. Alpha 2-macroglobulin, a multifunctional binding protein with targeting characteristics. FASEB J. 1992, 6, 3345–3353. [Google Scholar] [CrossRef]
  35. Rehman, A.A.; Ahsan, H.; Kahn, F.H. Alpha-2-Macroglobulin: A physiological guardian. J. Cell. Physiol. 2013, 228, 1665–1675. [Google Scholar] [CrossRef]
  36. Borth, W.; Luger, T.A. Identification of Alpha 2-macroglobulin as a Cytokine Binding Plasma Protein. Binding of interleukin-1 Beta to “F” Alpha 2-macroglobulin. J. Biol. Chem. 1989, 264, 5818–5825. [Google Scholar]
  37. do Nascimento, O.V.; Lima-Neto, A.B.M.; van Tilburg, M.F.; de Oliveira Monteiro-Moreira, A.C.; Lobo, M.D.P.; Rondina, D.; Fernandes, V.O.; Montenegro, A.P.D.R.; Montenegro, R.M. Proteomic analysis to identify candidate biomarkers associated with type 1 diabetes. Diabetes Metab Syndr Obes. 2018, 11, 289–301. [Google Scholar] [CrossRef] [PubMed] [Green Version]
  38. Wei, B.; Yang, Z.; Cheng, Y.; Wang, J.; Zhou, J. Effects of the complete replacement of fish oil with linseed oil on growth, fatty acid composition, and protein expression in the Chinese mitten crab (Eriocheir sinensis). Proteome Sci. 2018, 16. [Google Scholar] [CrossRef] [PubMed]
  39. Wypasek, E.; Klukowska, A.; Zdziarska, J.; Zawilska, K.; Treliński, J.; Iwaniec, T.; Mital, A.; Pietrys, D.; Sydor, W.; Neerman-Arbez, M.; et al. Genetic and clinical characterization of congenital fibrinogen disorders in Polish patients: Identification of three novel fibrinogen gamma chain mutations. Thromb. Res. 2019, 182, 133–140. [Google Scholar] [CrossRef] [PubMed]
  40. Zhao, A.; Lew, J.L.; Huang, L.; Yu, J.; Zhang, T.; Hrywna, Y.; Thompson, J.R.; de Pedro, N.; Blevins, R.A.; Pelaez, F.; et al. Human kininogen gene is transactivated by the farnesoid X receptor. J. Biol. Chem. 2003, 278, 28765–28770. [Google Scholar] [CrossRef] [Green Version]
  41. Khan, S.A.; Wollaston-Hayden, E.E.; Markowski, T.W.; Higgins, L.A.; Mashek, D.G. Quantitative analysis of the murine lipid droplet-associated proteome during diet-induced hepatic steatosis. J. Lipid Res. 2015, 56, 2260–2272. [Google Scholar] [CrossRef] [Green Version]
  42. Blank, M.; Shoenfeld, Y. Histidine-rich glycoprotein modulation of immune/autoimmune, vascular, and coagulation systems. Clin. Rev. Allergy Immunol. 2008, 34, 307–331. [Google Scholar] [CrossRef]
  43. Priebatsch, K.M.; Poon, I.K.H.; Patel, K.K.; Kvansakul, M.; Hulett, M.D. Divalent metal binding by histidine-rich glycoprotein differentially regulates higher order oligomerisation and proteolytic processing. FEBS Lett. 2017, 591, 164–176. [Google Scholar] [CrossRef] [Green Version]
  44. Hahl, P.; Hunt, R.; Bjes, E.S.; Skaff, A.; Keightley, A.; Smith, A. Identification of oxidative modifications of hemopexin and their predicted physiological relevance. J. Biol. Chem. 2017, 292, 13658–13671. [Google Scholar] [CrossRef] [Green Version]
  45. Lin, T.; Sammy, F.; Yang, H.; Thundivalappil, S.; Hellman, J.; Tracey, K.J.; Warren, H.S. Identification of hemopexin as an anti-inflammatory factor that inhibits synergy of hemoglobin with HMGB1 in sterile and infectious inflammation. J. Immunol. 2012, 189, 2017–2022. [Google Scholar] [CrossRef] [Green Version]
  46. Montecinos, L.; Eskew, J.D.; Smith, A. What Is Next in This “Age” of Heme-Driven Pathology and Protection by Hemopexin? An Update and Links with Iron. Pharmaceuticals 2019, 12, 144. [Google Scholar] [CrossRef] [Green Version]
  47. Serebrenik, Y.V.; Hellerschmied, D.; Toure, M.; López-Giráldez, F.; Brookner, D.; Crews, C.M. Targeted protein unfolding uncovers a Golgi-specific transcriptional stress response. Mol. Biol. Cell 2018, 29, 1284–1298. [Google Scholar] [CrossRef] [PubMed]
  48. Liu, G.; Zhou, L.; Zhang, H.; Chen, R.; Zhang, Y.; Li, L.; Lu, J.Y.; Jiang, H.; Liu, D.; Qi, S. Regulation of hepatic lipogenesis by the zinc finger protein Zbtb20. Nat. Commun. 2017, 8, 14824. [Google Scholar] [CrossRef] [PubMed] [Green Version]
  49. Wagner, S.; Hess, M.A.; Ormonde-Hanson, P.; Malandro, J.; Hu, H.; Chen, M.; Kehrer, R.; Frodsham, M.; Schumacher, C.; Beluch, M.; et al. A broad role for the zincfinger protein ZNF202 in human lipid metabolism. J. Biol. Chem. 2000, 275, 15685–15690. [Google Scholar] [CrossRef] [PubMed] [Green Version]
  50. Bertomeu, T.; Coulombe-Huntington, J.; Chatr-aryamontri, A.; Bourdages, K.G.; Coyaud, E.; Raught, B.; Xia, Y.; Tyersa, M. A High-Resolution Genome-Wide CRISPR/Cas9 Viability Screen Reveals Structural Features and Contextual Diversity of the Human Cell-Essential Proteome. Mol. Cell. Biol. 2018, 38, e00302-17. [Google Scholar] [CrossRef] [Green Version]
  51. Zhang, Q.; Burdette, J.E.; Wang, J.P. Integrative network analysis of TCGA data for ovarian cancer. BMC Syst. Biol. 2014, 8, 1338. [Google Scholar] [CrossRef] [Green Version]
  52. Kong, W.; Hayashi, T.; Fiches, G.; Xu, Q.; Li, M.; Que, J.; Liu, S.; Zhang, W.; Qi, J.; Santoso, N.; et al. Diversified Application of Barcoded PLATO (PLATO-BC) Platform for Identification of Protein Interactions. Genom. Proteomics Bioinform. 2019, 17, 319–331. [Google Scholar] [CrossRef]
  53. Maitre, J.L.; Heisenberg, C.P. Three Functions of Cadherins in Cell Adhesion Review. Curr. Biol. 2013, 23, R626–R633. [Google Scholar] [CrossRef] [Green Version]
  54. Ivanov, D.B.; Philippova, M.P.; Tkachuk, V.A. Structure and Functions of Classical Cadherins. Biochemistry 2001, 66, 1174–1186. [Google Scholar] [CrossRef]
  55. Jiang, W.G.; Hiscox, S.; Horrobin, D.F.; Hallett, M.B.; Mansel, R.E.; Puntis, M.C. Expression of Catenins in Human Cancer Cells and Its Regulation by n-6 Polyunsaturated Fatty Acids. Anticancer Res. 1995, 15, 2569–2573. [Google Scholar]
  56. Zou, Z.; Bellenger, S.; Massey, K.A.; Nicolaou, A.; Geissler, A.; Bidu, C.; Bonnotte, B.; Pierre, A.S.; Minville-Walz, M.; Rialland, M.; et al. Inhibition of the HER2 pathway n-3 polyunsaturated fatty acids prevents breast cancer infat-1 transgenic mice. J. Lipid Res. 2013, 54, 3453–3463. [Google Scholar] [CrossRef] [Green Version]
  57. Gygi, S.P.; Rochon, Y.; Franza, B.R.; Aebersold, R. Correlation between protein and mRNA Abundance in yeast. Mol. Cell. Biol. 1999, 19, 1720–1730. [Google Scholar] [CrossRef] [PubMed] [Green Version]
  58. Haider, S.; Pal, R. Integrated analysis of transcriptomic and proteomic data. Curr. Genom. 2013, 14, 91–110. [Google Scholar] [CrossRef] [PubMed]
  59. Liu, Y.; Beyer, A.; Aebersold, R. On the Dependency of Cellular Protein Levels on mRNA Abundance. Cell 2016, 165, 535–550. [Google Scholar] [CrossRef] [PubMed] [Green Version]
Figure 1. Growth performance including weight gain, specific growth rate and feed efficiency of Nile tilapia fed experimental diets containing palm oil (PO), linseed oil (LO) or soybean oil (SBO) for 90 days. Note that there were no significant differences in growth parameters among experimental diets (p > 0.05). Weight gain = final body weight – initial body weight. Feed efficiency = wet weight gain/dry feed fed.
Animals 10 01377 g001
Figure 2. Different abundance of plasma protein identified by 2D-DIGE analysis in Nile tilapia fed experimental diets for 90 days. (A) Plasma proteins were separated in pH 4–7 IPG strips for the first dimension and 12.5% polyacrylamide gel electrophoresis for the second dimension. An internal standard in all gels comprised of an equal concentration of proteins from all samples which was labelled with Cy2. Protein spots that show significant differences in abundance between dietary lipids (DLs) are indicated (p < 0.05); (B) principal component analysis of plasma proteins for each of 12 fish fed DLs including dietary PO (source of SFAs), LO (source of n3-PUFAs) or SBO (source of n6-PUFAs); (C) differential abundance of identified protein spots as a result of DLs; (D) heat map construction of a hierarchical cluster of 11 proteins that were significant differently according to feeding with different DLs (see Table 4 for protein names of each labelled protein spot).
Animals 10 01377 g002
Figure 3. Differential abundance of proteins identified in the plasma of Nile tilapia fed experimental diets containing palm oil (PO), linseed oil (LO) or soybean oil (SBO) for 90 days. Proteins were identified and categorized according to their biological functions: immune, inflammatory and coagulation response; cytoskeleton-related; and miscellaneous biochemical pathways. Note that similar differential abundance of two spots for CDH and HRG were observed. Black bars show the mean normalized value of each protein. Different letters denote significant differences in the abundance of each protein spot between experimental fish fed dietary lipids (p < 0.05).
Animals 10 01377 g003
Table 1. Feed ingredients and chemical composition of the experimental diets containing palm oil (PO), linseed oil (LO) or soybean oil (SBO).
Ingredient (%)Diet
POLOSBO
Casein32.032.032.0
Gelatin6.06.06.0
Palm oil10.0--
Linseed oil-10.0-
Soybean oil--10.0
Dextrin30.030.030.0
Dicalcium phosphate1.01.01.0
Premix 14.04.04.0
Carboxymethyl cellulose2.02.02.0
Alpha-cellulose15.015.015.0
Proximate composition (%)
Dry matter81.381.581.8
Crude protein28.328.328.3
Crude lipid10.710.410.6
Crude fibre2.72.82.8
Crude Ash3.23.33.3
Nitrogen-free extract 236.436.736.8
1 Vitamin and trace mineral mix provided the following (IU kg−1 or g kg−1 diet): Biotin, 0.25 g; folic acid, 0.003 g; inositol, 0.25 mg; niacin, 0.0215 g; pantothenic acid, 0.03 g; vitamin A, 5000 IU; vitamin B1, 0.0025 g; vitamin B2, 0.0012 g; vitamin B6, 0.0075 g; vitamin B12 0.00005 mg; vitamin C, 1 g; vitamin D3, 1000 IU; vitamin E, 100 IU; vitamin K, 0.008 g; copper, 0.02 g; iron, 0.2 g; selenium, 0.3 mg; zinc, 0.32 g. 2 Nitrogen-free extract = dry matter (crude protein + crude lipid + crude fibre + ash).
Table 2. Primers used for quantification of relative gene transcript expression, annealing temperature used for qRT-PCR reaction and expected amplicon sizes.
Gene Transcript Name (Abbreviation)GenBank Accession Number 5′ to 3′ Nucleotide Sequences1Annealing Temperature (°C)Expected Amplicon Size (bp)
CDHXM_005465470.25′-AGGCCAAAGATGATGATGAGCCAG-3′
5′-TCCCGCCATATCTGCTGCTTGTAC-3′
58200
FGGXP_013129545.15′-GTTTCTACTTCGGTGGAGATGCAG-3′
5′-GCAGCATGACATCTGTTCATCCAC-3′
55109
HPXXP_003440941.15′-CCTCAAGGAGAGTGCATTACCGAC-3′
5′-GAACCTGGTGAAGTTGTGTCCATG-3′
60198
A2MLXP_005461528.15′-GGAAGAGGACCAGGAAACACTTGG-3′
5′-ACACCACCCTTCATTCTGTTGTTG-3′
55187
KNG1XP_005464291.15′-TGCCACAGCTACATCTTCACCCTC-3′
5′-GGCTTCAAAGCTTTCCAGGGCTTG-3′
55162
HRGXP_005475829.15′-GATGGTGATGCCACCATAACCA-3′
5′-CGTCCCACTTCCTTCAAGATGTAG-3′
58202
ZNF501XM_005477455.25′-CTGAAGAGACACATGGCACTTCAC-3′
5′-CCTGTGTGAACTCTGATGTGCGTC-3′
58198
C19orf53XM_003455758.45′-CGAAGAAAGGAGGGAGGATCATTG-3′
5′-TTAATCACACTCAGCGGCTTGTGG-3′
55157
1 The first row of the sequence denotes the forward primer, and the second row is the reverse primer.
Table 3. Haematological and immune parameters of Nile tilapia fed experimental diets containing palm oil (PO), linseed oil (LO) or soybean oil (SBO) for 90 days. Means with different superscripts in each column differ significantly from each other (p < 0.05; one-way ANOVA).
ParametersDiet
POLOSBO
Haematological parameters
RBC1 (cells × 106 µL−1)1.7 ± 0.22.3 ± 0.32.0 ± 0.4
Haemoglobin (g dL−1)8.9 ± 0.59.7 ± 1.38.8 ± 0.6
Haematocrit (%)29.1 ± 0.531.6 ± 3.929.1 ± 1.3
Immune parameters
Lysozyme activity (µg mL−1)11.32 ± 1.1612.34 ± 0.7311.73 ± 0.60
Total immunoglobulin (mg L−1)2.89 ± 0.312.57 ± 0.132.58 ± 0.34
ACH502 (units mL−1)94.82 ± 11.19 a128.20 ± 17.37 b105.02 ± 26.92 ab
1 RBC = red blood cell number; 2ACH50 = alternative complement haemolytic 50.
Table 4. Differential protein spots in the plasma of Nile tilapia fed experimental diets for 90 days.
Spot
No.
Protein
[Species]
Entry Name (Uniprot)Mascot ScoreGI
Number a
Mwt/pIt b (Mwe/pIe c)Sequence
Coverage (%)
Number of Matched
Peptides
Best Peptide Match: Sequence
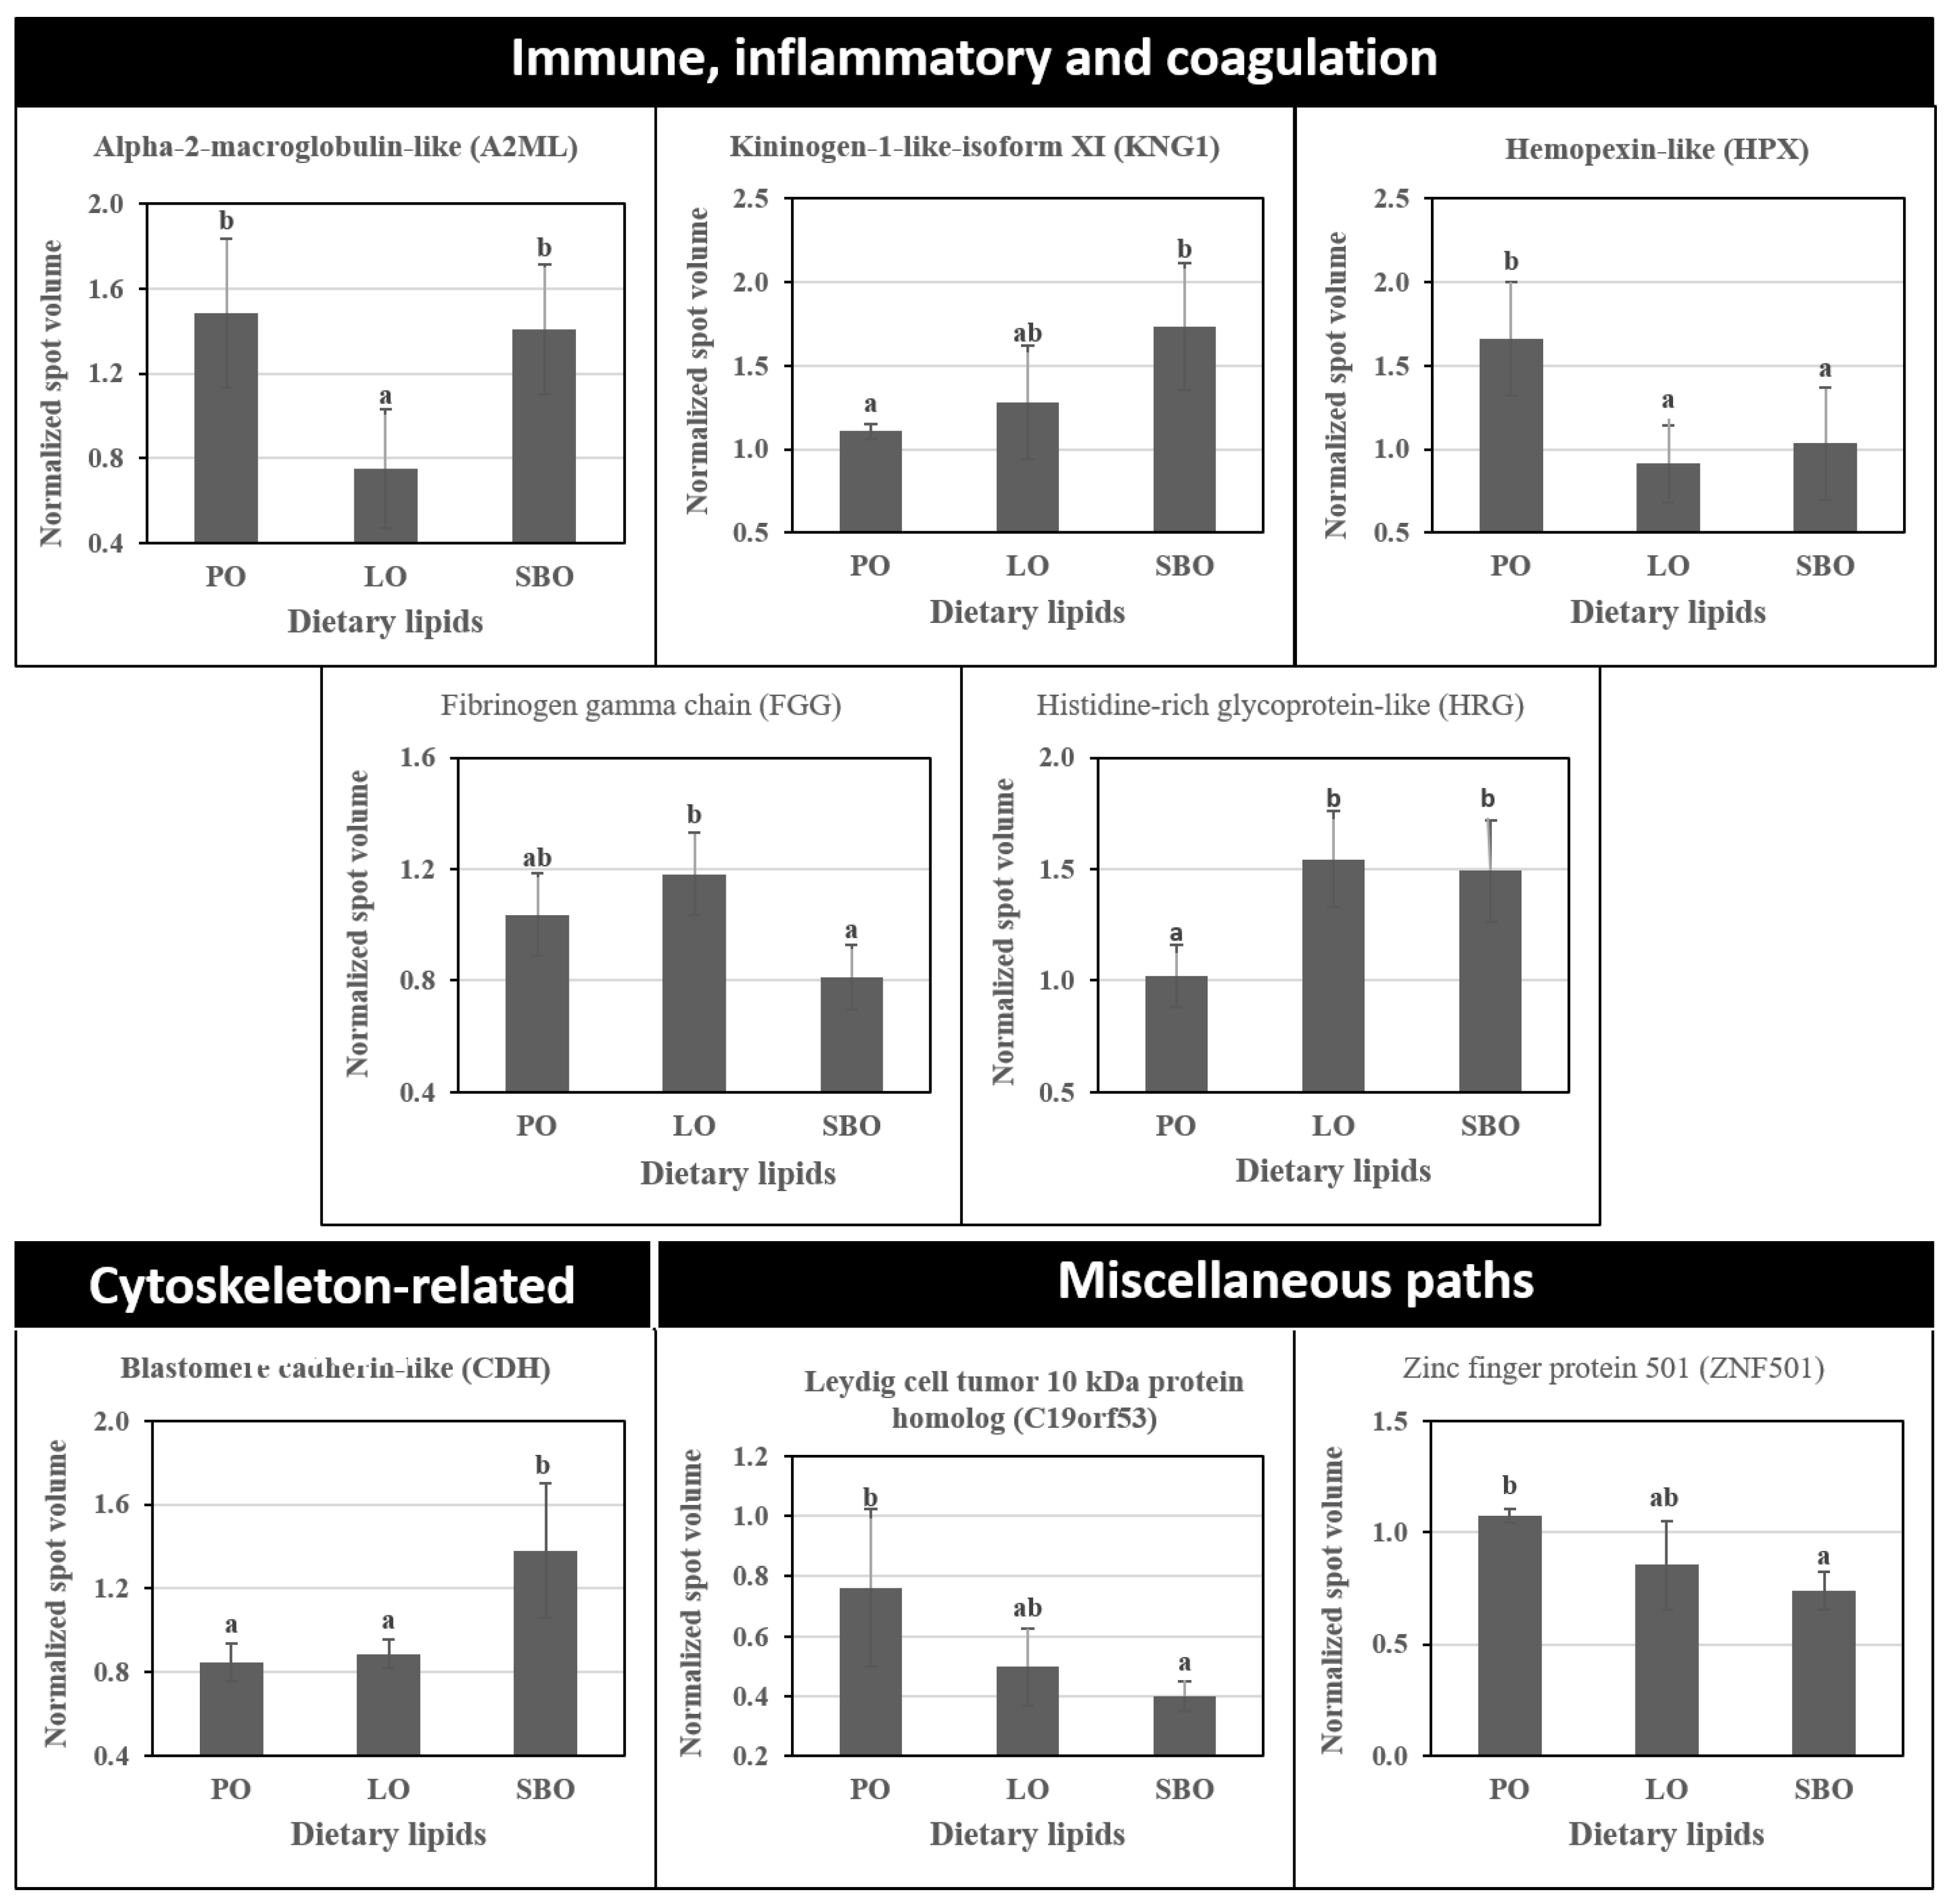
Immune, inflammatory and coagulation
128Alpha-2-macroglobulin-like
[O. niloticus]
A2ML78gi|54225073874,969/5.64 (73,451/4.8)185MSIFTKMEQK
288Kininogen-1-like isoform X1
[O. niloticus]
KNG1122gi|54225784941,185/5.80 (66,931/4.4)445AVHSAVDKFNER
821Hemopexin-like
[O. niloticus]
HPX84gi|34850679250,278/5.91 (37,438/5.3)42IRDVDLSATPR
835Fibrinogen gamma chain
[O. niloticus]
FGG83gi|90845688842,405/4.80 (38,318/5.2)353SSDPDVHFK
886
400
Histidine-rich glycoprotein-Like
[O. niloticus]
HRG d117
94
gi|542204170
[gi|908518607]
48,193/6.64 (36,015/5.2)
[39,519/6.52]
[(62,423/6.2)]
33
31
6
4
FRLHEVQGNSVEQVDGGCNVK
K.AVHHINEYHDHGYK.F
Cytoskeleton-related proteins
477
459
Blastomere cadherin-like
[O. niloticus]
CDH d120
102
gi|54226106064,731/4.67 (55147/4.6)35
10
7
3
KLFYSISGPGADLPPVDR
[R.VFPDVFFTENNR.G]
Miscellaneous paths
343Leydig cell tumour 10 kDa protein homolog [Ictalurus punctatus]C19orf53343gi|104233608610,905/11.63 (63,891/4.7)304KQLNKPK
796Zinc finger protein 501
[Sinocyclocheilus rhinocerous]
ZNF50154gi|102531845744,576/8.99 (40,768/4.9)124VKTEFIK
980uncharacterized protein KIAA2012-like isoform X1 [Lepisosteus oculatus] 51gi|97318094891,103/5.93 (33,331/5.5)76R.TLRDLTGAILAYGNK.Q
a GI number = accession number in National Center for Biotechnology Information (NCBI) database. b Mwt/pIt = theoretical molecular weight/theoretical isoelectric point. c Mwe/pIe = experimental molecular weight/experimental isoelectric point. d Same identification was found in two spots.
Table 5. Hepatic and muscular mRNA levels of the corresponding proteins in plasma of Nile tilapia that were fed experimental diets for 90 days.
Target GenesDiet
POLOSBO
Liver
a2ml0.76 ± 0.050.73 ± 0.040.69 ± 0.04
kng10.72 ± 0.06 b0.64 ± 0.03 a0.60 ± 0.06 a
hpx0.59 ± 0.080.50 ± 0.010.53 ± 0.07
fgg0.73 ± 0.040.71 ± 0.030.70 ± 0.02
hrg0.22 ± 0.03 b0.16 ± 0.04 ab0.12 ± 0.06 a
cdh0.33 ± 0.02 b0.30 ± 0.00 a0.30 ± 0.01 a
c19orf53 10.41 ± 0.040.38 ± 0.020.37 ± 0.01
znf501 10.60 ± 0.02 b0.56 ± 0.02 a0.56 ± 0.00 a
Muscle
a2ml0.48 ± 0.140.46 ± 0.140.53 ± 0.05
kng10.42 ± 0.03 a0.49 ± 0.07 b0.51 ± 0.04 b
hpx0.20 ± 0.12 a0.27 ± 0.11 ab0.37 ± 0.04 b
fgg0.35 ± 0.030.41 ± 0.100.44 ± 0.04
cdh0.23 ± 0.140.24 ± 0.080.28 ± 0.03
c19orf530.57 ± 0.030.58 ± 0.060.53 ± 0.02
znf5010.38 ± 0.05 a0.47 ± 0.09 ab0.49 ± 0.04 b
Means with different superscripts in each row differ significantly from each other (p < 0.05). The mRNA level of each gene was normalized to the 18s rRNA level after log10 transformation of each level. 1 Note that significant correlation between protein amount and mRNA level were observed.

