
Feeding, Muscle and Packaging Effects on Lipid Oxidation and Color of Avileña Negra-Ibérica Beef

 ,
,  ,
,
Abstract
Simple Summary
Abstract
1. Introduction
2. Materials and Methods
2.1. Animals and Sampling
2.2. Lipid Oxidation
2.3. Color Measurement
2.4. Visual Color Acceptability
2.5. Statistical Analysis
3. Results and Discussion
3.1. Lipid Oxidation
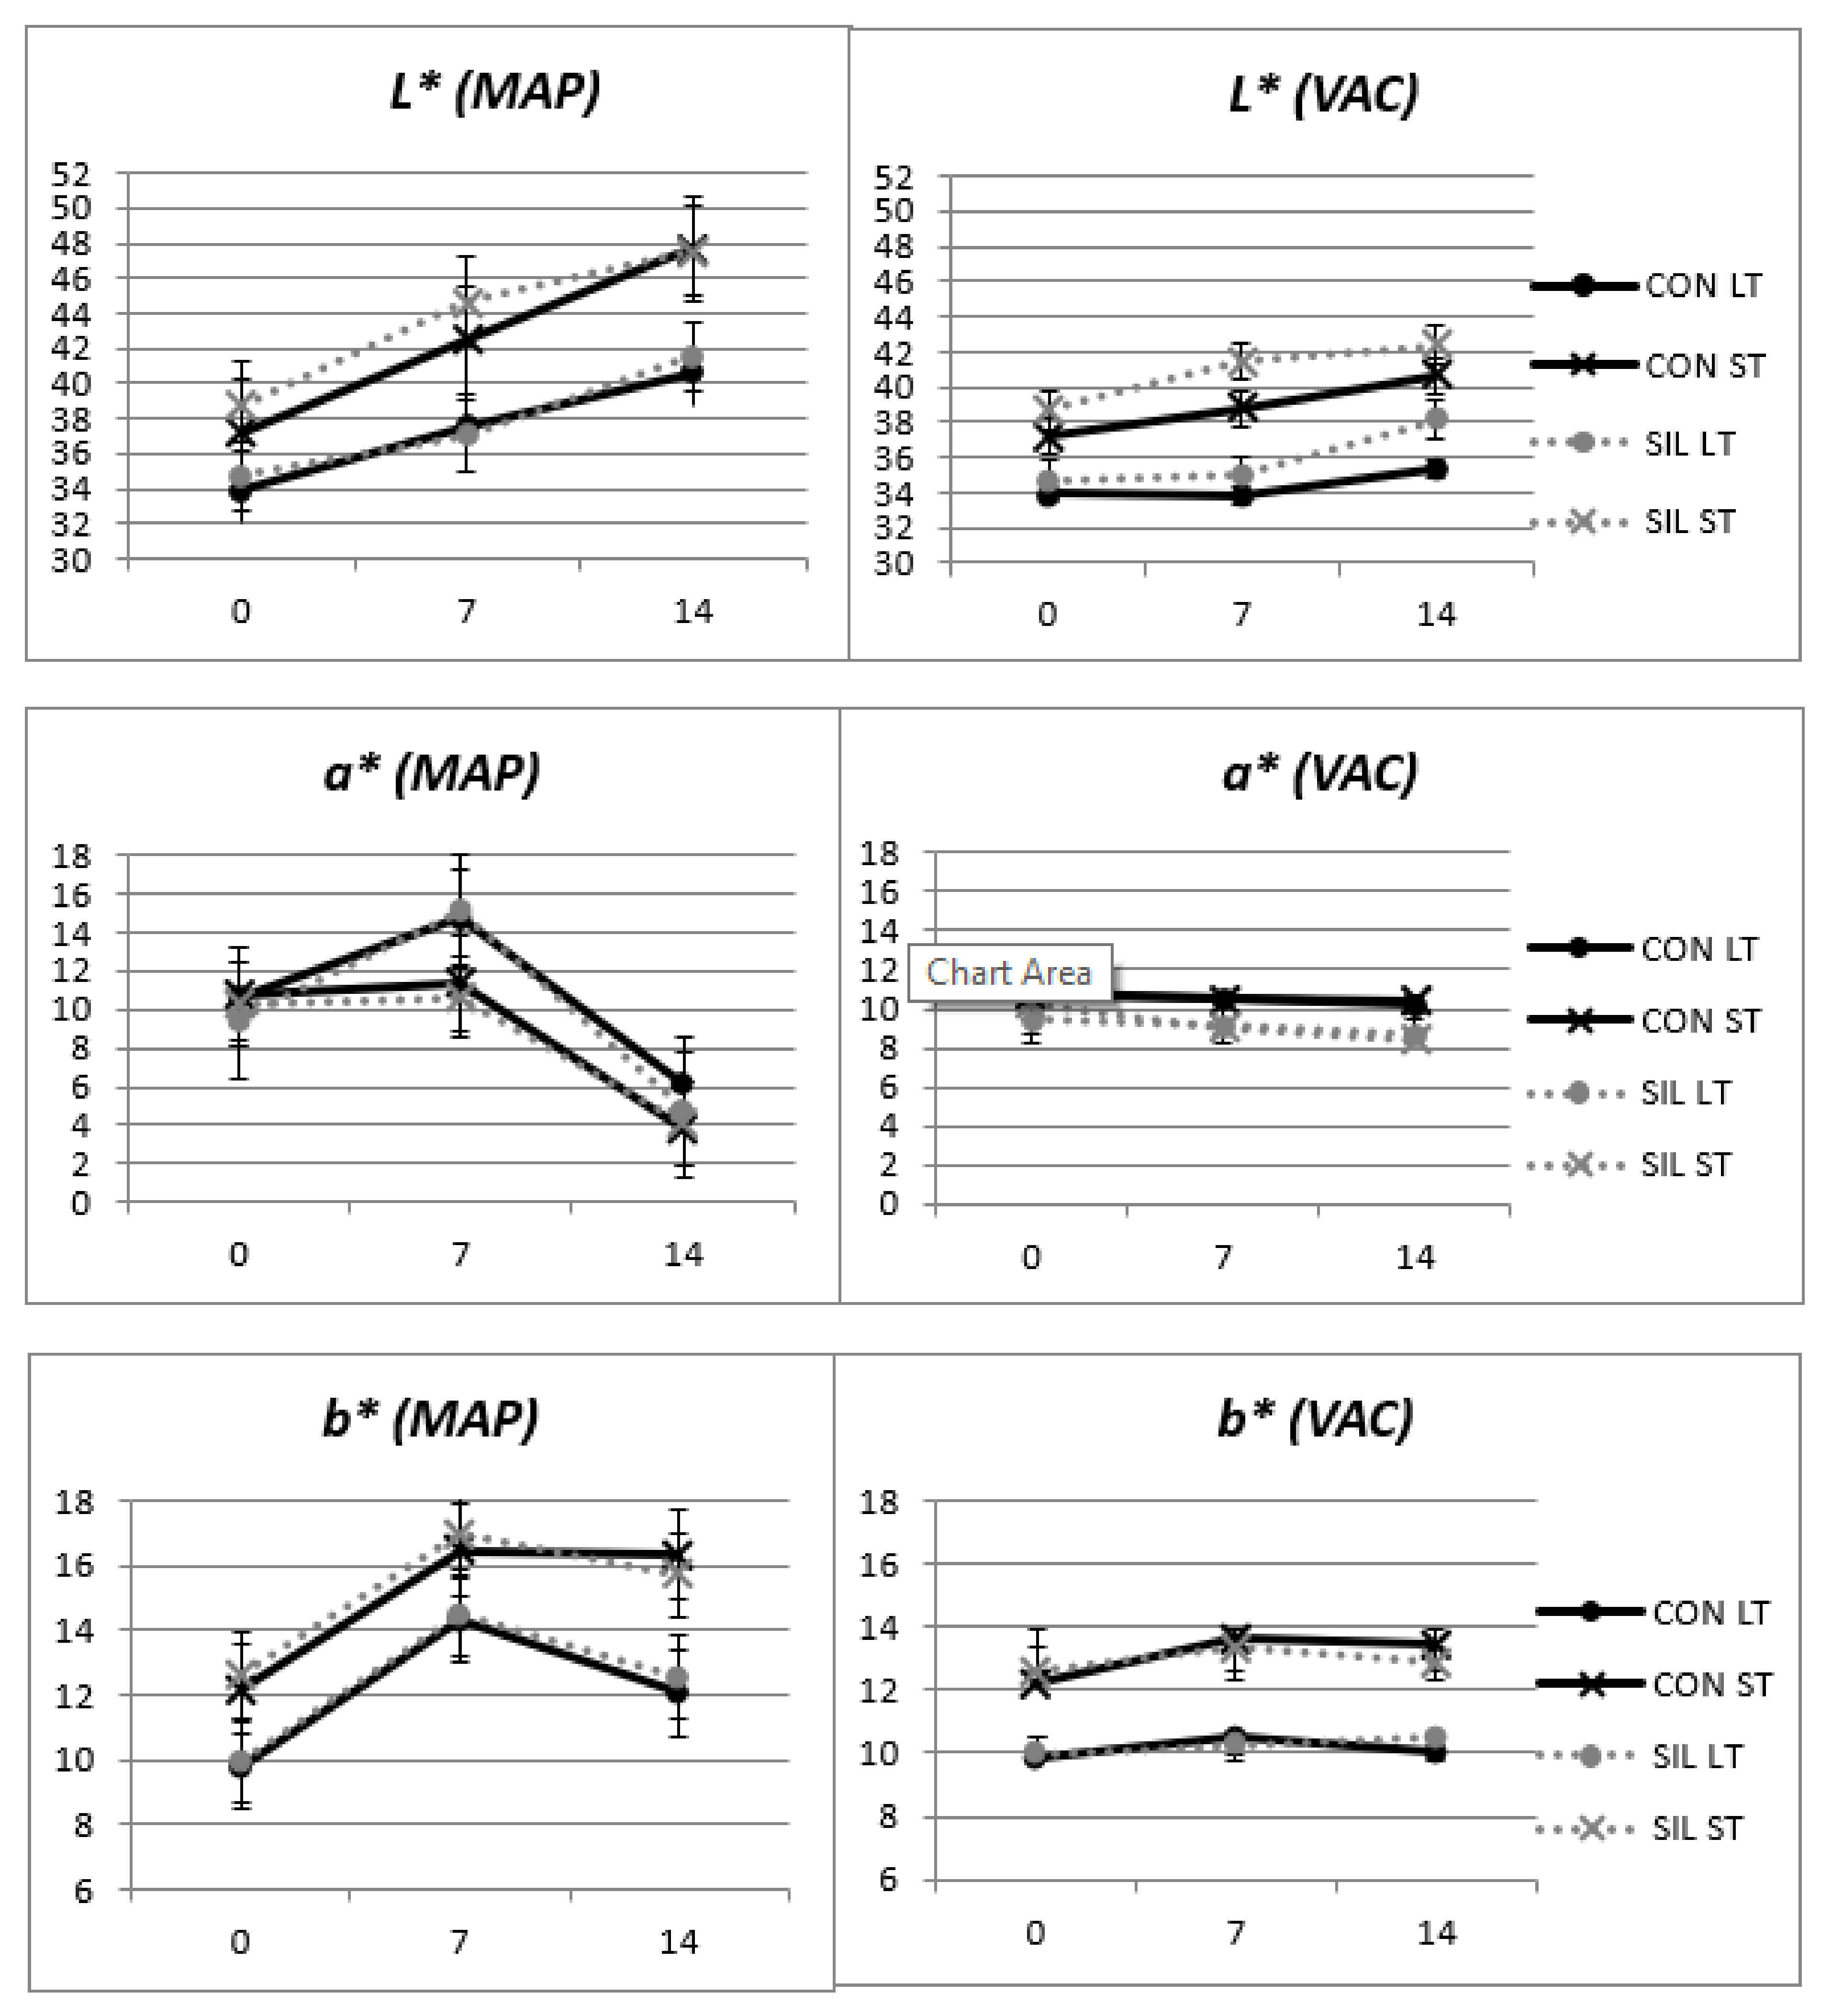
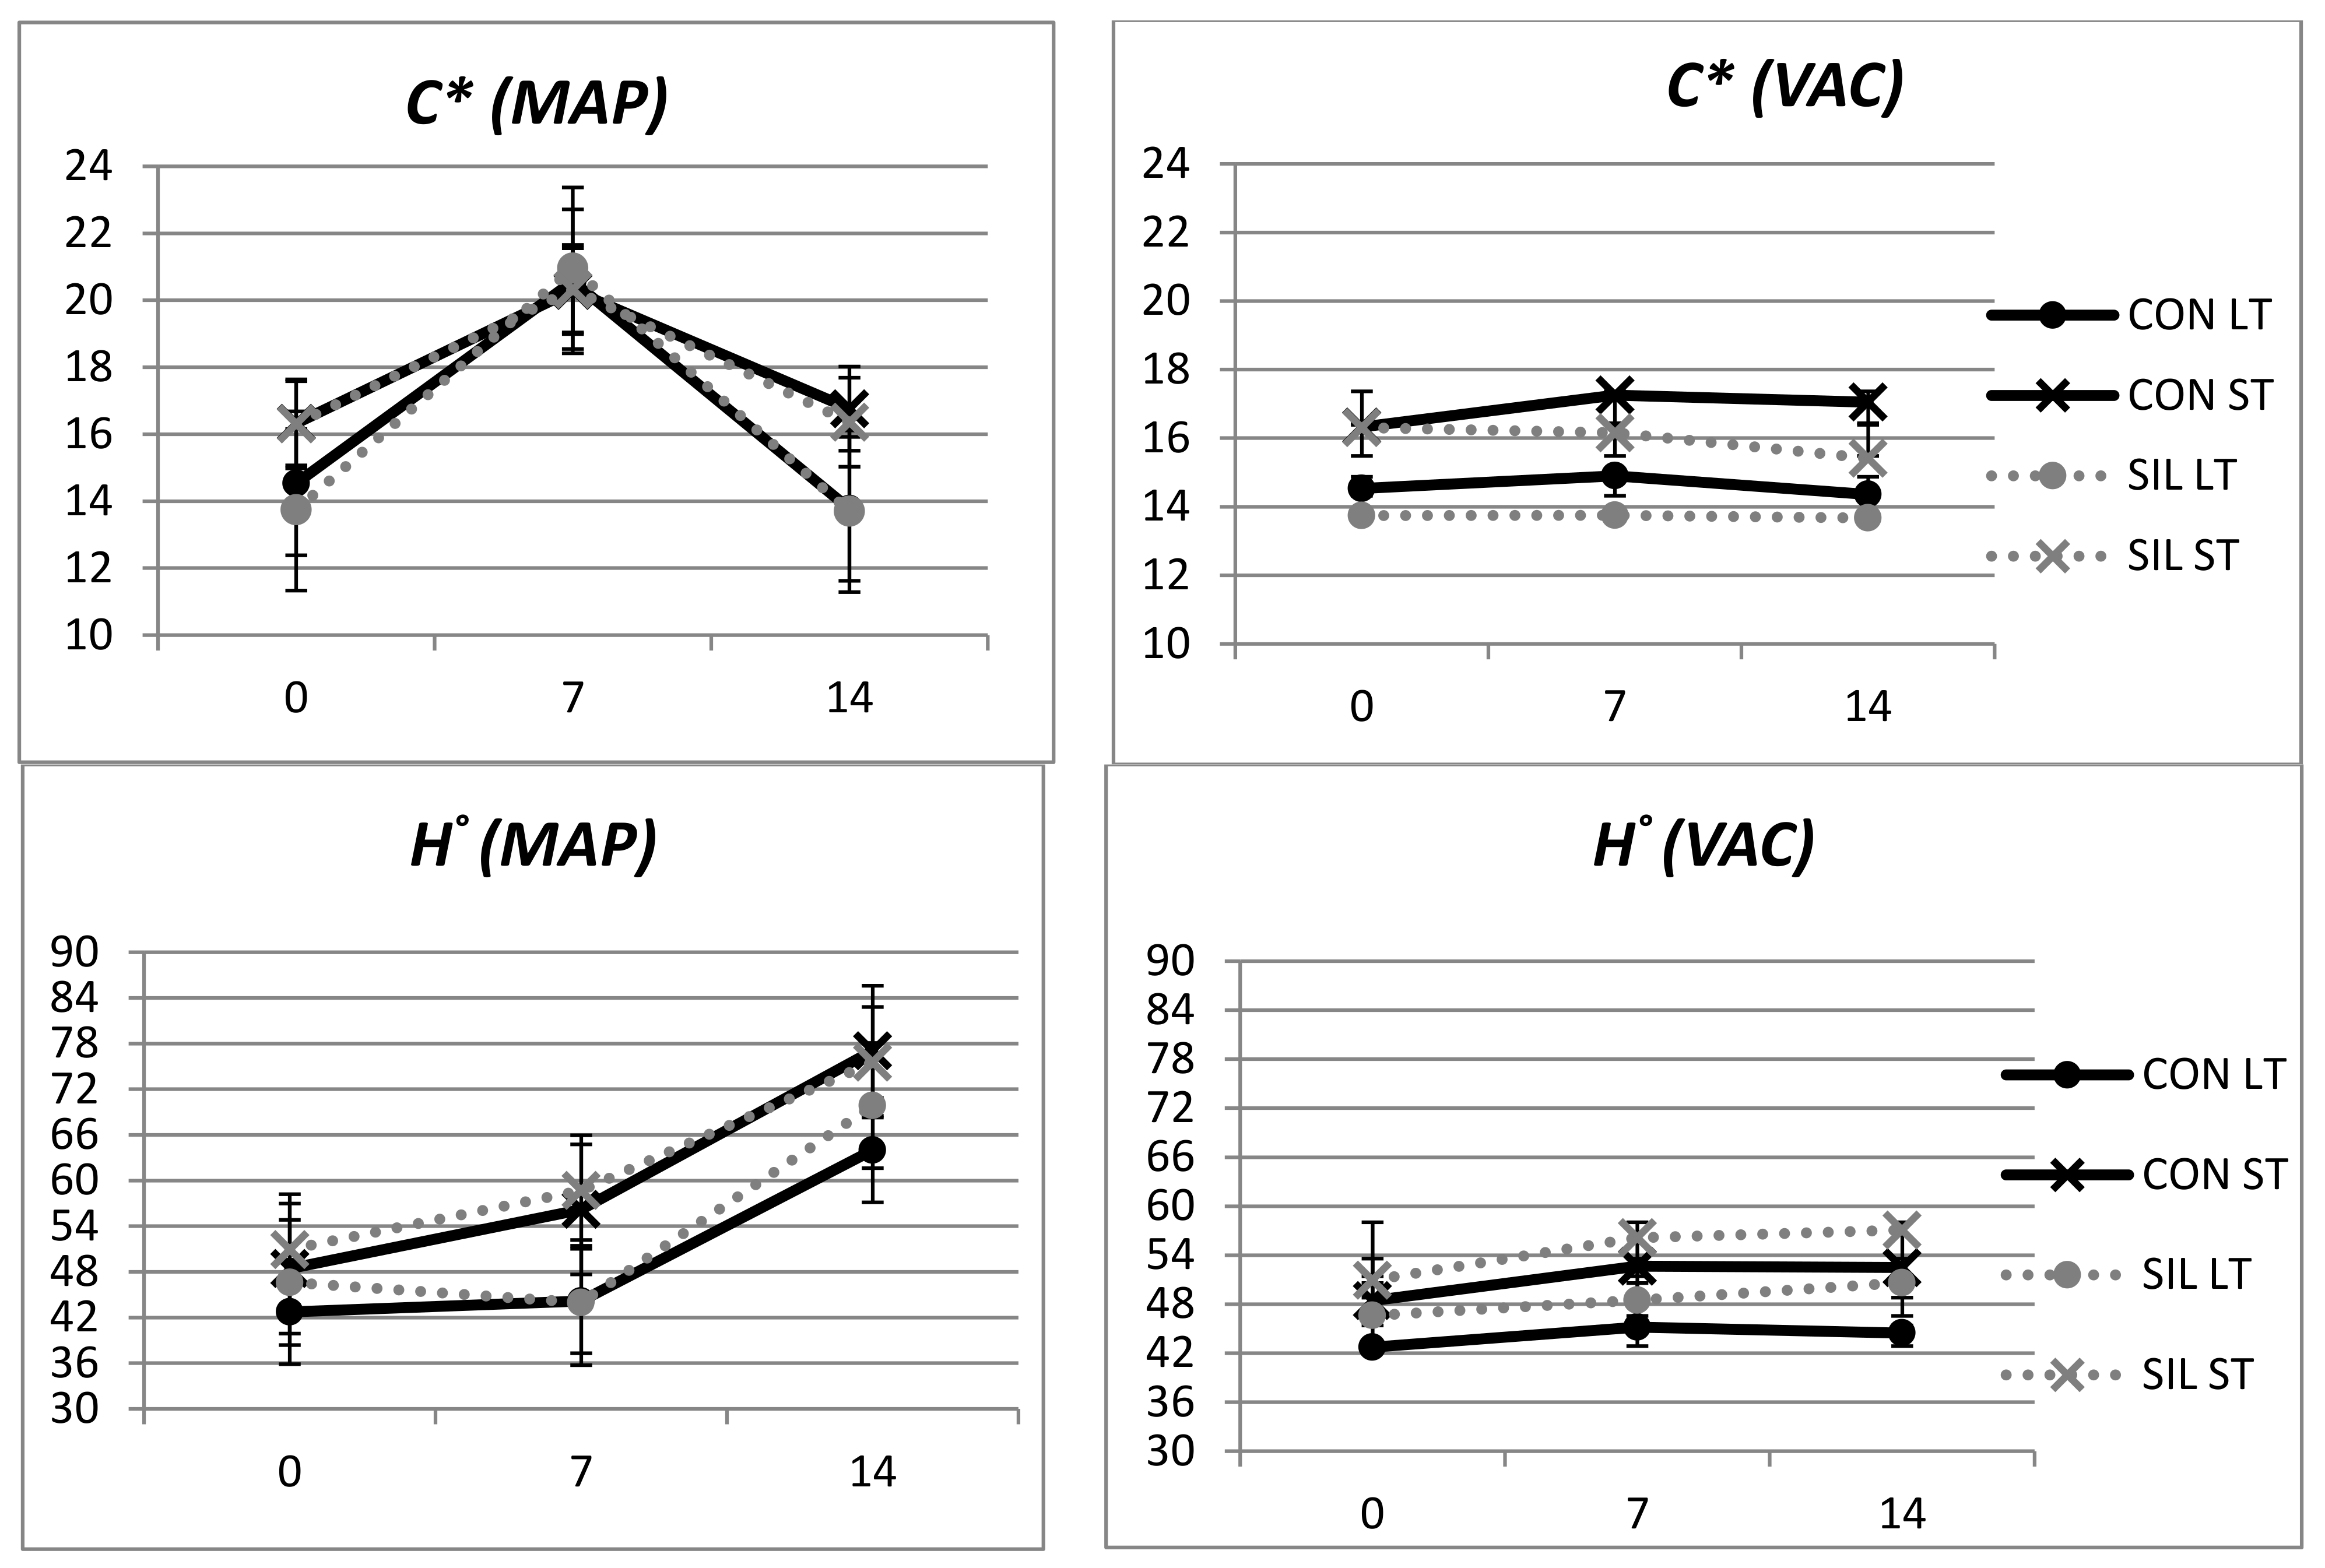
3.2. Color
3.3. Visual Color Acceptability and Purchase Choice
4. Conclusions
Author Contributions
Funding
Institutional Review Board Statement
Acknowledgments
Conflicts of Interest
References
- Dannenberger, D.; Nuernberg, K.; Nuernberg, G.; Ender, K. Carcass and meat quality of pasture vs concentrated fed German Simmental and German Holsteins bulls. Arch. Anim. Breed 2006, 49, 315–318. [Google Scholar] [CrossRef]
- Avilés, C.; Martínez, A.L.; Domenech, V.; Peña, F. Effect of feeding system and breed on growth performance, and carcass and meat quality traits in two continental beef breeds. Meat Sci. 2015, 107, 94–103. [Google Scholar] [CrossRef]
- Fernández-Perea, M.T.; Alenda Jímenez, R. Economic weights for a selection index in Avileña purebreed beef cattle. Livest. Prod. Sci. 2004, 89, 223–233. [Google Scholar] [CrossRef]
- Viera, C.; Cerdeño, A.I.; Serrano, E.; Mantecón, A.R. Adult steers for beef production: Breed effect on animal performance retail yield and carcass quality. Czech. J. Anim. Sci. 2006, 51, 467–474. [Google Scholar] [CrossRef]
- Casasús, I.; Ripoll, G.; Albertí, P. Use of maize silage in beef heifers fattening diets: Effects on performance, carcass and meat quality. ITEA 2012, 108, 191–206. [Google Scholar]
- Villalba, D.; Molina, E.; Cubiló, D.; Blanco, M.; Albertí, P.; Joy, M.; Casasús, I. Alternativas técnicas para el engorde de terneros utilizando forrajes. Agroecología 2010, 2, 24–27. [Google Scholar]
- Cooke, D.W.I.; Monahan, F.J.; Brophy, P.O.; Boland, M.P. Comparison of concentrates or concentrates plus forages in a total mixed ration or discrete ingredient format: Effects on beef production parameters and on beef composition, color, texture and fatty acid profile. Irish J. Agric. Food Res. 2004, 43, 201–216. [Google Scholar]
- Keady, T.W.; Lively, F.O.; Kilpatrick, D.J.; Moss, B.W. Effects of replacing grass silage with either maize or whole-crop wheat silages on the performance and meat quality of breed cattle offered two levels of concentrates. Animal 2007, 1, 613–623. [Google Scholar] [CrossRef]
- Mazzenga, A.; Gianesella, M.; Brscic, M.; Cozzi, G. Feeding behaviour, diet digestibility, rumen fluid and metabolic parameters of beef cattle fed total mixed rations with a stepped substitution of wheat straw with maize silage. Livest. Sci. 2009, 122, 16–23. [Google Scholar] [CrossRef]
- Moloney, A.P.; Mooney, M.T.; Kerry, J.P.; Stanton, C.; O’Kiely, P. Color of fat, and color, fatty acid composition and sensory characteristics of muscle form heifers offered alternative forages to grass silage in a finishing ration. Meat Sci. 2013, 95, 608–615. [Google Scholar] [CrossRef]
- McMillin, K.W. Where is MAP Going? A review and future potential of modified-atmosphere packaging for meat. Meat Sci. 2008, 80, 43–65. [Google Scholar] [CrossRef]
- Jeremiah, L.E.; Gibson, L.L. The influence of packaging and storage time on the properties and case-life of retail-ready beef. Food Res. Int. 2001, 34, 621–631. [Google Scholar] [CrossRef]
- Jeremiah, L.E. Packaging alternatives to deliver fresh meat using short- or long-term distribution. Food Res. Int. 2001, 34, 749–772. [Google Scholar] [CrossRef]
- Resconi, V.C.; Escudero, A.; Beltrán, J.A.; Olleta, J.L.; Sañudo, C.; Campo, M.M. Color, lipid oxidation, sensory quality and aroma compounds of beef steaks displayed under different levels of oxygen in a modified-atmosphere package. J. Food Sci. 2012, 77, 10–18. [Google Scholar] [CrossRef] [PubMed]
- Jayas, D.S.; Jeyamkondan, S. Ph-Postharvest Technology: Modifed Atmosphere Storage of grains meats fruits and vegetables. Biosyst. Eng. 2002, 82, 235–251. [Google Scholar] [CrossRef]
- Kang, S.M.; Kang, G.; Seong, P.; Park, B.; Cho, S. Effect of packaging method on the lipid oxidation, protein oxidation and color in aged top round from Hanwoo (Korean native cattle) during refrigerated storage. Korean J. Food Sci. Anim. Resour. 2014, 34, 273–279. [Google Scholar] [CrossRef] [PubMed]
- Cassens, R.G.; Faustman, C.; Jimenez-Colmenero, F. Modern developments in research on color of meat. In Trends in Modern Meat Technology; Krol, B., Van Roon, P., Houben, J., Eds.; Pudoc.: Den Dolder, The Netherlands, 1998; Volume 2. [Google Scholar]
- Djenane, D.; Sánchez-Escalante, A.; Beltrán, J.A.; Roncales, P. Ability of αtocopherol, taurine and rosemary, in combination with vitamin C, to increase the oxidative stability of beef steaks packaged in modified atmosphere. Food Chem. 2002, 76, 407–415. [Google Scholar] [CrossRef]
- Hunt, M.; Hedrick, H. Profile of fiber types and related properties of five bovine muscles. J. Food Sci. 1977, 42, 513–517. [Google Scholar] [CrossRef]
- Hood, D.E. Factors affecting the rate of metmyoglobin accumulation in pre-packaged beef. Meat Sci. 1980, 4, 247–265. [Google Scholar] [CrossRef]
- O´Keeffe, M.; Hood, D.E. Biochemical factors influencing metmyoglobin formation on beef from muscles of differing color stability. Meat Sci. 1982, 7, 209–228. [Google Scholar] [CrossRef]
- Renerre, M.; Labas, R. Biochemical factors influencing metmyoglobin formation in beef muscles. Meat Sci. 1987, 19, 151–165. [Google Scholar] [CrossRef]
- Wegner, J.; Albrecht, E.; Fiedler, I.; Teuscher, F.; Papstein, H.J.; Ender, K. Growth and breed-related changes of muscle fiber characteristics in cattle. J. Anim. Sci. 2000, 78, 1485–1496. [Google Scholar] [CrossRef]
- Renerre, M.; Dumont, F.; Gatellier, P. Antioxidant enzyme activities in beef in relation to oxidation of lipid and myoglobin. Meat Sci. 1996, 43, 111–121. [Google Scholar] [CrossRef]
- Bekhit, B.A.E.D.; Geesink, G.H.; Ilian, M.A.; Morton, J.D.; Bickerstaffe, R.C. The effects of natural antioxidants on oxidative processes and metmyoglobin reducing activity in beef patties. Food Chem. 2003, 81, 175–187. [Google Scholar] [CrossRef]
- Kanner, J. Oxidative processes in meat and meat products: Quality implications. Meat Sci. 1994, 36, 169–189. [Google Scholar] [CrossRef]
- Barahona, M.; Hachemi, M.A.; Olleta, J.L.; Gónzalez, M.M.; Campo, M.M. Feeding, Muscle and Packaging effects on meat quality and consumer acceptability of Avileña-Negra Ibérica Beef. Foods 2020, 9, 853. [Google Scholar] [CrossRef]
- Pfalzgraf, A.; Frigg, M.; Steinhart, H. α-Tocopherol contents in lipid oxidation pork muscle and adipose tissue. J. Agric. Food Chem. 1995, 43, 1339–1342. [Google Scholar] [CrossRef]
- C.I.E. (Commission Internationale de L’Eclairage). Colorimetry; C.I.E.: Vienna, Austria, 1986. [Google Scholar]
- Renerre, M.; Mazuel, J.P. Relations entre méthodes de mesures instrumentales et sensorielles de la couleur de la viande. Sci. Des. Alim. 1985, 5, 541–557. [Google Scholar]
- O´Sullivan, A.; O´Sullivan, K.; Galvin, K.; Moloney, A.P.; Troy, D.J.; Kerry, J.P. Grass silage versus maize silage effects on retail packaged beef quality. J. Anim Sci. 2002, 80, 1556–1563. [Google Scholar] [CrossRef][Green Version]
- Nuernberg, K.; Dannenberger, D.; Nuernberg, G.; Ender, K.; Voigt, J.; Scollan, N.D.; Wood, J.D.; Nute, G.R.; Richardson, R.I. Effect of a grass-based and a concentrate feeding system on meat quality characteristics and fatty acid composition of Longissimus muscle in different cattle breeds. Livest. Prod. Sci. 2005, 94, 137–147. [Google Scholar] [CrossRef]
- Fuentes, V.; Estévez, M.; Ventanas, J.; Ventanas, S. Impact of lipid content and composition on lipid oxidation and protein carbonylation in experimental fermented sausages. Food Chem. 2014, 147, 70–77. [Google Scholar] [CrossRef] [PubMed]
- Campo, M.M.; Nute, G.R.; Hughes, S.I.; Enser, M.; Wood, J.D.; Richardson, I. Flavour perception of oxidation in beef. Meat Sci. 2006, 72, 303–311. [Google Scholar] [CrossRef] [PubMed]
- Faustman, C.; Sun, Q.; Mancini, R.; Suman, S.P. Myoglobin and lipid oxidation interactions: Mechanistics base and control. Meat Sci. 2010, 86, 86–94. [Google Scholar] [CrossRef]
- Kim, Y.H.; Huff-Lonergan, E.; Sebranek, J.G.; Lonergan, S.M. High-oxygen modified-atmosphere packaging system induces lipid and myoglobin oxidation and protein polymerization. Meat Sci. 2010, 85, 759–767. [Google Scholar] [CrossRef]
- McKenna, D.R.; Mies, P.D.; Baird, D.E.; Pfeiffer, K.D.; Ellebracht, J.W.; Savell, J.W. Biochemical and physical factors affecting discoloration characteristics of 19 bovine muscles. Meat Sci. 2005, 70, 665–682. [Google Scholar] [CrossRef] [PubMed]
- Seyfert, M.; Mancini, R.A.; Hunt, M.C.; Tang, J.; Faustman, C. Influence of carbon monoxide in package atmospheres containing oxygen on color, reducing activity and oxygen consumption of five bovine muscle. Meat Sci. 2007, 75, 432–442. [Google Scholar] [CrossRef]
- Lagerstedt, A.; Lundström, K.; Lindahl, G. Influence of vacuum or high-oxygen modified-atmosphere packaging on quality of beef M. longissimus dorsi steaks after different ageing times. Meat Sci. 2011, 87, 101–106. [Google Scholar] [CrossRef]
- Atkinson, J.L.; Follet, M.J. Biochemical studies on the discoloration of fresh meat. Am. J. Food Technol. 1973, 8, 51–58. [Google Scholar] [CrossRef]
- Madhavi, D.L.; Carpenter, C.E. Aging and processing affect color, metmyoglobin reductase and oxygen consumption of beef muscle. J. Food Sci. 1993, 58, 939–942. [Google Scholar] [CrossRef]
- Tang, J.; Faustman, C.; Hoagland, T.A.; Mancini, R.A.; Seyfert, M.; Hunt, M.C. Mitochondrial reduction of metmyoglobin: Dependence on the electron transport chain. J. Agric. Food Chem. 2005, 53, 5449–5455. [Google Scholar] [CrossRef]
- Moloney, A.P.; Drennan, M.J. Characteristics of fat and muscle from beef heifers offered a grass silage or concentrate-based finishing ration. Livest. Sci. 2013, 152, 147–153. [Google Scholar] [CrossRef]
- Mancini, M.A.; Hunt, M.C. Current research in meat color. Meat Sci. 2005, 71, 100–121. [Google Scholar] [CrossRef]
- McDougall, D.B. Changes in the color and opacity of meat. Food Chem. 1982, 9, 72–88. [Google Scholar]
- Ripoll, G.; Casasús, I.; Albertí, P.; Blanco, M. Characteristics and meat quality evolution of veal produced in Mediterranean mountains áreas. XIV Symp. Anim. Prod. 2011, 2011, 742–744. [Google Scholar]
- Torrescano, G.; Sánchez-Escalante, A.; Giménez, B.; Roncalés, P.; Beltrán, J.A. Shear values of raw samples of 14 bovine muscles and their relation to muscle collagen characteristics. Meat Sci. 2003, 64, 85–91. [Google Scholar] [CrossRef]
- Iacurto, M.; Settineri, D.; Mormile, M.; Di Giacomo, A. Effects of packaging techniques, freezing temperature and storage time on beef shelf life. Italian J. Anim. Sci. 2005, 4, 275–277. [Google Scholar] [CrossRef]
- Wales, W.J.; Moran, J.B.; Harris, R.W. A comparison of growth rates and carcass quality of steers receiving maize silage as a supplement to annual pasture or as a component of a feedlot ration. Aust. J. Exp. Agric. 1998, 38, 1–6. [Google Scholar] [CrossRef]
- Walsh, K.; O’Kiely, P.; Taweel, H.Z.; McGee, M.; Moloney, A.P.; Boland, T.M. Intake, digestibility, rumen fermentation and performance of beef cattle fed diets based on whole-crop wheat or barley harvested at two cutting heights relative to maize silage or ad libitum concentrates. Anim. Feed Sci. Technol. 2008, 144, 257–278. [Google Scholar] [CrossRef]
- Ismail, H.A.; Lee, E.J.; Ko, K.Y.; Ahn, D.U. Effects of aging time and natural antioxidant on the color, lipid oxidation and volatiles of irradiated ground beef. Meat Sci. 2008, 80, 582–591. [Google Scholar] [CrossRef] [PubMed]
- Lee, K.T.; Yoon, C.S. Quality changes and shelf life of imported vacuum packaged beef chuck during storage at 0 °C. Meat Sci. 2001, 59, 71–77. [Google Scholar] [CrossRef]
- Pedreschi, F.; Leòn, J.; Mery, D.; Moyano, P. Development of a compter vision system to measure the color of potato chips. Food Res. Int. 2006, 39, 1092–1098. [Google Scholar] [CrossRef]
- Abdullah, M.Z.; Guan, L.C.; Lim, K.C.; Karim, A.A. The applications of computer vision and tomographic radar imaging for assessing physical properties of food. J. Food Sci. Eng. 2004, 61, 125–135. [Google Scholar] [CrossRef]
- Du, C.J.; Sun, D.W. Recent developments in the applications of image processing techniques for food quality evaluation. J. Food Sci. Eng. 2004, 61, 109–117. [Google Scholar] [CrossRef]
- Hatcher, D.W.; Symons, S.J.; Manivannan, U. Developments in the use of image analysis for the assessment of oriental noodle appearance and color. Trends Food Sci. Technol. 2004, 15, 230–249. [Google Scholar]
- Van Rooyen, L.A.; Allen, P.; Reid, P.; O´Connor, D.I. The effects of varying gas concentrations and exposure times on color stability and shelf-life of vacuum packaged beef steaks subjected to carbon monoxide pretreatment. Food Packaging Shelf 2018, 18, 230–237. [Google Scholar] [CrossRef]
- Mitsumoto, M.; O´Grady, M.N.; Kerry, J.L.; Buckley, D.J. Addition of tea catechins and vitamine C on sensory evaluation, color and lipid stability during chilled storage in cooked or raw beef and chicken patties. Meat Sci. 2005, 69, 773–779. [Google Scholar] [CrossRef] [PubMed]
- Ramirez, R.; Cava, R. The crossbreeding of different Duroc lines with Iberian pig affects color and oxidative stability of meat during storage. Meat Sci. 2007, 77, 339–347. [Google Scholar] [CrossRef]
- Carpenter, C.E.; Cornforth, D.P.; Whittier, D. Consumer preferences for beef color and packaging did not affect eating satisfaction. Meat Sci. 2001, 57, 359–363. [Google Scholar] [CrossRef]


| VAC | MAP | |||||||||||
|---|---|---|---|---|---|---|---|---|---|---|---|---|
| FEED | MUS | DIS | FxM | FxD | MxD | FEED | MUS | DIS | FxM | FxD | MxD | |
| TBA | 0.045 | 0.649 | 0.111 | 0.053 | 0.020 | 0.628 | 0.057 | 0.184 | <0.001 | 0.408 | 0.311 | 0.666 |
| L* | <0.001 | <0.001 | <0.001 | 0.658 | 0.527 | 0.084 | 0.058 | <0.001 | <0.001 | 0.349 | 0.740 | 0.007 |
| a* | <0.001 | 0.585 | 0.017 | 0.895 | 0.312 | 0.583 | 0.192 | <0.001 | <0.001 | 0.581 | 0.787 | <0.001 |
| b* | 0.983 | <0.001 | 0.014 | 0.516 | 0.630 | 0.526 | 0.398 | <0.001 | <0.001 | 0.723 | 0.757 | 0.039 |
| C* | 0.002 | <0.001 | 0.525 | 0.941 | 0.489 | 0.957 | 0.628 | <0.001 | <0.001 | 0.967 | 0.689 | <0.001 |
| H° | <0.001 | <0.001 | <0.001 | 0.478 | 0.312 | 0.218 | 0.068 | <0.001 | <0.001 | 0.395 | 0.777 | 0.017 |
| Dec | 0.331 | <0.001 | 0.038 | 0.987 | 0.599 | 0.480 | 0.464 | 0.499 | <0.001 | 0.313 | 0.856 | 0.002 |
| VCA | <0.001 | <0.001 | <0.001 | <0.001 | <0.001 | <0.001 | <0.001 | <0.001 | <0.001 | 0.007 | <0.001 | <0.001 |
| VAC | MAP | |||||||||||||||
|---|---|---|---|---|---|---|---|---|---|---|---|---|---|---|---|---|
| FEED | MUSCLE | p-Value | FEED | MUSCLE | p-Value | |||||||||||
| Display | CON | SIL | LT | ST | SEM | FEED | MUS | FxM | CON | SIL | LT | ST | SEM | FEED | MUS | FxM |
| 0 | 0.081 | 0.089 B | 0.082 | 0.088 | 0.005 | 0.451 | 0.629 | 0.017 | 0.081 C | 0.089 C | 0.082 C | 0.088 C | 0.005 | 0.451 | 0.629 | 0.017 |
| 7 | 0.089 | 0.082 B | 0.089 | 0.082 | 0.003 | 0.197 | 0.145 | 0.073 | 0.970 aB | 0.672 bB | 0.733 B | 0.896 B | 0.065 | 0.018 | 0.203 | 0.243 |
| 14 | 0.078 b | 0.138 aA | 0.101 | 0.118 | 0.014 | 0.037 | 0.563 | 0.409 | 2.244 A | 2.059 A | 2.062 A | 2.223 A | 0.106 | 0.394 | 0.438 | 0.871 |
| SEM | 0.002 | 0.010 | 0.006 | 0.009 | 0.119 | 0.117 | 0.119 | 0.118 | ||||||||
| p-Value | 0.182 | 0.036 | 0.458 | 0.194 | <0.001 | <0.001 | <0.001 | <0.001 | ||||||||
| CON | SIL | p-Value | ||||||
|---|---|---|---|---|---|---|---|---|
| Days | LT | ST | LT | ST | SEM | FEED | MUS | FEEDxMUS |
| 1 | 6.98 c | 7.57 ab | 7.25 bc | 7.65 a | 0.060 | 0.129 | <0.001 | 0.428 |
| 2 | 7.05 b | 7.28 ab | 7.39 a | 7.43 a | 0.055 | 0.024 | 0.229 | 0.426 |
| 3 | 6.36 b | 6.46 b | 6.97 a | 6.59 b | 0.056 | 0.001 | 0.219 | 0.032 |
| 4 | 5.99 b | 5.31 c | 6.55 a | 5.60 c | 0.058 | <0.001 | <0.001 | 0.234 |
| 5 | 5.39 b | 4.46 c | 5.93 a | 4.57 c | 0.058 | 0.002 | <0.001 | 0.046 |
| 6 | 5.19 b | 3.41 d | 6.07 a | 3.71 c | 0.066 | <0.001 | <0.001 | 0.004 |
| 7 | 3.64 b | 2.55 c | 4.32 a | 2.69 c | 0.061 | <0.001 | <0.001 | 0.014 |
| 8 | 2.99 b | 1.71 c | 3.51 a | 1.93 c | 0.048 | <0.001 | <0.001 | 0.062 |
| 9 | 2.19 b | 1.26 c | 2.67 a | 1.32 c | 0.041 | <0.001 | <0.001 | 0.003 |
| 10 | 1.59 b | 1.00 c | 1.96 a | 1.00 c | 0.029 | <0.001 | <0.001 | <0.001 |
| 11 | 1.24 a | 1.00 b | 1.27 a | 1.00 b | 0.013 | 0.519 | <0.001 | 0.519 |
| 12 | 1.00 | 1.00 | 1.00 | 1.00 | 0.000 | ns | ns | ns |
| CON | SIL | p-Value | ||||||
|---|---|---|---|---|---|---|---|---|
| Days | LT | ST | LT | ST | SEM | FEED | MUS | FEEDxMUS |
| 1 | 7.35 b | 7.78 a | 7.58 ab | 7.67 ab | 0.059 | 0.600 | 0.024 | 0.144 |
| 2 | 6.88 b | 7.76 a | 7.19 b | 7.70 a | 0.062 | 0.285 | <0.001 | 0.122 |
| 3 | 6.57 b | 7.07 a | 6.74 b | 7.29 a | 0.059 | 0.091 | <0.001 | 0.818 |
| 4 | 6.72 b | 6.47 b | 7.02 a | 6.72 b | 0.052 | 0.007 | 0.008 | 0.823 |
| 5 | 5.85 b | 5.49 c | 6.32 a | 5.88 b | 0.052 | <0.001 | <0.001 | 0.693 |
| 6 | 6.12 a | 4.67 c | 5.82 b | 4.90 c | 0.057 | 0.775 | <0.001 | 0.012 |
| 7 | 4.58 b | 3.76 c | 5.48 a | 3.94 c | 0.065 | <0.001 | <0.001 | 0.003 |
| 8 | 3.81 b | 3.08 c | 4.49 a | 3.37 c | 0.062 | <0.001 | <0.001 | 0.092 |
| 9 | 3.15 b | 2.61 c | 3.78 a | 2.89 b | 0.049 | <0.001 | <0.001 | 0.087 |
| 10 | 3.02 a | 2.38 b | 3.27 a | 2.51 b | 0.047 | 0.056 | <0.001 | 0.521 |
| 11 | 2.64 b | 1.91 d | 2.88 a | 2.17 c | 0.041 | 0.002 | <0.001 | 0.896 |
| 12 | 2.47 a | 1.00 b | 2.57 a | 1.00 b | 0.037 | 0.403 | <0.001 | 0.403 |
| CON | SIL | |||
|---|---|---|---|---|
| Days | LT | ST | LT | ST |
| 1 | 91.7 a | 93.9 a | 91.1 ab | 96.7 a |
| 2 | 90.6 a | 93.9 a | 93.3 b | 94.4 ab |
| 3 | 75.6 b | 83.3 a | 87.2 abc | 85.6 b |
| 4 | 68.3 bc | 49.4 b | 81.7 abc | 68.3 c |
| 5 | 60.6 bc | 32.8 b | 79.4 ac | 35.0 d |
| 6 | 50.0 c | 2.3 c | 77.2 c | 6.1 e |
| 7 | 21.1 d | 0.6 c | 30.0 d | 1.1 ef |
| 8 | 7.8 d | 0 c | 11.7 e | 0 f |
| 9 | 7.8 d | 0 c | 7.8 e | 0 f |
| 10 | 0 e | 0 c | 0 f | 0 f |
| 11 | 0 e | 0 c | 0 f | 0 f |
| 12 | 0 e | 0 c | 0 f | 0 f |
| CON | SIL | |||
|---|---|---|---|---|
| Days | LT | ST | LT | ST |
| 1 | 88.9 a | 95.6 a | 92.8 a | 97.2 a |
| 2 | 88.3 a | 97.2 a | 93.9 a | 96.1 a |
| 3 | 88.9 a | 96.1 a | 86.1 ab | 95.6 ab |
| 4 | 90.6 a | 92.8 a | 93.9 a | 90.0 ab |
| 5 | 86.7 a | 67.2 b | 91.1 bc | 85.6 c |
| 6 | 84.4 a | 45.6 c | 76.7 cd | 58.3 c |
| 7 | 54.4 b | 28.3 cd | 70.0 d | 24.4 d |
| 8 | 45.6 b | 13.9 d | 55.0 e | 13.9 d |
| 9 | 18.9 c | 11.7 d | 29.4 e | 16.1 d |
| 10 | 19.4 cd | 18.3 d | 23.9 e | 20.0 d |
| 11 | 15.0 cd | 18.9 d | 16.1 ef | 18.3 d |
| 12 | 0 d | 0 e | 0 f | 0 e |
Publisher’s Note: MDPI stays neutral with regard to jurisdictional claims in published maps and institutional affiliations. |
© 2021 by the authors. Licensee MDPI, Basel, Switzerland. This article is an open access article distributed under the terms and conditions of the Creative Commons Attribution (CC BY) license (https://creativecommons.org/licenses/by/4.0/).
Share and Cite
Barahona, M.; Campo, M.d.M.; Hachemi, M.A.; González, M.d.M.; Olleta, J.L. Feeding, Muscle and Packaging Effects on Lipid Oxidation and Color of Avileña Negra-Ibérica Beef. Animals 2021, 11, 2863. https://doi.org/10.3390/ani11102863
Barahona M, Campo MdM, Hachemi MA, González MdM, Olleta JL. Feeding, Muscle and Packaging Effects on Lipid Oxidation and Color of Avileña Negra-Ibérica Beef. Animals. 2021; 11(10):2863. https://doi.org/10.3390/ani11102863
Chicago/Turabian StyleBarahona, Marta, Maria del Mar Campo, Mohammed Amine Hachemi, Maria del Mar González, and José Luis Olleta. 2021. "Feeding, Muscle and Packaging Effects on Lipid Oxidation and Color of Avileña Negra-Ibérica Beef" Animals 11, no. 10: 2863. https://doi.org/10.3390/ani11102863
APA StyleBarahona, M., Campo, M. d. M., Hachemi, M. A., González, M. d. M., & Olleta, J. L. (2021). Feeding, Muscle and Packaging Effects on Lipid Oxidation and Color of Avileña Negra-Ibérica Beef. Animals, 11(10), 2863. https://doi.org/10.3390/ani11102863