Article

Detoxification, Hydrogen Sulphide Metabolism and Wound Healing Are the Main Functions That Differentiate Caecum Protein Expression from Ileum of Week-Old Chicken

Department of Microbiology and Antimicrobial Resistance, Veterinary Research Institute, Hudcova 296/70, 621 00 Brno, Czech Republic
*
Author to whom correspondence should be addressed.
Animals 2021, 11(11), 3155; https://doi.org/10.3390/ani11113155
Submission received: 22 September 2021 / Revised: 27 October 2021 / Accepted: 2 November 2021 / Published: 4 November 2021
(This article belongs to the Section Animal Physiology)

Abstract

:

Simple Summary

Although the ileum and caecum represent adjacent parts of the gastrointestinal tract, both compartments differ by function as well as inner environment parameters such as oxygen availability or density of colonising microbiota. As the function of a particular tissue is generally reflected by protein expression, mass spectrometry proteomics was used to characterise expressed proteins of both segments of the gastrointestinal tract. Differentially expressed proteins were identified and grouped according to biological processes specific to both gut compartments.

Abstract

Sections of chicken gut differ in many aspects, e.g., the passage of digesta (continuous vs. discontinuous), the concentration of oxygen, and the density of colonising microbiota. Using an unbiased LC-MS/MS protocol, we compared protein expression in 18 ileal and 57 caecal tissue samples that originated from 7-day old ISA brown chickens. We found that proteins specific to the ileum were either structural (e.g., 3 actin isoforms, villin, or myosin 1A), or those required for nutrient digestion (e.g., sucrose isomaltase, maltase–glucoamylase, peptidase D) and absorption (e.g., fatty acid-binding protein 2 and 6 or bile acid–CoA:amino acid N-acyltransferase). On the other hand, proteins characteristic of the caecum were involved in sensing and limiting the consequences of oxidative stress (e.g., thioredoxin, peroxiredoxin 6), cell adhesion, and motility associated with wound healing (e.g., fibronectin 1, desmoyokin). These mechanisms are coupled with the activation of mechanisms suppressing the inflammatory response (galectin 1). Rather prominent were also expressions of proteins linked to hydrogen sulphide metabolism in caecum represented by cystathionin beta synthase, selenium-binding protein 1, mercaptopyruvate sulphurtransferase, and thiosulphate sulphurtransferase. Higher mRNA expression of nuclear factor, erythroid 2-like 2, the main oxidative stress transcriptional factor in caecum, further supported our observations.

1. Introduction

The chicken intestine consists of the small intestine, colon, and paired caecum. The colon in chickens is quite short, and major digestion and nutrient absorption occur in the small intestine. The function of the caecum in chickens is less clear. The caecum is involved in water absorption and nitrogen metabolism [1]; however, the caecum can be ligated or completely removed by surgery without any gross effect on health [2]. There are additional differences between characteristics of the small intestine and caecum in chickens. Digestion in the small intestine is continuous with peristalsis [3], while digestion in the caecum is discontinuous, as the caecum is filled and voided approximately twice a day [4]. While there is a concentration of residual oxygen in the small intestine, conditions in the caecum are strictly anaerobic. The small intestine and caecum also differ in the density of colonising microbial populations. The small intestine is sparsely populated with a total bacteria count of approximately 105 per g of digesta, and the microbiota of the adult chicken small intestine consists of Lactobacilli, though in young animals, Romboutsia or Turicibacter may dominate in some individuals [5]. Microbial density and complexity considerably increase in the caecum, reaching total bacterial counts of approximately 1010 per g. Due to its high complexity, it is impossible to specify a few species dominating in the caecum, but at the family level, Lachnospiraceae, Ruminococcaceae, and Bacteroidaceae represent the most frequent colonisers of the chicken caecum [6]. Both specialised functions in nutrient absorption and interactions with gut microbiota, therefore, should affect gene expression in these two compartments of the digestive tract.
Microbiota in the densely populated caecum provide its host with lactate, acetate, propionate, or butyrate via digestion and fermentation of complex polysaccharides, which cannot be degraded by host digestive enzymes. Although this part of microbiota activity is considered beneficial for its host, gut microbiota metabolism is also a source of potentially harmful substances, which need to be further metabolised by the host, e.g., methanethiol, the product of microbial methionine catabolism [7]. Moreover, intestinal microbiota, as any other prokaryotic organism, represents a source of microbe-associated molecular patterns (MAMPs), which are sensed by the host through so-called pattern recognition receptors and may stimulate the immune system eventually leading to undesirable inflammation. Finally, conditions in the caecum are characterised by low oxygen levels, which place unusual metabolic demands on the colonic epithelial cells that act at a lower partial pressure of oxygen than other tissues [8]. This results in additional adaptation of the colonic epithelium to “physiologic hypoxia” [9]. Many details concerning the caecum physiology, its response to commensal bacteria, their metabolic products, and all of this operating under low oxygen availability, are not yet fully understood. Studies concerning the diverse aspects of intestinal physiology are therefore needed to serve as a background for future functional studies.
To differentiate between specific functions of the ileum and the caecum, in this study, we identified and compared proteins expressed in the chicken ileum and caecum. Using an unbiased LC-MS/MS protocol, we found that proteins specific to the ileum were those required for nutrient digestion and absorption. On the other hand, proteins characteristic of the caecum were involved in detoxification, hydrogen sulphide (H2S) metabolism, cell motility associated with wound healing, and suppression of oxidative stress and inflammatory response.

2. Materials and Methods

2.1. Origin of Chicken Samples

Newly hatched male ISA Brown chicks were obtained from a local commercial hatchery on the day of hatching. Chicks were reared in perforated plastic boxes of 2 m2 with free access to water and standard starter feed, i.e., not sterilised. No specific feed additives or therapeutics were used. The temperature was set to 30 °C during the first week of life.
Altogether, 18 ileal and 57 caecal samples were processed and analysed. All the caecum samples were taken from the middle part of the organ. The ileum was sampled approximately 10 mm proximal to the ileocaecal junction. Following necropsy, the samples were stored in RNA later at −70 °C before parallel RNA and protein purification.

2.2. Protein and RNA Purification from Chicken Caecal and Ileal Tissue

Samples of chicken caecal and ileal tissues (50–100 mg) were homogenised in TRI Reagent (MRC) and RNA, and proteins were recovered from upper water and lower phenolic phase, as previously described [10]. mRNA was immediately reverse transcribed into cDNA using M-MLV reverse transcriptase (Invitrogen) and oligo (dT) primers.

2.3. Protein Mass Spectrometry

Acetone precipitated protein pellets were dissolved in 300 μL of 8 M urea and processed according to the FASP protocol [11] as described elsewhere [12].
LC–MS/MS analysis of resulting tryptic peptides was performed using an UltiMate 3000 RSLC liquid chromatograph (Dionex) connected to an LTQ-Orbitrap Velos Pro mass spectrometer (Thermo Scientific). Raw LC–MS/MS data were analysed using Proteome Discoverer v1.4. MS/MS, and spectra identifications were performed by the SEQUEST algorithm using the chicken protein sequence database. Only peptides with a false discovery rate of ≤ 5% were considered.

2.4. Quantitative Reverse-Transcribed PCR (qRT-PCR)

cDNA was diluted 10 × with sterile water prior to real-time PCR. qRT-PCR was performed in 3 μL volumes in 384-well microplates using QuantiTect SYBR Green PCR Master Mix (QIAGEN) and a NanoDrop pipetting station (Inovadyne) for PCR mix dispensing, as described previously [12]. The Ct values of the genes of interest were normalised (ΔCt) to a geomean Ct value of 3 reference genes, TBP1, HMBS, and ADA, and the relative expression of each gene of interest was calculated as 2−ΔCt. The house-keeping reference genes were chosen out of 9 candidates using NormFinder software [13]. All the primers are listed in Supplementary File S1.

2.5. Statistics

To identify differentially expressed proteins, peptide spectrum matches (PSMs) counts were used to calculate protein abundance as a percentage in each sample. Only proteins of abundance higher than 0.05% were included in the subsequent analysis. In order to be robust in analysis and to identify the most prominent specific functions of each organ, protein expression was considered as organ specific for the ileum or caecum when showing a ≥3-differential fold ratio (DFR), and a Mann–Whitney test p-value was lower than 0.05.
Mann–Whitney test was used for the comparison of the transcriptional values in the caecum and ileum determined by qRT PCR. Genes were considered as differentially expressed in these tissues when p < 0.05.

2.6. Ethics Approval and Consent to Participate

The handling of animals was performed in accordance with current Czech legislation (Animal Protection and Welfare Act No. 246/1992 Coll. of the Government of the Czech Republic). The specific experiments were approved by the Ethics Committee of the Veterinary Research Institute, followed by the Committee for Animal Welfare of the Ministry of Agriculture of the Czech Republic (permit number MZe1922).

3. Results

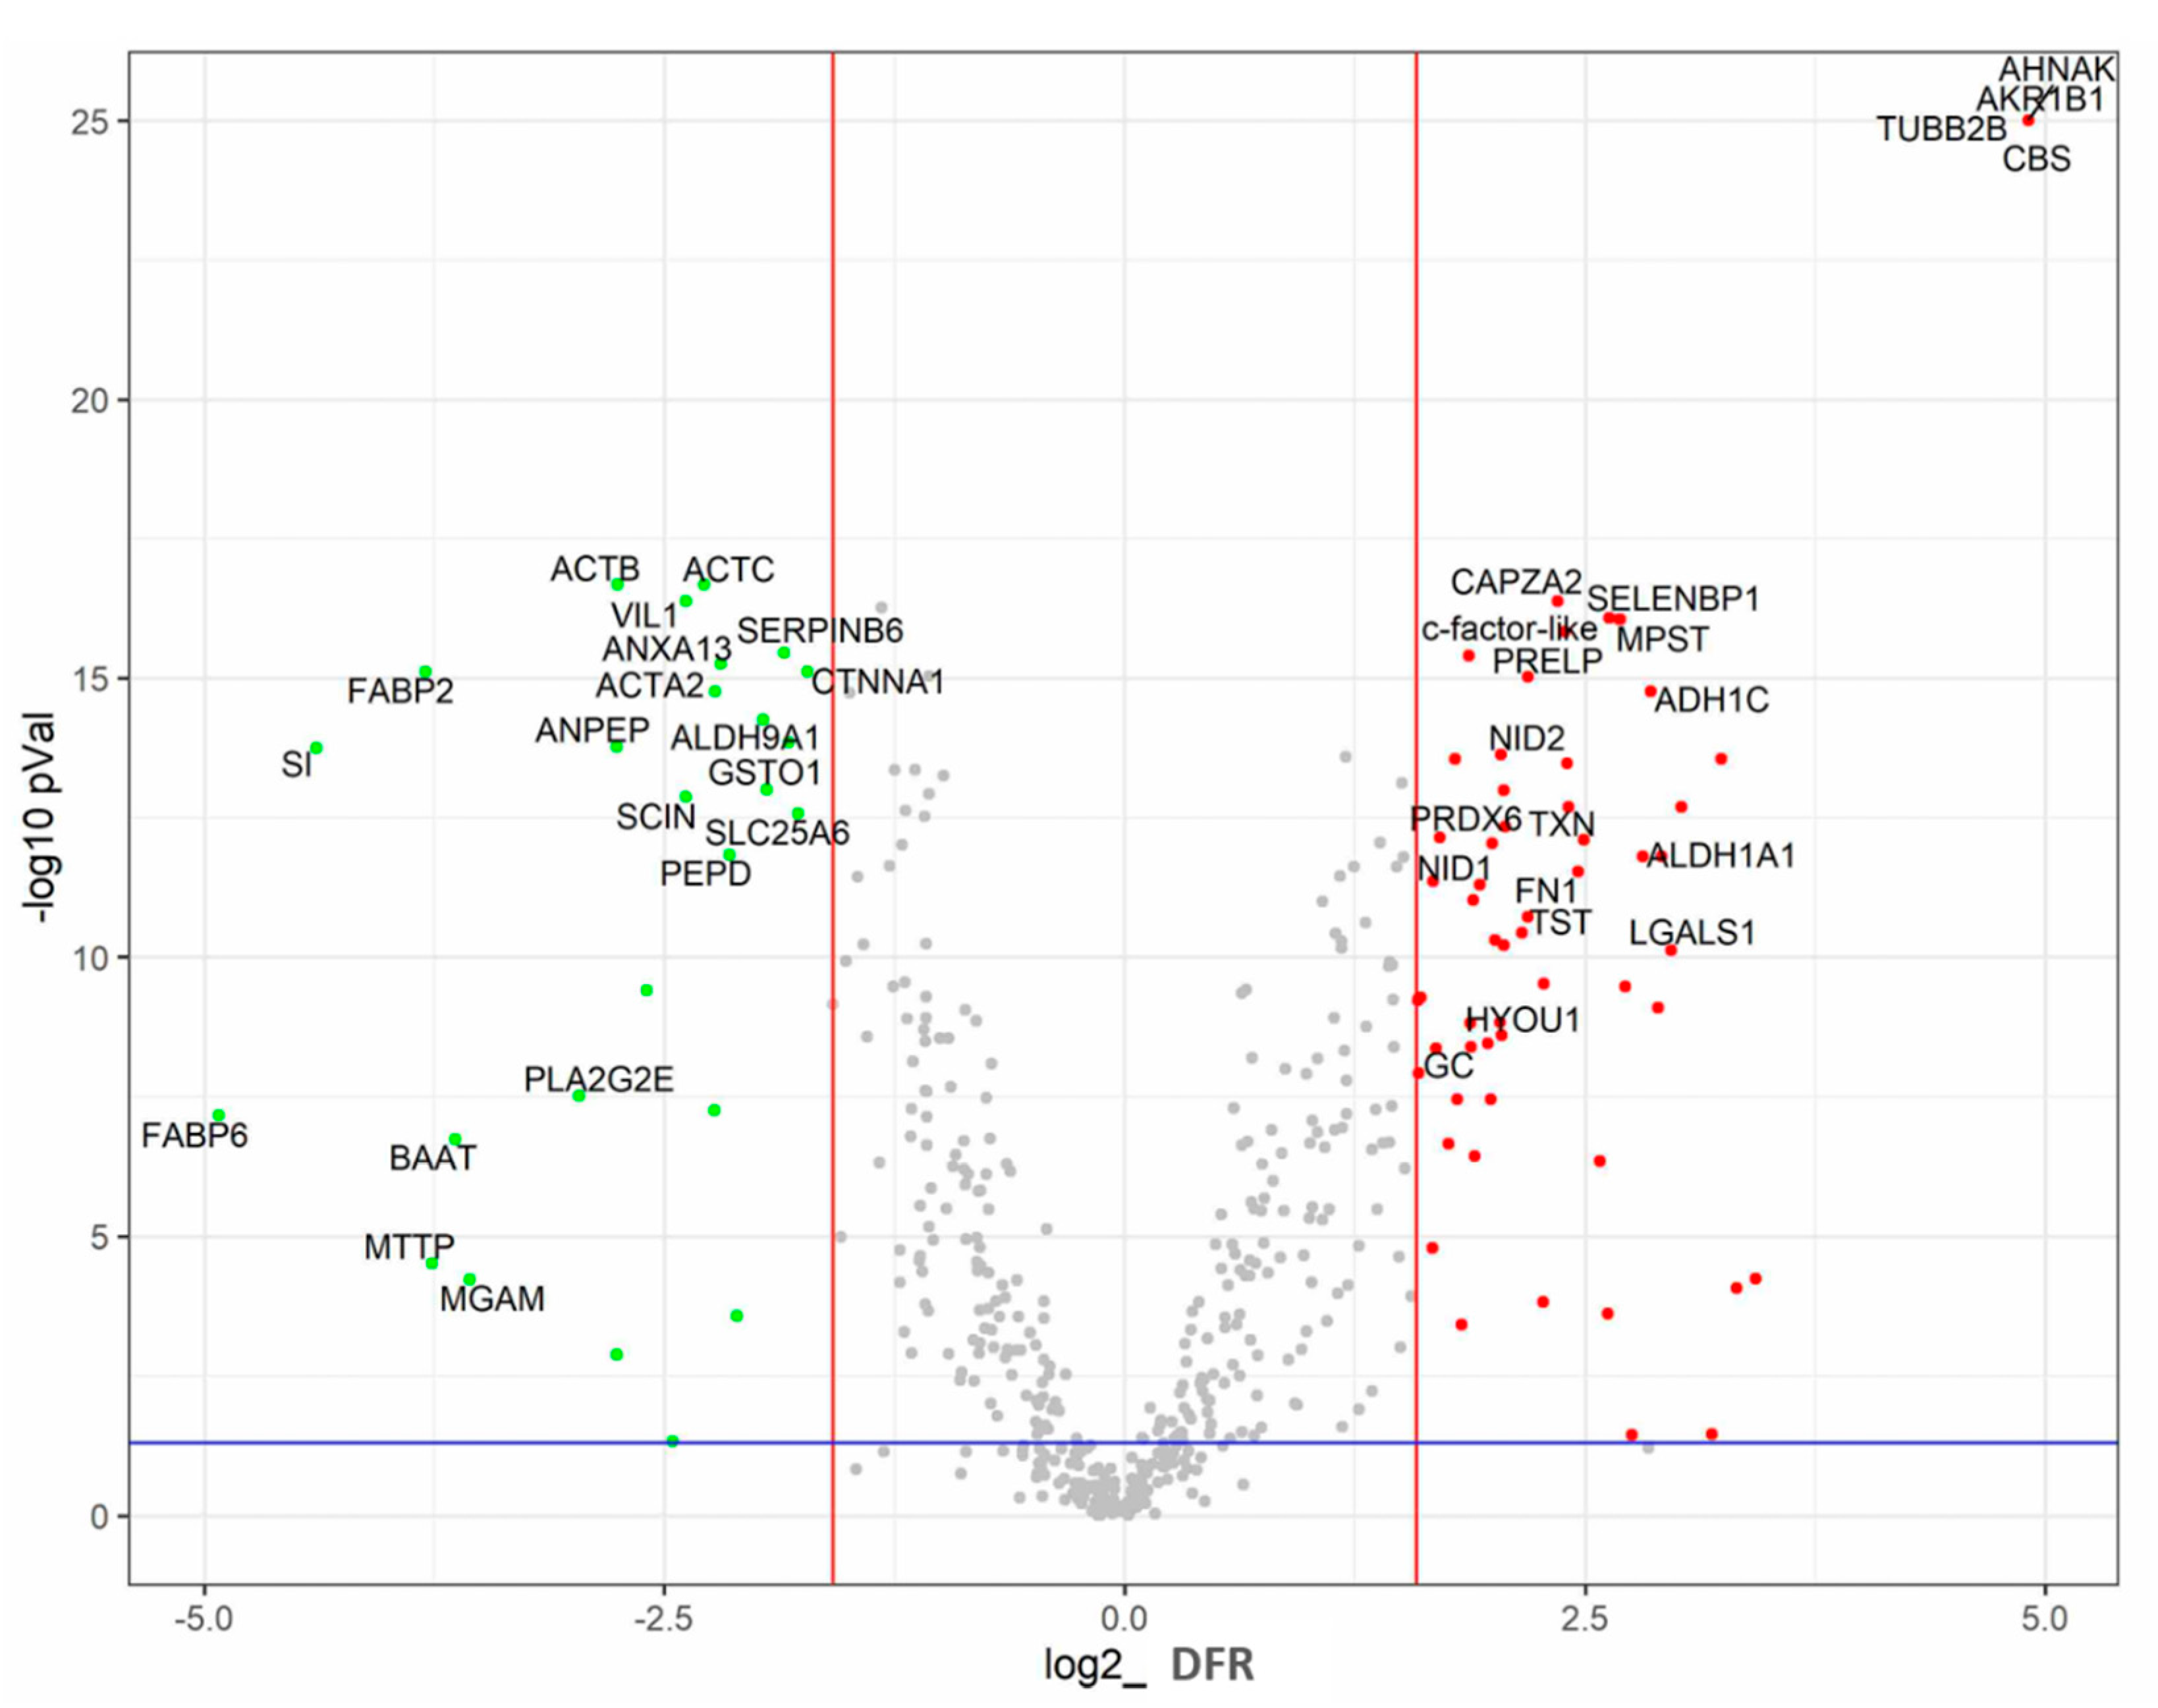
3.1. Gross Comparison of Protein Expression in the Ileum and Caecum

Altogether, 11,361 chicken proteins were detected. However, when only the proteins representing at least 0.05% of total protein in at least one of the two tissues were considered, the number of compared proteins decreased to 484 (Figure 1). Of these, 91 proteins were differentially expressed; 25 were enriched in the ileum and 66 in the caecum. Nine caecum-specific proteins were expressed exclusively in the caecum, i.e., were not detected in the ileum at all, while there was not one protein exclusively specific for the ileum.

3.2. Ileum-Specific Proteins

Four proteins specific to the ileum were of notably higher abundance compared with the remaining ileal proteins. These included three actins—ACTA2, ACTB, and ACTC—and fatty acid-binding protein 6 (FABP6). Each of these proteins formed more than 4% of total ileal proteins (Table 1). Functionally, the 20 most abundant ileum-specific proteins could be grouped into proteins forming cytoskeleton or involved in digestion, and lipid and bile acid metabolism (Table 2). The expression of six ileum-specific proteins was verified at the mRNA level by qRT-PCR. Four of them (FABP6, VIL1, SI, and BAAT) were confirmed to be differentially expressed in the ileum and caecum, also at mRNA level, while differential expression at the transcriptional level was not confirmed for ACTB and CTNNA1 (Table 1).

3.3. Caecum-Specific Proteins

In total, 66 proteins were identified as caecum specific. Expression of the caecum-specific proteins represented 11.70% of total caecal proteins. Galectin 1 (GAL-1) was the protein with the highest abundance in the caecum, followed by thioredoxin (TXN) and c-factor-like protein. The expression of 11 caecum-specific proteins was verified at the mRNA level by qRT-PCR, and all of them were confirmed to be differentially expressed in the caecum and ileum (Table 3).

3.4. Functional Analysis of Caecum-Specific Proteins

To identify enriched sets of proteins, the caecum-specific gene set was analysed by STRING [14]. A total of 12 proteins (AKR1B1L, ALDH1A1, PRDX6, MPST, CBS, ADH1C, SELENBP1, SULT1E1, NDUFV2, FH, NDUFS1, ENO2) were identified as related to drug metabolic processes and metabolism of exogenous substances. Of these, AKR1B1L, ALDH1A1, PRDX6, MPST, CBS, ADH1C, and SELENBP1 represent different oxidoreductases (Figure 2), which indicates that the majority of exogenous substances are degraded by oxidation/reduction processes. These proteins represented 22.48% of caecum-specific proteins (Table 4).
Overall, 12 proteins (GAL-1, FN1, AHNAK, CAPZA2, FHL2, CAPZA1, PLG, TNC, NMNAT3, AIMP1, COL5A1, POSTN) were identified as involved in wound healing. These proteins represented 17.39% of caecum-specific proteins.
Further, 14 proteins (FN1, NID2, NID1, PRELP, TNC, PLG, COL5A1, POSTN, AIMP1, CAST, TNXB, PXN, CTTN, ACTN2) belonged to an extracellular matrix organisation and cell–matrix adhesion proteins. These proteins represented 13.52% of caecum-specific proteins. Five of those proteins (PRELP, FN1, COL5A1, POSTN, and TNXB) bind sulphated glycosaminoglycans, a family of complex polysaccharides found in the extracellular matrix and on cell surfaces.
Another enriched group of proteins included those involved in the cellular response to stress (TXN, TUBB2B, PRDX6, CAPZA2, CAPZA1, ATOX1, ST13, TNXB). Proteins in this category represented 11.59% of all caecum-specific proteins.
Finally, there was a group of three proteins—CBS, MPST, and TST—identified as related to the catabolism of sulphur-containing amino acids. Together with methanethiol oxidase SELENBP1 [7], these proteins are related to H2S metabolism. Since these proteins ranked 4, 5, 9, and 13 among the most abundant caecum-specific proteins, representing 8.71% of caecum-specific proteins, H2S release and detoxification is an additional important function of the caecal tissue (Table 4, Figure 2).

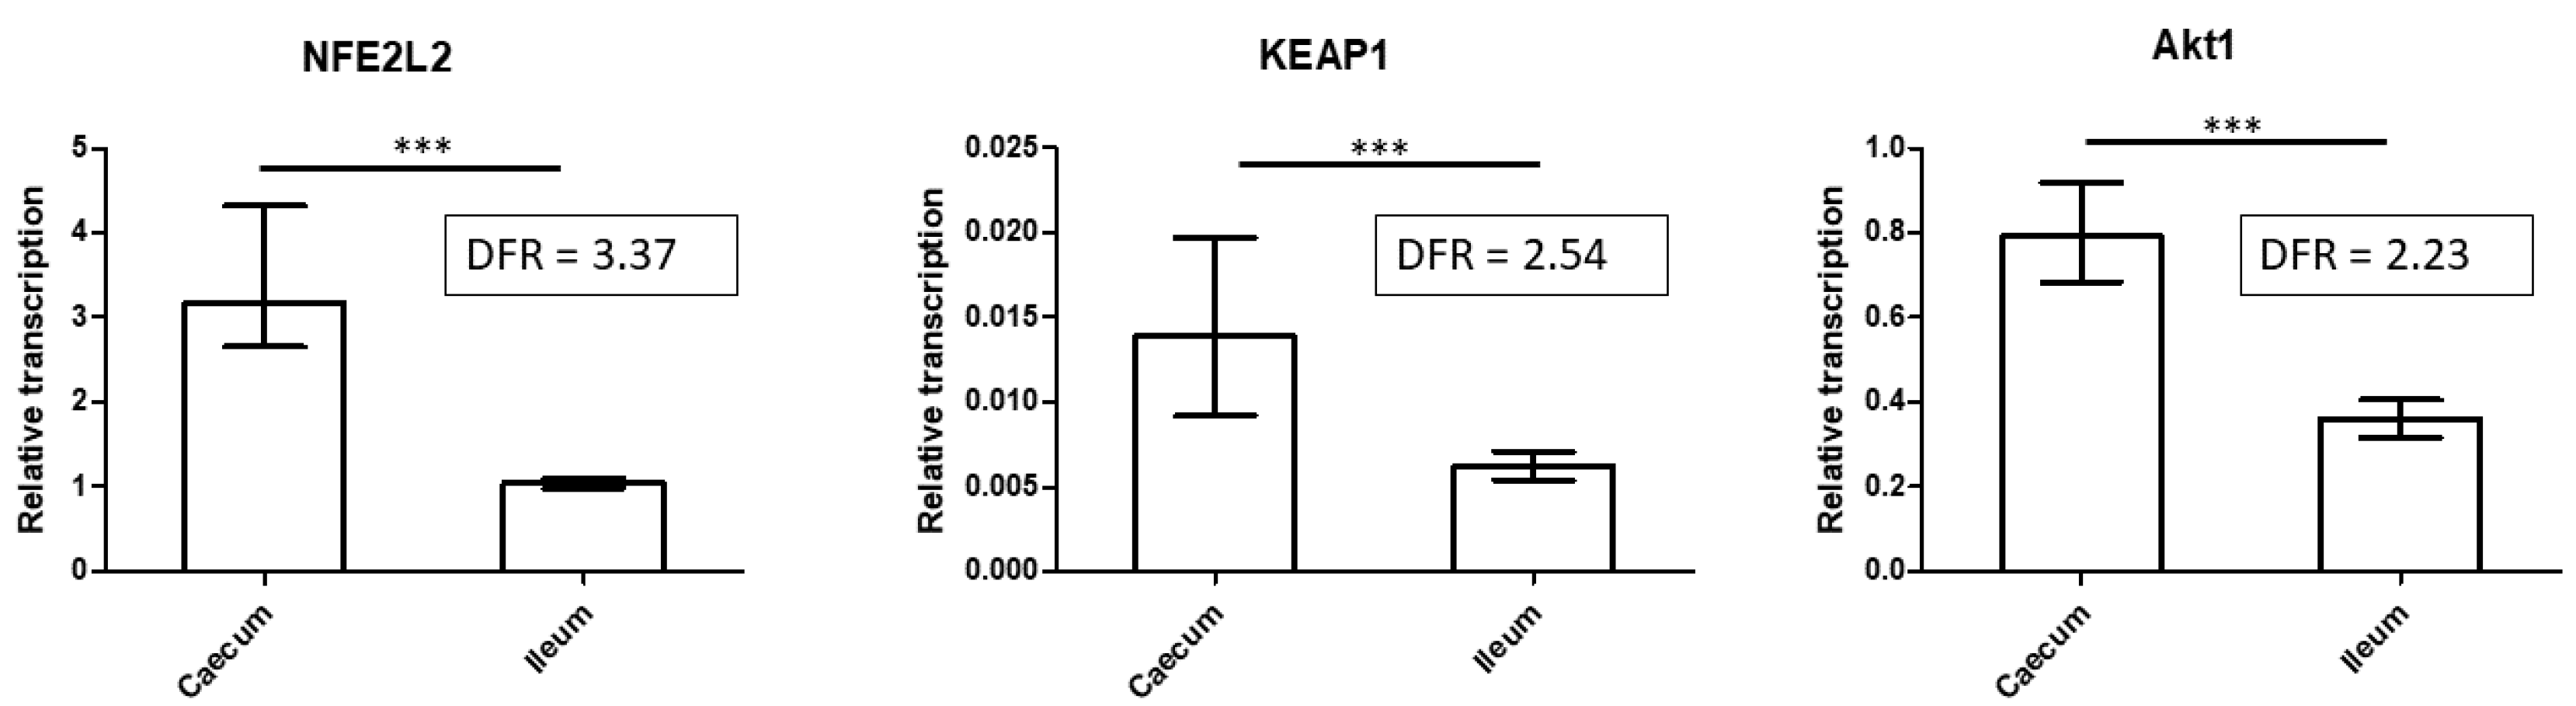
3.5. Expression of Key Regulatory Proteins of Oxidative Stress

As multiple caecum-specific proteins were related to redox sensing and response, expression of the main oxidative stress transcriptional factor NFE2L2, its directly regulated cytoplasmic repressor Keap1, and functionally related AKT1 were determined by qRT PCR. As expected, all three genes were significantly more transcribed in the caecum than in the ileum (Figure 3).

4. Discussion

To better understand differences in the caecum and ileum functions in chickens, protein expression in these two parts of the intestinal tract was determined by mass spectrometry. There has been a similar study which utilised RNA sequencing to compare transcriptome in the jejunum and caecum [15]. Despite methodological differences, SI, MGAM, and FABP2 were identified as proteins specific for the small intestine, and CBS, c-factor-like protein, and SELENBP1 were similarly identified as genes specifically expressed in the caecum in both studies.
Over 73% of ileum-specific proteins represented either structural or enzymatic components of the apical part of the intestinal epithelium. Three actins (ACTA2, ACTB, and ACTC), villin (VIL1), myosin-1a (MYO1A), and adseverin (SCIN) are responsible for the morphology of enterocyte microvilli [16]. Four digestion enzymes (SI, MGAM, PEPD, ANPEP) are also typical for enterocyte brush border [17,18]. SI and MGAM work concurrently to hydrolyse the mixture of oligosaccharides resulting from starch digestion to glucose and other monosaccharides [19], and ANPEP and PEPD ensure peptide digestion. Another group of ileum-specific proteins was involved in lipid and bile acid metabolism. The role of ileum in bile acid metabolism is known and the specificity of BAAT or FABP6 for ileum has been reported [20]. The chicken ileum is therefore the site of efficient nutrient digestion and absorption.
The function of chicken caecal tissue was more complex. Oxidative reduction events, detoxification, H2S metabolism, and wound healing were the functions, which differentiated the caecum from the ileum. Due to the difference in microbiota density and composition in the ileum and caecum and the fact that the expression of some of these proteins is influenced by gut microbiota [10,12], we propose that expression of these systems is at least partially influenced by MAMP signalling pathways and metabolism of microbiota metabolic products.
Aldehyde dehydrogenase 1 (ALDH1A1) is a detoxifying enzyme which catalyses the oxidation of exogenous and endogenous aldehyde substrates to their corresponding carboxylic acids and is considered a marker of stem cells as well as cancer cells in different tissues including the colon [21,22]. Alcohol dehydrogenase, aldo–keto reductase (ADH1C, AKR1B1L), and likely also c-factor-like protein (based on similarity) [23,24,25,26] represent enzymes which are closely related to ALDH1A1. TXN and PRDX6 suppress oxidative stress caused by reactive oxygen species by preventing protein oxidation by cysteine thiol–disulphide exchange [27,28] and CBS-producing L-cystathionine protects against stress-induced cell death [29,30].
Beta-galactoside-binding lectin (galectin-1; GAL-1) represented the most abundant caecum-specific protein, similar to a report in humans [31]. Galectin-1 is involved in interactions between cells and the extracellular matrix [32,33] but exhibits also strong immunomodulatory tolerogenic potential [34,35]. This may correspond with a much higher exposure of the caecal epithelium to luminal microbiota. Higher activity in caecal wound healing is documented by specific expression of nidogen-1 and -2 which connect laminin and collagen IV networks in basement membranes [36,37,38] or fibronectin involved in cell adhesion, motility, and migration associated with wound healing [39]. An additional set of caecum-specific proteins associated with epithelium integrity was involved in cell migration and coordinated epithelial sheet motility. These included AHNAK, CAPZA2, CAPZA1, RDX, CTTN and FHL2 [40,41,42,43,44,45]. Furthermore, TNX, ENO2, and CHGA are exclusively expressed by neuronal and neuroendocrine cells [46,47], and their higher abundance in the caecum reflects differences in innervation as well as in the neuroendocrine cell distribution between small and large intestine observed earlier [48].
The role of H2S in the colon/caecum is not fully understood. Although negative effects of high levels of H2S produced by enteric bacteria were reported [49,50], there are numerous studies demonstrating protective effects of H2S against chemical and oxidative stress in induced GI tract injury, as well as its role in promoting resolution of inflammation and repair of tissue damage [51,52,53]. H2S also regulates host–microbiota cohabitation by promoting mucus secretion and microbiota biofilm formation [54]. Additionally, cytoprotective transcriptional regulators NFE2L2 [55] and AKT1 were transcribed at a higher level in the caecum than in the ileum. Since NFE2L2 is activated in conditions of oxidative stress [56], and the AKT1 pathway plays a major role in cell survival [57], this further confirms the higher need for stress-suppressing mechanisms in the caecum than in the ileum.

5. Conclusions

At an early age, the chicken caecum, compared with the ileum, has a higher capacity to sense and limit the consequences of oxidative stress caused at least partially by exposure to a complex mixture of MAMPs and gut microbiota metabolism products. This likely causes micro-disruptions of the intestinal barrier, which is counter-balanced by increased cell motility associated with epithelium renewal. This is coupled with the activation of mechanisms suppressing the inflammatory response. Collectively, the obtained results show that the caecum is responsible for more than mere water absorption and nitrogen metabolism.

Supplementary Materials

The following are available online at https://www.mdpi.com/article/10.3390/ani11113155/s1. Supplementary File S1: Primers used in the study—The list of all primers used and referred to in the study, Supplementary File S2: Protein expression data—Table of protein abundance expressed as a percentage in each sample. Only proteins of abundance higher than 0.05% are shown.

Author Contributions

Conceptualisation, J.V. and I.R.; investigation, J.R. and Z.S.; data curation; Z.S.; formal analysis, V.B.; writing—original draft preparation, J.V.; writing—review and editing, I.R.; visualisation, J.R. and J.V.; funding acquisition, I.R. All authors have read and agreed to the published version of the manuscript.

Funding

This work has been supported by project RVO0518 of the Czech Ministry of Agriculture and INPOMED ATCZ194 project from the Czech Ministry of Regional Development.

Institutional Review Board Statement

The handling of animals was performed in accordance with current Czech legislation (Animal Protection and Welfare Act No. 246/1992 Coll. of the Government of the Czech Republic). The specific experiments were approved by the Ethics Committee of the Veterinary Research Institute, followed by the Committee for Animal Welfare of the Ministry of Agriculture of the Czech Republic (Permit Number MZe1922).

Data Availability Statement

Data generated or analysed during this study are included in this published article and its Supplementary Information Files.

Acknowledgments

Authors wish to thank Peter Eggenhuizen and Clayton Elsheimer for English language corrections.

Conflicts of Interest

The authors declare no conflict of interest.

Abbreviations

ACTA2: Actin alpha 2; ACTB: Actin beta; ACTC: Actin alpha cardiac; ACTN2: Actinin alpha 2, ADH1C: Alcohol dehydrogenase 1C; AHNAK: AHNAK nucleoprotein, Desmoyokin; AIMP1: Aminoacyl TRNA synthetase complex interacting multifunctional protein 1; ANPEP: Membrane alanyl aminopeptidase; AKR1B1L: Aldo-keto reductase family 1, member B1-like; AKT1: AKT serine/threonine kinase 1; ALDH1A1: Aldehyde dehydrogenase 1 family member A1; ATOX1: Antioxidant 1 copper chaperone, BAAT: Bile acid-CoA:amino acid N-acyltransferase; CAPZA1: Capping actin protein of muscle Z-line subunit alpha 1; CAPZA2: Capping actin protein of muscle Z-line subunit alpha 2; CAST: Calpastatin; CBS: Cystathionine beta-synthase; COL5A1: Collagen type V alpha 1 chain; CTNNA1: Catenin alpha 1; CTTN: Cortactin; ENO2: Enolase 2; FABP6: Fatty acid binding protein 6; FH: Fumarate hydratase; FHL2: Four and a half LIM domains 2; FN1: Fibronectin 1; GAL-1: Galectin 1; KEAP1: Kelch like ECH associated protein 1; MGAM: Maltase-glucoamylase; MPST: Mercaptopyruvate sulphurtransferase; NDUFS1: NADH:ubiquinone oxidoreductase core subunit S1; NDUFV2: NADH:ubiquinone oxidoreductase core subunit V2; NFE2L2: Nuclear factor, erythroid 2 like 2; NID1: Nidogen 1; NID2: Nidogen 2; NMNAT3: Nicotinamide nucleotide adenylyltransferase 3; PEPD: Peptidase D; PLG: Plasminogen; POSTN: Periostin; PRDX6: Peroxiredoxin 6; PRELP: Proline and arginine rich end leucine rich repeat protein; PXN: Paxillin; SELENBP1: Selenium binding protein 1; SI: Sucrase-isomaltase; ST13: ST13 Hsp70 interacting protein; SULT1E1: Sulphotransferase family 1E member 1; TNC: Tenascin C; TNXB: Tenascin XB; TST: Thiosulphate sulphurtransferase; TUBB2B: Tubulin beta 2B class IIb; TXN: Thioredoxin; VIL1: Villin 1

References

  1. Svihus, B.; Choct, M.; Classen, H. Function and nutritional roles of the avian caeca: A review. World’s Poult. Sci. J. 2013, 69, 249–264. [Google Scholar] [CrossRef]
  2. Isshiki, Y.; Nakahiro, Y. Effect of Ceca Removal on Water Absorption in Chickens. Jpn. Poult. Sci. 1975, 12, 271–273. [Google Scholar] [CrossRef] [Green Version]
  3. Sanders, K.M.; Koh, S.D.; Ro, S.; Ward, S.M. Regulation of gastrointestinal motility—insights from smooth muscle biology. Nat. Rev. Gastroenterol. Hepatol. 2012, 9, 633–645. [Google Scholar] [CrossRef] [Green Version]
  4. Clench, M.H. The Avian Cecum: Update and Motility Review. J. Exp. Zool. 1999, 283, 441–447. [Google Scholar] [CrossRef]
  5. Videnska, P.; Faldynova, M.; Juricova, H.; Babak, V.; Sisak, F.; Havlickova, H.; Rychlik, I. Chicken faecal microbiota and disturbances induced by single or repeated therapy with tetracycline and streptomycin. BMC Vet. Res. 2013, 9, 30. [Google Scholar] [CrossRef] [PubMed] [Green Version]
  6. Videnska, P.; Sedlar, K.; Lukac, M.; Faldynova, M.; Gerzova, L.; Cejkova, D.; Sisak, F.; Rychlik, I. Succession and Replacement of Bacterial Populations in the Caecum of Egg Laying Hens over Their Whole Life. PLoS ONE 2014, 9, e115142. [Google Scholar] [CrossRef] [PubMed] [Green Version]
  7. Pol, A.; Renkema, G.H.; Tangerman, A.; Winkel, E.G.; Engelke, U.F.; De Brouwer, A.P.M.; Lloyd, K.C.; Araiza, R.S.; Heuvel, L.V.D.; Omran, H.; et al. Mutations in SELENBP1, encoding a novel human methanethiol oxidase, cause extraoral halitosis. Nat. Genet. 2018, 50, 120–129. [Google Scholar] [CrossRef] [Green Version]
  8. Zheng, L.; Kelly, C.; Colgan, S.P. Physiologic hypoxia and oxygen homeostasis in the healthy intestine. A Review in the Theme: Cellular Responses to Hypoxia. Am. J. Physiol.-Cell Physiol. 2015, 309, C350–C360. [Google Scholar] [CrossRef] [Green Version]
  9. Colgan, S.P.; Taylor, C. Hypoxia: An alarm signal during intestinal inflammation. Nat. Rev. Gastroenterol. Hepatol. 2010, 7, 281–287. [Google Scholar] [CrossRef] [Green Version]
  10. Volf, J.; Polansky, O.; Sekelova, Z.; Velge, P.; Schouler, C.; Kaspers, B.; Rychlik, I. Gene expression in the chicken caecum is dependent on microbiota composition. Veter. Res. 2017, 48, 85. [Google Scholar] [CrossRef] [Green Version]
  11. Wiśniewski, J.R.; Zougman, A.; Nagaraj, N.; Mann, M. Universal sample preparation method for proteome analysis. Nat. Methods 2009, 6, 359–362. [Google Scholar] [CrossRef] [PubMed]
  12. Volf, J.; Polansky, O.; Varmuzova, K.; Gerzova, L.; Sekelova, Z.; Faldynova, M.; Babak, V.; Medvecky, M.; Smith, A.L.; Kaspers, B.; et al. Transient and Prolonged Response of Chicken Cecum Mucosa to Colonization with Different Gut Microbiota. PLoS ONE 2016, 11, e0163932. [Google Scholar] [CrossRef] [PubMed]
  13. Andersen, C.L.; Jensen, J.L.; Ørntoft, T.F. Normalization of Real-Time Quantitative Reverse Transcription-PCR Data: A Model-Based Variance Estimation Approach to Identify Genes Suited for Normalization, Applied to Bladder and Colon Cancer Data Sets. Cancer Res. 2004, 64, 5245–5250. [Google Scholar] [CrossRef] [PubMed] [Green Version]
  14. Szklarczyk, D.; Gable, A.L.; Lyon, D.; Junge, A.; Wyder, S.; Huerta-Cepas, J.; Simonovic, M.; Doncheva, N.T.; Morris, J.H.; Bork, P.; et al. STRING v11: Protein–protein association networks with increased coverage, supporting functional discovery in genome-wide experimental datasets. Nucleic Acids Res. 2019, 47, D607–D613. [Google Scholar] [CrossRef] [Green Version]
  15. Bertocchi, M.; Sirri, F.; Palumbo, O.; Luise, D.; Maiorano, G.; Bosi, P.; Trevisi, P. Exploring Differential Transcriptome between Jejunal and Cecal Tissue of Broiler Chickens. Animals 2019, 9, 221. [Google Scholar] [CrossRef] [Green Version]
  16. Tyska, M.J.; Mackey, A.T.; Huang, J.-D.; Copeland, N.G.; Jenkins, N.A.; Mooseker, M.S. Myosin-1a Is Critical for Normal Brush Border Structure and Composition. Mol. Biol. Cell 2005, 16, 2443–2457. [Google Scholar] [CrossRef] [Green Version]
  17. Sim, L.; Quezada-Calvillo, R.; Sterchi, E.E.; Nichols, B.L.; Rose, D.R. Human Intestinal Maltase–Glucoamylase: Crystal Structure of the N-Terminal Catalytic Subunit and Basis of Inhibition and Substrate Specificity. J. Mol. Biol. 2008, 375, 782–792. [Google Scholar] [CrossRef]
  18. Danielsen, E.M. Tyrosine Sulfation, a Post-Translational Modification of Microvillar Enzymes in the Small Intestinal Entero-cyte. EMBO J. 1987, 6, 2891–2896. [Google Scholar] [CrossRef] [PubMed]
  19. Sim, L.; Willemsma, C.; Mohan, S.; Naim, H.Y.; Pinto, B.M.; Rose, D.R. Structural Basis for Substrate Selectivity in Human Maltase-Glucoamylase and Sucrase-Isomaltase N-terminal Domains. J. Biol. Chem. 2010, 285, 17763–17770. [Google Scholar] [CrossRef] [PubMed] [Green Version]
  20. Praslickova, D.; Torchia, E.C.; Sugiyama, M.G.; Magrane, E.J.; Zwicker, B.L.; Kolodzieyski, L.; Agellon, L.B. The Ileal Lipid Binding Protein Is Required for Efficient Absorption and Transport of Bile Acids in the Distal Portion of the Murine Small Intestine. PLoS ONE 2012, 7, e50810. [Google Scholar] [CrossRef] [Green Version]
  21. Huang, E.; Hynes, M.J.; Zhang, T.; Ginestier, C.; Dontu, G.; Appelman, H.; Fields, J.Z.; Wicha, M.S.; Boman, B.M. Aldehyde Dehydrogenase 1 Is a Marker for Normal and Malignant Human Colonic Stem Cells (SC) and Tracks SC Overpopulation during Colon Tumorigenesis. Cancer Res. 2009, 69, 3382–3389. [Google Scholar] [CrossRef] [PubMed] [Green Version]
  22. Vassalli, G. Aldehyde Dehydrogenases: Not Just Markers, but Functional Regulators of Stem Cells. Stem Cells Int. 2019, 2019, 3904645. [Google Scholar] [CrossRef] [Green Version]
  23. Taskoparan, B.; Seza, E.G.; Demirkol, S.; Tunçer, S.; Stefek, M.; Gure, A.O.; Banerjee, S. Opposing roles of the aldo-keto reductases AKR1B1 and AKR1B10 in colorectal cancer. Cell. Oncol. (Dordr.) 2017, 40, 563–578. [Google Scholar] [CrossRef] [PubMed] [Green Version]
  24. Nanson, J.D.; Forwood, J.K. Structural Characterisation of FabG from Yersinia pestis, a Key Component of Bacterial Fatty Acid Synthesis. PLoS ONE 2015, 10, e0141543. [Google Scholar] [CrossRef] [PubMed]
  25. Mayoral, J.G.; Leonard, K.T.; DeFelipe, L.A.; Turjansksi, A.G.; Nouzova, M.; Noriegal, F.G. Functional analysis of a mosquito short-chain dehydrogenase cluster. Arch. Insect Biochem. Physiol. 2013, 82, 96–115. [Google Scholar] [CrossRef] [Green Version]
  26. Li, H.; Li, Y.; Yang, L.; Zhang, D.; Liu, Z.; Wang, Y.; Han, R.; Li, G.; Li, Z.; Tian, Y.; et al. Identification of a Novel Lipid Metabolism-Associated Hepatic Gene Family Induced by Estrogen via ERα in Chicken (Gallus gallus). Front. Genet. 2020, 11, 271. [Google Scholar] [CrossRef]
  27. Yodoi, J.; Matsuo, Y.; Tian, H.; Masutani, H.; Inamoto, T. Anti-Inflammatory Thioredoxin Family Proteins for Medicare, Healthcare and Aging Care. Nutrients 2017, 9, 1081. [Google Scholar] [CrossRef] [Green Version]
  28. Bindoli, A.; Fukuto, J.M.; Forman, H.J. Thiol Chemistry in Peroxidase Catalysis and Redox Signaling. Antioxid. Redox Signal. 2008, 10, 1549–1564. [Google Scholar] [CrossRef]
  29. Maclean, K.N.; Greiner, L.S.; Evans, J.R.; Sood, S.K.; Lhotak, S.; Markham, N.E.; Stabler, S.P.; Allen, R.H.; Austin, R.C.; Balasubramaniam, V.; et al. Cystathionine Protects against Endoplasmic Reticulum Stress-induced Lipid Accumulation, Tissue Injury, and Apoptotic Cell Death. J. Biol. Chem. 2012, 287, 31994–32005. [Google Scholar] [CrossRef] [Green Version]
  30. Wang, X.; Wang, Y.; Zhang, L.; Zhang, D.; Bai, L.; Kong, W.; Huang, Y.; Tang, C.; Du, J.; Jin, H. L-Cystathionine Protects against Homocysteine-Induced Mitochondria-Dependent Apoptosis of Vascular Endothelial Cells. Oxidative Med. Cell. Longev. 2019, 2019, 1253289. [Google Scholar] [CrossRef]
  31. Gobbi, R.P.; De Francesco, N.; Bondar, C.; Muglia, C.; Chirdo, F.; Rumbo, M.; Rocca, A.; Toscano, M.; Sambuelli, A.; A Rabinovich, G.; et al. A galectin-specific signature in the gut delineates Crohn’s disease and ulcerative colitis from other human inflammatory intestinal disorders. BioFactors 2016, 42, 93–105. [Google Scholar] [CrossRef]
  32. Thijssen, V.; Postel, R.; Brandwijk, R.J.M.G.E.; Dings, R.; Nesmelova, I.; Satijn, S.; Verhofstad, N.; Nakabeppu, Y.; Baum, L.G.; Bakkers, J.; et al. Galectin-1 is essential in tumor angiogenesis and is a target for antiangiogenesis therapy. Proc. Natl. Acad. Sci. USA 2006, 103, 15975–15980. [Google Scholar] [CrossRef] [PubMed] [Green Version]
  33. Wu, Y.; Liu, M.; Li, Z.; Wu, X.-B.; Wang, Y.; Wang, Y.; Nie, M.; Huang, F.; Ju, J.; Ma, C.; et al. LYAR promotes colorectal cancer cell mobility by activating galectin-1 expression. Oncotarget 2015, 6, 32890–32901. [Google Scholar] [CrossRef] [PubMed]
  34. Peng, Y.; Ye, Y.; Jia, J.; He, Y.; Yang, Z.; Zhu, X.; Huang, H.; Wang, W.; Geng, L.; Yin, S.; et al. Galectin-1-induced tolerogenic dendritic cells combined with apoptotic lymphocytes prolong liver allograft survival. Int. Immunopharmacol. 2018, 65, 470–482. [Google Scholar] [CrossRef]
  35. Garin, M.I.; Chu, C.-C.; Golshayan, D.; Cernuda-Morollón, E.; Wait, R.; Lechler, R.I. Galectin-1: A key effector of regulation mediated by CD4+CD25+ T cells. Blood 2007, 109, 2058–2065. [Google Scholar] [CrossRef] [Green Version]
  36. Fox, J.W.; Mayer, U.; Nischt, R.; Aumailley, M.; Reinhardt, D.; Wiedemann, H.; Mann, K.; Timpl, R.; Krieg, T.; Engel, J. Re-combinant Nidogen Consists of Three Globular Domains and Mediates Binding of Laminin to Collagen Type IV. EMBO J. 1991, 10, 3137–3146. [Google Scholar] [CrossRef]
  37. Reinhardt, D.; Mann, K.; Nischt, R.; Fox, J.; Chu, M.; Krieg, T.; Timpl, R. Mapping of nidogen binding sites for collagen type IV, heparan sulfate proteoglycan, and zinc. J. Biol. Chem. 1993, 268, 10881–10887. [Google Scholar] [CrossRef]
  38. Pöschl, E.; Fox, J.; Block, D.; Mayer, U.; Timpl, R. Two non-contiguous regions contribute to nidogen binding to a single EGF-like motif of the laminin gamma 1 chain. EMBO J. 1994, 13, 3741–3747. [Google Scholar] [CrossRef]
  39. Pankov, R.; Yamada, K. Fibronectin at a glance. J. Cell Sci. 2002, 115, 3861–3863. [Google Scholar] [CrossRef] [Green Version]
  40. Shankar, J.; Messenberg, A.; Chan, J.; Underhill, T.M.; Foster, L.J.; Nabi, I.R. Pseudopodial Actin Dynamics Control Epithelial-Mesenchymal Transition in Metastatic Cancer Cells. Cancer Res. 2010, 70, 3780–3790. [Google Scholar] [CrossRef] [Green Version]
  41. Mejillano, M.R.; Kojima, S.-I.; Applewhite, D.A.; Gertler, F.B.; Svitkina, T.M.; Borisy, G.G. Lamellipodial Versus Filopodial Mode of the Actin Nanomachinery: Pivotal Role of the Filament Barbed End. Cell 2004, 118, 363–373. [Google Scholar] [CrossRef] [Green Version]
  42. Ammer, A.G.; Weed, S.A. Cortactin branches out: Roles in regulating protrusive actin dynamics. Cell Motil. Cytoskelet. 2008, 65, 687–707. [Google Scholar] [CrossRef] [PubMed] [Green Version]
  43. Kirfel, J.; Pantelis, D.; Kabba, M.; Kahl, P.; Röper, A.; Kalff, J.C.; Buettner, R. Impaired intestinal wound healing in Fhl2-deficient mice is due to disturbed collagen metabolism. Exp. Cell Res. 2008, 314, 3684–3691. [Google Scholar] [CrossRef]
  44. Zhang, W.; Jiang, B.; Guo, Z.; Sardet, C.; Zou, B.; Lam, C.S.; Li, J.; He, M.-L.; Lan, H.-Y.; Pang, R.; et al. Four-and-a-half LIM protein 2 promotes invasive potential and epithelial-mesenchymal transition in colon cancer. Carcinogenesis 2010, 31, 1220–1229. [Google Scholar] [CrossRef] [PubMed]
  45. Wixler, V. The role of FHL2 in wound healing and inflammation. FASEB J. 2019, 33, 7799–7809. [Google Scholar] [CrossRef] [PubMed]
  46. Aktar, R.; Peiris, M.; Fikree, A.; Cibert-Goton, V.; Walmsley, M.; Tough, I.R.; Watanabe, P.; Araujo, E.J.D.A.; Mohammed, S.D.; Delalande, J.-M.; et al. The extracellular matrix glycoprotein tenascin-X regulates peripheral sensory and motor neurones. J. Physiol. 2018, 596, 4237–4251. [Google Scholar] [CrossRef]
  47. Kleist, B.; Poetsch, M. Neuroendocrine differentiation: The mysterious fellow of colorectal cancer. World J. Gastroenterol. 2015, 21, 11740–11747. [Google Scholar] [CrossRef]
  48. Gunawardene, A.; Corfe, B.M.; Staton, C.A. Classification and functions of enteroendocrine cells of the lower gastrointestinal tract. Int. J. Exp. Pathol. 2011, 92, 219–231. [Google Scholar] [CrossRef] [PubMed]
  49. Attene-Ramos, M.S.; Wagner, E.D.; Gaskins, H.R.; Plewa, M.J. Hydrogen Sulfide Induces Direct Radical-Associated DNA Damage. Mol. Cancer Res. 2007, 5, 455–459. [Google Scholar] [CrossRef] [Green Version]
  50. Attene-Ramos, M.S.; Nava, G.M.; Muellner, M.G.; Wagner, E.D.; Plewa, M.J.; Gaskins, H.R. DNA damage and toxicogenomic analyses of hydrogen sulfide in human intestinal epithelial FHs 74 Int cells. Environ. Mol. Mutagen. 2010, 51, 304–314. [Google Scholar] [CrossRef] [PubMed]
  51. Wallace, J.L.; Ferraz, J.G.; Muscara, M. Hydrogen Sulfide: An Endogenous Mediator of Resolution of Inflammation and Injury. Antioxid. Redox Signal. 2012, 17, 58–67. [Google Scholar] [CrossRef] [PubMed]
  52. Flannigan, K.L.; Ferraz, J.G.P.; Wang, R.; Wallace, J.L. Enhanced Synthesis and Diminished Degradation of Hydrogen Sulfide in Experimental Colitis: A Site-Specific, Pro-Resolution Mechanism. PLoS ONE 2013, 8, e71962. [Google Scholar] [CrossRef] [PubMed] [Green Version]
  53. Hirata, I.; Naito, Y.; Takagi, T.; Mizushima, K.; Suzuki, T.; Omatsu, T.; Handa, O.; Ichikawa, H.; Ueda, H.; Yoshikawa, T. Endogenous Hydrogen Sulfide Is an Anti-inflammatory Molecule in Dextran Sodium Sulfate-Induced Colitis in Mice. Dig. Dis. Sci. 2011, 56, 1379–1386. [Google Scholar] [CrossRef] [PubMed]
  54. Motta, J.-P.; Flannigan, K.L.; Agbor, T.A.; Beatty, J.K.; Blackler, R.W.; Workentine, M.L.; Da Silva, G.J.; Wang, R.; Buret, A.G.; Wallace, J.L. Hydrogen Sulfide Protects from Colitis and Restores Intestinal Microbiota Biofilm and Mucus Production. Inflamm. Bowel Dis. 2015, 21, 1006–1017. [Google Scholar] [CrossRef] [PubMed]
  55. Calvert, J.; Jha, S.; Gundewar, S.; Elrod, J.; Ramachandran, A.; Pattillo, C.B.; Kevil, C.; Lefer, D.J. Hydrogen Sulfide Mediates Cardioprotection Through Nrf2 Signaling. Circ. Res. 2009, 105, 365–374. [Google Scholar] [CrossRef] [PubMed] [Green Version]
  56. Nguyen, T.; Nioi, P.; Pickett, C.B. The Nrf2-Antioxidant Response Element Signaling Pathway and Its Activation by Oxidative Stress. J. Biol. Chem. 2009, 284, 13291–13295. [Google Scholar] [CrossRef] [PubMed] [Green Version]
  57. Wang, L.; Chen, Y.; Sternberg, P.; Cai, J. Essential Roles of the PI3 Kinase/Akt Pathway in Regulating Nrf2-Dependent Anti-oxidant Functions in the RPE. Investig. Ophthalmol. Vis. Sci. 2008, 49, 1671–1678. [Google Scholar] [CrossRef] [Green Version]
Figure 1. Volcano plot showing protein expressed in the caecum and ileum. Differential expressions presented as log2 of the ratio (X axis) are plotted against p values of each comparison. Coloured dots represent proteins fulfilling a threefold difference in abundance in the caecum or ileum and p-value < 0.05: green dots—proteins more abundant in the ileum; red dots—proteins more abundant in the caecum. Overall, 20 differentially expressed and the most abundant proteins in the ileum or caecum are identified. For the whole dataset, see Supplementary File S2. Position of FABP6 as ileum-specific protein and AHNAK, AKR1B1, TUBB2B, and CBS as caecum-specific proteins along the X axis does not represent their differential fold ratio as these proteins were highly specific for the ileum or caecum, respectively (see text below).
Animals 11 03155 g001
Figure 2. Caecum-specific proteins network generated by STRING. Size of the nodes is proportional to the caecum protein expression. Caecum exclusive proteins, i.e., proteins not expressed in the ileum at all, are highlighted in bold.
Animals 11 03155 g002
Figure 3. mRNA expression of NFE2L2, KEAP1, and AKT1 in the caecum and ileum. A higher level of transcription of NFE2L2, KEAP1, and AKT1, oxidative stress transcriptional regulators, was recorded in the caecum than in the ileum (Mann–Whitney, *** indicate p < 0.0005). DFR = differential fold ratio.
Animals 11 03155 g003
Table 1. Top 20 ileum-specific proteins ranked by abundance.
Protein Annotation Proteinp-ValueAbundance in Ileum [%]DFR *qRT-PCR Fold
ENSGALP00000010239 ACTA21.73 × 10−154.944.67 -#   
ENSGALP00000039176 ACTB2.09 × 10−174.826.75 NS   
ENSGALP00000018042 ACTC2.09 × 10−174.644.87 -   
ENSGALP00000002196 FABP66.95 × 10−84.12311.34 2.43   
ENSGALP00000037398 VIL14.18 × 10−170.605.21 6.43   
ENSGALP00000019528 FABP27.73 × 10−160.5013.89 -   
ENSGALP00000015467 SI1.78 × 10−140.4020.94 313.41   
ENSGALP00000003847 CTNNA17.72 × 10−160.273.30 NS   
ENSGALP00000037173 SCIN1.33 × 10−130.265.21 -   
ENSGALP00000005520 ALDH9A15.55 × 10−150.23.90 -   
ENSGALP00000020953 SERPINB63.45 × 10−160.173.61 -   
ENSGALP00000000256 MGAM5.94 × 10−50.1611.77 -   
ENSGALP00000007819 PEPD1.48 × 10−120.134.42 -   
ENSGALP00000032098 BAAT1.85 × 10−70.1212.42 7.00   
ENSGALP00000035815 SLC25A62.67 × 10−130.123.42 -   
ENSGALP00000008315 ANPEP1.68 × 10−140.106.76 -   
ENSGALP00000013682 GSTO19.86 × 10−140.103.85 -   
ENSGALP00000022884 PLA2G2E3.05 × 10−80.097.81 -   
ENSGALP00000026341 ANXA135.55 × 10−160.094.58 -   
ENSGALP00000036834 MTTP3.05 × 10−50.0913.57 -   
* DFR—differential fold ratio of protein abundance in the ileum compared to caecum. # “-“ = not tested, NS = not significant.
Table 2. Ileum-specific proteins grouped according to function.
Group DescriptionNo. of Proteins% Expression out of Ileum-Specific Proteins Proteins
Actin and actin-binding770.13ACTA2; ACTB; ACTC; VIL1; CTNNA1; SCIN; MYO1A
Bile metabolism and transport219.04FABP6; BAAT
Digestion enzymes43.53SI; MGAM; PEPD; ANPEP
Lipid metabolism and transport43.51FABP2; PLA2G2E; MTTP; PLIN4
Other83.80SERPINB6; ANXA13; GSTO1; SLC25A6; RPS8; RPS8; GDA; SORD
Table 3. The top 20 proteins specific for the caecum ranked according to abundance.
Protein AnnotationProteinp-ValueAbundance in Caecum [%]DFR *qRT-PCR FoldInfluenced by Microbiota Colonisation #
ENSGALP00000020275GAL-17.49 × 10−110.637.832.40  
ENSGALP00000025280TXN7.89 × 10−130.595.626.39  UP
ENSGALP00000001060c-factor-like8.37 × 10−170.486.20-  
ENSGALP00000026062CBSNA0.43500.003488.35  UP
ENSGALP00000001274SELENBP18.72 × 10−170.366.4414.72  
ENSGALP00000019979ADH1C1.73 × 10−150.217.2431.09  DOWN
ENSGALP00000036423TUBB2BNA0.20500.00-  
ENSGALP00000004816PRDX67.23 × 10−130.203.2813.14  
ENSGALP00000029947TST3.65 × 10−110.194.474.90  UP
ENSGALP00000017869NID15.04 × 10−120.183.81-  
ENSGALP00000005480AKR1B1LNA0.18500.00-  DOWN
ENSGALP00000005607PRELP9.41 × 10−160.184.56-  
ENSGALP00000024396ALDH1A11.58 × 10−120.177.0216.55  DOWN
ENSGALP00000005654FN12.98 × 10−120.165.502.37  
ENSGALP00000020214NID22.37 × 10−140.144.12-  
ENSGALP00000020373MPST8.72 × 10−170.146.467.43  
ENSGALP00000023289AHNAKNA0.12500.002.19  
ENSGALP00000039757HYOU12.52 × 10−90.124.13-  
ENSGALP00000015277CAPZA24.18 × 10−170.115.11-  
ENSGALP00000018939GC4.16 × 10−90.113.68-  DOWN
* DFR—differential fold ratio of protein abundance in the caecum compared to ileum. Value 500 was given to proteins expressed exclusively in the caecum and not in the ileum. #—compared with data in reference [10].
Table 4. Caecum-specific proteins grouped according to function.
Group DescriptionNo. of Proteins% Expression out of Caecum-Specific Proteins  Proteins
Drug metabolic processes and metabolism of exogenous substances1222.48AKR1B1L, ALDH1A1, PRDX6, MPST, CBS, ADH1C, SELENBP1, SULT1E1, NDUFV2, FH, NDUFS1, ENO2
Wound healing1217.39GAL-1, FN1, AHNAK, CAPZA2, FHL2, CAPZA1, PLG, TNC, NMNAT3, AIMP1, COL5A1, POSTN
Extracellular matrix organisation and cell–matrix adhesion proteins1413.52FN1, NID2, NID1, PRELP, TNC, PLG, COL5A1, POSTN, AIMP1, CAST, TNXB, PXN, CTTN, ACTN2
Cellular response to stress811.59TXN, TUBB2B, PRDX6, CAPZA2, CAPZA1, ATOX1, ST13, TNXB
H2S metabolism48.71CBS, MPST, TST, SELENBP1
Publisher’s Note: MDPI stays neutral with regard to jurisdictional claims in published maps and institutional affiliations.

