
Habitat Selection and Activity Patterns of Japanese Serows and Sika Deer with Currently Sympatric Distributions

Abstract
:Simple Summary
Abstract
1. Introduction
2. Materials and Methods
2.1. Study Area
2.2. Camera Trapping
2.3. Environmental Variables
2.4. Data Analysis
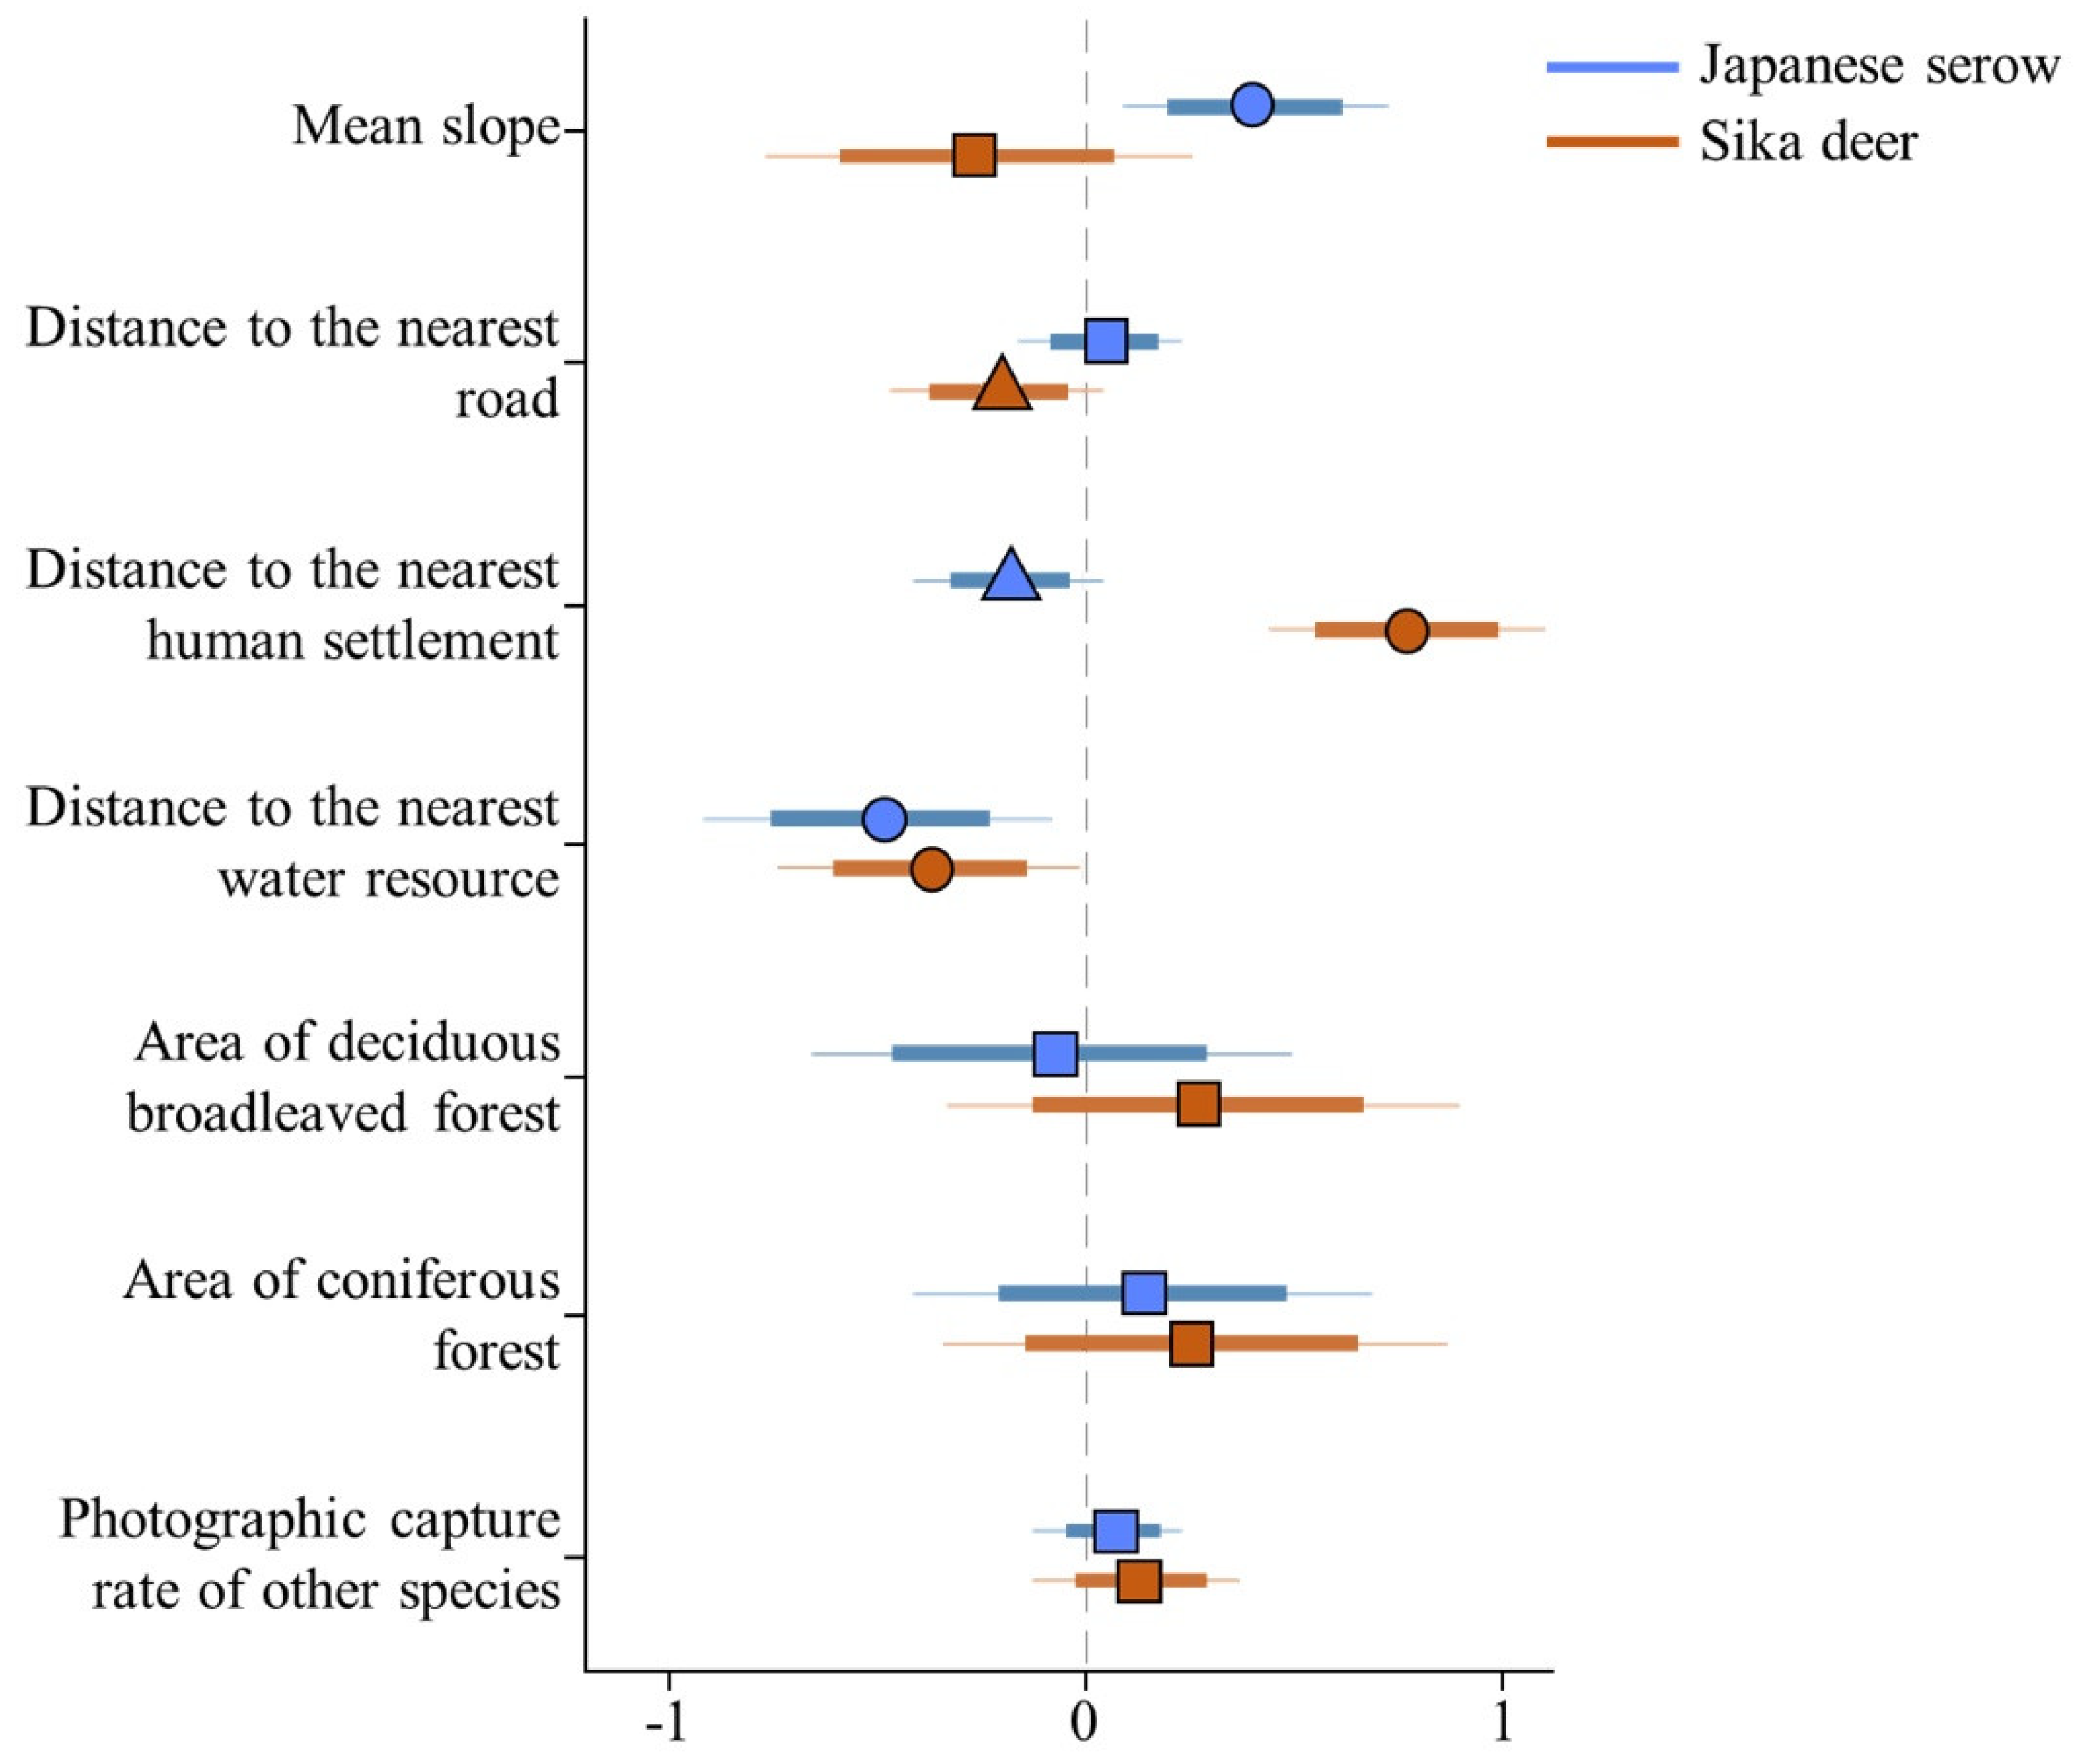
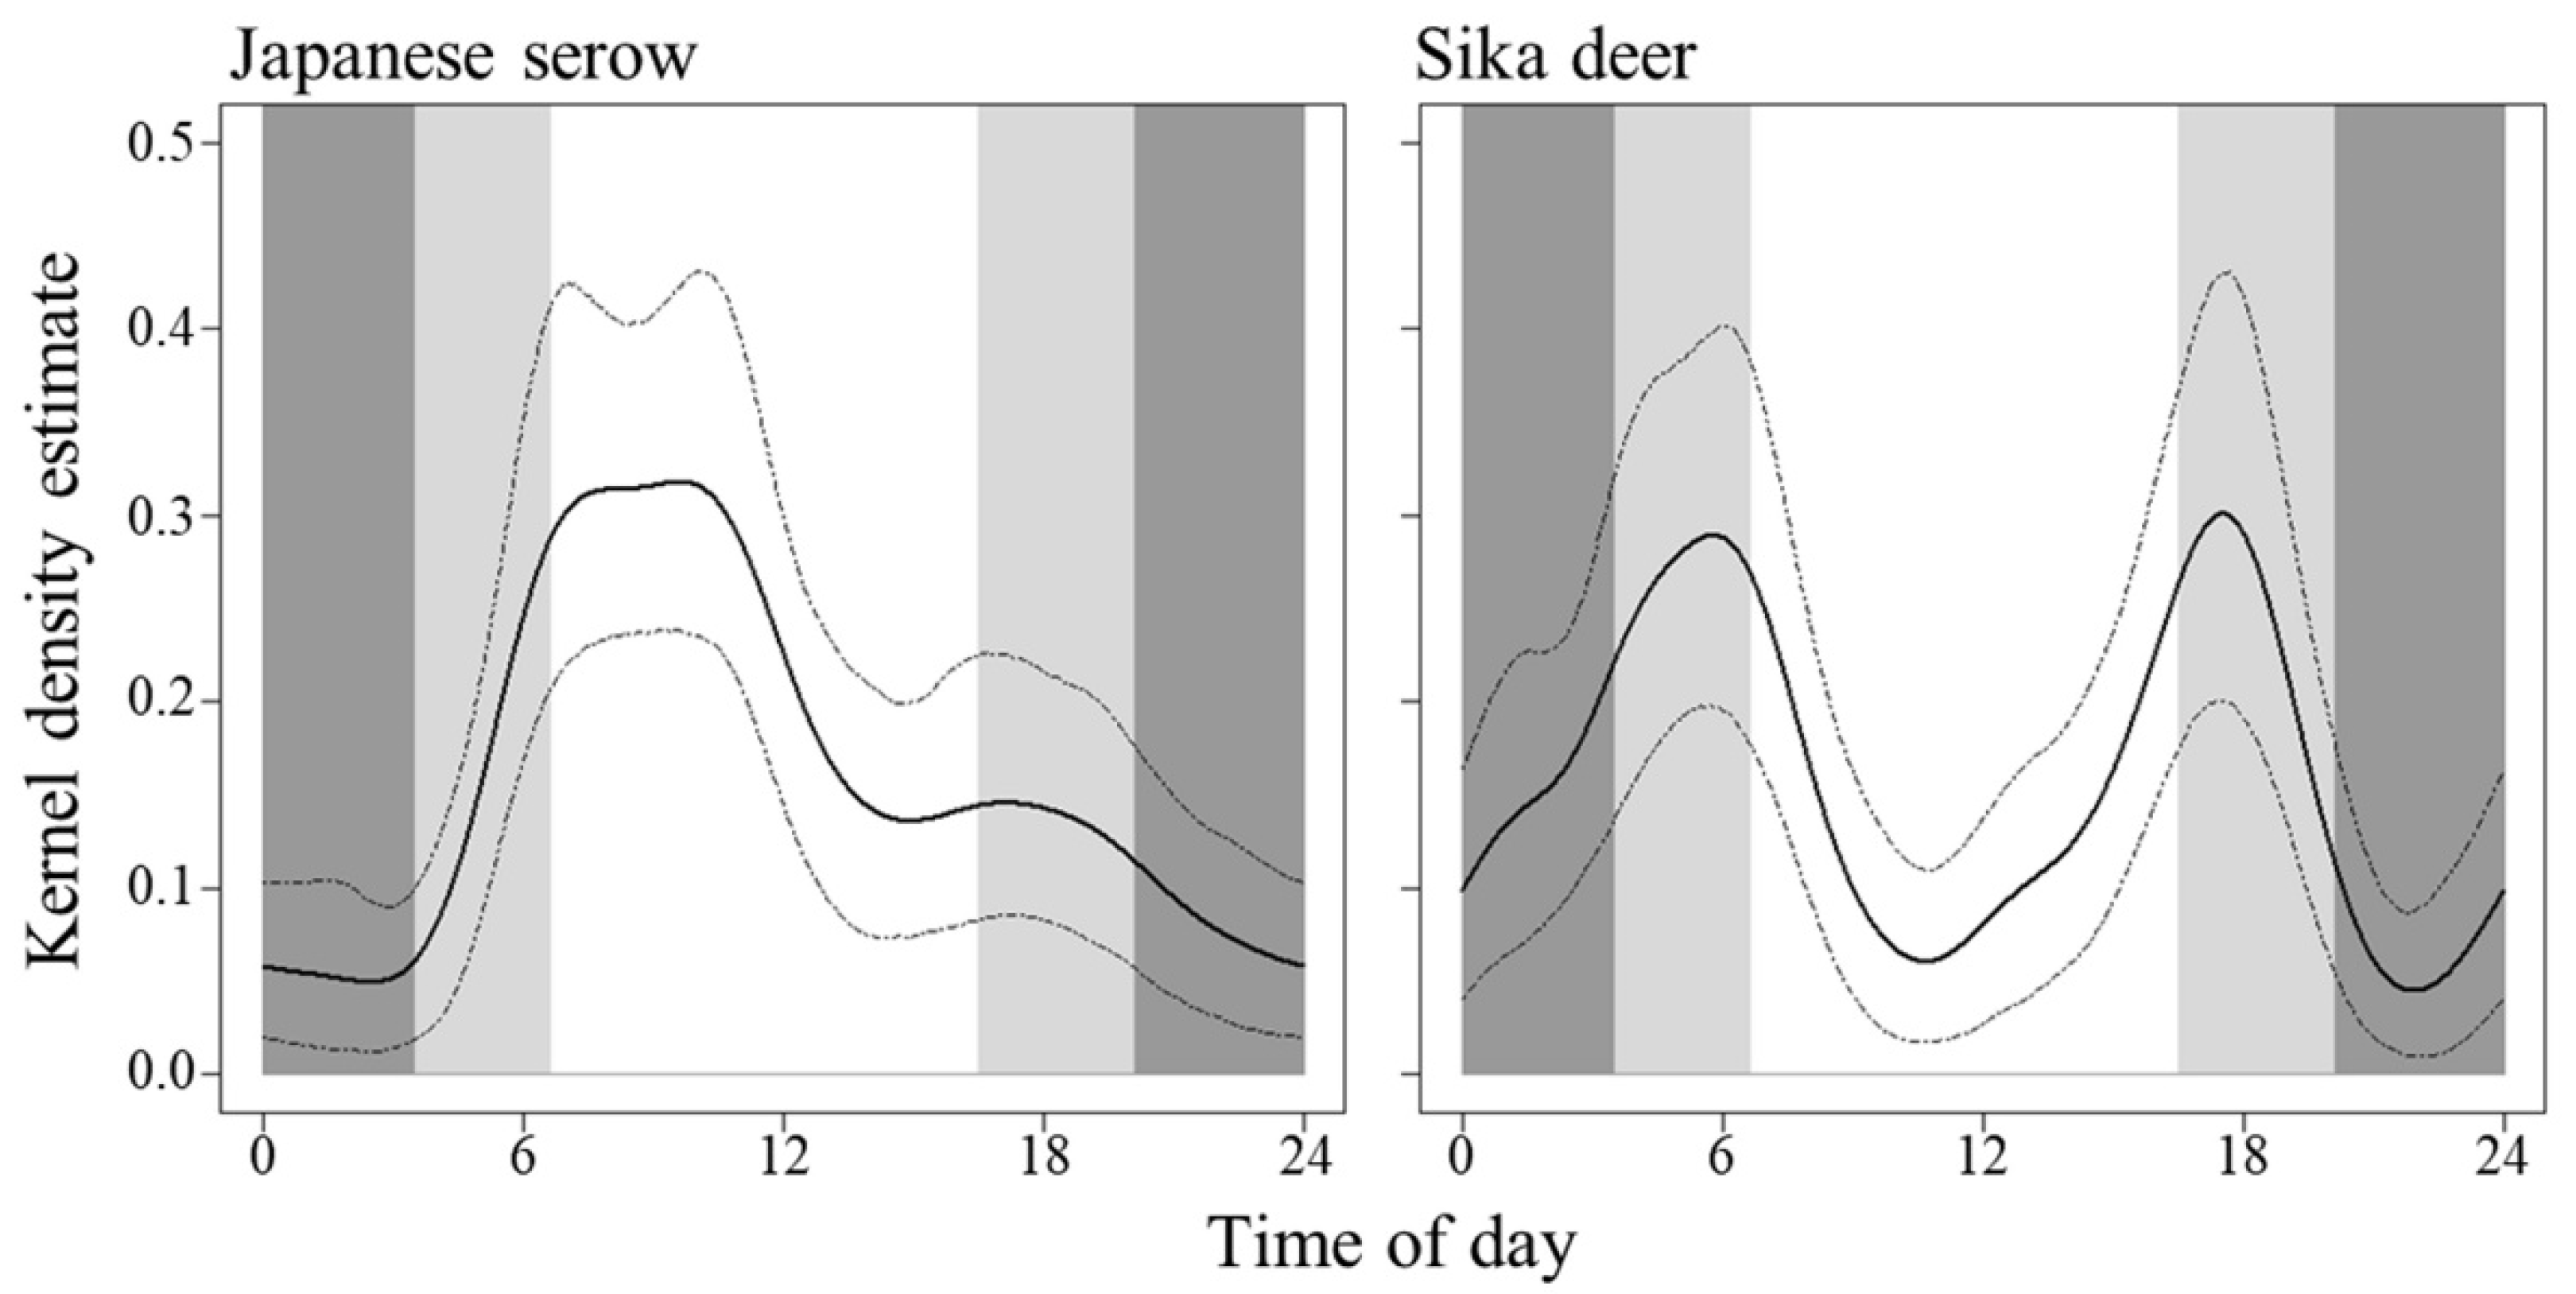
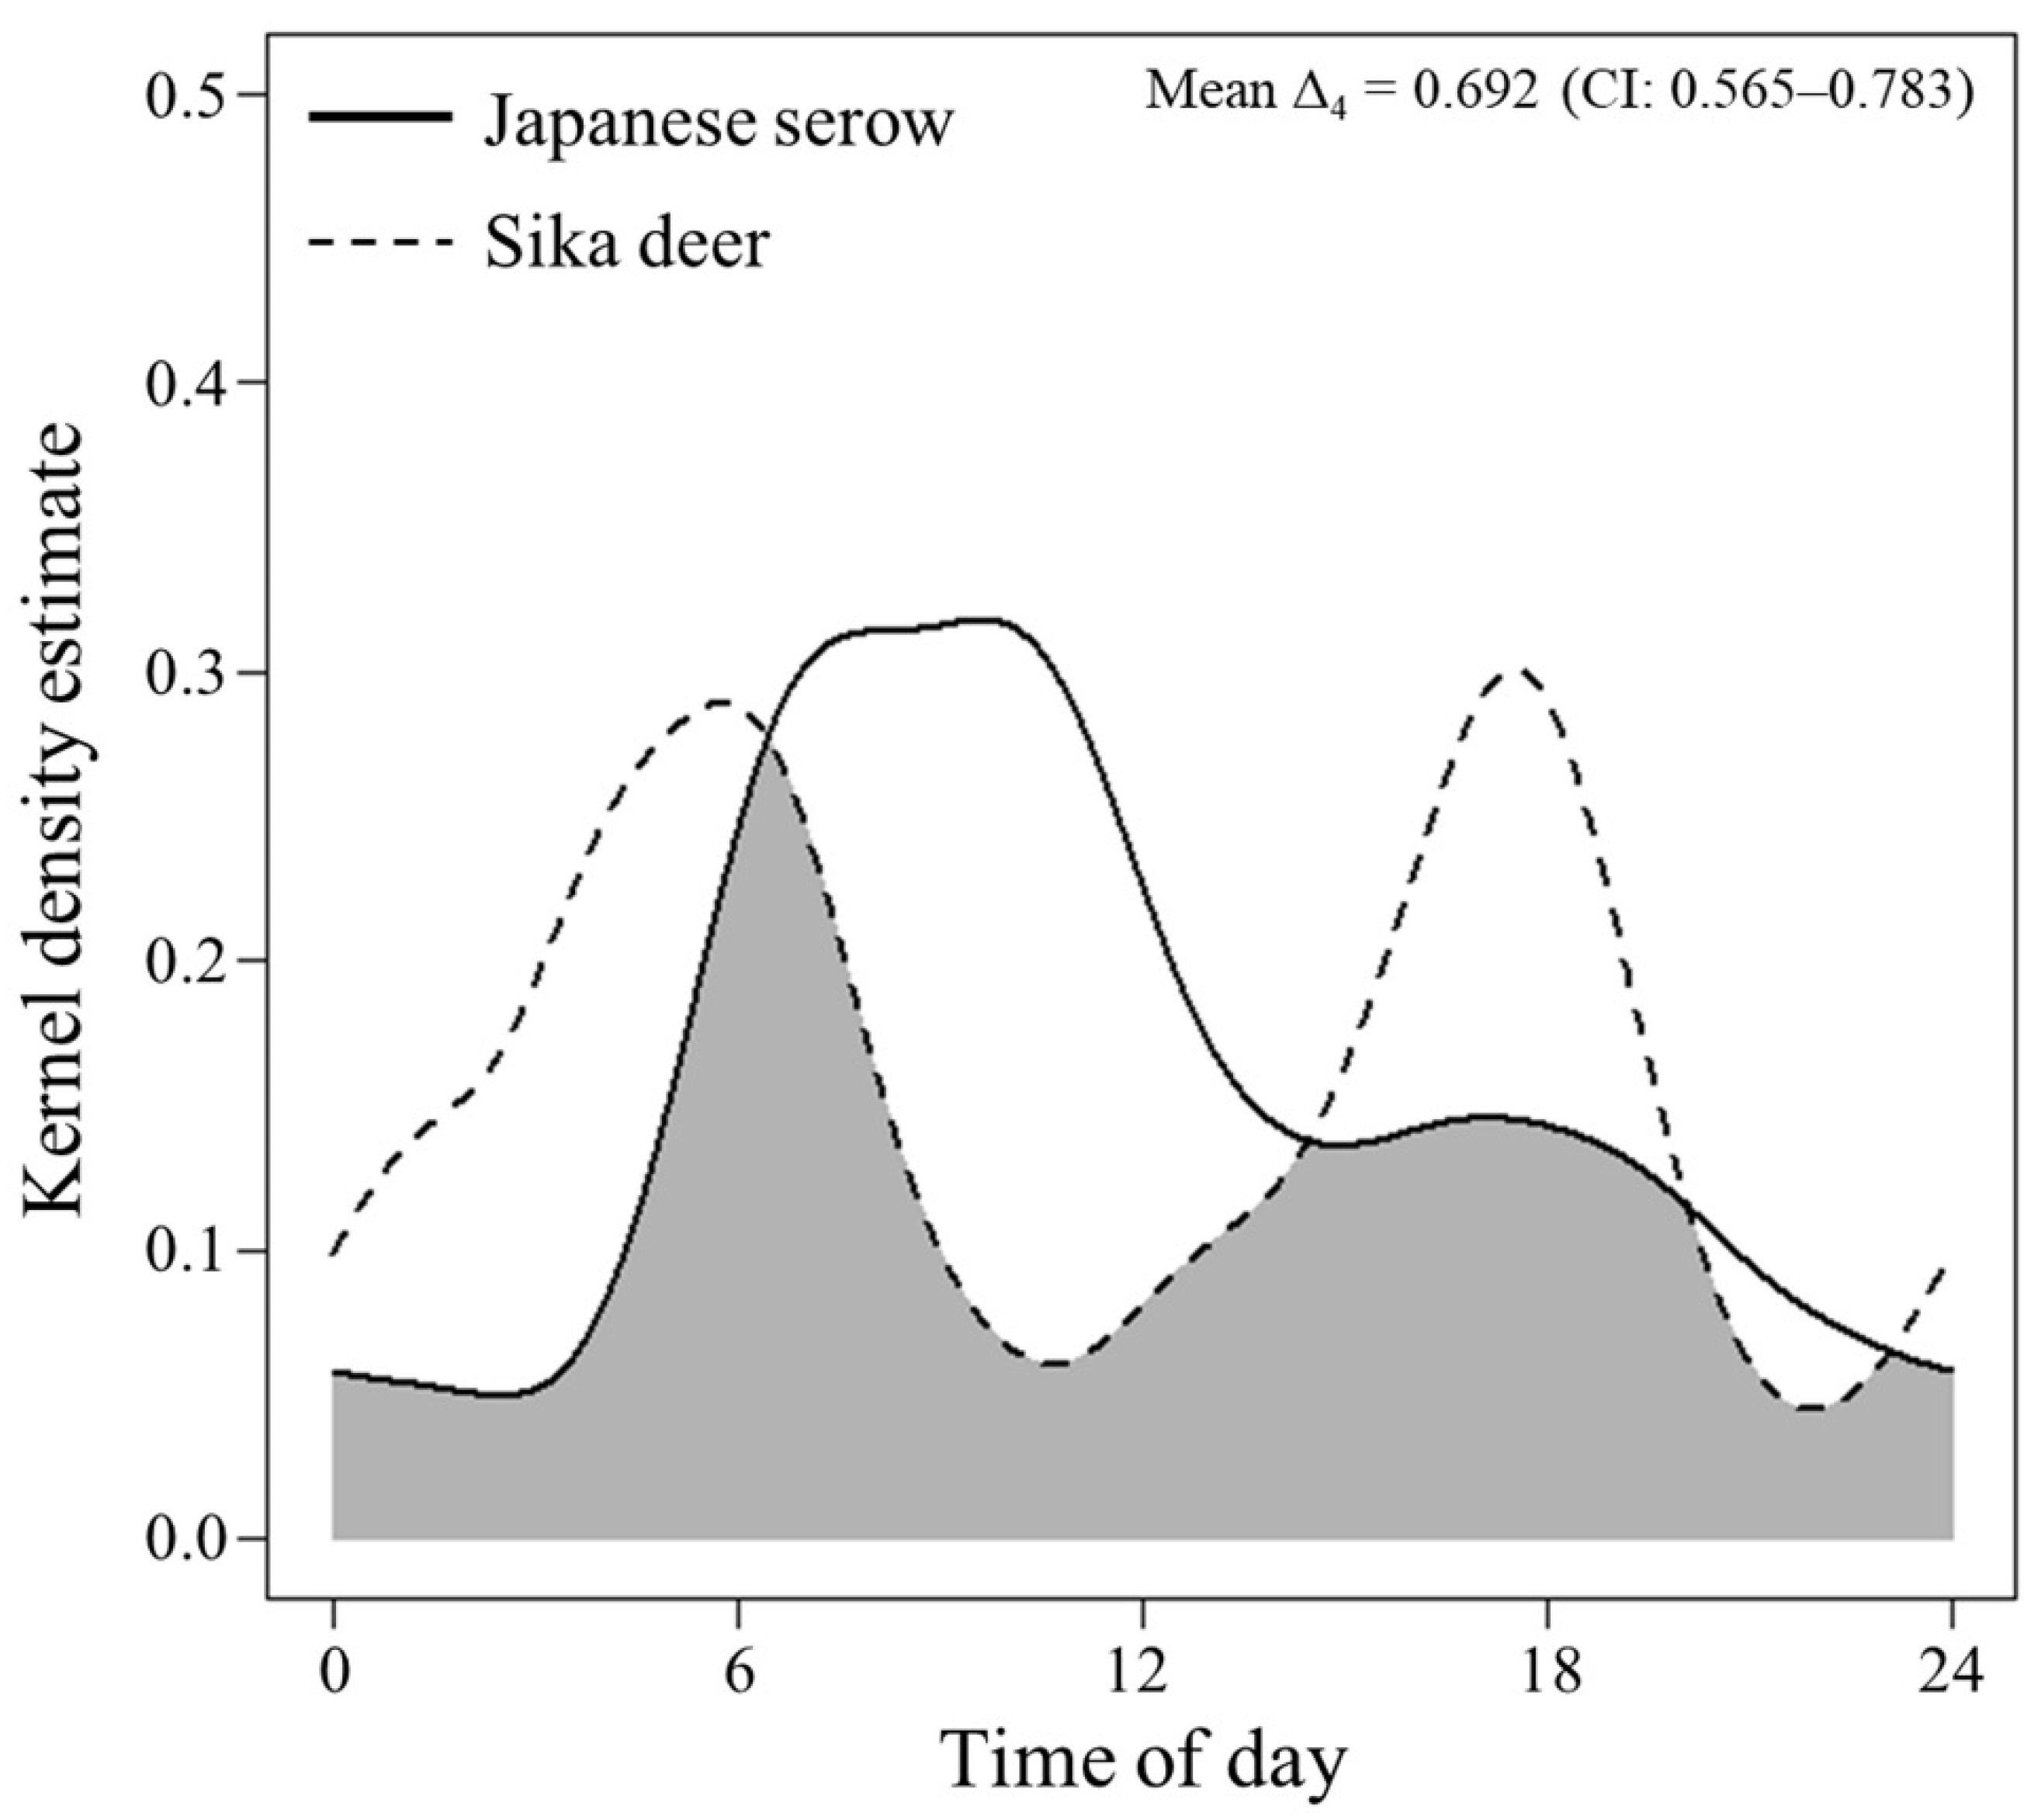
3. Results
4. Discussion
5. Conclusions
Author Contributions
Funding
Institutional Review Board Statement
Data Availability Statement
Acknowledgments
Conflicts of Interest
References
- Morin, P.J. Community Ecology; Blackwell Science: Oxford, UK, 1999; pp. 3–231. [Google Scholar]
- Sinclair, A.R.E.; Norton-Griffiths, M. Does competition or facilitation regulate migrant ungulate populations in the Serengeti? A test of hypotheses. Oecologia 1982, 53, 364–369. [Google Scholar] [CrossRef] [PubMed]
- Angelstam, P.; Lindström, E.; Widén, P. Synchronous short-term population fluctuations of some birds and mammals in Fennoscandia—Occurrence and distribution. Ecography 1985, 8, 285–298. [Google Scholar] [CrossRef]
- Bergerud, A.T. Caribou, wolves and man. Trends Ecol. Evol. 1988, 3, 68–72. [Google Scholar] [CrossRef]
- Lindstrom, E.R.; Andren, H.; Angelstam, P.; Cederlund, G.; Hornfeldt, B.; Jaderberg, L.; Lemnell, P.A.; Martinsson, B.; Skold, K.; Swenson, J.E. Disease reveals the predators: Sarcoptic mange, red fox predation, and prey populations. Ecology 1994, 75, 1042–1049. [Google Scholar] [CrossRef]
- Melis, C.; Nilsen, E.B.; Panzacchi, M.; Linnell, J.D.C.; Odden, J. Roe deer face competing risks between predators along a gradient in abundance. Ecosphere 2013, 4, 1–12. [Google Scholar] [CrossRef] [Green Version]
- Schmitz, O.J.; Beckerman, A.P.; O’Brien, K.M. Behaviorally mediated trophic cascades: Effects of predation risk on food web interactions. Ecology 1997, 78, 1388–1399. [Google Scholar] [CrossRef]
- Ripple, W.J.; Larsen, E.J.; Renkin, R.A.; Smith, D.W. Trophic cascades among wolves, elk and aspen on Yellowstone National Park’s northern range. Biol. Conserv. 2001, 102, 227–234. [Google Scholar] [CrossRef] [Green Version]
- Valeix, M.; Loveridge, A.J.; Chamaillé-Jammes, S.; Davidson, Z.; Murindagomo, F.; Fritz, H.; Macdonald, D.W. Behavioral adjustments of African herbivores to predation risk by lions: Spatiotemporal variations influence habitat use. Ecology 2009, 90, 23–30. [Google Scholar] [CrossRef] [PubMed]
- Thaker, M.; Vanak, A.T.; Owen, C.R.; Ogden, M.B.; Niemann, S.M.; Slotow, R. Minimizing predation risk in a landscape of multiple predators: Effects on the spatial distribution of African ungulates. Ecology 2011, 92, 398–407. [Google Scholar] [CrossRef] [PubMed]
- Chappell, M.A. Behavioral factors in the altitudinal zonation of chipmunk (Eutamias). Ecology 1978, 59, 565–579. [Google Scholar] [CrossRef]
- Hairston, N.G. The experimental test of an analysis of field distributions: Competition in terrestrial salamanders. Ecology 1980, 61, 817–826. [Google Scholar] [CrossRef]
- Karban, R. Community organization of Erigeron glaucus folivores: Effects of competition, predation, and host plant. Ecology 1989, 70, 1028–1039. [Google Scholar] [CrossRef]
- Côté, S.D. Extirpation of a large black bear population by introduced white-tailed deer. Conserv. Biol. 2005, 19, 1668–1671. [Google Scholar] [CrossRef]
- Ripple, W.J.; Beschta, R.L.; Fortin, J.K.; Robbins, C.T. Trophic cascades from wolves to grizzly bears in Yellowstone. J. Anim. Ecol. 2014, 83, 223–233. [Google Scholar] [CrossRef]
- Jędrzejewski, W.; Jędrzejewska, B.; Szymura, A. Food niche overlaps in a winter community of predators in the Białowieża Primeval Forest, Poland. Acta Theriol. (Warsz) 1989, 34, 487–496. [Google Scholar] [CrossRef] [Green Version]
- Namgail, T.; Fox, J.L.; Bhatnagar, Y.V. Habitat segregation between sympatric Tibetan argali Ovis ammon hodgsoni and blue sheep Pseudois nayaur in the Indian Trans-Himalaya. J. Zool. 2004, 262, 57–63. [Google Scholar] [CrossRef]
- Whittaker, D.G.; Lindzey, F.G. Habitat use patterns of sympatric deer species on Rocky Mountain Arsenal, Colorado. Wildl. Soc. Bull. 2004, 32, 1114–1123. [Google Scholar] [CrossRef]
- Rivero, K.; Rumiz, D.I.; Taber, A.B. Differential habitat use by two sympatric brocket deer species (Mazama americana and M. gouazoubira) in a seasonal Chiquitano forest of Bolivia. Mammalia 2005, 69, 169–183. [Google Scholar] [CrossRef]
- Cromsigt, J.P.; Olff, H. Resource partitioning among savanna grazers mediated by local heterogeneity: An experimental approach. Ecology 2006, 87, 1532–1541. [Google Scholar] [CrossRef]
- Hayward, M.W.; Slotow, R. Temporal partitioning of activity in large african carnivores: Tests of multiple hypotheses. Afr. J. Wildl. Res. 2009, 39, 109–125. [Google Scholar] [CrossRef]
- Chillo, V.; Rodríguez, D.; Ojeda, R.A. Niche partitioning and coexistence between two mammalian herbivores in the Dry Chaco of Argentina. Acta Oecol. 2010, 36, 611–616. [Google Scholar] [CrossRef]
- Darmon, G.; Calenge, C.; Loison, A.; Jullien, J.M.; Maillard, D.; Lopez, J.F. Spatial distribution and habitat selection in coexisting species of mountain ungulates. Ecography 2012, 35, 44–53. [Google Scholar] [CrossRef]
- Schuette, P.; Wagner, A.P.; Wagner, M.E.; Creel, S. Occupancy patterns and niche partitioning within a diverse carnivore community exposed to anthropogenic pressures. Biol. Conserv. 2013, 158, 301–312. [Google Scholar] [CrossRef] [Green Version]
- Pokharel, K.P.; Ludwig, T.; Storch, I. Spatial niche partitioning in sub-tropical solitary ungulates: Four-horned antelope and barking deer in Nepal. PLoS ONE 2015, 10, e0117917. [Google Scholar] [CrossRef] [Green Version]
- Bianchi, R.D.C.; Olifiers, N.; Gompper, M.E.; Mourão, G. Niche partitioning among mesocarnivores in a Brazilian wetland. PLoS ONE 2016, 11, e0162893. [Google Scholar] [CrossRef] [PubMed] [Green Version]
- De Satgé, J.; Teichman, K.; Cristescu, B. Competition and coexistence in a small carnivore guild. Oecologia 2017, 184, 873–884. [Google Scholar] [CrossRef]
- Marrotte, R.R.; Bowman, J.; Morin, S.J. Spatial segregation and habitat partitioning of bobcat and Canada lynx. Facets 2020, 5, 503–522. [Google Scholar] [CrossRef]
- Côté, S.D.; Rooney, T.P.; Tremblay, J.P.; Dussault, C.; Waller, D.M. Ecological impacts of deer overabundance. Annu. Rev. Ecol. Evol. Syst. 2004, 35, 113–147. [Google Scholar] [CrossRef] [Green Version]
- Russell, F.L.; Zippin, D.B.; Fowler, N.L. Effects of white-tailed deer (Odocoileus virginianus) on plants, plant populations and communities: A review. Am. Midl. Nat. 2001, 146, 1–26. [Google Scholar] [CrossRef] [Green Version]
- Takatsuki, S. Effects of sika deer on vegetation in Japan: A review. Biol. Conserv. 2009, 142, 1922–1929. [Google Scholar] [CrossRef]
- Flowerdew, J.R.; Ellwood, S.A. Impacts of woodland deer on small mammal ecology. Forestry 2001, 74, 277–287. [Google Scholar] [CrossRef] [Green Version]
- Stewart, A.J.A. The impact of deer on lowland woodland invertebrates: A review of the evidence and priorities for future research. Forestry 2001, 74, 259–270. [Google Scholar] [CrossRef] [Green Version]
- Rooney, T.P.; Waller, D.M. Direct and indirect effects of white-tailed deer in forest ecosystems. For. Ecol. Manag. 2003, 181, 165–176. [Google Scholar] [CrossRef]
- Gill, R.M.A.; Fuller, R.J. The effects of deer browsing on woodland structure and songbirds in lowland Britain. IBIS 2007, 149, 119–127. [Google Scholar] [CrossRef]
- Koganezawa, M. Changes in the population dynamics of Japanese serow and sika deer as a result of competitive interactions in the Ashio Mountains, central Japan. Biosph. Conserv. 1999, 2, 35–44. [Google Scholar] [CrossRef]
- Nowicki, P.; Koganezawa, M. Densities and habitat selection of the sika deer and the Japanese serow in Nikko National Park, central Japan, as rebealed by aerial censuses and GIS analysis. Biosph. Conserv. 2001, 3, 71–87. [Google Scholar] [CrossRef]
- Hashimoto, Y.; Mori, Y. Transition in the distribution of the Japanese serow in the Suzuka Mountains Japanese Serow Protection Area. Wildl. Hum. Soc. 2018, 5, 1–8. [Google Scholar] [CrossRef]
- Kobayashi, K.; Takatsuki, S. A comparison of food habits of two sympatric ruminants of Mt. Yatsugatake, central Japan: Sika deer and Japanese serow. Acta Theriol. (Warsz) 2012, 57, 343–349. [Google Scholar] [CrossRef]
- Endo, Y.; Takada, H.; Takatsuki, S. Comparison of the food habits of the sika deer (Cervus nippon), the Japanese serow (Capricornis crispus), and the wild boar (Sus scrofa), sympatric herbivorous mammals from Mt. Asama, central Japan. Mammal Study 2017, 42, 131–140. [Google Scholar] [CrossRef]
- Asakura, G.; Kaneshiro, Y.; Takatsuki, S. A comparison of the fecal compositions of sympatric populations of sika deer and Japanese serows on Mt. Sanrei in Shikoku, Southwestern Japan. Mammal Study 2014, 39, 129–132. [Google Scholar] [CrossRef]
- Yamashiro, A.; Kaneshiro, Y.; Kawaguchi, Y.; Yamashiro, T. Dietary overlap but spatial gap between sympatric Japanese serow (Capricornis crispus) and sika deer (Cervus nippon) on Eastern Shikoku, Japan. Mammal Study 2019, 44, 261–267. [Google Scholar] [CrossRef]
- Takada, H.; Ohuchi, R.; Watanabe, H.; Yano, R.; Miyaoka, R.; Nakagawa, T.; Zenno, Y.; Minami, M. Habitat use and the coexistence of the sika deer and the Japanese serow, sympatric ungulates from Mt. Asama, central Japan. Mammalia 2020, 84, 503–511. [Google Scholar] [CrossRef]
- Turner, M.G.; Gardner, R.H.; O’Neill, R.V. Landscape Ecology in Theory and Practice: Pattern and Process; Springer: New York, NY, USA, 2001; pp. 25–45. [Google Scholar]
- DeBach, P. The competitive displacement and coexistence principles. Annu. Rev. Entomol. 1966, 11, 183–212. [Google Scholar] [CrossRef]
- Schoener, T.W. Field experiments on interspecific competition. Am. Nat. 1983, 122, 240–285. [Google Scholar] [CrossRef]
- Putman, R.J. Competition and Resource Partitioning in Temperate Ungulate Assemblies; Chapman & Hall, London: London, UK, 1996; pp. 1–10. [Google Scholar]
- Schoener, T.W. Resource partitioning in ecological communities. Science 1974, 185, 27–39. [Google Scholar] [CrossRef]
- Ferreguetti, Á.C.; Tomás, W.M.; Bergallo, H.G. Density, occupancy, and activity pattern of two sympatric deer (Mazama) in the Atlantic Forest, Brazil. J. Mammal. 2015, 96, 1245–1254. [Google Scholar] [CrossRef] [Green Version]
- Ando, C. The relationship between deer-train collisions and daily activity of the sika deer, Cervus nippon. Mammal Study 2003, 28, 135–143. [Google Scholar] [CrossRef] [Green Version]
- Ikeda, T.; Takahashi, H.; Igota, H.; Matsuura, Y.; Azumaya, M.; Yoshida, T.; Kaji, K. Effects of culling intensity on diel and seasonal activity patterns of sika deer (Cervus nippon). Sci. Rep. 2019, 9, 17205. [Google Scholar] [CrossRef]
- Ikeda, T.; Takahashi, H.; Yoshida, T.; Igota, H.; Matsuura, Y.; Takeshita, K.; Kaji, K. Seasonal variation of activity pattern in sika deer (Cervus nippon) as assessed by camera trap survey. Mammal Study 2015, 40, 199–205. [Google Scholar] [CrossRef]
- Ikeda, T.; Uchida, K.; Matsuura, Y.; Takahashi, H.; Yoshida, T.; Kaji, K.; Koizumi, I. Seasonal and diel activity patterns of eight sympatric mammals in northern Japan revealed by an intensive camera-trap survey. PLoS ONE 2016, 11, e0163602. [Google Scholar] [CrossRef]
- Van Doormaal, N.; Ohashi, H.; Koike, S.; Kaji, K. Influence of human activities on the activity patterns of Japanese sika deer (Cervus nippon) and wild boar (Sus scrofa) in Central Japan. Eur. J. Wildl. Res. 2015, 61, 517–527. [Google Scholar] [CrossRef]
- Kishimoto, R. Early mother and kid behavior of a typical “follower”, Japanese serow Capricornis crispus. Mammalia 1989, 53, 165–176. [Google Scholar] [CrossRef]
- Kishimoto, R.; Kawamichi, T. Territoriality and monogamous pairs in a solitary ungulate, the Japanese serow, Capricornis crispus. Anim. Behav. 1996, 52, 673–682. [Google Scholar] [CrossRef] [Green Version]
- Ochiai, K.; Susaki, K. Effects of territoriality on population density in the Japanese serow (Capricornis crispus). J. Mammal. 2002, 83, 964–972. [Google Scholar] [CrossRef] [Green Version]
- Ministry of the Environment of the Government of Japan. The Japanese Red List. 2020. Available online: http://www.env.go.jp/press/107905.html (accessed on 23 September 2021). (In Japanese)
- Minami, M.; Takeshita, T.; Chikakiyo, H.; Suda, C.; Inoue, T.; Kishimoto, R. The influence of mistake capture by snare traps on the Japanese serow. Annu. Rep. Pro Nat. Found. Jpn. 2020, 29, 103–117, (In Japanese with English abstract). [Google Scholar]
- Johnson, D.H. The comparison of usage and availability measurements for evaluating resource preference. Ecology 1980, 61, 65–71. [Google Scholar] [CrossRef]
- Li, X.; Bleisch, W.V.; Jiang, X. Unveiling a wildlife haven: Occupancy and activity patterns of mammals at a Tibetan sacred mountain. Eur. J. Wildl. Res. 2018, 64, 53. [Google Scholar] [CrossRef]
- Maruyama, N.; Nakama, S. Block count method for estimating serow populations. Jpn. J. Ecol. 1983, 33, 243–251. [Google Scholar]
- Gunma Conservation and Management of the Japanese Serow of 2016 in Gunma Prefecture. Available online: https://www.pref.gunma.jp/contents/000366682.pdf (accessed on 10 February 2021). (In Japanese).
- Sakaniwa, H.; Anezaki, T. Change in the spatial distribution of sika deer (Cervus nippon) in Gunma Prefecture. Bull. Gunma Mus. Nat. Hist. (In Japanese). 2010, 14, 133–140. [Google Scholar]
- Gunma Conservation and Management of the Sika Deer of 2020 in Gunma Prefecture. Available online: https://www.pref.gunma.jp/contents/100104428.pdf (accessed on 10 February 2021). (In Japanese).
- Maeji, I.; Kurosaki, T.; Yokoyama, S.; Shibata, E. Home range of sika deer (Cervus nippon) on Mt. Ohdaigahara, central Japan. Nagoya Univ. For. Sci. 2000, 19, 1–10, (In Japanese with English abstract). [Google Scholar]
- Takii, A.; Izumiyama, S.; Mochizuki, T.; Okumura, T.; Sato, S. Seasonal migration of sika deer in the Oku-Chichibu Mountains, central Japan. Mammal Study 2012, 37, 127–137. [Google Scholar] [CrossRef] [Green Version]
- Enari, H.; Sakamaki, H. Landscape-scale evaluation of habitat uses by sympatric mammals foraging for bark and buds in a heavy snowfall area of northern Japan. Acta Theriol. (Warsz) 2012, 57, 173–183. [Google Scholar] [CrossRef]
- Sakuragi, M.; Igota, H.; Uno, H.; Kaji, K.; Kaneko, M.; Akamatsu, R.; Maekawa, K. Seasonal habitat selection of an expanding sika deer Cervus nippon population in eastern Hokkaido, Japan. Wildl. Biol. 2003, 9, 141–153. [Google Scholar] [CrossRef]
- Ochiai, K. Capricornis crispus (Temminck, 1845). In The Wild Mammals of Japan; Ohdachi, S.D., Ishibashi, Y., Iwasa, M.A., Saitoh, T., Eds.; Shoukadoh: Kyoto, Japan, 2009; pp. 306–309. [Google Scholar]
- Nagata, J. Cervus nippon Temminck, 1838. In The Wild Mammals of Japan; Ohdachi, S.D., Ishibashi, Y., Iwasa, M.A., Saitoh, T., Eds.; Shoukadoh: Kyoto, Japan, 2009; pp. 296–298. [Google Scholar]
- Pianka, E.R. The structure of lizard communities. Annu. Rev. Ecol. Syst. 1973, 4, 53–74. [Google Scholar] [CrossRef] [Green Version]
- Yasuda, M. Monitoring diversity and abundance of mammals with camera traps: A case study on Mount Tsukuba, central Japan. Mammal Study 2004, 29, 37–46. [Google Scholar] [CrossRef] [Green Version]
- Matsuura, K. Bayesian Statistical Modeling Using Stan and R; Kyoritsu Shuppan: Tokyo, Japan, 2016; pp. 202–228. (In Japanese) [Google Scholar]
- Montgomery, D.C.; Peck, E.A.; Vining, G.G. Introduction to Linear Regression Analysis, 5th ed.; Wiley: Hoboken, NJ, USA, 2013; pp. 372–388. [Google Scholar]
- Gelman, A.; Carlin, J.B.; Stern, H.S.; Dunson, D.B.; Vehtari, A.; Rubin, D.B. Bayesian Data Analysis, 3rd ed.; CRC Press: New York, NY, USA, 2013; pp. 275–292. [Google Scholar]
- Rowcliffe, J.M.; Kays, R.; Kranstauber, B.; Carbone, C.; Jansen, P.A. Quantifying levels of animal activity using camera trap data. Methods Ecol. Evol. 2014, 5, 1170–1179. [Google Scholar] [CrossRef] [Green Version]
- Ridout, M.S.; Linkie, M. Estimating overlap of daily activity patterns from camera trap data. J. Agric. Biol. Environ. Stat. 2009, 14, 322–337. [Google Scholar] [CrossRef]
- Pewsey, A.; Neuhäuser, M.; Ruxton, G.D. Circular Statistics in R; Oxford University Press: Oxford, UK, 2013; pp. 131–148. [Google Scholar]
- Monterroso, P.; Alves, P.C.; Ferreras, P. Plasticity in circadian activity patterns of mesocarnivores in Southwestern Europe: Implications for species coexistence. Behav. Ecol. Sociobiol. 2014, 68, 1403–1417. [Google Scholar] [CrossRef] [Green Version]
- Torretta, E.; Serafini, M.; Puopolo, F.; Schenone, L. Spatial and temporal adjustments allowing the coexistence among carnivores in Liguria (N–W Italy). Acta Ethol. 2016, 19, 123–132. [Google Scholar] [CrossRef]
- Tsunoda, H.; Newman, C.; Peeva, S.; Raichev, E.; Buesching, C.D.; Kaneko, Y. Spatio-temporal partitioning facilitates mesocarnivore sympatry in the Stara Planina Mountains, Bulgaria. Zoology 2020, 141, 125801. [Google Scholar] [CrossRef] [PubMed]
- R Core Team. R: A Language and Environment for Statistical Computing; R Foundation for Statistical Computing: Vienna, Austria, 2020. [Google Scholar]
- Fox, J.; Weisberg, S. An R Companion to Applied Regression, 3rd ed.; Sage: Sauzend Oaks, CA, USA, 2019; pp. 385–436. [Google Scholar]
- Fox, J.; Weisberg, S.; Price, B.; Adler, D.; Bates, D.; Baud-Bovy, G.; Bolker, B.; Ellison, S.; Firth, D.; Friendly, M.; et al. Package ‘Car’, Version 3.0-11. Available online: https://cran.r-project.org/web/packages/car/index.html (accessed on 12 October 2021).
- Stan Development Team. Rstan: The R interface to Stan. R Package Version 2.21.2. Available online: http://mc-stan.org (accessed on 12 October 2021).
- Guo, J.; Gabry, J.; Goodrich, B.; Weber, S.; Lee, D.; Sakrejda, K.; Martin, M.; Sklyar, O.; Trustees of Columbia University; The R Core Team; et al. Package “rstan”, Version 2.21.2. Available online: https://cran.r-project.org/web/packages/rstan/index.html (accessed on 12 October 2021).
- Bürkner, P.-C.; Gabry, J.; Weber, S.; Johnson, A.; Modrak, M.; Badr, H.S.; Weber, F.; Ben-Shachar, M.S. Package “Brms”, Version 2.16.1. Available online: https://cran.r-project.org/web/packages/brms/index.html (accessed on 12 October 2021).
- Bürkner, P.C. brms: An R package for Bayesian multilevel models using Stan. J. Stat. Softw. 2017, 80, 1–28. [Google Scholar] [CrossRef] [Green Version]
- Rowcliffe, M. Package ‘Activity’, Version 1.3.1. Available online: https://cran.r-project.org/web/packages/activity/index.html (accessed on 12 October 2021).
- Meredith, M.; Ridout, M. Package ‘Overlap’, Version 0.3.4. Available online: https://cran.r-project.org/web/packages/overlap/index.html (accessed on 12 October 2021).
- Lund, U.; Agostinelli, C. Package ‘CircStats’, Version 0.2-6. Available online: https://cran.r-project.org/web/packages/CircStats/index.html (accessed on 12 October 2021).
- Takahashi, S.; Higaside, D.; Fujita, M.; Yoneda, M. A preliminary study of the daily activity patterns of Sika deer (Cervus nippon) in the Kitakami mountains, Iwate prefecture, via infrared-triggered camera. Mamm. Sci. 2012, 52, 193–197, (In Japanese with English abstract). [Google Scholar] [CrossRef]
- Tsukada, H. The utilization of grasslands by sika deer (Cervus nippon) and its feeding damage in grasslands. Jpn. J. Grassl. Sci. 2012, 58, 187–192. (In Japanese) [Google Scholar] [CrossRef]
- Deguchi, Y.; Murayama, K. Habitat use and sex rate of sika deer in new distribution areas. Mamm. Sci. 2016, 56, 37–41, (In Japanese with English abstract). [Google Scholar] [CrossRef]
- Kitagawa, Y.; Matsuyama, S.; Oota, K.; Okabe, Y.; Katsuyama, T.; Kishimoto, Y.; Sato, S.; Shibata, Y.; Nakagawa, T.; Nishioka, Y.; et al. Seasonal changes of time and space distribution, and daily activity pattern of yeso sika deer (Cervus nippon yesoensis) in eastern Hokkaido, Japan. Jpn. J. For. Environ. 2017, 59, 1–11, (In Japanese with English abstract). [Google Scholar] [CrossRef]
- Borkowski, J. Flight behaviour and observability in human-disturbed sika deer. Acta Theriol. (Warsz) 2001, 46, 195–206. [Google Scholar] [CrossRef]
- Liu, X.; Wu, P.; Songer, M.; Cai, Q.; He, X.; Zhu, Y.; Shao, X. Monitoring wildlife abundance and diversity with infra-red camera traps in Guanyinshan Nature Reserve of Shaanxi Province, China. Ecol. Indic. 2013, 33, 121–128. [Google Scholar] [CrossRef]
- Chen, Y.; Xiao, Z.; Zhang, L.; Wang, X.; Li, M.; Xiang, Z. Activity rhythms of coexisting red serow and Chinese serow at Mt. Gaoligong as identified by camera traps. Animals 2019, 9, 1071. [Google Scholar] [CrossRef] [Green Version]
- Bhattacharya, T.; Bashir, T.; Poudyal, K.; Sathyakumar, S.; Saha, G.K. Distribution, Occupancy and activity patterns of goral (Nemorhaedus goral) and serow (Capricornis thar) in Khangchendzonga Biosphere Reserve, Sikkim, India. Mammal Study 2012, 37, 173–181. [Google Scholar] [CrossRef]
- Ishida, K.; Yamane, A.; Akaiwa, T.; Igarashi, Y. Disribution of Japanese serow Capricornis crispus and sika deer Cervus nippon in Chichibu Mountains. Bull. Univ. Tokyo For. 1993, 89, 99–111, (In Japanese with English abstract). [Google Scholar]
- Doko, T.; Chen, W. The geographical distribution and habitat use of the Japanese serow (Naemorhedus crispus) in the Fuji-Tanzawa region, Japan. J. Environ. Inf. Sci. 2013, 41, 53–62. [Google Scholar]
- Takada, H. The summer spatial distribution of Japanese serows (Capricornis crispus) in an area without predation risk. Mamm. Biol. 2020, 100, 63–71. [Google Scholar] [CrossRef]
- Terada, C.; Tatsuzawa, S.; Saitoh, T. Ecological correlates and determinants in the geographical variation of deer morphology. Oecologia 2012, 169, 981–994. [Google Scholar] [CrossRef] [PubMed]
- Scott, K.M. Allometric trends and locomotor adaptations in the Bovidae. Bull. Am. Mus. Nat. Hist. 1985, 179, 197–288. [Google Scholar]
- Geist, V. On the evolution of the Caprinae. In The Biology and Management of Capricornis and Related Mountain Antelopes; Soma, H., Ed.; Croom Helm: London, UK, 1987; pp. 3–40. [Google Scholar]
- Takada, H.; Nakamura, K.; Minami, M. Effects of the physical and social environment on flight response and habitat use in a solitary ungulate, the Japanese serow (Capricornis crispus). Behav. Process. 2019, 158, 228–233. [Google Scholar] [CrossRef] [PubMed]
- Sakuragi, M.; Igota, H.; Uno, H.; Kaji, K.; Kaneko, M.; Akamatsu, R.; Maekawa, K. Comparison of diurnal and 24hr sampling of habitat use by female sika deer. Mammal Study 2002, 27, 101–105. [Google Scholar] [CrossRef] [Green Version]
- Kamei, T.; Takeda, K.I.; Izumiyama, S.; Ohshima, K. The effect of hunting on the behavior and habitat utilization of sika deer (Cervus nippon). Mammal Study 2010, 35, 235–241. [Google Scholar] [CrossRef]
- Uzal, A.; Walls, S.; Stillman, R.A.; Diaz, A. Sika deer distribution and habitat selection: The influence of the availability and distribution of food, cover, and threats. Eur. J. Wildl. Res. 2013, 59, 563–572. [Google Scholar] [CrossRef]
- Li, J.; Li, Y.K.; Liu, W.H. Autumn bed site selection by sika deer (Cervus nippon) in the Taohongling National Nature Reserve, China. Russ. J. Ecol. 2017, 48, 384–391. [Google Scholar] [CrossRef]
- Najafi, J.; Farashi, A.; Zanoosi, A.P.; Yadreh, R. Water resource selection of large mammals for water resources planning. Eur. J. Wildl. Res. 2019, 65, 82. [Google Scholar] [CrossRef]
- Bleich, V.C.; Marshal, J.P.; Andrew, N.G. Habitat use by a desert ungulate: Predicting effects of water availability on mountain sheep. J. Arid Environ. 2010, 74, 638–645. [Google Scholar] [CrossRef]
- Shields, A.V.; Larsen, R.T.; Whiting, J.C. Summer watering patterns of mule deer in the Great Basin Desert, USA: Implications of differential use by individuals and the sexes for management of water resources. Sci. World J. 2012, 2012, 846218. [Google Scholar] [CrossRef] [PubMed] [Green Version]
- Waddell, R.B.; O’Brien, C.S.; Rosenstock, S.S. Bighorn sheep use of a developed water in southwestern Arizona. Desert Bighorn Counc. Trans. 2007, 49, 8–17. [Google Scholar]
- Chiba, H. The behaviour of Japanese serow, Capricornis crispus (TEMMINCK) in captivity: Part 1. Seasonal changes of behaviour in cage. J. Mammal. Soc. Jpn. 1966, 3, 8–14, (In Japanese with English abstract). [Google Scholar]
- Hougen, T.; Ueda, Y.; Yamamoto, H. Survey on palatability by feeding of sika deer (Cervus nippon Temminck) in Arida area, Wakayama Prefecture. Bull. Wakayama Prefect. Exp. Station. Agric. For. Fish. 2017, 5, 61–71. (In Japanese) [Google Scholar]
- Seki, Y. A Sika Deer Drinking Water of the River. Movie Arch. Anim. Behav. 2007. Available online: http://www.momo-p.com/index-e.html (accessed on 27 November 2021). (In Japanese).
- Yamada, Y. Japanese serow. In Field Survey Methods for Wildlife Management: From the Identification of Field Signs of Mammals to Data Analysis; Seki, Y., Enari, H., Kodera, Y., Tsuji, Y., Eds.; Kyoto University Press: Kyoto, Japan, 2015; pp. 59–68. (In Japanese) [Google Scholar]
- Jiang, Z.-W. Sika deer. In Field Survey Methods for Wildlife Management: From the Identification of Field Signs of Mammals to Data Analysis; Seki, Y., Enari, H., Kodera, Y., Tsuji, Y., Eds.; Kyoto University Press: Kyoto, Japan, 2015; pp. 39–52. (In Japanese) [Google Scholar]
- Nowicki, P.; Koganezawa, M. Space as the potential limiting resource in the competition between the Japanese serow and the sika deer in Ashio, central Japan. Biosph. Conserv. 2002, 4, 69–77. [Google Scholar] [CrossRef]
- Valeix, M.; Chamaillé-Jammes, S.; Fritz, H. Interference competition and temporal niche shifts: Elephants and herbivore communities at waterholes. Oecologia 2007, 153, 739–748. [Google Scholar] [CrossRef]
- Fedriani, J.M.; Palomares, F.; Delibes, M. Niche relations among three sympatric Mediterranean carnivores. Oecologia 1999, 121, 138–148. [Google Scholar] [CrossRef] [Green Version]
- Takeshita, T. Current situation and problems of miscaptured Japanese serows (Capricornis crispus) by snare traps in Komoro city, Nagano prefecture, Japan. Mamm. Sci. 2020, 60, 351–358. [Google Scholar] [CrossRef]


Publisher’s Note: MDPI stays neutral with regard to jurisdictional claims in published maps and institutional affiliations. |
© 2021 by the authors. Licensee MDPI, Basel, Switzerland. This article is an open access article distributed under the terms and conditions of the Creative Commons Attribution (CC BY) license (https://creativecommons.org/licenses/by/4.0/).
Share and Cite
Seki, Y.; Hayama, S.-i. Habitat Selection and Activity Patterns of Japanese Serows and Sika Deer with Currently Sympatric Distributions. Animals 2021, 11, 3398. https://doi.org/10.3390/ani11123398
Seki Y, Hayama S-i. Habitat Selection and Activity Patterns of Japanese Serows and Sika Deer with Currently Sympatric Distributions. Animals. 2021; 11(12):3398. https://doi.org/10.3390/ani11123398
Chicago/Turabian StyleSeki, Yoshikazu, and Shin-ichi Hayama. 2021. "Habitat Selection and Activity Patterns of Japanese Serows and Sika Deer with Currently Sympatric Distributions" Animals 11, no. 12: 3398. https://doi.org/10.3390/ani11123398
APA StyleSeki, Y., & Hayama, S.-i. (2021). Habitat Selection and Activity Patterns of Japanese Serows and Sika Deer with Currently Sympatric Distributions. Animals, 11(12), 3398. https://doi.org/10.3390/ani11123398