
New In Vitro Methodology for Kinetics Distribution Prediction in the Brain. An Additional Step towards an Animal-Free Approach


Abstract
:Simple Summary
Abstract
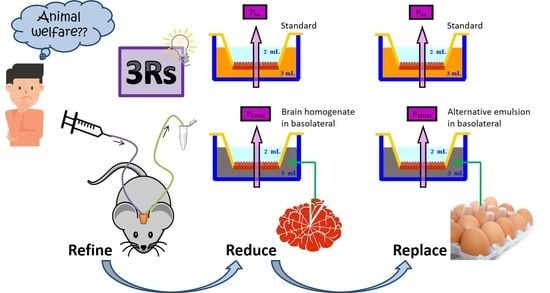
1. Introduction
2. Materials and Methods
2.1. Drugs and Products
2.2. Preparation of the Brain Homogenate and the New Formulation for Substituting It
2.3. Cell Culture and Permeability Studies
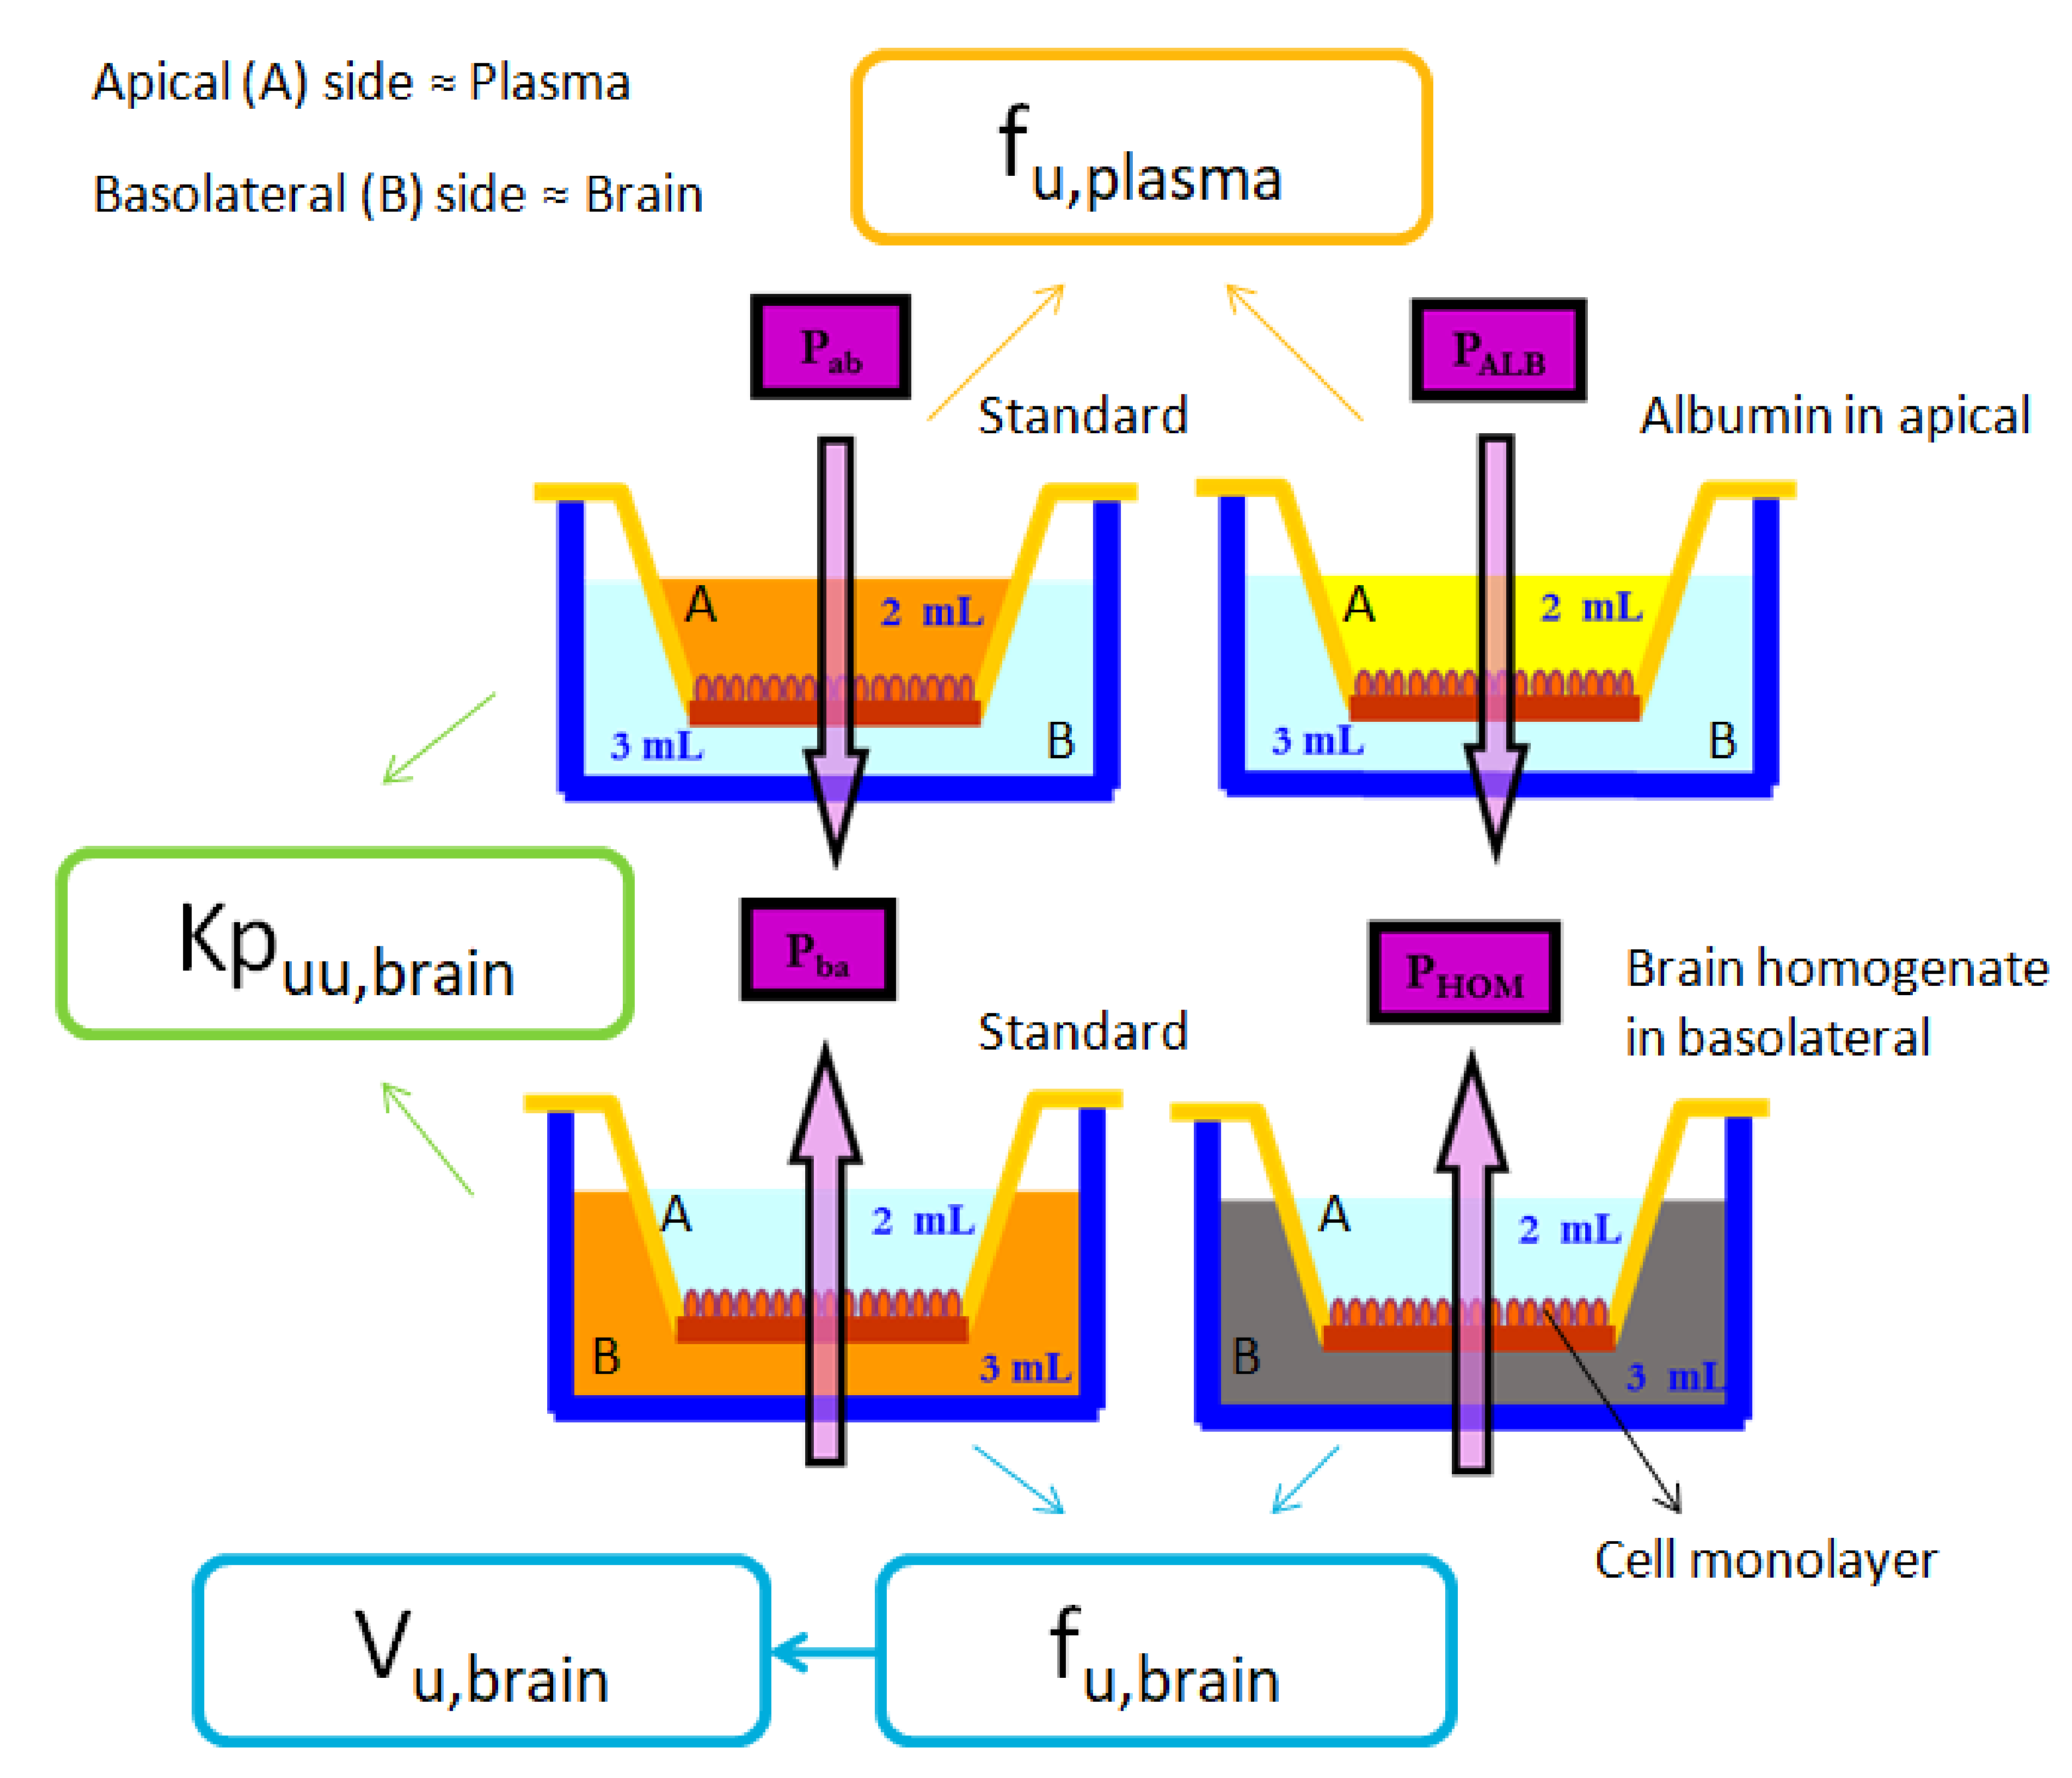
- Standard BA: In this experiment, drugs previously dissolved in HBSS at the concentration shown in Table 3, were placed at the basolateral chamber. After taking the samples and making the necessary calculations, the apparent efflux permeability (Papp B→A) was obtained from this experiment.
- Brain homogenate BA: In this case, the free drug apparent efflux permeability (Papp HOM) was obtained after adding the drug dissolved in a 1:3 pig brain homogenate:phosphate buffer (180 mM, pH 7.4) solution to the basolateral chamber.
- Emulsion BA: Finally, in this third condition, as it is the equivalent to the brain homogenate BA experiment, but using the new formulation as a substitute of brain homogenate, the parameter obtained was also the free drug apparent efflux permeability, but in this case labeled as Papp EMUL.
2.4. HPLC Analysis of the Samples
2.5. Parameters Calculation: Papp, fu,brain and Vu,brain
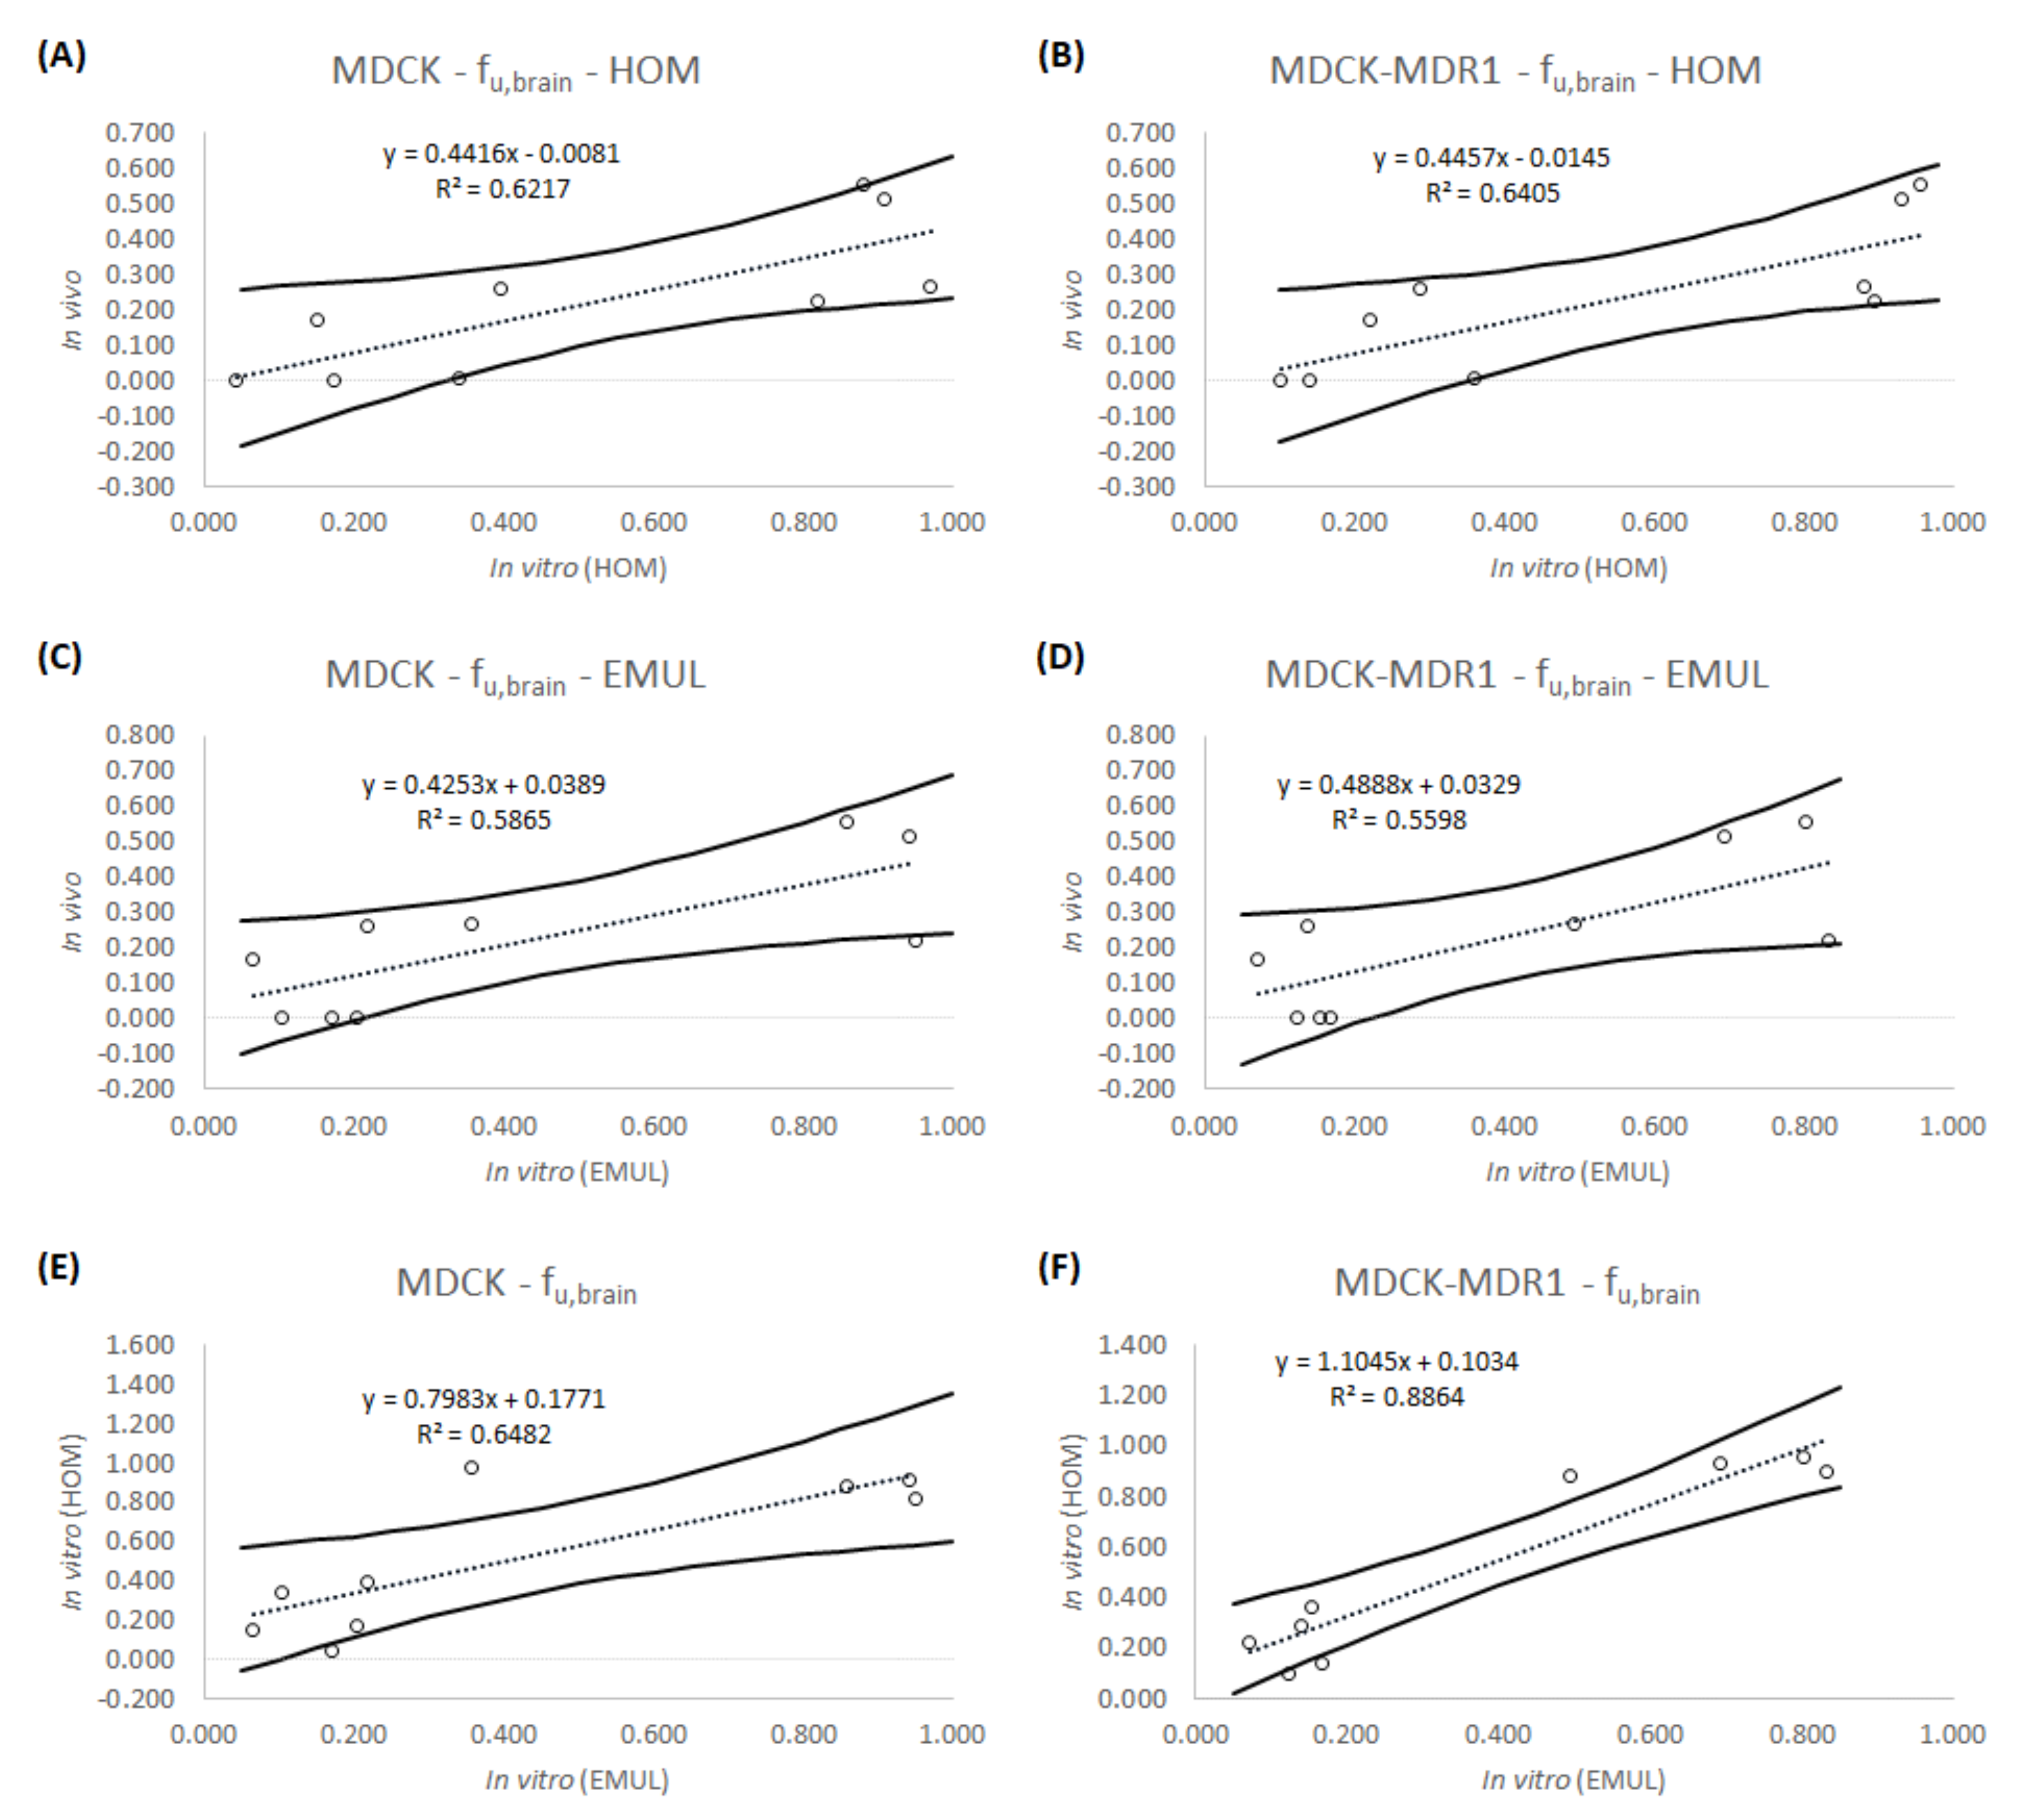
2.6. In Vitro-In Vivo Correlations (IVIVCs): Linear Regression
3. Results
4. Discussion
5. Conclusions
Supplementary Materials
Author Contributions
Funding
Institutional Review Board Statement
Informed Consent Statement
Data Availability Statement
Conflicts of Interest
References
- World Health Organization Facts About Ageing. Available online: http://www.who.int/ageing/about/facts/en/ (accessed on 20 October 2020).
- Kowalska, M.; Owecki, M.; Prendecki, M.; Wize, K.; Nowakowska, J.; Kozubski, W.; Lianeri, M.; Dorszewska, J. Aging and Neurological Diseases. In Senescence—Physiology or Pathology; Dorszewska, J., Kozubski, W., Eds.; InTech: London, UK, 2017. [Google Scholar]
- Global Burden of Disease Collaborative Network Global Burden of Disease Study 2019. Results. 2019. Available online: http://ghdx.healthdata.org/gbd-results-tool (accessed on 9 September 2021).
- Gribkoff, V.K.; Kaczmarek, L.K. The need for new approaches in CNS drug discovery: Why drugs have failed, and what can be done to improve outcomes. Neuropharmacology 2017, 120, 11–19. [Google Scholar] [CrossRef] [Green Version]
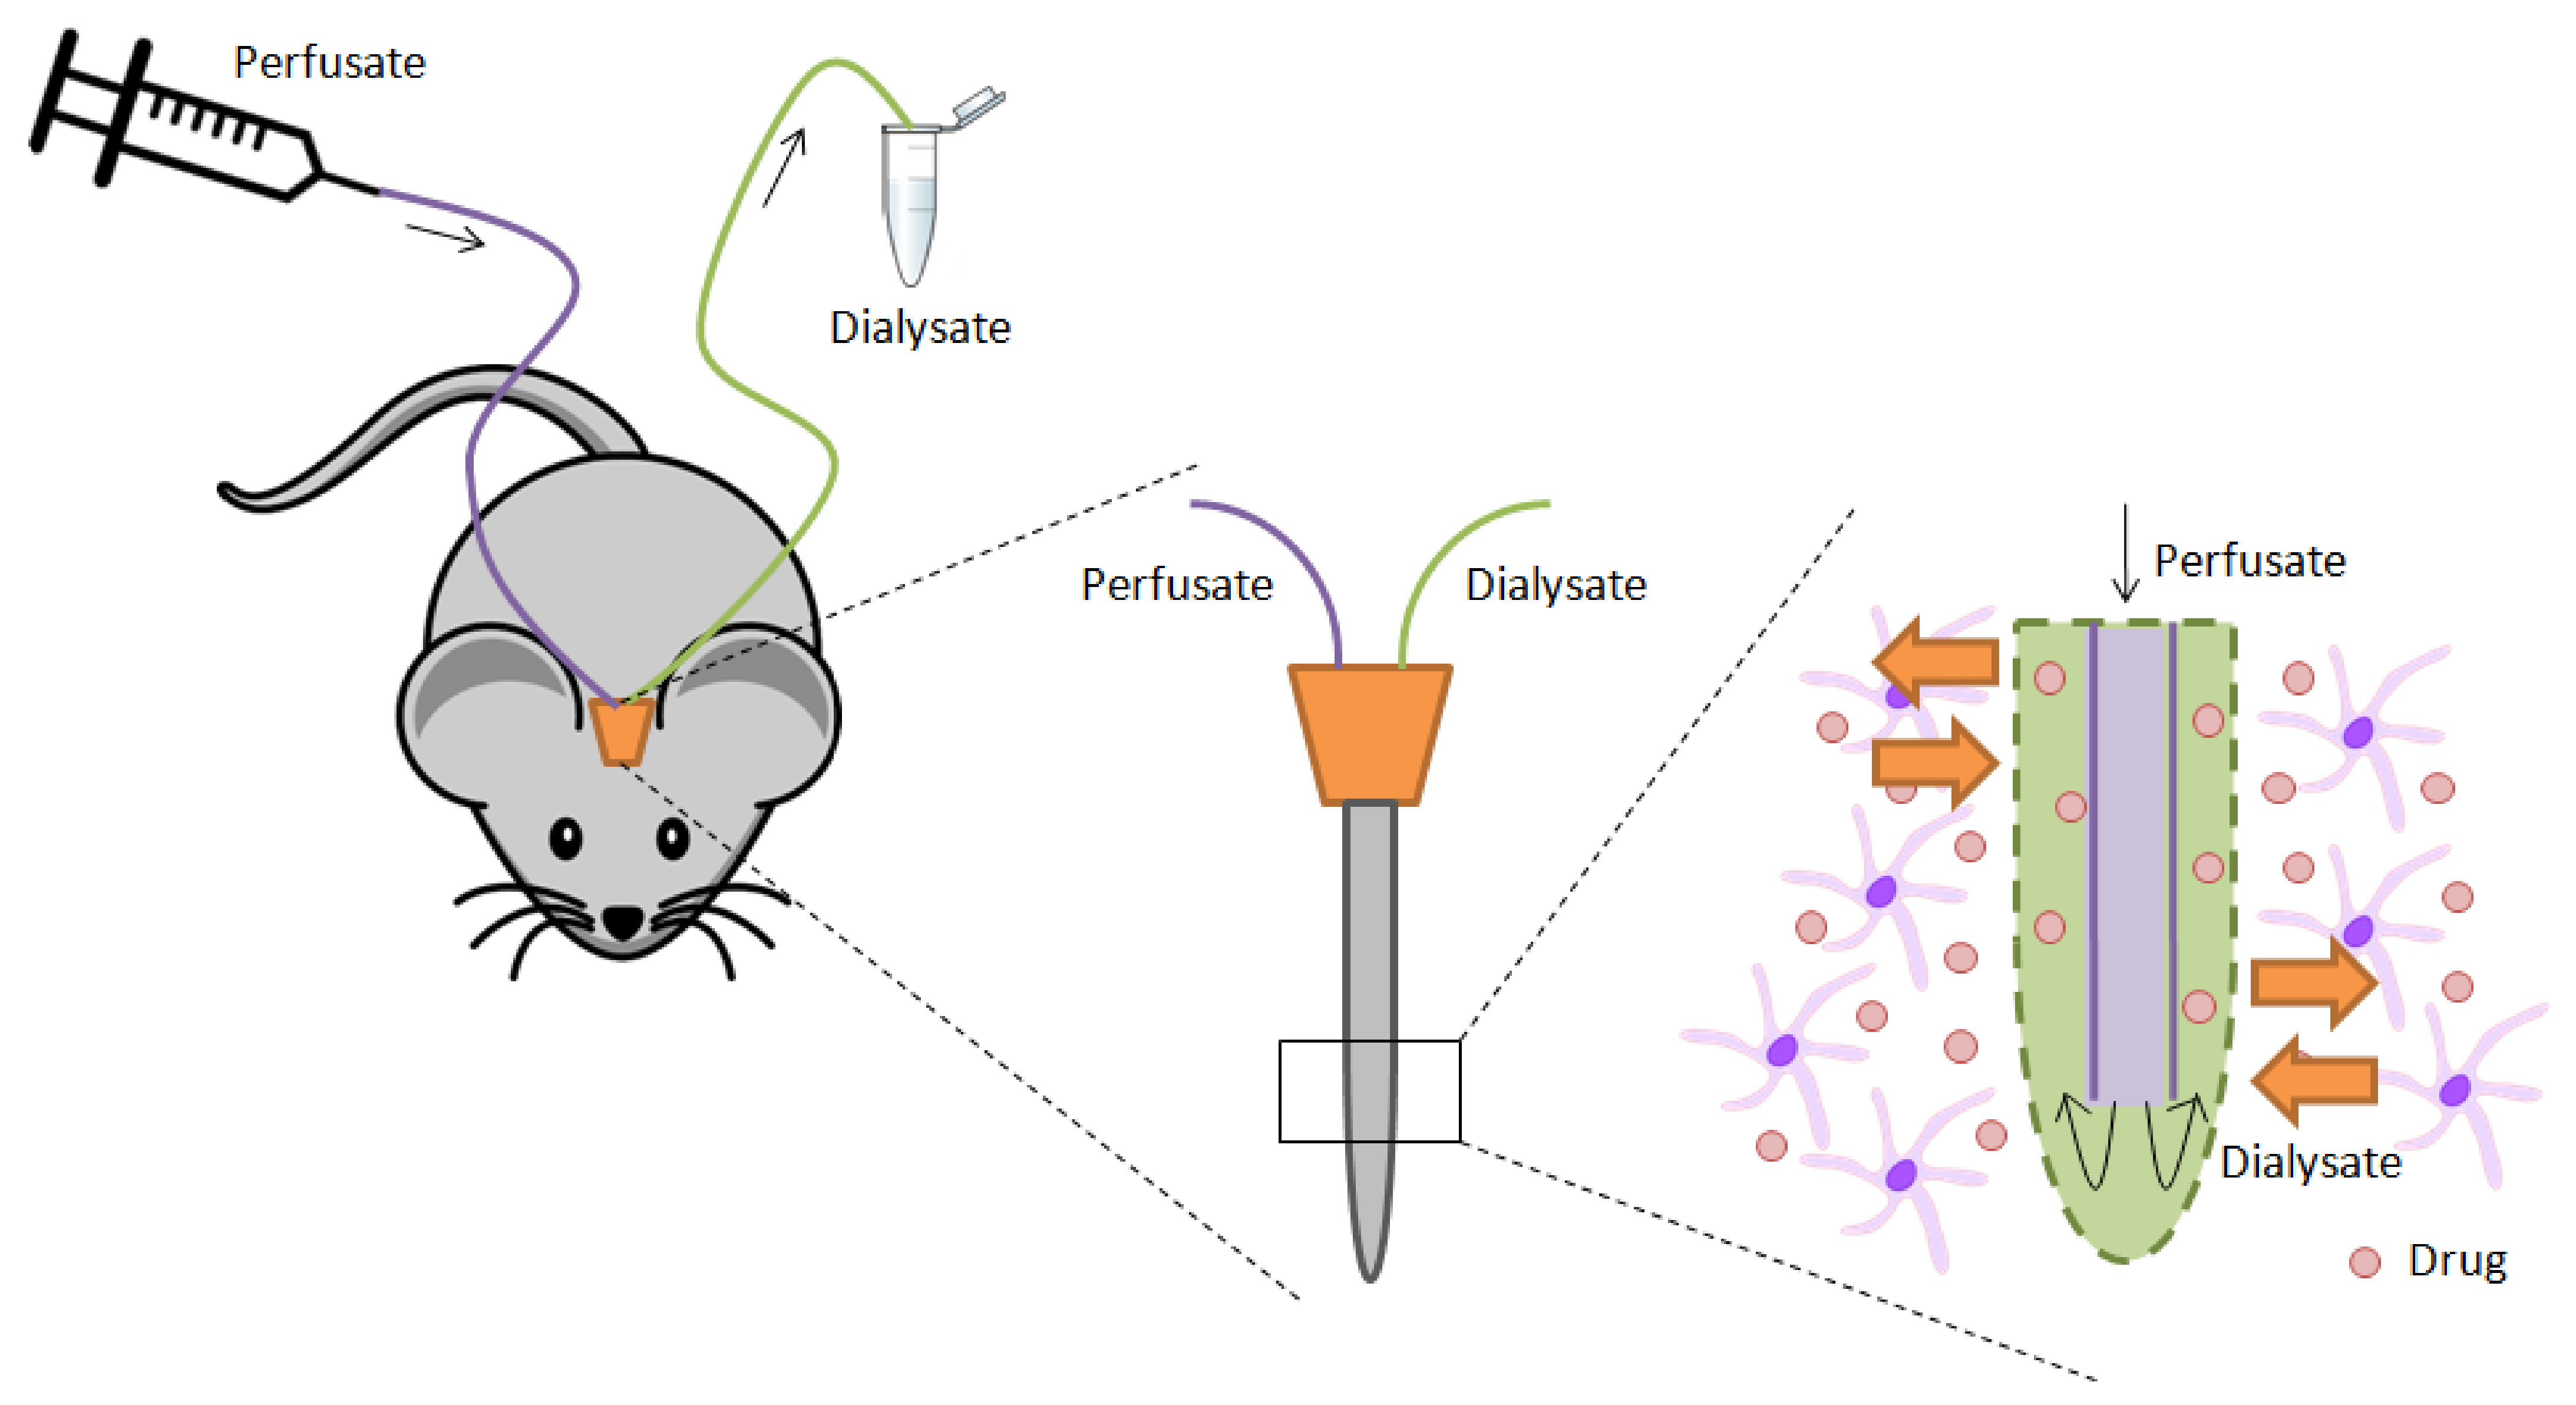
- Yamamoto, Y.; Danhof, M.; de Lange, E.C.M. Microdialysis: The key to physiologically based model prediction of human CNS target site concentrations. AAPS J. 2017, 19, 891–909. [Google Scholar] [CrossRef] [PubMed] [Green Version]
- Hammarlund-Udenaes, M. Microdialysis as an Important Technique in Systems Pharmacology—A Historical and Methodological Review. AAPS J. 2017, 19, 1294–1303. [Google Scholar] [CrossRef] [Green Version]
- Penicaud, L.; Benani, A.; Datiche, F.; Fioramonti, X.; Leloup, C.; Lienard, F. Animal Models and Methods to Study the Relationships Between Brain and Tissues in Metabolic Regulation. In Animal Models for the Study of Human Disease; Elsevier: Amsterdam, The Netherlands, 2013; pp. 569–593. ISBN 9780124158948. [Google Scholar]
- Hammarlund-Udenaes, M.; Fridén, M.; Syvänen, S.; Gupta, A. On the rate and extent of drug delivery to the brain. Pharm. Res. 2008, 25, 1737–1750. [Google Scholar] [CrossRef] [PubMed] [Green Version]
- The National Centre for the 3Rs. The 3Rs NC3Rs. Available online: https://www.nc3rs.org.uk/the-3rs (accessed on 29 June 2020).
- Müller, J.; Esso, K.; Dargó, G.; Könczöl, Á.; Balogh, G.T. Tuning the predictive capacity of the PAMPA-BBB model. Eur. J. Pharm. Sci. 2015, 79, 53–60. [Google Scholar] [CrossRef]
- Mensch, J.; Melis, A.; Mackie, C.; Verreck, G.; Brewster, M.E.; Augustijns, P. Evaluation of various PAMPA models to identify the most discriminating method for the prediction of BBB permeability. Eur. J. Pharm. Biopharm. 2010, 74, 495–502. [Google Scholar] [CrossRef] [PubMed]
- Summerfield, S.G.; Dong, K.C. In vitro, in vivo and in silico models of drug distribution into the brain. J. Pharmacokinet. Pharmacodyn. 2013, 40, 301–314. [Google Scholar] [CrossRef]
- Di, L.; Kerns, E.H.; Bezar, I.F.; Petusky, S.L.; Huang, Y. Comparison of blood–brain barrier permeability assays: In situ brain perfusion, MDR1-MDCKII and PAMPA-BBB. J. Pharm. Sci. 2009, 98, 1980–1991. [Google Scholar] [CrossRef] [PubMed]
- Mensch, J.; Oyarzabal, J.; Mackie, C.; Augustijns, P. In vivo, in vitro and in silico methods for small molecule transfer across the BBB. J. Pharm. Sci. 2009, 98, 4429–4468. [Google Scholar] [CrossRef] [PubMed]
- Dagenais, C.; Graff, C.L.; Pollack, G.M. Variable modulation of opioid brain uptake by P-glycoprotein in mice. Biochem. Pharmacol. 2004, 67, 269–276. [Google Scholar] [CrossRef]
- Sánchez-Dengra, B.; Gonzalez-Alvarez, I.; Bermejo, M.; Gonzalez-Alvarez, M. Physiologically Based Pharmacokinetic (PBPK) Modeling for Predicting Brain Levels of Drug in Rat. Pharmaceutics 2021, 13, 1402. [Google Scholar] [CrossRef]
- Mangas-Sanjuan, V.; González-Álvarez, I.; González-Álvarez, M.; Casabó, V.G.; Bermejo, M. Innovative in vitro method to predict rate and extent of drug delivery to the brain across the blood-brain barrier. Mol. Pharm. 2013, 10, 3822–3831. [Google Scholar] [CrossRef]
- Sánchez-Dengra, B.; González-Álvarez, I.; Sousa, F.; Bermejo, M.; González-Álvarez, M.; Sarmento, B. In vitro model for predicting the access and distribution of drugs in the brain using hCMEC/D3 cells. Eur. J. Pharm. Biopharm. 2021, 163, 120–126. [Google Scholar] [CrossRef] [PubMed]
- Chemicalize Chemicalize-Instant Cheminformatics Solutions. Available online: https://chemicalize.com/welcome (accessed on 3 May 2020).
- DrugBank. Available online: https://www.drugbank.ca/ (accessed on 14 May 2020).
- Instituto de Estudios del Huevo Composición. Nutricional del Huevo. Available online: https://www.institutohuevo.com/composicion-nutricional-del-huevo/#1501003984074-a5111b1a-4b63 (accessed on 3 July 2020).
- Mangas-Sanjuan, V.; Gonzalez-Alvarez, M.; Gonzalez-Alvarez, I.; Bermejo, M. In vitro methods for assessing drug access to the brain. In Advances in Non-Invasive Drug Delivery to the Brain; Future Science Ltd.: London, UK; Marshall University: Huntington, WV, USA, 2015; pp. 44–61. ISBN 9781909453937. [Google Scholar]
- Veszelka, S.; Tóth, A.; Walter, F.R.; Tóth, A.E.; Gróf, I.; Mészáros, M.; Bocsik, A.; Hellinger, É.; Vastag, M.; Rákhely, G.; et al. Comparison of a rat primary cell-based blood-brain barrier model with epithelial and brain endothelial cell lines: Gene expression and drug transport. Front. Mol. Neurosci. 2018, 11, 166. [Google Scholar] [CrossRef] [PubMed]
- Mangas-Sanjuan, V.; González-Álvarez, I.; González-Álvarez, M.; Casabó, V.G.; Bermejo, M. Modified nonsink equation for permeability estimation in cell monolayers: Comparison with standard methods. Mol. Pharm. 2014, 11, 1403–1414. [Google Scholar] [CrossRef]
- Fridén, M.; Gupta, A.; Antonsson, M.; Bredberg, U.; Hammarlund-Udenaes, M. In vitro methods for estimating unbound drug concentrations in the brain interstitial and intracellular fluids. Drug Metab. Dispos. 2007, 35, 1711–1719. [Google Scholar] [CrossRef] [Green Version]
- Kodaira, H.; Kusuhara, H.; Fujita, T.; Ushiki, J.; Fuse, E.; Sugiyama, Y. Quantitative evaluation of the impact of active efflux by P-glycoprotein and breast cancer resistance protein at the blood-brain barrier on the predictability of the unbound concentrations of drugs in the brain using cerebrospinal fluid concentration as a. J. Pharmacol. Exp. Ther. 2011, 339, 935–944. [Google Scholar] [CrossRef] [Green Version]
- The European Commission’s Science and Knowledge Service EU. Reference Laboratory for Alternatives to Animal Testing EU Science Hub. Available online: https://ec.europa.eu/jrc/en/eurl/ecvam (accessed on 19 July 2020).
- Sánchez-Dengra, B.; González-Álvarez, I.; Bermejo, M.; González-Álvarez, M. Nanomedicine in the Treatment of Pathologies of the Central Nervous System Advances in Nanomedicine. Advances in Nanomedicine. 2020. Available online: https://www.openaccessebooks.com/advances-in-nanomedicine/nanomedicine-in-the-ttreatment-of-pathologies-of-the-central-nervous-system.pdf (accessed on 19 July 2020).
- McIlwain, H.; Bachelard, H. Biochemistry and the Central Nervous System, 5th ed.; Churchill Livingstone: Edingburg, UK, 1985; ISBN 0-443-01961-4. [Google Scholar]
- Wikipedia Huevo (Alimento). Available online: https://es.wikipedia.org/wiki/Huevo_(alimento) (accessed on 3 July 2020).
- Garg, P.; Jitender, V. In Silico Prediction of Blood Brain Barrier Permeability: An Artificial Neural Network Model. J. Chem. Inf. Model. 2005, 46, 289–297. [Google Scholar] [CrossRef] [PubMed]
- Pajouhesh, H.; Lenz, G.R. Medicinal Chemical Properties of Successful Central Nervous System Drugs. NeuroRx 2005, 2, 541. [Google Scholar] [CrossRef] [PubMed] [Green Version]
- Carpenter, T.S.; Kirshner, D.A.; Lau, E.Y.; Wong, S.E.; Nilmeier, J.P.; Lightstone, F.C. A Method to Predict Blood-Brain Barrier Permeability of Drug-Like Compounds Using Molecular Dynamics Simulations. Biophys. J. 2014, 107, 630. [Google Scholar] [CrossRef] [PubMed] [Green Version]
- Loryan, I.; Sinha, V.; Mackie, C.; Van Peer, A.; Drinkenburg, W.; Vermeulen, A.; Morrison, D.; Monshouwer, M.; Heald, D.; Hammarlund-Udenaes, M. Mechanistic understanding of brain drug disposition to optimize the selection of potential neurotherapeutics in drug discovery. Pharm. Res. 2014, 31, 2203–2219. [Google Scholar] [CrossRef]
- Ball, K.; Bouzom, F.; Scherrmann, J.M.; Walther, B.; Declèves, X. A physiologically based modeling strategy during preclinical CNS drug development. Mol. Pharm. 2014, 11, 836–848. [Google Scholar] [CrossRef]
- Schiffelers, M.J.W.A.; Blaauboer, B.J.; Hendriksen, C.F.M.; Bakker, W.E. Regulatory acceptance and use of 3R models: A multilevel perspective. ALTEX 2012, 29, 287–300. [Google Scholar] [CrossRef] [PubMed]


| Disease | Prevalence (Millions of People) | |||||||
|---|---|---|---|---|---|---|---|---|
| All Ages | 60 to 89 Years | |||||||
| 2000 | 2019 | ∆ (%) | Norm_∆ (%) | 2000 | 2019 | ∆ (%) | Norm_∆ (%) | |
| Alzheimer’s disease and other dementias | 26.70 | 51.62 | 93% | 54% | 22.06 | 41.35 | 87% | 13% |
| Parkinson’s disease | 4.82 | 8.51 | 76% | 41% | 3.91 | 6.87 | 76% | 6% |
| Other neurological disorders | 0.04 | 0.06 | 45% | 16% | 0.01 | 0.02 | 92% | 16% |
| Motor neuron disease | 0.19 | 0.27 | 45% | 15% | 0.05 | 0.09 | 81% | 10% |
| Multiple sclerosis | 1.24 | 1.76 | 41% | 13% | 0.29 | 0.49 | 66% | 1% |
| Schizophrenia | 17.31 | 23.60 | 36% | 9% | 1.82 | 3.12 | 72% | 4% |
| Idiopathic epilepsy | 18.53 | 25.11 | 35% | 8% | 2.48 | 4.68 | 89% | 14% |
| Migraine | 852.24 | 1128.09 | 32% | 5% | 64.62 | 111.20 | 72% | 4% |
| Tension-type headache | 1524.6 | 1995.2 | 31% | 4% | 176.3 | 291.7 | 65% | 0% |
| Mental disorders | 777.26 | 970.07 | 25% | −1% | 84.54 | 140.19 | 66% | 0% |
| Neurological disorders | 2016.6 | 2659.0 | 32% | 5% | 228.1 | 385.5 | 69% | 2% |
| Drug | MW(g/mol) | Solubility logS(pH 7) | logP | StrongestAcidic pKa | StrongestBasic pKa | Charge(pH 7.4) | Transporters(Substrates) |
|---|---|---|---|---|---|---|---|
| Amitriptyline | 277.411 | −1.63 | 4.81 | 9.76 | + | ABCB1 (Pgp) | |
| Atenolol | 266.341 | 0.43 | 0.43 | 14.08 | 9.67 | + | ABCB11 |
| Carbamazepine | 236.274 | −3.79 | 2.77 | 15.96 | 0 | ABCC2 RALBP1 | |
| Fleroxacin | 369.344 | −1.33 | 0.98 | 5.32 | 5.99 | - | |
| Loperamide | 477.050 | −2.23 | 4.77 | 13.96 | 9.41 | + | ABCB1 (Pgp) |
| Norfloxacin | 319.336 | −2.06 | −0.97 | 5.58 | 8.77 | 0 | ABCB1 (Pgp) |
| Pefloxacin | 333.363 | −1.21 | 0.75 | 5.5 | 6.44 | - | ABCB1 (Pgp) |
| Propranolol | 259.349 | −1.03 | 2.58 | 14.09 | 9.67 | + | ABCB1 (Pgp) |
| Zolpidem | 307.397 | −4.27 | 3.02 | 5.39 | 0 |
| Drug | C (μM) | Wavelength | Mobile Phase | Retention Time (Min) |
|---|---|---|---|---|
| Amitriptyline | 250 | 240 nm | 40% Acid water 60% Acetonitrile | 1.020 |
| Atenolol | 150 | 231 nm | 20% Methanol 60% Acid water 20% Acetonitrile | 1.330 |
| Carbamazepine | 150 | 280 nm | 65% Acid water 35% Acetonitrile | 1.926 |
| Fleroxacin | 150 | 285 nm | 70% Acid water 30% Acetonitrile | 1.348 |
| Loperamide | 241 | 260 nm | 60% Methanol 40% Acid water | 3.199 |
| Norfloxacin | 150 | 285 nm | 70% Acid water 30% Acetonitrile | 1.730 |
| Pefloxacin | 8.91 | 285 nm | 65% Acid water 35% Acetonitrile | 0.721 |
| Propranolol | 150 | 291 nm | 30% Methanol 40% Acid water 30% Acetonitrile | 1.950 |
| Zolpidem | 158 | 231 nm | 60% Water 20% Methanol 20% Acetonitrile | 4.624 |
| MDCK Cell Line (×10−6 cm/s) | MDCK-MDR1 Cell Line (×10−6 cm/s) | ||||||
|---|---|---|---|---|---|---|---|
| Drug | C (μM) | Papp B→A | Papp HOM | Papp EMUL | Papp B→A | Papp HOM | Papp EMUL |
| Amitriptyline | 250 | 13.51 | 2.35 | 2.75 | 15.97 | 1.63 | 1.98 |
| Atenolol | 150 | 168.67 | 66.78 | 36.86 | 271.49 | 78.20 | 37.62 |
| Carbamazepine | 150 | 476.65 | 72.40 | 31.15 | 408.31 | 90.63 | 29.34 |
| Fleroxacin | 150 | 49.92 * | 43.91 * | 42.88 | 47.07 * | 44.94 * | 37.80 |
| Loperamide | 241 | 29.30 | 1.27 | 5.03 | 29.29 | 4.08 | 4.89 |
| Norfloxacin | 150 | 42.38 | 34.68 | 40.22 | 49.28 | 44.11 | 41.08 |
| Pefloxacin | 8.91 | 37.49 * | 34.10 * | 35.30 | 35.39 * | 32.93 * | 24.53 |
| Propranolol | 150 | 97.00 | 33.01 | 10.11 | 106.66 | 38.33 | 16.36 |
| Zolpidem | 158 | 36.48 | 35.42 | 13.03 | 33.43 | 29.46 | 16.52 |
| Drug | Rat | MDCK | MDCK-MDR1 | |||
|---|---|---|---|---|---|---|
| C (μM) | fu,brain | fu,brain HOM | fu,brain EMUL | fu,brain HOM | fu,brain EMUL | |
| Amitriptyline | 250 | 0.002 | 0.174 | 0.204 | 0.102 | 0.124 |
| Atenolol | 150 | 0.261 | 0.396 | 0.219 | 0.288 | 0.139 |
| Carbamazepine | 150 | 0.170 | 0.152 | 0.065 | 0.222 | 0.072 |
| Fleroxacin | 150 | 0.555 | 0.880 * | 0.859 | 0.955 * | 0.803 |
| Loperamide | 241 | 0.002 | 0.043 | 0.172 | 0.139 | 0.167 |
| Norfloxacin | 150 | 0.222 | 0.818 | 0.949 | 0.895 | 0.834 |
| Pefloxacin | 8.91 | 0.514 | 0.910 * | 0.942 | 0.931 * | 0.693 |
| Propranolol | 150 | 0.005 | 0.340 | 0.104 | 0.359 | 0.153 |
| Zolpidem | 158 | 0.265 | 0.971 | 0.357 | 0.881 | 0.494 |
| Drug | Rat | MDCK | MDCK-MDR1 | |||
|---|---|---|---|---|---|---|
| C (μM) | Vu,brain | Vu,brain HOM | Vu,brain EMUL | Vu,brain HOM | Vu,brain EMUL | |
| Atenolol | 150 | 2.500 | 1.715 | 2.946 | 2.283 | 4.530 |
| Carbamazepine | 150 | 3.729 | 4.150 | 9.380 | 2.903 | 8.550 |
| Fleroxacin | 150 | 1.281 | 0.882 | 0.898 | 0.828 | 0.947 |
| Norfloxacin | 150 | 2.900 | 0.933 | 0.832 | 0.870 | 0.920 |
| Pefloxacin | 8.91 | 1.367 | 0.860 | 0.837 | 0.845 | 1.065 |
| Zolpidem | 158 | 2.464 | 0.818 | 1.880 | 0.881 | 1.414 |
Publisher’s Note: MDPI stays neutral with regard to jurisdictional claims in published maps and institutional affiliations. |
© 2021 by the authors. Licensee MDPI, Basel, Switzerland. This article is an open access article distributed under the terms and conditions of the Creative Commons Attribution (CC BY) license (https://creativecommons.org/licenses/by/4.0/).
Share and Cite
Sánchez-Dengra, B.; González-Álvarez, I.; González-Álvarez, M.; Bermejo, M. New In Vitro Methodology for Kinetics Distribution Prediction in the Brain. An Additional Step towards an Animal-Free Approach. Animals 2021, 11, 3521. https://doi.org/10.3390/ani11123521
Sánchez-Dengra B, González-Álvarez I, González-Álvarez M, Bermejo M. New In Vitro Methodology for Kinetics Distribution Prediction in the Brain. An Additional Step towards an Animal-Free Approach. Animals. 2021; 11(12):3521. https://doi.org/10.3390/ani11123521
Chicago/Turabian StyleSánchez-Dengra, Bárbara, Isabel González-Álvarez, Marta González-Álvarez, and Marival Bermejo. 2021. "New In Vitro Methodology for Kinetics Distribution Prediction in the Brain. An Additional Step towards an Animal-Free Approach" Animals 11, no. 12: 3521. https://doi.org/10.3390/ani11123521
APA StyleSánchez-Dengra, B., González-Álvarez, I., González-Álvarez, M., & Bermejo, M. (2021). New In Vitro Methodology for Kinetics Distribution Prediction in the Brain. An Additional Step towards an Animal-Free Approach. Animals, 11(12), 3521. https://doi.org/10.3390/ani11123521