1. Introduction
Dairying in New Zealand is pasture based with stocking rate and mating dates chosen to achieve concordance between predicted pasture supply and feed demand of the herd. The feeding system is highly dependent on seasonal pasture supply, and therefore, the stocking rate of cows is managed to achieve the optimal pasture utilization for producing milk and milk solids [
1]. The level of supplementary feeding is low [
2] compared to the levels found in indoor feeding systems such as those in North America or Europe [
3]. Crops may be used for offsetting pasture shortages in winter or any summer months with drought. Fresh pasture contains high quantities of crude protein relative to energy, therefore cows grazing pastures without energy supplementation involuntarily consume excessive quantities of protein, thereby greatly exceeding their requirements [
4]. When the consumed pasture is processed in the rumen, ruminally degradable proteins are broken down to amino acids and ammonia. The ammonia is transported to the liver and converted to urea which enters the blood stream and a small proportion is diffused into the milk, some is recycled back to the rumen via saliva, while the bulk of the urea is transported to the kidneys for excretion in urine [
5].
Milk urea nitrogen (MUN) concentration has been proposed as a diagnostic tool for protein relative to energy feeding of animals [
6,
7]. Protein feeding of cows is an expensive component of the diet relative to energy in many countries. Further, the process of converting rumen derived ammonia to urea in the liver is energy [
8] and protein [
9] demanding. Some researchers have pointed out direct negative effects of MUN on reproductive performance [
10,
11] as a result of increased blood urea nitrogen concentrations and decreased uterine pH [
12]. Guinot-Thomas [
13] reported that cheese manufacture can also be compromised given the greater coagulation time required for milk with higher MUN. A major concern from the environmental point of view is that MUN may be positively associated with the amount of urinary nitrogen (UN) excreted by the cow [
14]. Nitrogen (N) that enters the environment as UN breaks down to ammonia and nitrous oxide at the site of the urine patch making it a source of water and air pollution. Averaged across the year, 20% of UN load is typically leached through the soil [
15].
There are several options that could contribute to reductions in UN. Feeding cows with a diet balanced for ruminally degradable protein (RDP) and energy content is an appealing option if energy supplementation is cost-effective and practical. In a balanced diet, ammonia produced during RDP metabolism in the rumen can be readily captured by rumen microbes and utilized for microbial protein synthesis which generates usable protein for the cow [
16]. Microbial protein synthesis is highly sensitive to the amount of fermentable energy in the diet [
17]. If the diet contains insufficient fermentable energy then the rumen microbes are inefficient at capturing the ammonia, hence the generated ammonia is converted into urea in the liver and excreted in urine as an un-utilized form of protein. In New Zealand pasture systems, a balanced diet would require energy supplementation which is expensive and intensive in terms of increasing demand for labor, feed storage facilities and feeding equipment. Feeding cows with less RDP [
18] and adjusting the protein supply in diet to satisfy the protein requirement of the cow [
16] are among other feeding management strategies discussed in literature to reduce N wastage.
Retention of replacement heifers sired by bulls selected for low MUN has been suggested as a useful option for reducing N excretion by Beatson et al. [
19]. They assumed that New Zealand cows competing with each other for voluntary intake of pasture had the same relationship between MUN and UN as overseas cows fed with total mixed rations (TMR) and assumed that reducing MUN through breeding has a similar effect on UN to reducing MUN through feeding. This presumably reflects improved N utilization efficiency of cows, identifying cows that partition more of their dietary N into milk protein [
16], and reducing the amount of N excreted from the cow as MUN. However, reduced MUN per cow might physiologically be accomplished by reducing voluntary dry-matter intake, which would reduce metabolizable energy available above maintenance, and consequently reduce productivity per cow [
20].
The national breeding objective in New Zealand is to generate dairy cows that are able to efficiently convert feed into profit. To achieve that objective, cows and bulls are selected based on the breeding worth (BW) index, which is calculated as the sum of the product of the estimated breeding values and respective economic value of each of the traits under selection. The BW index ranks the animals in units of net profit expressed in dollars per 5 tonnes of dry matter intake (DMI). The calculation of BW includes eight traits; lactation yields of milk, fat and protein, cow liveweight, fertility, longevity, body condition score, and somatic cell score [
21]. Since MUN is associated both with N excretion [
14] and N utilization efficiency [
22], MUN may be considered as a candidate trait to include in the selection criteria for New Zealand dairy cattle to improve environmental sustainability and food security.
There are no published studies that have considered the response to selection from using MUN as a trait in the breeding objective. The objectives of this study were (1) to evaluate the correlated responses in lactation yields of milk (MY), fat (FY), crude protein (CPY), MUN and average mature cow liveweight (LWT) from three different selection indices in New Zealand dairy cows milked twice a day based on a conventional progeny test scheme, and (2) to evaluate the likely phenotypic correlated responses in production and UN per cow and per hectare for the three selection indices.
3. Results
The predicted correlated response per cow per year in the assumed dairy cow population under three different scenarios based on the progeny test scheme are presented in
Table 5. The predicted annual responses of the current selection index on a per cow basis were 16.4 kg MY, 2.0 kg FY, 1.4 kg CPY, −0.4 kg LWT, and −0.05 mg/dL MUN, respectively. The predicted increase of MUN for the positive selection index (MUN
+20%) was 0.1 mg/dL with correlated increase of MY, FY, PY, and LWT. Applying a negative selection (MUN
−20%) in the index resulted in a reduction of MUN, with increased MY, FY, PY, and reduced LWT. Selection of cows under positive economic values on MUN reduced the overall annual economic response of cows by 15% (NZD 1.80/cow), due to increased MY and LWT, whereas a negative economic values reduced the overall annual economic response by 11% (NZD 1.30/cow) due to reduced milk constituent yields when compared to the cow selected under the current index (MUN
0%).
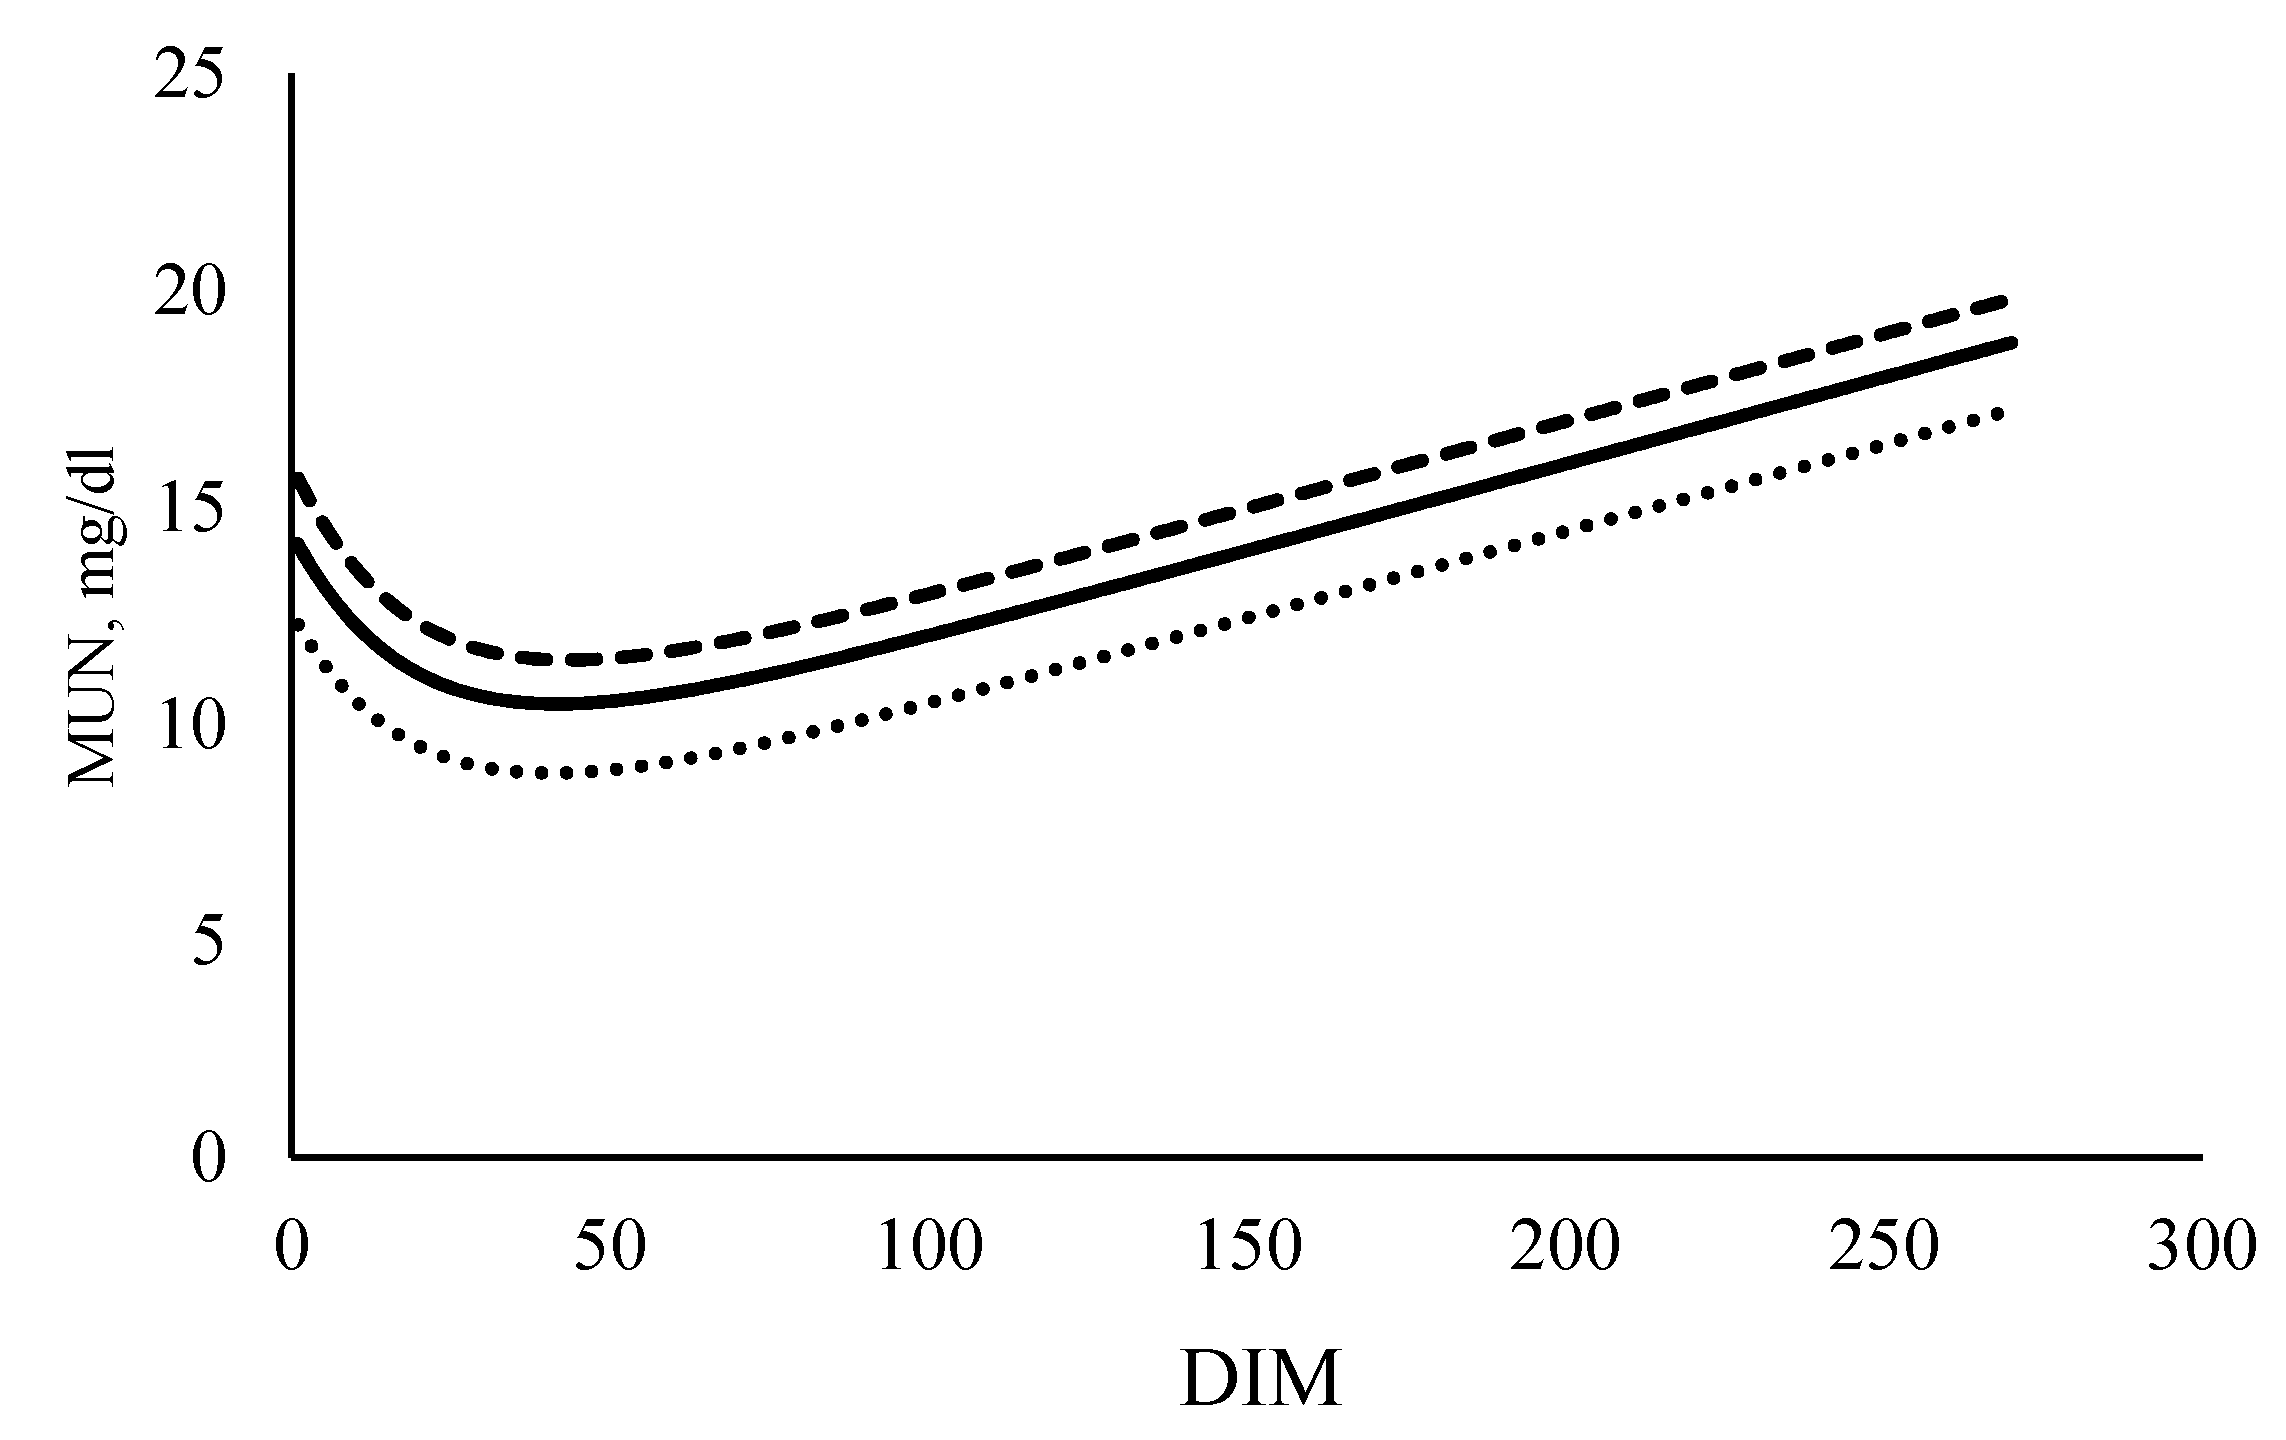
The simulated performance for milk traits, liveweight and MUN after 10 years of selection under the three selection scenarios on a per cow and per hectare basis are presented in
Table 6. The traits those were not included in the selection index under each scenario were estimated using the formulae presented in materials and methods section. The daily concentrations of MUN for cows in the base year and cows selected under positive and negative scenarios are shown in
Figure 1.
After ten years of selection with the current selection index (MUN0%), there would be an increase of MY, FY, PY, a decrease of LWT along with a marginal decrease in MUN (0.55 mg/dL) per cow, compared to the base year. Ten years of selection under a positive scenario would increase MY, FY, PY, LWT and MUN per cow, compared to the base year. The selection based on the negative scenario for ten years would decrease MUN, compared to the base year, with per cow increase in MY, FY, PY, and decrease of LWT.
A loss of FY, CPY and LWT under negative selection (MUN−20%) resulted in a reduction in metabolizable energy requirements and therefore a subsequent reduction in DMI per cow compared to the MUN0%. The reduction in DMI per cow led to an increase in SR from 2.865 (MUN0%) to 2.914 cows/ha for equivalent utilization of pasture. Even though a similar production of fat and crude protein was observed under both MUN0% and MUN+20%, the increased MY and LWT increased the metabolizable energy requirement which is reflected in the DMI of the cow in the latter scenario. This led to a need to reduce the SR under MUN+20% relative to SR of the base year.
Ten years of selection based on a selection index with no emphasis on MUN will result in cows excreting 1.3 kg less UN and 6.7 kg more FN compared to the cows in the base year. The total N excreted (UN + FN) by the cows in base year is 112.8 kg which is predicted to be increased by 5.4 kg per cow as a consequence of MUN0% selection scenario relative to cows in the base year. On a per ha basis the annual UN excretion is 168.6 kg and total N excreted is 336.5 kg in the base year and UN was estimated to reduce by 10.4 kg while N excreted was estimated to increase by 2.5 kg for cows selected with no emphasis on MUN.
The cows selected under the MUN+20% for ten years would excrete 1.6 kg more UN, 5.7 kg more FN and 7.3 kg more total N compared to the cow in the base year. On a per hectare basis, due to the change in stocking rate, there will be a reduction of 3.5 kg of UN excretion with an increase of 4.6 kg of total N excretion compared to the base year. This means that by selection, the cows were manipulated to alter the N path.
After ten years of selection, a cow in MUN−20% would have a reduced UN of 3.5 kg, with an increase of 7.9 kg in FN compared to cow in base year. This selection will also be responsible for 14.1 kg less UN but 5.1 kg more total N excretion on a per hectare basis compared to the base year. The total N excretion by cows selected under the MUN+20% was slightly lower than that of the cow selected under MUN−20%.
Across New Zealand (over 1.74 m of effective hectares of dairy lands) the annual total N excretion (UN + FN) of cows in the base year was 585.5 m kg and was predicted to annually increase by 0.4 m kg, 0.8 m kg, and 0.9 m kg for cows selected under MUN−0%, MUN+20%, and MUN−20%, respectively.
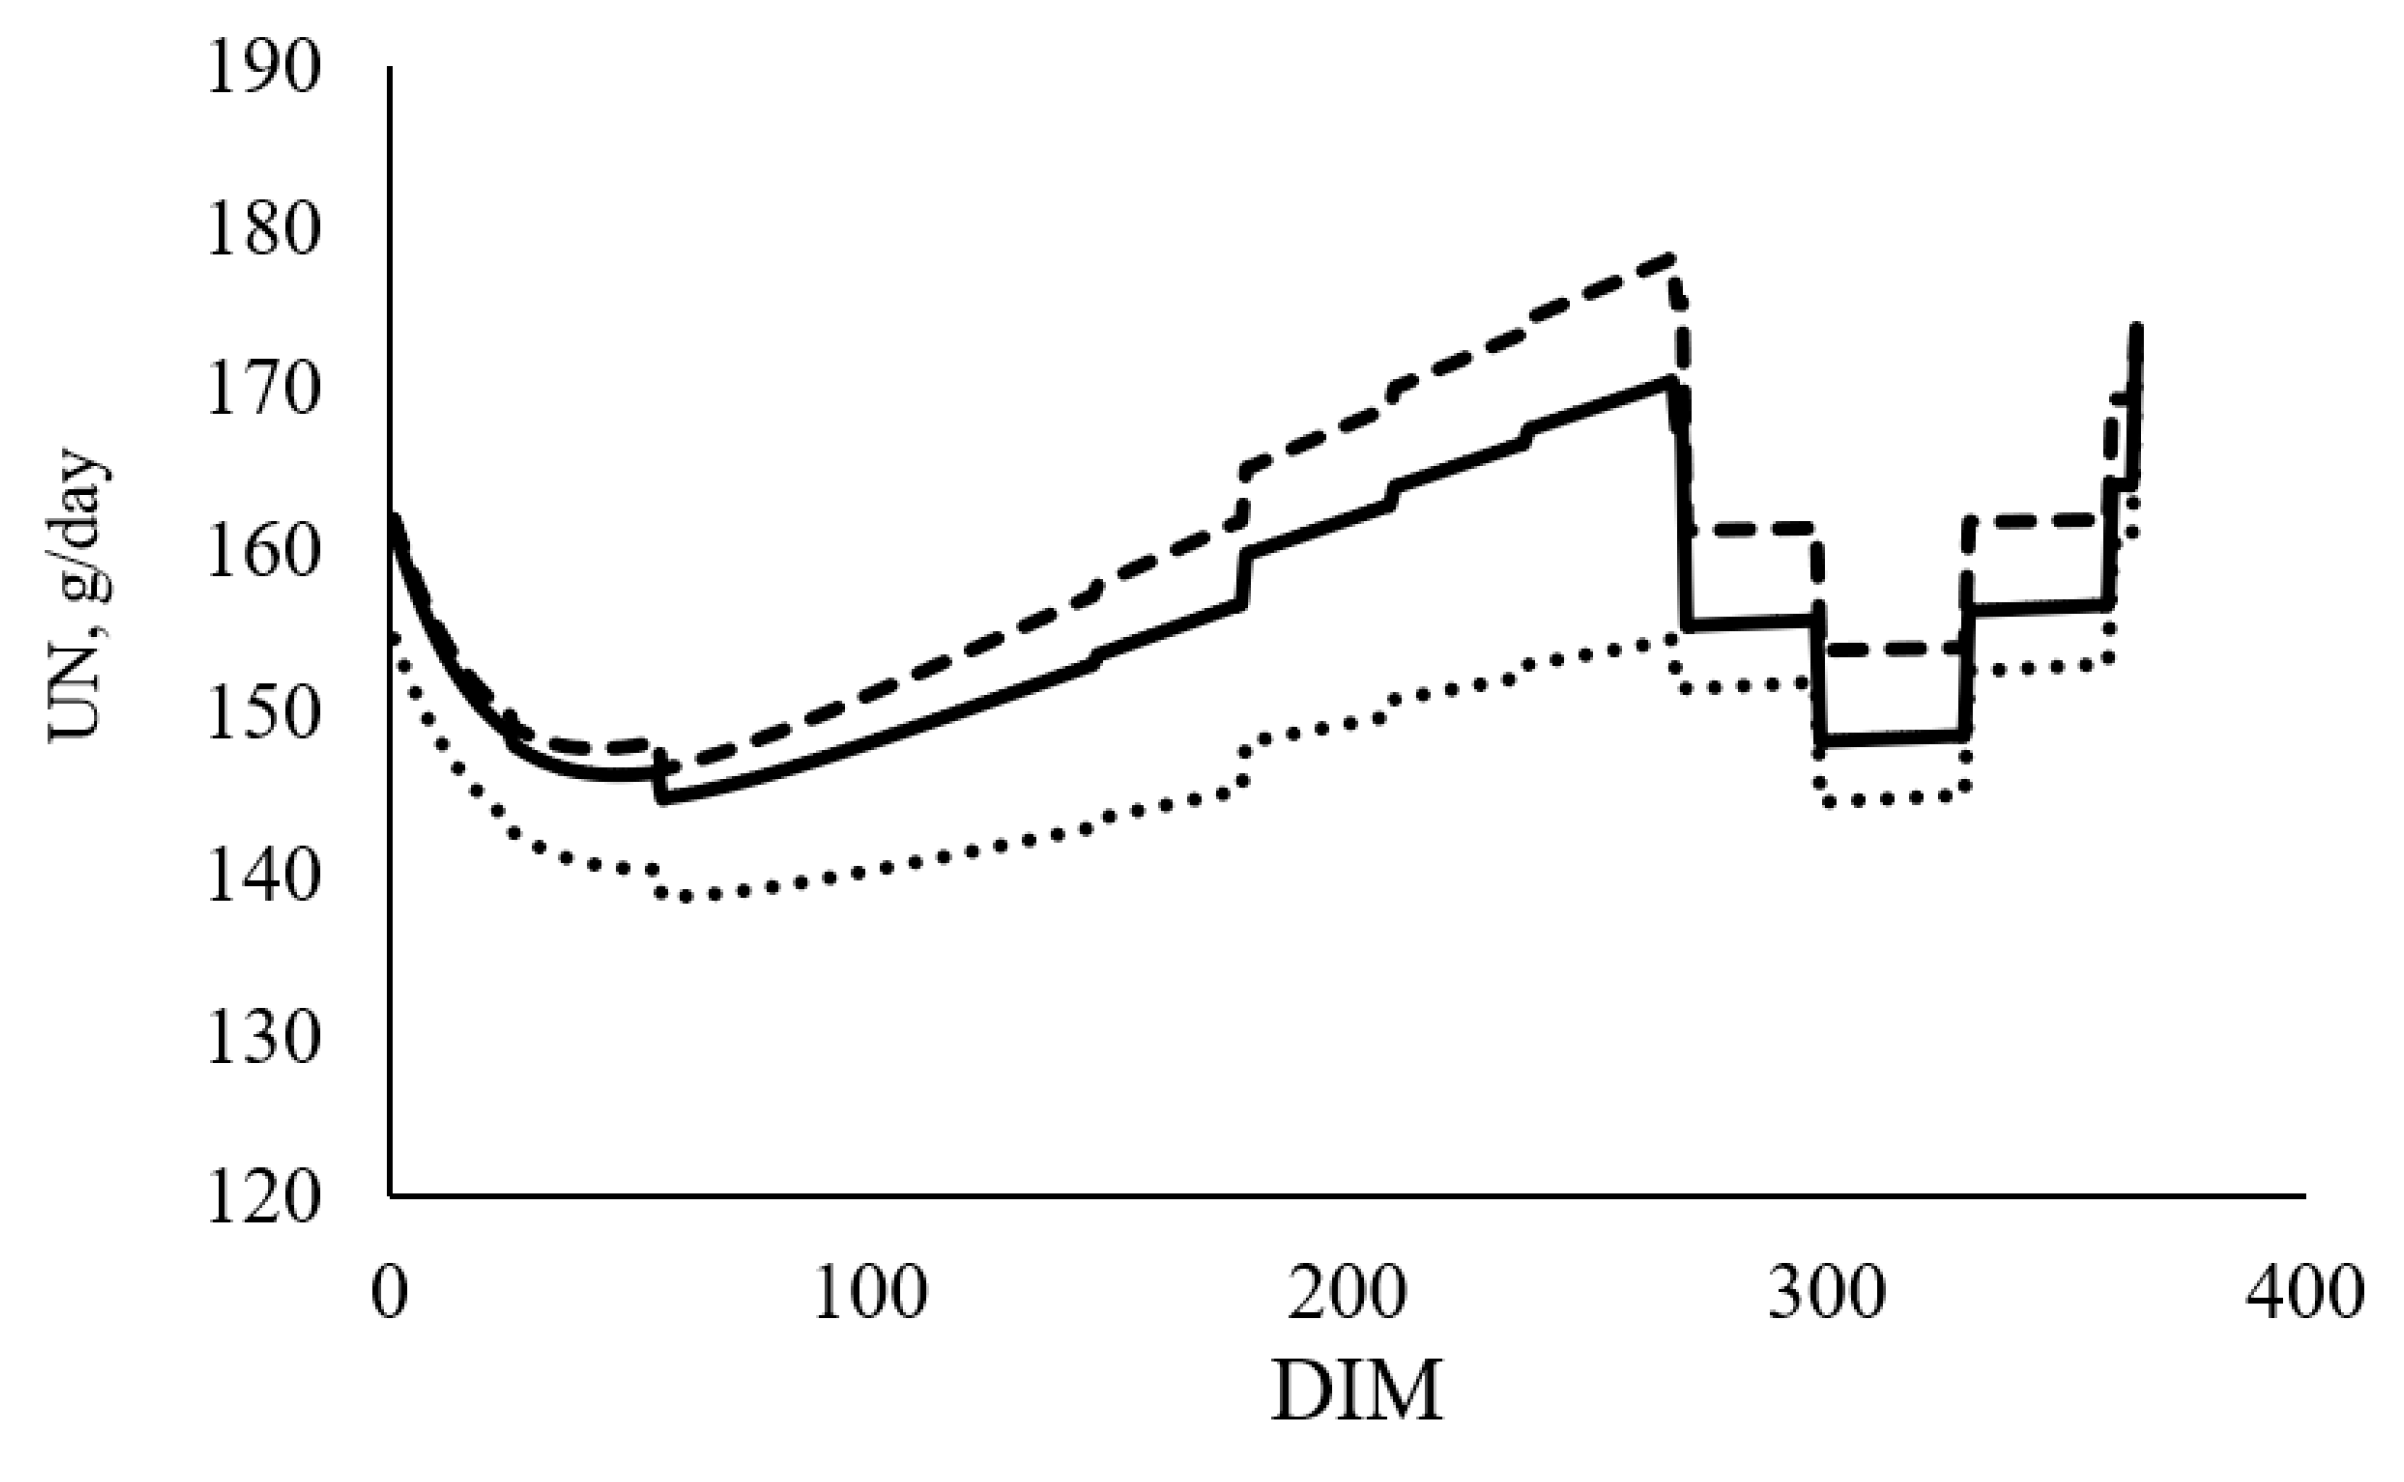
The across lactation average estimates of N allocation among the different N pools (MN, UN, FN) and NUE for cows in the base year and each selection scenario are presented in
Table 6. A greater daily N allocation for MN and FN but lower daily N allocation for UN was predicted in the cow selected under the MUN
−20% (
Figure 2), compared to the base year, whereas the N allocation for all three pools were higher in MUN
+20% scenario compared to the base year. There is only a slight NUE difference between cow selected under MUN
+20% and MUN
−20%. The NUE of cows reduces with increased NI.
4. Discussion
The objective of the current study was to evaluate the effect of including MUN into the New Zealand BW index in order to reduce the UN excretion on a per cow and per hectare basis.
The predicted annual UN excretion per cow of the base year (56.5 kg) in the current study was near the range (74.8–91.6 kg) reported by Box et al. [
40] in pasture-fed New Zealand dairy cows. The annual FN production of New Zealand dairy cows estimated using collected fecal samples in pasture-based feeding trials varies from 41.6 kg [
41] to 48.5 kg [
42] and are comparable with the estimated FN excretion in the base year (56.3 kg/cow/year) of the current study, which was estimated as the balance between the dietary IN and the other N outputs. The simulated annual MN production of the cow in base year in the current study was 26.7 kg and is within the range of MN production of pasture fed New Zealand dairy cows reported by Mackle et al. [
43] (25.1–27.3 kg) and was comparable with values reported by Totty et al. [
44] (27.3–28.1 kg). MPI, 2010 [
45] reported the annual total N excretion per dairy cow in 2007 as 113.6 kg and the total annual N excreted by the New Zealand dairy cattle population (5.26 million) as 598 million kg. The annual total N excretion per cow and across New Zealand total excretion based on the SR and effective hectares for milk production in the 2018/19 production season (over 1.74 million ha) in the base year were 112.8 kg/cow and 586.5 million kg/ha, respectively. The estimated annual NI (142 kg) of the base cow as determined from the predicted DMI of this study is similar to the NI (166 kg) estimated using measured DMI in 24 J and F cows by Mackle et al. [
43]. The estimations of N partitioning among different pools, DMI, NI and excretions of the predicted base cow of the current study appear representative of a New Zealand cow. Therefore, the predicted base cow in this study is an appropriate reference point to compare different selection scenarios.
In this study the genetic response to selection is taken at the asymptotic point. However, after the mating of selected dams and bulls, the new-born calves which are genetically capable of producing less MUN will be included into the age group zero after calving and will not produce milk with less MUN until they calve for the first time at two years of age. This means there will be at least three years of lag with no improvement in milking cow phenotype therefore immediate results cannot be expected through selection.
The correlated responses in FY and CPY predicted for the MUN
0% selection scenario in the current study were comparable with those reported in Sneddon et al. [
45] and Spelman and Garrick, [
38], and the simulated correlated responses for MY and LWT for the MUN
0% were comparable with those reported in Spelman and Garrick, [
38].
Negative selection for MUN was responsible for the greatest reduction in MUN concentration, however, that scenario had unfavorable correlated responses for FY and CPY due to positive correlation of MUN with FY and CPY. That resulted in less improvement of profit compared to the current index, because payment for milk in the New Zealand dairy industry is based on the A + B − C multiple component pricing system, where A and B are the values per kg of fat and protein and C is the penalty on kg of MY [
46]. Selection for increased MUN (MUN
+20%) was responsible for the same milk solid production as the MUN
0%. Since yield of milk solids is highly sensitive to the negative economic value on MUN, selection against MUN should be considered with caution.
The number of milking cows in the 2018–2019 production season was 4.95 million [
31] and if the national herd size remains unchanged, NZD 8.91 million (NZD 1.8 × 4.95) or NZD 6.4 million (NZD 1.3 × 4.95) income loss is expected annually after ten years of selection for the MUN
+20% and MUN
−20%, respectively, compared to the cows selected under MUN
0%. The reduced economic response in MUN
−20% will be caused by reduced genetic gains of FY and CPY which have positive economic values. The increased genetic gains of MY and LWT which have negative economic values are the likely reason for the reduced economic response in MUN
+20%.
Although fertility traits have not been included in the selection index in this study due to unavailability of variance-covariance information, König et al. [
42] reported negative genetic and phenotypic correlations between MUN and 56-day nonreturn rate (phenotypic = −0.08, genetic = −0.13) and 90-day nonreturn rate (phenotypic = −0.10, genetic = −0.12) in German Holstein cows, indicating that cow fertility would be improved if MUN was reduced. However, König et al. [
47] reported that the genetic correlations between MUN and nonreturn rates were too weak to justify the use of MUN as an indicator trait in genetic selection for improved fertility. Therefore, correlations between MUN and reproduction traits need to be estimated for New Zealand dairy cows to define the selection index with production, reproduction, and environmental sustainability traits.
The annual per hectare UN excretion of cows estimated from per cow UN excretion and current SR (2.982) were 168.6 kg in the base year, 164.60 kg in MUN0% (55.2 kg × 2.982), 173.3 kg in MUN+20% (58.1 kg × 2.982), and 158.2 kg in MUN−20% (53.0 kg × 2.982). This would result in an annual per hectare change of UN excretion of -4.0 kg in MUN0%, 4.7 kg in MUN+20%, and −10.4 kg in MUN−20% compared to the base year. However, the cows selected under all the three scenarios had greater production of milk yield and milk solids compared to cows in the base year due to positive correlated responses observed for milk yield and milk solids. This required the selected cows to have a higher DMI and consequently there would be a lower SR than for cows in the base year. The MUN0% and MUN−20% allowed the cows to excrete less UN on a per hectare basis (−10.4 kg and −14.1 kg, respectively) than cows in the base year.
Most of the prediction equations for MUN and UN in the literature were derived under indoor conditions where cows were fed with TMR [
48,
49,
50,
51]. However, under New Zealand outdoor grazing conditions, DMI is controlled at the herd level, allowing individual cows to vary in voluntary feed intake, given the same access to pasture. Accordingly, the IN of cows in the same herd will exhibit variation that contributes to between cow variation in MUN and UN. Milk urea nitrogen is affected by various factors besides genetic makeup, including; level of production, level of protein feeding, and stage of the lactation and therefore, there are subsequent effects of those factors on UN. Given that MUN is a multifactorial trait, the prediction equations containing additional dependent variable other than MUN were used for estimation of UN in the current study, which is combination of equations predicted by Huhtanen et al. [
29] and Reed et al. [
30]. Huhtanen et al. [
29] developed a prediction equation for UN in lactating cows that were fed indoors with forage, concentrates and TMR. In their equation, UN was estimated as a function of DMI, LW, and MUN where, DMI is a representative of both level of production and level of crude protein intake, LWT is a measure of level of production, and MUN is a measure of N partitioning on excretion. Therefore, the estimates of UN in their study was an indirect measure of balance between the IN and utilization and output. In indoor feeding trials, Reed et al. [
30] derived a prediction equation for UN independent to MUN, directly as the balance between N intake, and N utilization and outputs (fecal N, N in milk, retention of N in the body: estimated as a function of liveweight gain or loss). The partitioning of dietary nutrients for different processes is genetically driven [
52] and specific to each animal, therefore, it seems more appropriate to use these equations for estimating UN, as performed in our study, rather than a direct conversion of MUN into UN, as assumed by Beatson et al. [
19].
Cows selected for higher MUN (MUN
+20%) produced higher MUN on a per cow basis and excreted less UN (−3.5 kg) on a per hectare basis due to the reduced SR in comparison to the base scenario. This means that a base year cow with less MUN on a per cow basis (14 mg/dL), excreted more UN (168.6 kg) on a per hectare basis compared to a cow with higher MUN (14.9 mg/dL) on a per cow basis but less UN per ha (165.1 kg). The simulated result of the current study indicates that the increased MUN at per cow basis is not necessarily responsible for reduced UN on a per hectare basis because a lower SR plays an important role in reducing UN on a per hectare basis. A recent New Zealand study [
53] has indicated that there is less opportunity to reduce N leaching by genetic selection for urine traits (total volume of urine per cow per day and average volume per urination) when SR and IN of cows are high. The results from this simulation study, however, contradict the points made by Roche et al. [
20] who indicated that N leaching can be reduced with increased SR with minimum supplementary feeding. The reduced N excretion with increased SR in their study is reasonable due to per cow reduction of DMI hence, reduced involuntary IN of cows whereas, in the current study DMI is increased with increased milk production of cows by reducing the SR which allowed UN to reduce.
Selected cows in all three scenarios excreted higher FN compared to the cows in the base year. These cows also had greater N allocation for MN due to the increased production of CPY compared to the cows of the base year. These simulated results concur with Marshall et al. [
54] who reported that cows with low MUN BV had increased milk protein percentage throughout lactation and FN in late lactation. The higher N allocation for other N pools, apart from urine, is likely be linked with higher involuntary IN associated with higher DMI of genetically improved cows. However, the increased FN allocation of improved cows made cows selected in all three scenarios equivalent in terms of the total N excreted, despite the relative emphasis and direction of selection for MUN.
The simulated daily reduction of UN as reported by Beatson et al. [
19] was 18 g/cow per year of selection in the progeny of the low MUN breeding value (BV = −2.4) bulls compared to the progeny of bulls with MUN BV = 0. Low MUN cows had a mean phenotype of 14.0 mg MUN/dl (New Zealand average) for MUN. This reduction in UN corresponds to an annual reduction of 6.6 kg/cow and that estimate is supported by the study of Marshall et al. [
54] using measured urinary urea N excretions in 58 multiparous, lactating Holstein-Friesian cows. Beatson et al. [
19] calculated that this reduction in UN excretion corresponded to an annual reduction of 42 million kg N from the 6.5 million dairy animals farmed across New Zealand from already published prediction equations for estimating UN based on MUN. According to the estimates in this study, the correlated response of MUN after ten years of selection in the negative scenario (MUN
−20%), and using a combination of prediction equations of Huhtanen et al. [
29] and Reed et al. [
30], there would only be a reduction of 17.3 million kg of UN over the 4.95 million of milking cows (3.5 kg/cow/ten years × 4.95 million cows). Following the same assumptions, MUN was predicted in the current study after ten years of selection under MUN
+20%, reporting 7.9 m kg (1.6 kg/cow/ten years × 4.95 million cows) of increase in UN excretion. Difference in UN excretion estimates between Beatson et al. [
19] and this study is likely due to differnce in prediction equations used.
There is a positive relationship between IN and UN outputs in New Zealand dairy cows [
42,
42]. New Zealand pasture on average contains around 200 g of CP/kg DM (20%) [
55] but, is even richer in CP (265 g/kg DM = 26.5%) during the spring [
56]. The current study evaluated the possible improvement of UN excretion using a progeny test-based selection scheme under typical New Zealand feeding management, where cows fed on diets containing CP ranging from 190 to 240 g/kg DM, and assuming a positive relationship between MUN and UN. On the contrary, a recent study conducted based on German Holsteins revealed that the relationship between MUN and UN was positive only if the cows were fed with low CP diets (13.8%) while it was negative for normal CP (15.9%) diets [
57]. This finding suggests that for New Zealand cows which consume such great CP %, they are less likely to reduce UN through genetic selection for reduced MUN, which means that diet management is the likely best alternative to control UN excretion and carbon footprint.
Some authors have reported a negative relationship between MUN and NUE [
57] and a negative relationship between NUE and IN [
18,
58]. Therefore, it is plausible that by including MUN into the selection index with a negative economic value that the correlated response of MUN would result in cows with improved NUE. Although NUE increased in the MUN
−20%, at reduced NI in the current study, the level of production including volume and milk constituents were also reduced compared to cows selected under the MUN
0%. The reduction of milk and milk constituent yields are explained by the strong positive genetic correlations between yields of milk constituents and milk volume [
39,
59] and positive genetic correlation between MUN and volume of milk [
19,
38]. This attenuation of milk constituent production is not desirable in terms of farm profitability, because price of milk in New Zealand is a function of milk constituents.
Considering the overall economic impact to the New Zealand dairy industry, neither the negative (MUN−20%) nor the positive (MUN+20%) selection scenarios were favorable compared to the MUN0%, owing to the reduced production of milk constituents and increased MY and LWT, respectively. However, the economic value of MUN was not considered when estimating the overall economic responses under the selection scenarios due to uncertainty of the true economic value for MUN.
Aggregate breeding values in the current selection scheme for the genetic improvement of New Zealand dairy cattle combines genomic, performance and pedigree information of animals for all traits. Schefers and Weigel, [
60] documented the advantages of including genomic selection as a selection strategy and demonstrated that the genetic change per year with genomic selection is double that of the genetic change per year achieved through a conventional progeny test selection scheme. However, setting up the P and G matrices for a combined breeding goal comprised of multiple traits, considering the covariance between performance records and genotypes for all the traits is complex [
61] and relies on many assumptions, and so this approach was not investigated in the current study. Instead, standard selection index theory [
62] based on a conventional progeny test was simulated to determine responses to various selection indices including MUN. Although the correlated response might have been improved if genotypic information were incorporated due to the reduced generation interval, the direction of response to selection is unlikely to change as it depends on genetic variation of the trait and the genetic correlation with other traits in the index [
63].


 ,
, 


