
Genetic Parameters of Effort and Recovery in Sport Horses Assessed with Infrared Thermography

 ,
,  ,
,
Abstract
:Simple Summary
Abstract
1. Introduction
2. Materials and Methods
2.1. Animals
2.2. Study Design
2.3. Physiological Data
2.4. Statistical Analyses
2.5. Genetic Model and Genetic Parameters’ Estimation
2.6. Ethic Statement
3. Results
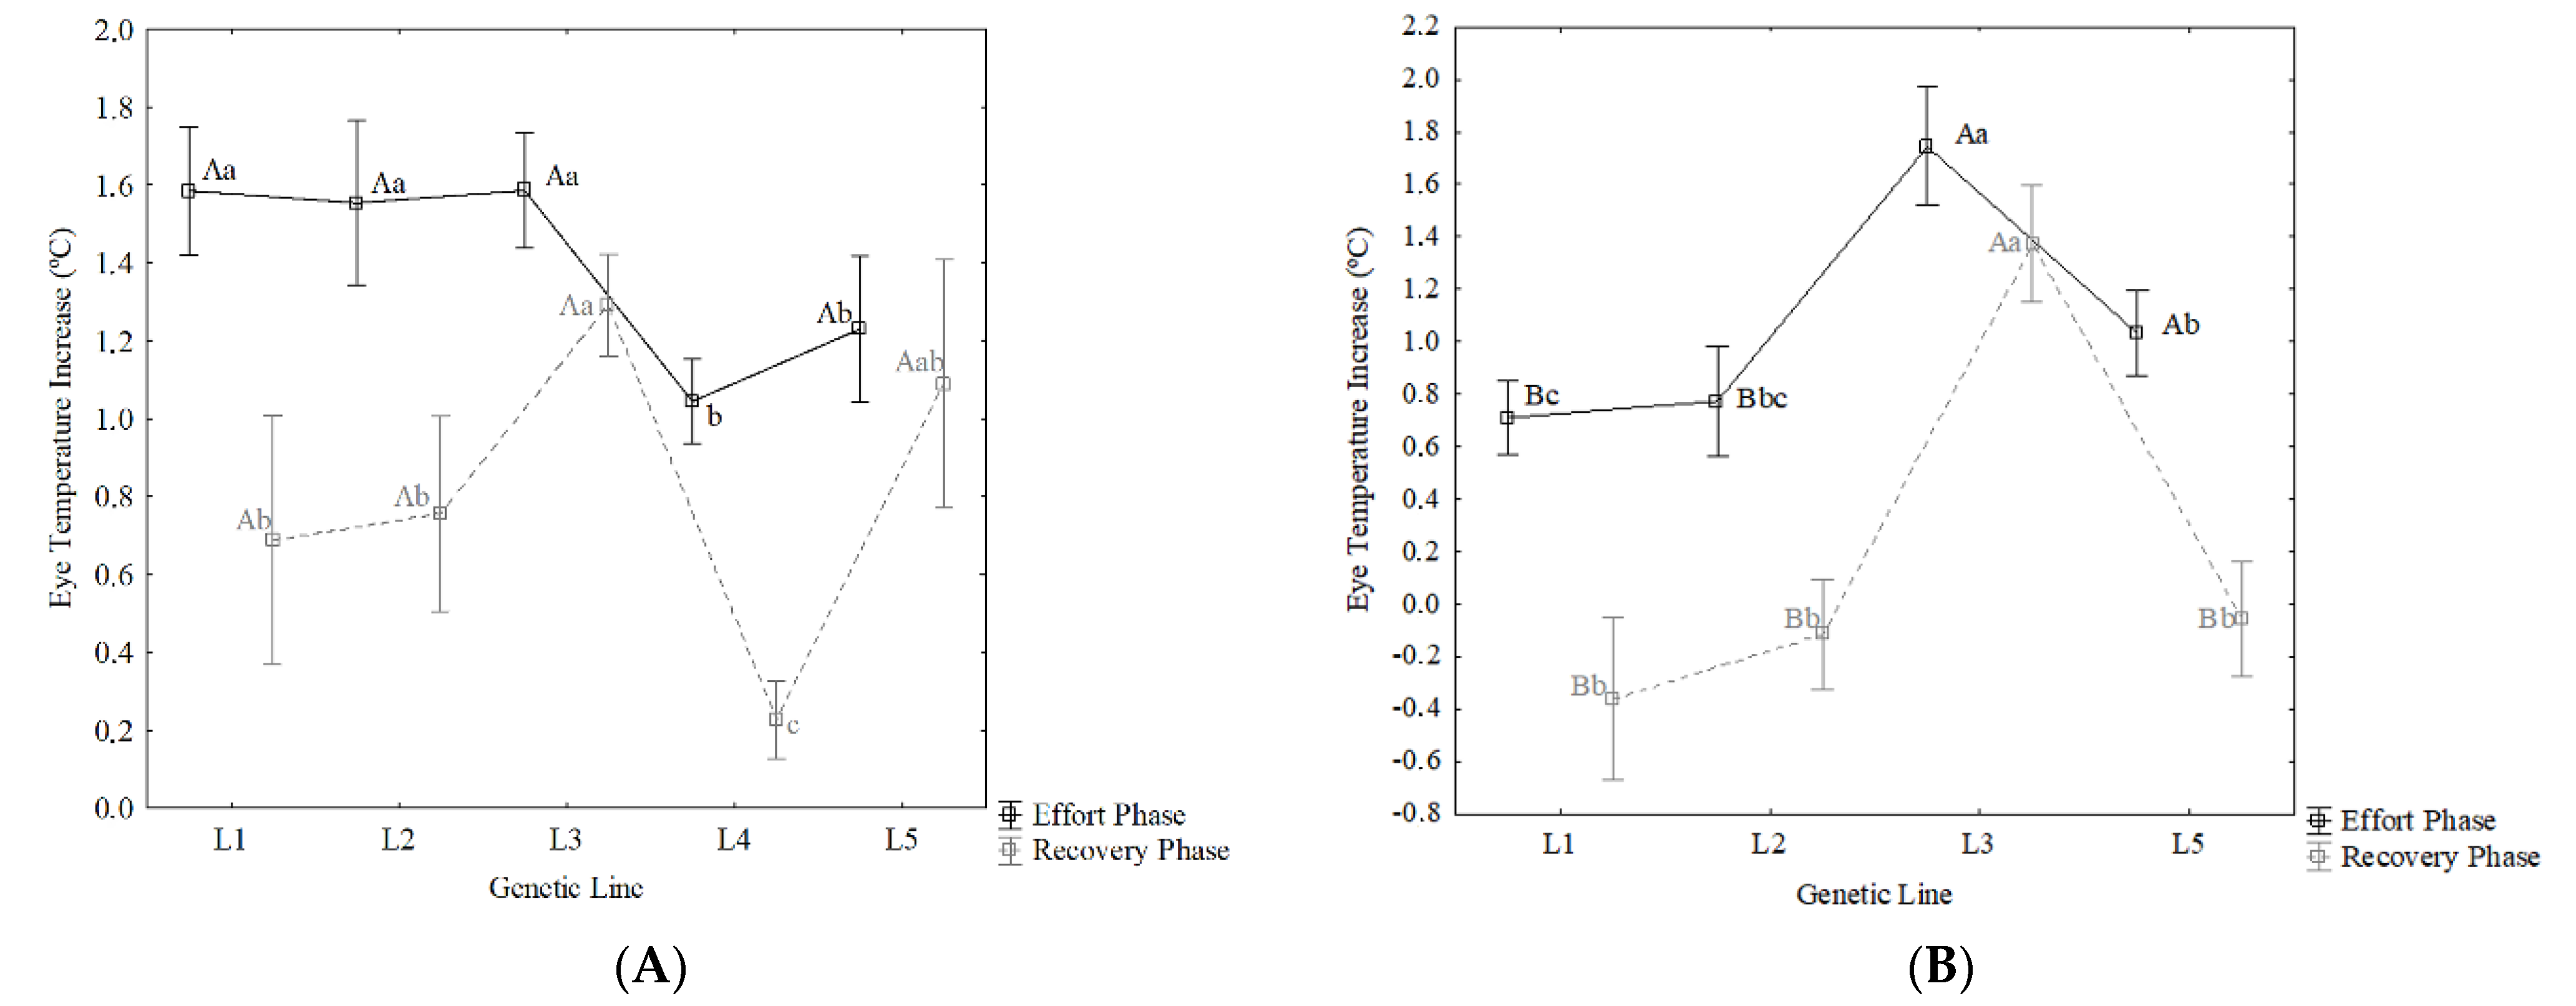
3.1. Influence of Sex and Genetic Line of Effort and Recovery
3.2. Phenotypic Correlations between Effort and Recovery
3.3. Genetic Parameters
4. Discussion
5. Conclusions
Author Contributions
Funding
Institutional Review Board Statement
Acknowledgments
Conflicts of Interest
References
- Moberg, G.P. Biological response to stress: Implications for animal welfare. In The Biology of Animal Stress: Basic Principles and Implications for Animal Welfare; CABI Publishing: Wallingford, UK, 2009; pp. 1–21. [Google Scholar]
- Pösö, A.R.; Hyyppä, S.; Geor, R.J. Metabolic responses to exercise and training. In Equine Exercise Physiology; Elsevier: Amsterdam, The Netherlands, 2008; pp. 248–273. [Google Scholar]
- Witkowska-Piłaszewicz, O.; Grzędzicka, J.; Seń, J.; Czopowicz, M.; Żmigrodzka, M.; Winnicka, A.; Cywińska, A.; Carter, C. Stress response after race and endurance training sessions and competitions in Arabian horses. Prev. Vet. Med. 2021, 188, 105265. [Google Scholar] [CrossRef] [PubMed]
- Evans, D.L. Physiology of equine performance and associated tests of function. Equine Vet. J. 2007, 39, 373–383. [Google Scholar] [CrossRef] [PubMed]
- Bitschnau, C.; Wiestner, T.; Trachsel, D.S.; Auer, J.A.; Weishaupt, M.A. Performance parameters and post exercise heart rate recovery in Warmblood sports horses of different performance levels. Equine Vet. J. 2010, 42, 17–22. [Google Scholar] [CrossRef] [PubMed]
- Gardela, J.; Carbajal, A.; Tallo-Parra, O.; Olvera-Maneu, S.; Álvarez-Rodríguez, M.; Jose-Cunilleras, E.; López-Béjar, M. Temporary Relocation during Rest Periods: Relocation Stress and Other Factors Influence Hair Cortisol Concentrations in Horses. Animals 2020, 10, 642. [Google Scholar] [CrossRef] [PubMed] [Green Version]
- Janczarek, I.; Bereznowski, A.; Strzelec, K. The influence of selected factors and sport results of endurance horses on their saliva cortisol concentration. Pol. J. Vet. Sci. 2013, 16, 533–541. [Google Scholar] [CrossRef] [PubMed] [Green Version]
- Kędzierski, W.; Cywińska, A.; Strzelec, K.; Kowalik, S. Changes in salivary and plasma cortisol levels in Purebred Arabian horses during race training session. Anim. Sci. J. 2013, 85, 313–317. [Google Scholar] [CrossRef]
- Witkowska-Piłaszewicz, O.; Pingwara, R.; Winnicka, A. The Effect of Physical Training on Peripheral Blood Mononuclear Cell Ex Vivo Proliferation, Differentiation, Activity, and Reactive Oxygen Species Production in Racehorses. Antioxidants 2020, 9, 1155. [Google Scholar] [CrossRef]
- Cappelli, K.; Mecocci, S.; Gioiosa, S.; Giontella, A.; Silvestrelli, M.; Cherchi, R.; Valentini, A.; Chillemi, G.; Capomaccio, S. Gallop Racing Shifts Mature mRNA towards Introns: Does Exercise-Induced Stress Enhance Genome Plasticity? Genes 2020, 11, 410. [Google Scholar] [CrossRef] [Green Version]
- Won-Seob, K.; Jalil, G.N.; Sang-Gun, R.; Hong-Gu, L. Heat-shock proteins gene expression in peripheral blood mononuclear cells as an indicator of heat stress in beef calves. Animals 2020, 10, 895. [Google Scholar]
- Cook, N.J.; Schaefer, A.L.; Warren, L.; Burwash, L.; Anderson, M.; Baron, V. Adrenocortical and metabolic responses to ACTH injection in horses: An assessment by salivary cortisol and infrared thermography of the eye. Can. J. Anim. Sci. 2001, 81, 621. [Google Scholar]
- Valera, M.; Bartolomé, E.; Sánchez, M.J.; Molina, A.; Cook, N.; Schaefer, A.L. Changes in Eye Temperature and Stress As-sessment in Horses During Show Jumping Competitions. J. Equine Vet. Sci. 2012, 32, 827–830. [Google Scholar] [CrossRef]
- Witkowska-Pilaszewicz, O.; Masko, M.; Domino, M.; Winnicka, A. Infrared Thermography correlates with lactate concentra-tion in blood during race training in horses. Animals 2020, 10, 2072. [Google Scholar] [CrossRef]
- Stewart, M.; Webster, J.; Verkerk, G.; Schaefer, A.; Colyn, J.; Stafford, K. Non-invasive measurement of stress in dairy cows using infrared thermography. Physiol. Behav. 2007, 92, 520–525. [Google Scholar] [CrossRef] [PubMed]
- Marlin, D.; Nankervis, K. Equine Exercise Physiology; Blackwell Publishing: Hoboken, NJ, USA, 2002. [Google Scholar]
- Bartolomé, E.; Sánchez, M.J.; Molina, A.; Schaefer, A.L.; Cervantes, I.; Valera, M. Using eye temperature and heart rate for stress assessment in young horses competing in jumping competitions and its possible influence on sport performance. Animals 2013, 7, 2044–2053. [Google Scholar] [CrossRef] [PubMed]
- Sánchez, M.J.; Bartolomé, E.; Valera, M. Genetic study of stress assessed with infrared thermography during dressage competitions in the Pura Raza Español horse. Appl. Anim. Behav. Sci. 2016, 174, 58–65. [Google Scholar] [CrossRef]
- Bartolome, E.; Cervantes, I.; Valera, M.; Gutiérrez, J. Influence of foreign breeds on the genetic structure of the Spanish Sport Horse population. Livest. Sci. 2011, 142, 70–79. [Google Scholar] [CrossRef]
- Clark, J.D.; Rager, D.R.; Calpin, J.P. Animal well-being. IV. Specific assessment criteria. Lab. Anim. Sci. 1997, 47, 586–597. [Google Scholar]
- Lloyd, A.S.; Martin, J.E.; Bornett-Gauci, H.L.I.; Wilkinson, R.G. Horse personality: Variation between breeds. Appl. Anim. Behav. Sci. 2008, 112, 369–383. [Google Scholar] [CrossRef]
- Royal Spanish Equestrian Federation (RFHE). Galopes Program. 2018. Available online: http://www.rfhe.com (accessed on 20 March 2019).
- Legarra, A.; Varona, L.; López de Maturana, E. TM: Threshold Model. 2008. Available online: http://snp.toulouse.inra.fr/~alegarra (accessed on 10 July 2019).
- Desmecht, D.; Linden, A.; Amory, H.; Art, T.; Lekeux, P. Relationship of plasma lactate production to cortisol release following completion of different types of sporting events in horses. Vet. Res. Commun. 1996, 20, 371–379. [Google Scholar] [CrossRef]
- Negro, S.; Bartolomé, E.; Molina, A.; Solé, M.; Gómez, M.D.; Valera, M. Stress level effects on sport performance during trotting races in Spanish Trotter Horses. Res. Vet. Sci. 2018, 118, 86–90. [Google Scholar] [CrossRef]
- Bartolomé, E.; Cockram, M.S. Potential Effects of Stress on the Performance of Sport Horses. J. Equine Vet. Sci. 2016, 40, 84–93. [Google Scholar] [CrossRef]
- Thiruvenkadan, A.; Kandasamy, N.; Panneerselvam, S. Inheritance of racing performance of trotter horses: An overview. Livest. Sci. 2009, 124, 163–181. [Google Scholar] [CrossRef]
- Halliday, E.; Willmott, B.; Randle, H. Physiological measures of fitness of riders and non-riders. J. Vet. Behav. 2011, 6, 300–301. [Google Scholar] [CrossRef]
- Sarzynski, M.A.; Loos, R.J.F.; Lucia, A.; Pérusse, L.; Roth, S.M.; Wolfarth, B.; Rankinen, T.; Bouchard, C. Advances in Exercise, Fitness, and Performance Genomics in 2015. Med. Sci. Sports Exerc. 2016, 48, 1906–1916. [Google Scholar] [CrossRef]
- Whitton, R.C.; Walmsley, E.A.; Wong, A.S.M.; Sahnnon, S.M.; Frazer, E.J.; Williams, N.J.; Guerow, J.F.; Hitchens, P.L. Asso-ciations between pre-injury racing history and tibial and humeral fractures in Australian Thoroughbred racehorses. Vet. J. 2019, 247, 44–49. [Google Scholar] [CrossRef]
- Hausberger, M.; Bruderer, C.; Le Scolan, N.; Pierre, J.S. Interplay between environmental and genetic factors in tempera-ment/personality traits in horses (Equus caballus). J. Comp. Psych. 2004, 118, 434–446. [Google Scholar] [CrossRef] [PubMed]
- Verkade, M.E.; Back, W.; Birch, H.L. Equine digital tendons show breed-specific differences in their mechanical properties that may relate to athletic ability and predisposition to injury. Equine Vet. J. 2019, 52, 320–325. [Google Scholar] [CrossRef] [PubMed] [Green Version]
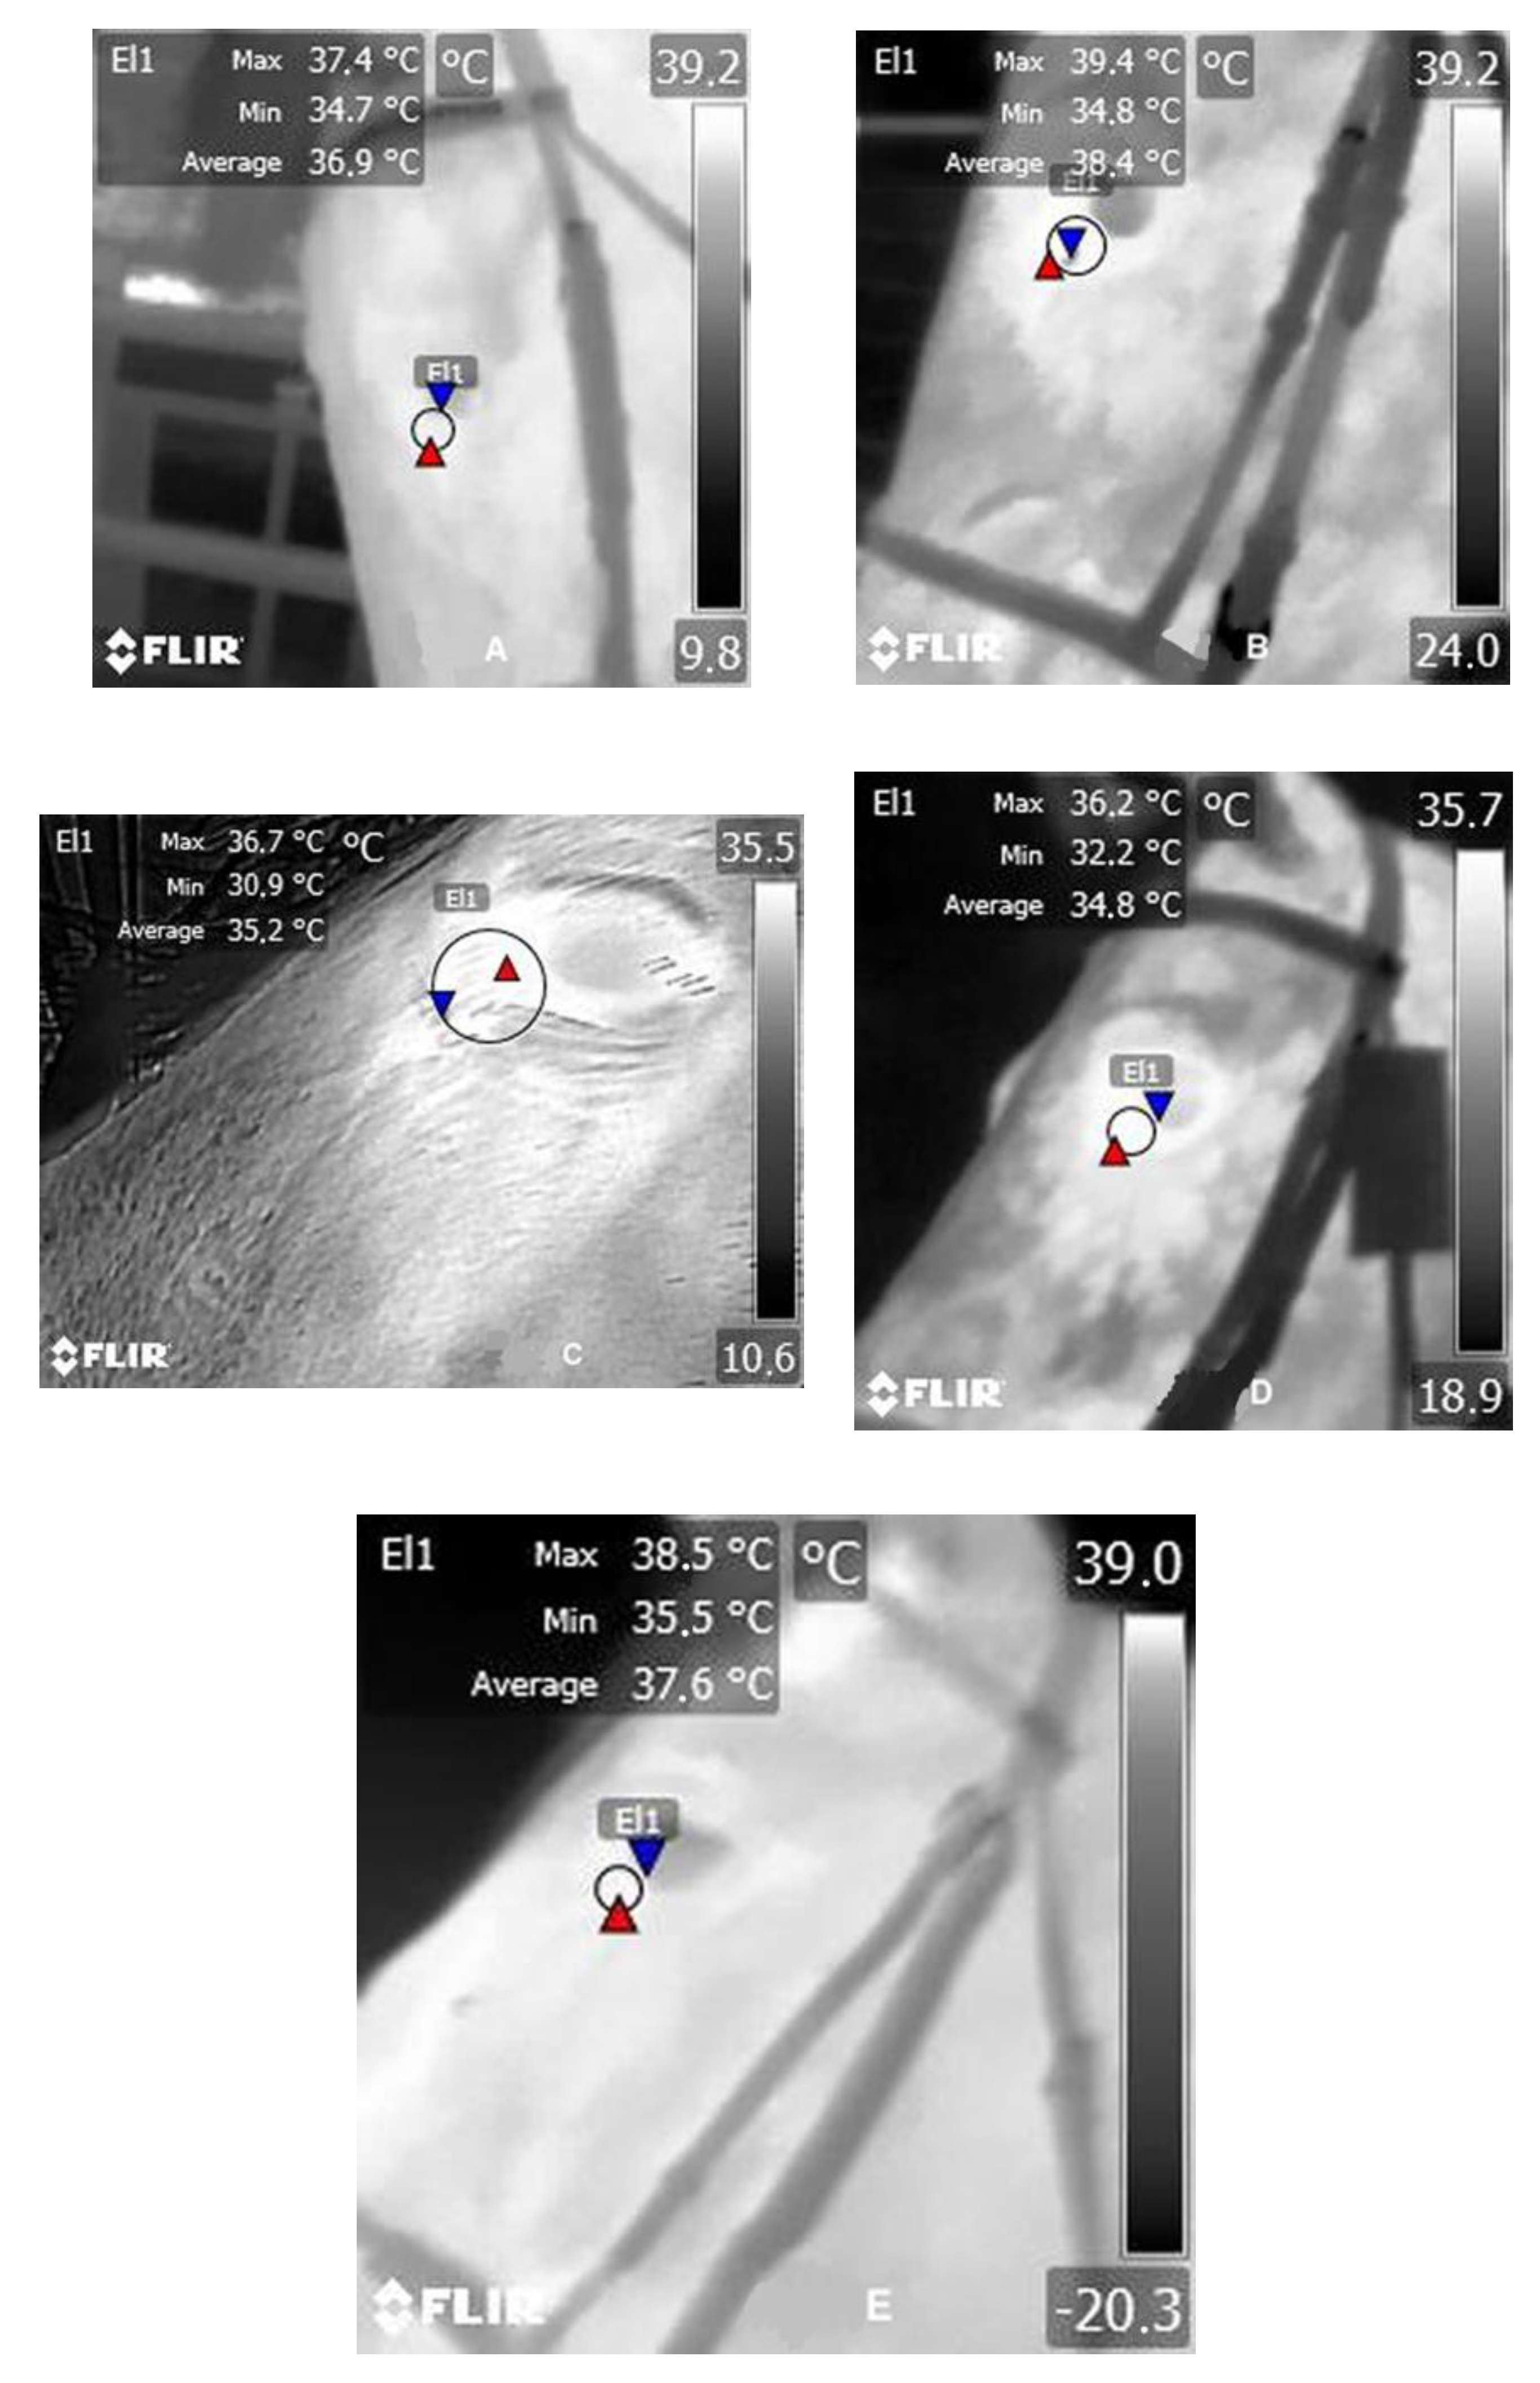
 indicates the maximum temperature point; and
  indicates the minimum temperature point.
indicates the maximum temperature point; and indicates the minimum temperature point.
indicates the minimum temperature point.
indicates the maximum temperature point; and indicates the minimum temperature point.


| Genetic Line | Name | Description | N (%) |
|---|---|---|---|
| L1 | German | More than 50% of the CDE ancestors belonged to German horse breeds: Holsteiner, Hanoverian, Westphalian, Oldenburger, or Trakehner. | 72 (14.6%) |
| L2 | Thoroughbred | More than 50% of the CDE ancestors belonged to Thoroughbred breed. | 75 (15.2%) |
| L3 | Trotter | More than 50% of the CDE ancestors belonged to trotter horse breeds | 142 (28.9%) |
| L4 | Pura Raza Española | More than 50% of the CDE ancestors belonged to Pura Raza Española breed | 124 (24.9%) |
| L5 | Other Breeds | Included CDE horses with more than 50% of their ancestors from other sport horse breeds (KWPN, Zangersheide, etc.) and CDE horses with less than 50% of their ancestors from the already classified breeds (TR, PRE, TH or GE). | 82 (16.7%) |
| EP | RP | |||||
|---|---|---|---|---|---|---|
| Direct | Intra-Class | Direct | Intra-Class | |||
| Sex | Genetic Line | Sex | Genetic Line | |||
| RANK | −0.16 (±0.044) * | S: −0.10 (±0.045) n.s. M: −0.34 (±0.042) * | L1: −0.46 (±0.040) * L2: −0.45 (±0.040) * L3: −0.11 (±0.045) n.s. L4: −0.02 (±0.045) n.s. L5: −0.13 (±0.045) n.s. | −0.14 (±0.045) * | S: 0.06 (±0.045) n.s. M: −0.32 (±0.043) * | L1: −0.29 (±0.043) n.s. L2: −0.05 (±0.045) n.s. L3: −0.01 (±0.045) n.s. L4: −0.08 (±0.045) n.s. L5: −0.05 (±0.045) n.s. |
| RP | 0.53 (±0.38) * | S: 0.46 (±0.040) * M: 0.65 (±0.034) * | L1: 0.82 (±0.026) * L2: 0.63 (±0.035) * L3: 0.53 (±0.038) * L4: 0.41 (±0.041) * L5: 0.28 (±0.043) n.s. | |||
| Vp | h2 (±s.d.) | Vr (±s.d.) | Vrh (±s.d.) | Vres (±s.d.) | rg | |
|---|---|---|---|---|---|---|
| EP | 1.010 | 0.26 ± 0.158 | 0.15 ± 0.096 | 0.37 ± 0.203 | 0.21 ± 0.096 | 0.232 |
| RP | 0.918 | 0.52 ± 0.073 | 0.15 ± 0.057 | 0.33 ± 0.080 | 0.01 ± 0.003 |
Publisher’s Note: MDPI stays neutral with regard to jurisdictional claims in published maps and institutional affiliations. |
© 2021 by the authors. Licensee MDPI, Basel, Switzerland. This article is an open access article distributed under the terms and conditions of the Creative Commons Attribution (CC BY) license (http://creativecommons.org/licenses/by/4.0/).
Share and Cite
Bartolomé, E.; Perdomo-González, D.I.; Sánchez-Guerrero, M.J.; Valera, M. Genetic Parameters of Effort and Recovery in Sport Horses Assessed with Infrared Thermography. Animals 2021, 11, 832. https://doi.org/10.3390/ani11030832
Bartolomé E, Perdomo-González DI, Sánchez-Guerrero MJ, Valera M. Genetic Parameters of Effort and Recovery in Sport Horses Assessed with Infrared Thermography. Animals. 2021; 11(3):832. https://doi.org/10.3390/ani11030832
Chicago/Turabian StyleBartolomé, Ester, Davinia Isabel Perdomo-González, María José Sánchez-Guerrero, and Mercedes Valera. 2021. "Genetic Parameters of Effort and Recovery in Sport Horses Assessed with Infrared Thermography" Animals 11, no. 3: 832. https://doi.org/10.3390/ani11030832