
A Prospective Study of Training Methods for Two-Year-Old Thoroughbred Racehorses in Queensland, Australia, and Analysis of the Differences in Training Methods between Trainers of Varying Stable Sizes

 ,
,  , ,
, ,
Abstract
:Simple Summary
Abstract
1. Introduction
2. Materials and Methods
2.1. Recruitment of Participants
2.2. Study Design
2.3. Data Collection
2.3.1. Classification of Trainers
2.3.2. Two-Year-Old Horses
2.3.3. General Racing and Training History
2.3.4. Detailed Daily Exercise Data
- Walking was defined as when horses were only exercised on the walking machine or walked by hand. This did not incorporate those horses undertaking warm-up exercise on the walker prior to exercise on the racetrack, nor those that were exercised on the walker in the afternoon in addition to their morning exercise at the racetrack.
- Water-walkers are defined as walking machines in a shallow swimming pool, with the water up to approximately the level of the horses’ chest.
- Swimming was defined as exercise in a swimming pool
- Treadmills are defined as stationary exercise machines with continuous belts that facilitate exercise at low or high speeds with or without an incline.
- The number of days and the distances (furlongs) of high-speed exercise were also recorded.
- Three-quarter pace: defined as 15 s/furlong (13 m/s; 800 m/min; 48 km/h)
- Track gallop: gallop exercise performed during track-work, defined as faster than 13 s/furlong (15 m/s; 900 m/min; 55 km/h)
- Jump-outs (non-official trials)
- Official trials
- Races (official trial and race data were cross-checked with the RA public database [81]).
2.3.5. Total and Average Cumulative Days and Distances
2.3.6. Categories of Preparations and Trials
2.4. Data Analysis
3. Results
3.1. General Training Characteristics
3.2. Low-Speed Exercise
3.3. Non-Ridden Exercise
3.4. High-Speed Exercise
3.4.1. Total Cumulative Days
3.4.2. Total Cumulative Distance (furlongs, 200 m)
3.5. Reached Training and Racing Milestones
3.6. Time to Reach Training and Racing Milestones
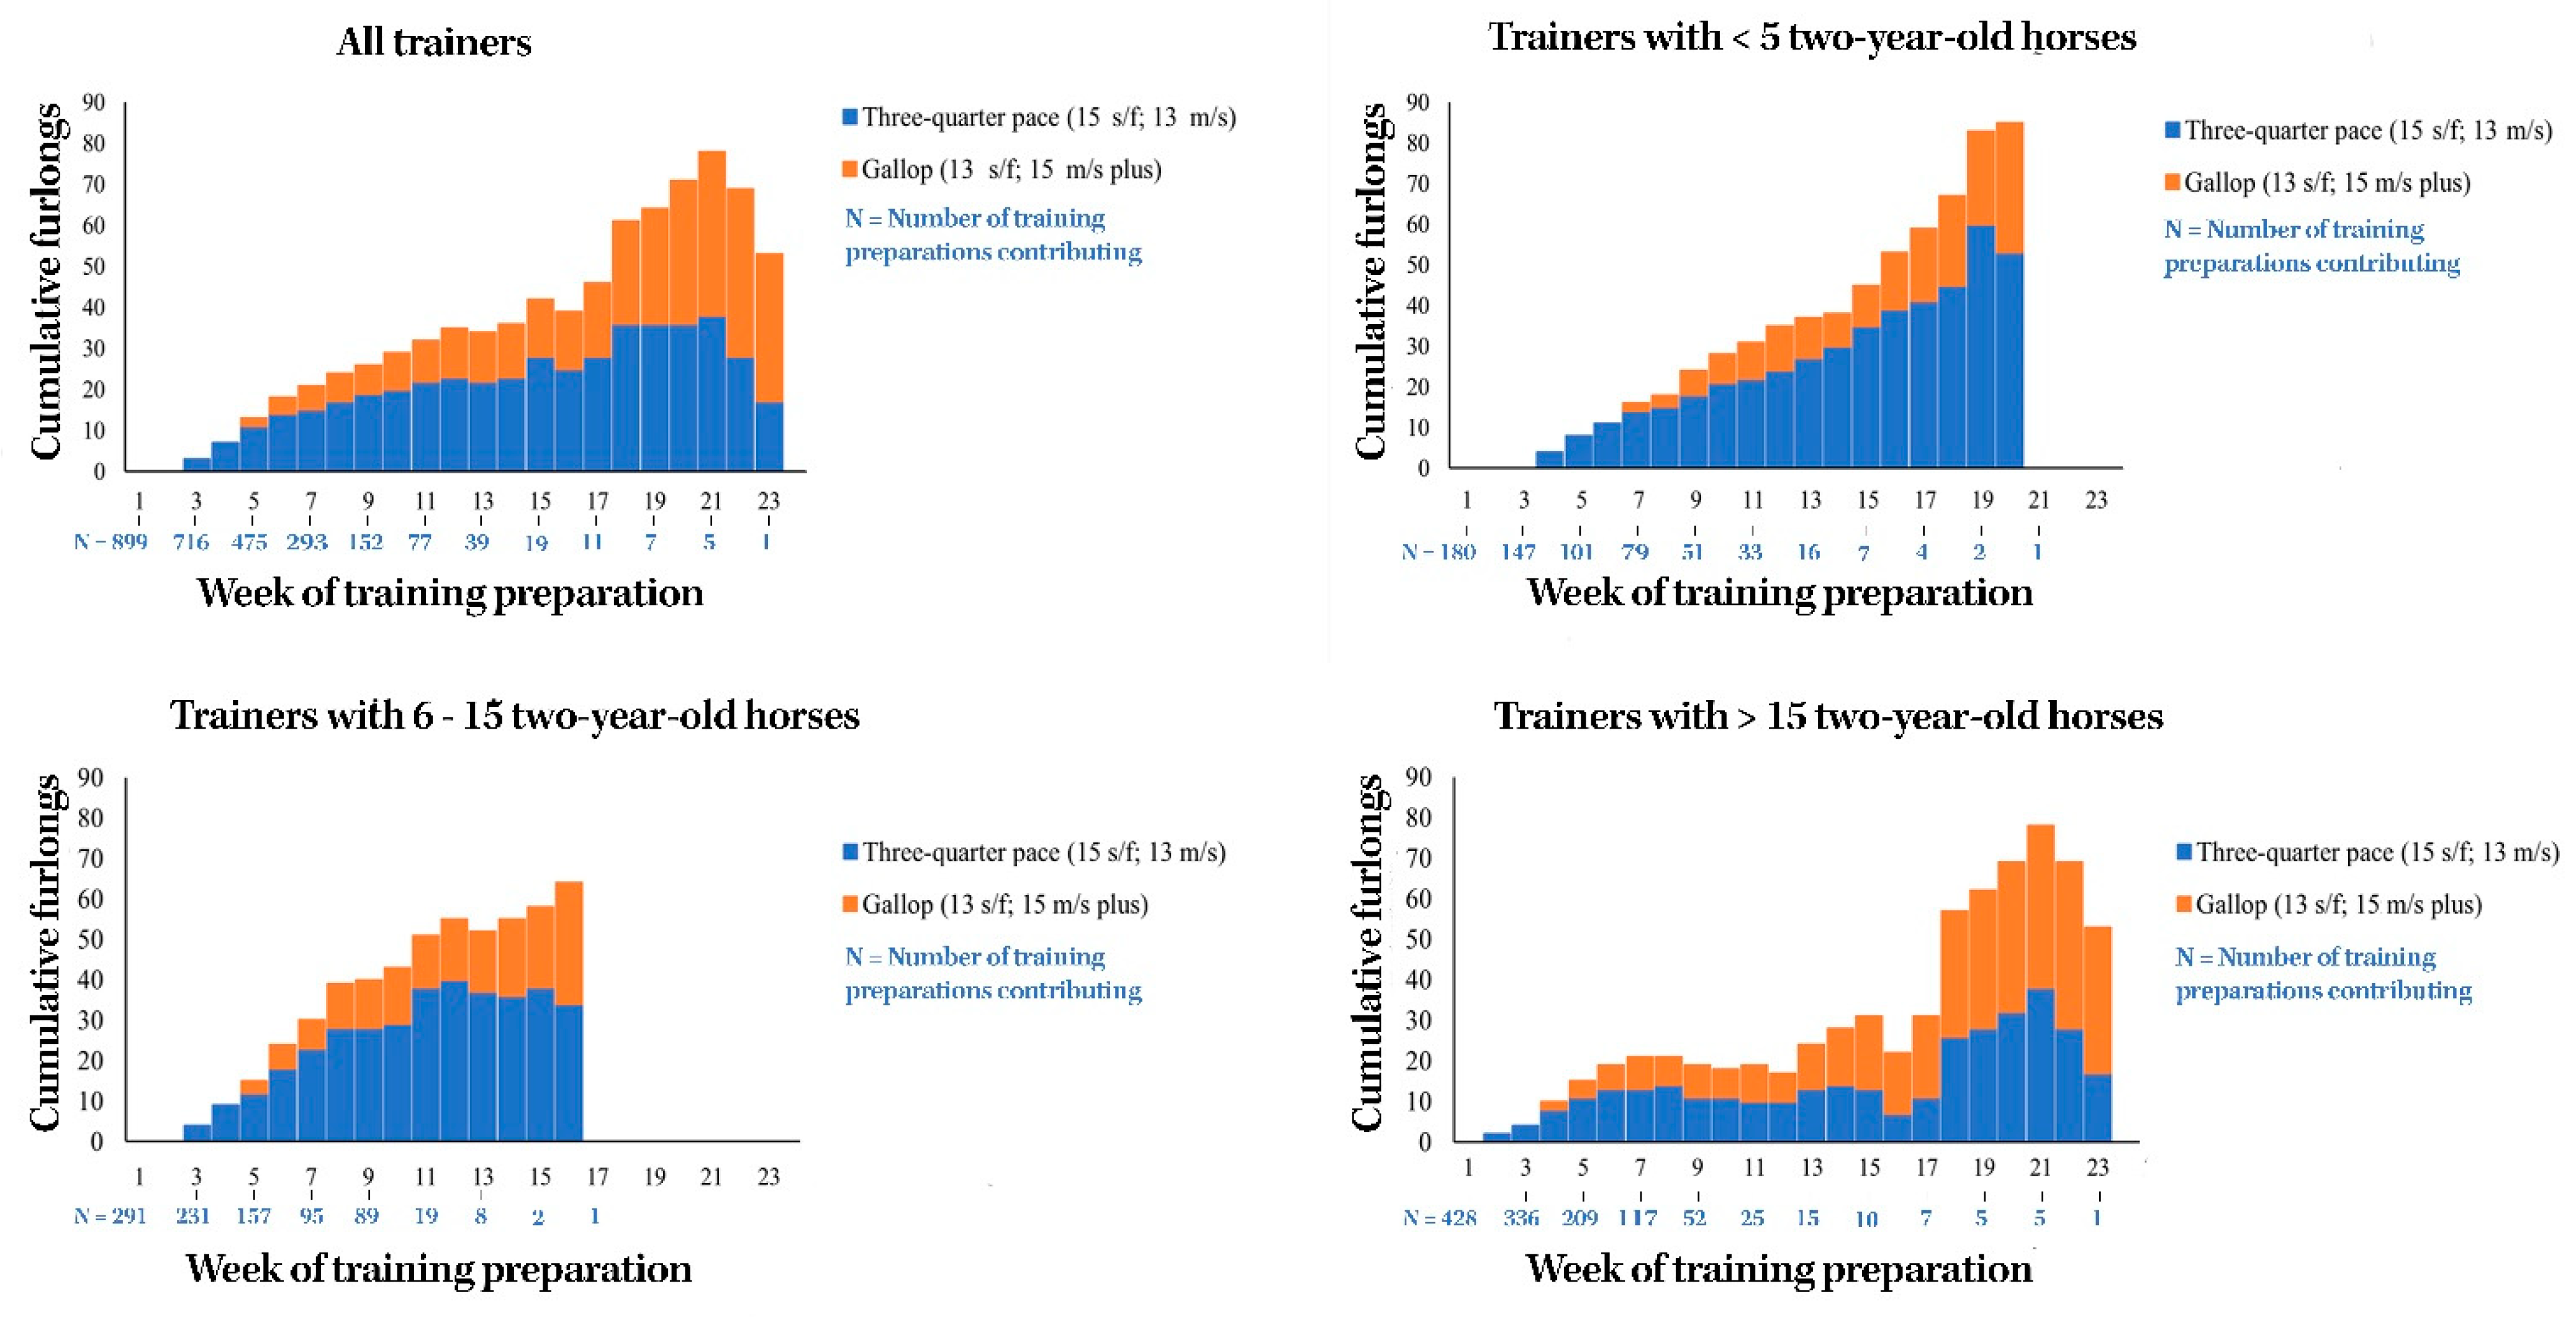
3.7. Median Cumulative Weekly Training Volume to First Trial
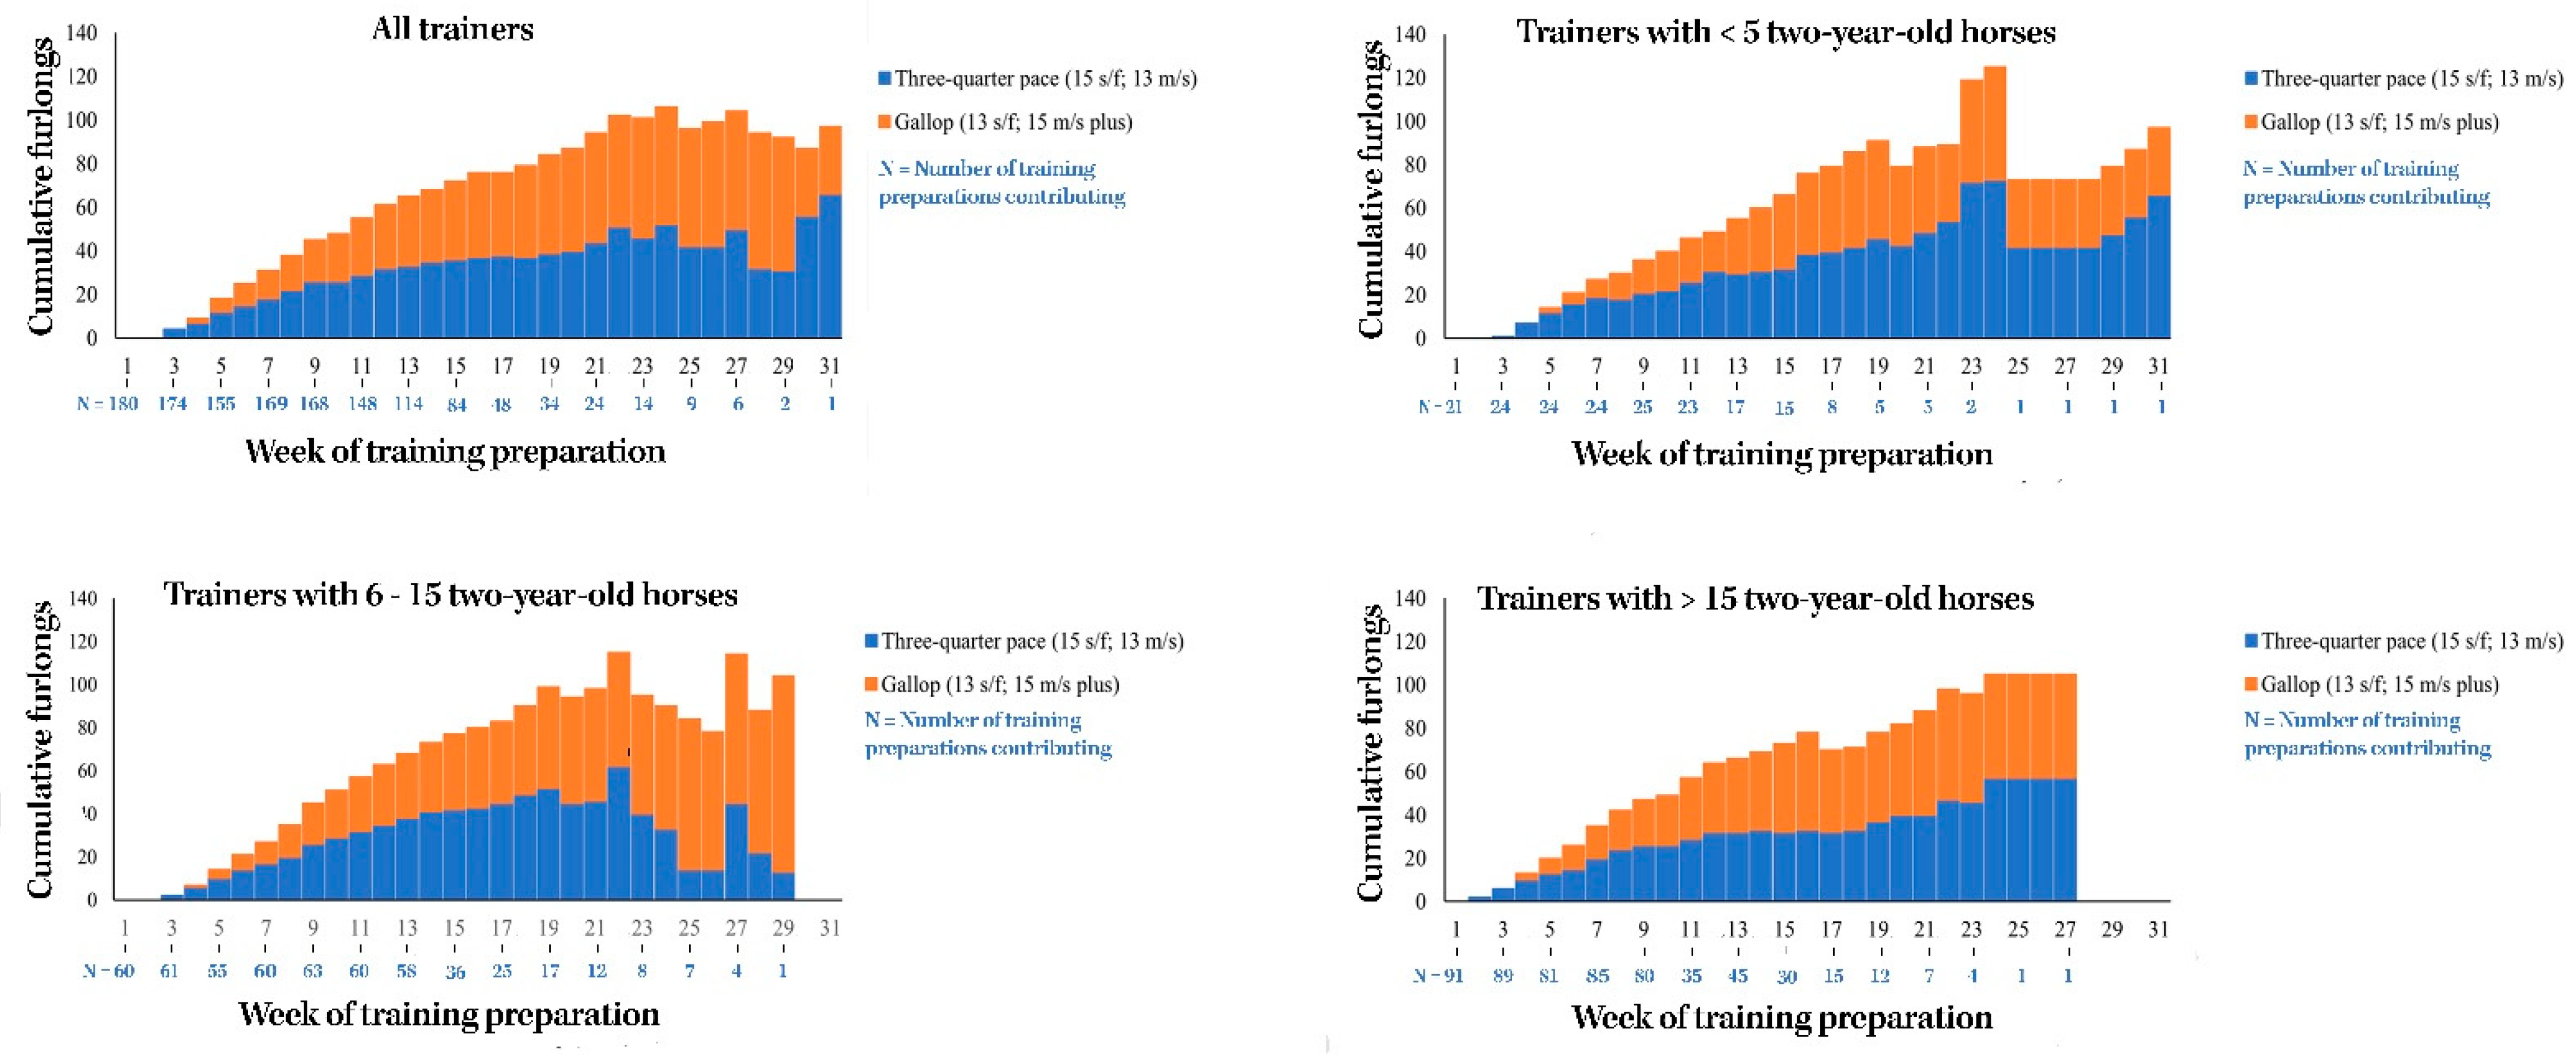
3.8. Median Cumulative Weekly Training Volume after First Trial
4. Discussion
5. Conclusions
Author Contributions
Funding
Institutional Review Board Statement
Informed Consent Statement
Data Availability Statement
Conflicts of Interest
Appendix A


| All Two-Year-Old Horses | Small Stables | Medium Stables | Large Stables | p-Value ‡ | ||||||
|---|---|---|---|---|---|---|---|---|---|---|
| (n = 535) | (n = 113) | (n = 196) | (n = 226) | |||||||
| General training characteristics | ||||||||||
| Median | IQR | Median | IQR | Median | IQR | Median | IQR | |||
| Age started training | 20 | 18–22 | 22 | 20–24 | 19 | 18–22 | 19 | 18–21 | <0.001 | |
| Total number of preparations | 2 | 2–3 | 2 | 1–2 | 2 | 1–3 | 3 | 2–4 | <0.001 | |
| Total weeks in training | 13 | 7–20 | 13 | 7–20 | 11 | 5–20 | 15 | 9–20 | 0.05 | |
| Rest period before (wks) | 7 | 4–9 | 6 | 3–10 | 7 | 4–8 | 7 | 5–9 | 0.16 | |
| Pre-training (wks) | 2 | 0–3 | 2 | 0–3 | 3 | 1–4 | 0 | 0–3 | <0.001 | |
| Prep length (wks) | 7 | 4–11 | 7 | 3–11 | 7 | 4–12 | 6 | 4–10 | 0.23 | |
| Low speed or non-ridden exercise | ||||||||||
| Total cumulative days | ||||||||||
| Median | IQR ¥ | Median | IQR ¥ | Median | IQR ¥ | Median | IQR ¥ | |||
| Slow | 50 | 27–76 | 63 | 34–97 | 50 | 27–84 | 45 | 27–69 | <0.001 | |
| Non-ridden | 1 | 0–14 | 0 | 0–1 | 0 | 0–13 | 5 | 0–28 | <0.001 | |
| Average days per week in training | ||||||||||
| Median | IQR ¥ | Median | IQR ¥ | Median | IQR ¥ | Median | IQR ¥ | |||
| Slow | 4 | 4–5 | 5 | 4–5 | 4 | 4–5 | 4 | 3–4 | <0.001 | |
| Non-ridden | 0.1 | 0–1 | 0 | 0–0.1 | 0 | 0–0.1 | 0.3 | 0–2 | <0.001 | |
| High-speed exercise | ||||||||||
| Total cumulative days | ||||||||||
| Median | IQR ¥ | Median | IQR ¥ | Median | IQR ¥ | Median | IQR ¥ | |||
| Three-quarter pace | 12 | 5–20 | 10 | 4–19 | 12 | 4–20 | 13 | 7–21 | 0.01 | |
| Track gallop | 6 | 1–12 | 2 | 0–8 | 6 | 1–12 | 7 | 3–14 | <0.001 | |
| Jump-outs | 1 | 0–2 | 1 | 0–2 | 1 | 0–2 | 1 | 0–2 | 0.32 | |
| Trials | 0 | 0–1 | 0 | 0–1 | 0 | 0–1 | 0 | 0–2 | <0.001 | |
| Races | 0 | 0–1 | 0 | 0–0 | 0 | 0–2 | 0 | 0–1 | 0.12 | |
| Total gallop days | 9 | 2–17 | 5 | 0–12 | 9 | 2–18 | 10 | 5–18 | <0.001 | |
| Average days per week in training | ||||||||||
| Median | IQR ¥ | Median | IQR ¥ | Median | IQR ¥ | Median | IQR ¥ | |||
| Three-quarter pace | 0.9 | 0.6–1.3 | 0.8 | 0.5–1.0 | 0.9 | 0.4–1.4 | 1.0 | 0.7–1.3 | <0.001 | |
| Track gallop | 0.5 | 0.1–0.7 | 0.2 | 0–0.5 | 0.5 | 0.1–0.7 | 0.5 | 0.3–0.8 | <0.001 | |
| Jump-outs | 0.1 | 0–0.1 | 0 | 0–0.1 | 0.1 | 0–0.2 | 0.1 | 0–0.1 | 0.15 | |
| Trials | 0 | 0–0.1 | 0 | 0–0 | 0 | 0–0.1 | 0 | 0–0.1 | <0.001 | |
| Races | 0 | 0–0.1 | 0 | 0–0 | 0 | 0–0.1 | 0 | 0–0.1 | 0.04 | |
| Total gallop days | 0.6 | 0.3–0.9 | 0.4 | 0–0.6 | 0.7 | 0.2–0.9 | 0.7 | 0.5–1.0 | <0.001 | |
| Total cumulative distance (f) | ||||||||||
| Median | IQR | Median | IQR | Median | IQR | Median | IQR | |||
| Three-quarter pace | 27 | 12–50 | 27 | 10–48 | 28 | 9–57 | 26 | 16–47 | 0.58 | |
| Track gallop | 10 | 2–22 | 4 | 0–13 | 10 | 1–21 | 13 | 5–27 | <0.001 | |
| Jump-outs | 2 | 0–6 | 2 | 0–6 | 3 | 0–6 | 2 | 0–5 | 0.63 | |
| Trials | 0 | 0–5 | 0 | 0–3 | 0 | 0–5 | 0 | 0–8 | <0.001 | |
| Races | 0 | 0–6 | 0 | 0–0 | 0 | 0–10 | 0 | 0–5 | 0.05 | |
| Total gallop distance | 17 | 2–41 | 7 | 0–28 | 16 | 2–46 | 21 | 7–44 | <0.001 | |
| Average distance per week in training(f) | ||||||||||
| Median | IQR | Median | IQR | Median | IQR | Median | IQR | |||
| Three-quarter pace | 2.2 | 1.2–3.1 | 2.1 | 1.0–2.6 | 2.4 | 1.1–3.6 | 2.0 | 1.3–2.9 | 0.03 | |
| Track gallop | 0.8 | 0.2–1.2 | 0.3 | 0–0.8 | 0.8 | 0.1–1.1 | 1.0 | 0.5–1.5 | <0.001 | |
| Jump-out | 0.2 | 0–0.4 | 0.1 | 0–0.4 | 0.2 | 0–0.5 | 0.2 | 0–0.3 | 0.30 | |
| Trials | 0 | 0–0.3 | 0 | 0–0.1 | 0 | 0–0.3 | 0 | 0–0.4 | <0.001 | |
| Races | 0 | 0–0.3 | 0 | 0–0 | 0 | 0–0.5 | 0 | 0–0.3 | 0.04 | |
| Total gallop distance | 1.3 | 0.4–2.2 | 0.7 | 0–1.5 | 1.4 | 0.2–2.3 | 1.6 | 0.9–2.3 | <0.001 | |
| Training and racing milestones | ||||||||||
| Reached milestones | ||||||||||
| N | % | N | % | N | % | N | % | |||
| Three-quarter pace | <0.001 | |||||||||
| No | 58 | 11 | 18 | 16 | 30 | 15 | 10 | 4 | ||
| Yes | 477 | 89 | 95 | 84 | 166 | 85 | 215 | 96 | ||
| Track gallop | <0.001 | |||||||||
| No | 106 | 20 | 34 | 30 | 49 | 25 | 23 | 10 | ||
| Yes | 428 | 80 | 79 | 70 | 147 | 75 | 202 | 90 | ||
| Jump-out | 0.06 | |||||||||
| No | 198 | 37 | 51 | 45 | 75 | 38 | 72 | 32 | ||
| Yes | 336 | 63 | 62 | 55 | 121 | 62 | 153 | 68 | ||
| Trial | <0.001 | |||||||||
| No | 319 | 60 | 83 | 73 | 123 | 63 | 113 | 60 | ||
| Yes | 215 | 40 | 30 | 27 | 73 | 37 | 215 | 40 | ||
| Race | 0.07 | |||||||||
| No | 369 | 69 | 87 | 77 | 126 | 64 | 156 | 69 | ||
| Yes | 165 | 31 | 26 | 23 | 70 | 36 | 69 | 31 | ||
| Time to reach milestones (wks) | ||||||||||
| Median | IQR | Median | IQR | Median | IQR | Median | IQR | |||
| Three-quarter pace | 2 | 2–4 | 4 | 2–5 | 3 | 2–4 | 2 | 1–3 | <0.001 | |
| Track gallop | 4 | 3–6 | 6 | 5–8 | 5 | 4–6 | 4 | 3–5 | <0.001 | |
| Jump-out | 6 | 5–7 | 7 | 5–9 | 7 | 5–8 | 6 | 4–7 | 0.01 | |
| Trial | 8 | 7–11 | 10 | 8–13 | 9 | 8–11 | 8 | 6–8 | <0.001 | |
| Race | 11 | 9–13 | 12 | 8–14 | 12 | 10–14 | 10 | 9–12 | 0.01 |
References
- Jeffcott, L.B.; Rossdale, P.D.; Freestone, J.; Frank, C.J.; Towers-Clark, P.F. An assessment of wastage in thoroughbred racing from conception to 4 years of age. Equine Vet. J. 1982, 14, 185–198. [Google Scholar] [CrossRef] [PubMed]
- Rossdale, P.D.; Hopes, R.; Digby, N.J.; Offord, K. Epidemiological study of wastage among racehorses 1982 and 1983. Vet. Rec. 1985, 116, 66–69. [Google Scholar] [CrossRef]
- Clegg, P.D. Musculoskeletal disease and injury, now and in the future. Part 1: Fractures and fatalities. Equine Vet. J. 2011, 43, 643–649. [Google Scholar] [CrossRef] [PubMed]
- Johnston, A.S.F.D.; Sidhu, B.S.; Riggs, C.M.; Verheyen, K.; Rosanowski, S.M. Stress fractures in racehorses’ first year training after import. Equine Vet. J. 2019, 51 (Suppl. S53), 29. [Google Scholar] [CrossRef] [Green Version]
- Johnston, A.S.; Riggs, C.M.; Cogger, N.; Benschop, J.; Rogers, C.W.; Rosanowski, S.M. Using time-series analysis techniques to enhance understanding of musculoskeletal injury in Thoroughbred racehorses. Equine Vet. J. 2019. [Google Scholar] [CrossRef] [PubMed]
- Hitchens, P.L.; Morrice-West, A.V.; Stevenson, M.A.; Whitton, R.C. Meta-analysis of risk factors for racehorse catastrophic musculoskeletal injury in flat racing. Vet. J. 2019, 245, 29–40. [Google Scholar] [CrossRef]
- Whitton, R.C.; Ayodele, B.A.; Hitchens, P.L.; Mackie, E.J. Subchondral bone microdamage accumulation in distal metacarpus of Thoroughbred racehorses. Equine Vet. J. 2018, 50, 766–773. [Google Scholar] [CrossRef]
- Sun, T.C.; Riggs, C.M.; Cogger, N.; Wright, J.; Al-Alawneh, J.I. Noncatastrophic and catastrophic fractures in racing Thoroughbreds at the Hong Kong Jockey Club. Equine Vet. J. 2018, 1, 77–82. [Google Scholar] [CrossRef]
- Smith, L.C.R.; Wylie, C.E.; Palmer, L.; Ramzan, P.H.L. A longitudinal study of fractures in 1488 Thoroughbred racehorses receiving intrasynovial medication: 2006–2011. Equine Vet. J. 2018, 50, 774–780. [Google Scholar] [CrossRef] [PubMed]
- Hitchens, P.L.; Hill, A.E.; Stover, S.M. Relationship between historical lameness, medication usage, surgery, and exercise with catastrophic musculoskeletal injury in racehorses. Front. Vet. Sci. 2018, 5. [Google Scholar] [CrossRef]
- Allen, S.E.; Rosanowski, S.M.; Stirk, A.J.; Verheyen, K.L. Description of veterinary events and risk factors for fatality in National Hunt flat racing Thoroughbreds in Great Britain (2000–2013). Equine Vet. J. 2017, 49, 700–705. [Google Scholar] [CrossRef] [Green Version]
- Estberg, L.; Stover, S.M.; Gardner, I.A.; Johnson, B.J.; Case, J.T.; Ardans, A.; Read, D.H.; Anderson, M.L.; Barr, B.C.; Daft, B.M.; et al. Fatal musculoskeletal injuries incurred during racing and training in thoroughbreds. J. Am. Vet. Med. Assoc. 1996, 208, 92–96. [Google Scholar]
- Parkin, T.D.; Clegg, P.D.; French, N.P.; Proudman, C.J.; Riggs, C.M.; Singer, E.R.; Webbon, P.M.; Morgan, K.L. Race- and course-level risk factors for fatal distal limb fracture in racing Thoroughbreds. Equine Vet. J. 2004, 36, 521–526. [Google Scholar] [CrossRef]
- Perkins, N.R.; Reid, S.W.; Morris, R.S. Profiling the New Zealand Thoroughbred racing industry. 2. Conditions interfering with training and racing. N. Z. Vet. J. 2004, 53, 69–76. [Google Scholar] [CrossRef]
- Perkins, N.R.; Reid, S.W.; Morris, R.S. Risk factors for musculoskeletal injuries of the lower limbs in Thoroughbred racehorses in New Zealand. N. Z. Vet. J. 2005, 53, 171–183. [Google Scholar] [CrossRef]
- Pinchbeck, G.L.; Clegg, P.D.; Proudman, C.J.; Stirk, A.; Morgan, K.L.; French, N.P. Horse injuries and racing practices in National Hunt racehorses in the UK: The results of a prospective cohort study. Vet. J. 2004, 167, 45–52. [Google Scholar] [CrossRef]
- Rosanowski, S.M.; Chang, Y.M.; Stirk, A.J.; Verheyen, K.L. Descriptive epidemiology of veterinary events in flat racing Thoroughbreds in Great Britain (2000 to 2013). Equine Vet. J. 2017, 49, 275–281. [Google Scholar] [CrossRef] [PubMed] [Green Version]
- Verheyen, K.; Price, J.; Lanyon, L.; Wood, J. Exercise distance and speed affect the risk of fracture in racehorses. Bone 2006, 39, 1322–1330. [Google Scholar] [CrossRef] [PubMed]
- Verheyen, K.L.; Newton, J.R.; Price, J.S.; Wood, J.L. A case-control study of factors associated with pelvic and tibial stress fractures in Thoroughbred racehorses in training in the UK. Prev. Vet. Med. 2006, 74, 21–35. [Google Scholar] [CrossRef]
- Verheyen, K.L.; Wood, J.L. Descriptive epidemiology of fractures occurring in British Thoroughbred racehorses in training. Equine Vet. J. 2004, 36, 167–173. [Google Scholar] [CrossRef] [PubMed]
- Clegg, P.D. Musculoskeletal disease and injury, now and in the future. Part 2: Tendon and ligament injuries. Equine Vet. J. 2012, 44, 371–375. [Google Scholar] [CrossRef] [PubMed] [Green Version]
- Hill, A.E.; Gardner, I.A.; Carpenter, T.E.; Stover, S.M. Effects of injury to the suspensory apparatus, exercise, and horseshoe characteristics on the risk of lateral condylar fracture and suspensory apparatus failure in forelimbs of thoroughbred racehorses. Am. J. Vet. Res. 2004, 65, 1508–1517. [Google Scholar] [CrossRef] [PubMed]
- Kasashima, Y.; Takahashi, T.; Smith, R.K.; Goodship, A.E.; Kuwano, A.; Ueno, T.; Hirano, S. Prevalence of superficial digital flexor tendonitis and suspensory desmitis in Japanese Thoroughbred flat racehorses in 1999. Equine Vet. J. 2004, 36, 346–350. [Google Scholar] [CrossRef]
- Lam, K.H.; Parkin, T.D.; Riggs, C.M.; Morgan, K.L. Descriptive analysis of retirement of Thoroughbred racehorses due to tendon injuries at the Hong Kong Jockey Club (1992–2004). Equine Vet. J. 2007, 39, 143–148. [Google Scholar] [CrossRef]
- Patterson-Kane, J.C.; Firth, E.C.; Parry, D.A.; Wilson, A.M.; Goodship, A.E. Effects of training on collagen fibril populations in the suspensory ligament and deep digital flexor tendon of young thoroughbreds. Am. J. Vet. Res. 1998, 59, 64–68. [Google Scholar]
- Dyson, P.K.; Jackson, B.F.; Pfeiffer, D.U.; Price, J.S. Days lost from training by two- and three-year-old Thoroughbred horses: A survey of seven UK training yards. Equine Vet. J. 2008, 40, 650–657. [Google Scholar] [CrossRef] [PubMed]
- Maeda, Y.; Hanada, M.; Oikawa, M.A. Epidemiology of racing injuries in Thoroughbred racehorses with special reference to bone fractures: Japanese experience from the 1980s to 2000s. J. Equine Sci. 2016, 27, 81–97. [Google Scholar] [CrossRef] [PubMed]
- Bailey, C.J.; Reid, S.W.; Hodgson, D.R.; Suann, C.J.; Rose, R.J. Risk factors associated with musculoskeletal injuries in Australian thoroughbred racehorses. Prev. Vet. Med. 1997, 32, 47–55. [Google Scholar] [CrossRef]
- Bailey, C.J.; Rose, R.J.; Reid, S.W.; Hodgson, D.R. Wastage in the Australian thoroughbred racing industry: A survey of Sydney trainers. Aust. Vet. J. 1997, 75, 64–66. [Google Scholar] [CrossRef]
- Cogger, N.; Evans, D.L.; Hodgson, D.R.; Reid, S.W.; Perkins, N. Incidence rate of musculoskeletal injuries and determinants of time to recovery in young Australian Thoroughbred racehorses. Aust. Vet. J. 2008, 86, 473–480. [Google Scholar] [CrossRef]
- Verheyen, K.L.; Henley, W.E.; Price, J.S.; Wood, J.L. Training-related factors associated with dorsometacarpal disease in young Thoroughbred racehorses in the UK. Equine Vet. J. 2005, 37, 442–448. [Google Scholar] [CrossRef] [PubMed]
- Crawford, K.L.; Finnane, A.; Greer, R.M.; Phillips, C.J.C.; Woldeyohannes, S.M.; Perkins, N.R.; Ahern, B.J. Appraising the Welfare of Thoroughbred Racehorses in Training in Queensland, Australia: The Incidence and Type of Musculoskeletal Injuries Vary between Two-Year-Old and Older Thoroughbred Racehorses. Animals 2020, 10, 2046. [Google Scholar] [CrossRef]
- Martig, S.; Chen, W.; Lee, P.V.; Whitton, R.C. Bone fatigue and its implications for injuries in racehorses. Equine Vet. J. 2014, 46, 408–415. [Google Scholar] [CrossRef] [PubMed]
- Martig, S.; Hitchens, P.L.; Lee, P.V.S.; Whitton, R.C. The relationship between microstructure, stiffness and compressive fatigue life of equine subchondral bone. J. Mech. Behav. Biomed. Mater. 2019, 101, 103439. [Google Scholar] [CrossRef] [PubMed]
- Patterson-Kane, J.C.; Firth, E.C.; Goodship, A.E.; Parry, D.A. Age-related differences in collagen crimp patterns in the superficial digital flexor tendon core region of untrained horses. Aust. Vet. J. 1997, 75, 39–44. [Google Scholar] [CrossRef] [PubMed]
- Riggs, C.M. Fractures—A preventable hazard of racing thoroughbreds? Vet. J. 2002, 163, 19–29. [Google Scholar] [CrossRef] [PubMed]
- Bennell, K.L.; Malcolm, S.A.; Wark, J.D.; Brukner, P.D. Models for the pathogenesis of stress fractures in athletes. Br. J. Sports Med. 1996, 30, 200–204. [Google Scholar] [CrossRef] [Green Version]
- Boyde, A. The real response of bone to exercise. J. Anat. 2003, 203, 173–189. [Google Scholar] [CrossRef]
- Boyde, A.; Firth, E.C. Musculoskeletal responses of 2-year-old Thoroughbred horses to early training. 8. Quantitative back-scattered electron scanning electron microscopy and confocal fluorescence microscopy of the epiphysis of the third metacarpal bone. N. Z. Vet. J. 2005, 53, 123–132. [Google Scholar] [CrossRef]
- Radtke, C.L.; Danova, N.A.; Scollay, M.C.; Santschi, E.M.; Markel, M.D.; Da Costa Gómez, T.; Muir, P. Macroscopic changes in the distal ends of the third metacarpal and metatarsal bones of Thoroughbred racehorses with condylar fractures. Am. J. Vet. Res. 2003, 64, 1110–1116. [Google Scholar] [CrossRef] [PubMed]
- Stepnik, M.W.; Radtke, C.L.; Scollay, M.C.; Oshel, P.E.; Albrecht, R.M.; Santschi, E.M.; Markel, M.D.; Muir, P. Scanning electron microscopic examination of third metacarpal/third metatarsal bone failure surfaces in thoroughbred racehorses with condylar fracture. Vet. Surg. VS 2004, 33, 2–10. [Google Scholar] [CrossRef]
- Whitton, R.C.; Trope, G.D.; Ghasem-Zadeh, A.; Anderson, G.A.; Parkin, T.D.; Mackie, E.J.; Seeman, E. Third metacarpal condylar fatigue fractures in equine athletes occur within previously modelled subchondral bone. Bone 2010, 47, 826–831. [Google Scholar] [CrossRef]
- Smith, R.K.; Birch, H.; Patterson-Kane, J.; Firth, E.C.; Williams, L.; Cherdchutham, W.; van Weeren, W.R.; Goodship, A.E. Should equine athletes commence training during skeletal development?: Changes in tendon matrix associated with development, ageing, function and exercise. Equine Vet. J. 1999, 31 (Suppl. S30), 201–209. [Google Scholar] [CrossRef] [PubMed]
- Smith, R.K.W.; Birch, H.L.; Goodman, S.; Heinegård, D.; Goodship, A.E. The influence of ageing and exercise on tendon growth and degeneration—Hypotheses for the initiation and prevention of strain-induced tendinopathies. Comp. Biochem. Physiol. Part A Mol. Integr. Physiol. 2002, 133, 1039–1050. [Google Scholar] [CrossRef]
- Anthenill, L.A.; Stover, S.M.; Gardner, I.A.; Hill, A.E. Risk factors for proximal sesamoid bone fractures associated with exercise history and horseshoe characteristics in Thoroughbred racehorses. Am. J. Vet. Res. 2007, 68, 760–771. [Google Scholar] [CrossRef]
- Estberg, L.; Gardner, I.A.; Stover, S.M.; Johnson, B.J. A case-crossover study of intensive racing and training schedules and risk of catastrophic musculoskeletal injury and lay-up in California thoroughbred racehorses. Prev. Vet. Med. 1998, 33, 159–170. [Google Scholar] [CrossRef]
- Estberg, L.; Stover, S.M.; Gardner, I.A.; Drake, C.M.; Johnson, B.; Ardans, A. High-speed exercise history and catastrophic racing fracture in thoroughbreds. Am. J. Vet. Res. 1996, 57, 1549–1555. [Google Scholar] [PubMed]
- Vallance, S.A.; Entwistle, R.C.; Hitchens, P.L.; Gardner, I.A.; Stover, S.M. Case-control study of high-speed exercise history of Thoroughbred and Quarter Horse racehorses that died related to a complete scapular fracture. Equine Vet. J. 2013, 45, 284–292. [Google Scholar] [CrossRef]
- Parkin, T.D.; Clegg, P.D.; French, N.P.; Proudman, C.J.; Riggs, C.M.; Singer, E.R.; Webbon, P.M.; Morgan, K.L. Risk of fatal distal limb fractures among Thoroughbreds involved in the five types of racing in the United Kingdom. Vet. Rec. 2004, 154, 493–497. [Google Scholar] [CrossRef]
- Mohammed, H.O.; Hill, T.; Lowe, J. Risk factors associated with injuries in thoroughbred horses. Equine Vet. J. 1991, 23, 445–448. [Google Scholar] [CrossRef]
- Perkins, N.R.; Reid, S.W.; Morris, R.S. Risk factors for injury to the superficial digital flexor tendon and suspensory apparatus in Thoroughbred racehorses in New Zealand. N. Z. Vet. J. 2005, 53, 184–192. [Google Scholar] [CrossRef]
- Carrier, T.K.; Estberg, L.; Stover, S.M.; Gardner, I.A.; Johnson, B.J.; Read, D.H.; Ardans, A.A. Association between long periods without high-speed workouts and risk of complete humeral or pelvic fracture in thoroughbred racehorses: 54 cases (1991–1994). J. Am. Vet. Med. Assoc. 1998, 212, 1582–1587. [Google Scholar] [PubMed]
- Hernandez, J.; Hawkins, D.L.; Scollay, M.C. Race-start characteristics and risk of catastrophic musculoskeletal injury in Thoroughbred racehorses. J. Am. Vet. Med. Assoc. 2001, 218, 83–86. [Google Scholar] [CrossRef] [PubMed]
- Hernandez, J.A.; Scollay, M.C.; Hawkins, D.L.; Corda, J.A.; Krueger, T.M. Evaluation of horseshoe characteristics and high-speed exercise history as possible risk factors for catastrophic musculoskeletal injury in thoroughbred racehorses. Am. J. Vet. Res. 2005, 66, 1314–1320. [Google Scholar] [CrossRef] [PubMed] [Green Version]
- Parkin, T.D.H.; Clegg, P.D.; French, N.P.; Proudman, C.J.; Riggs, C.M.; Singer, E.R.; Webbon, P.M.; Morgan, K.L. Risk factors for fatal lateral condylar fracture of the third metacarpus/metatarsus in UK racing. Equine Vet. J. 2005, 37, 192–199. [Google Scholar] [CrossRef]
- Ely, E.R.; Avella, C.S.; Price, J.S.; Smith, R.K.; Wood, J.L.; Verheyen, K.L. Descriptive epidemiology of fracture, tendon and suspensory ligament injuries in National Hunt racehorses in training. Equine Vet. J. 2009, 41, 372–378. [Google Scholar] [CrossRef]
- Ramzan, P.H.; Palmer, L. Musculoskeletal injuries in Thoroughbred racehorses: A study of three large training yards in Newmarket, UK (2005–2007). Vet. J. 2011, 187, 325–329. [Google Scholar] [CrossRef]
- Reed, S.R.; Jackson, B.F.; Mc Ilwraith, C.W.; Wright, I.M.; Pilsworth, R.; Knapp, S.; Wood, J.L.; Price, J.S.; Verheyen, K.L. Descriptive epidemiology of joint injuries in Thoroughbred racehorses in training. Equine Vet. J. 2012, 44, 13–19. [Google Scholar] [CrossRef]
- Bailey, C.J.; Reid, S.W.; Hodgson, D.R.; Rose, R.J. Factors associated with time until first race and career duration for Thoroughbred racehorses. Am. J. Vet. Res. 1999, 60, 1196–1200. [Google Scholar]
- Cogger, N. Epidemiology of musculoskeletal injuries in two- and three-year-old Australian Thoroughbred racehorses. Ph.D. Thesis, The University of Sydney, Sydney, Australia, 2006. [Google Scholar]
- Perkins, N.R.; Reid, S.W.; Morris, R.S. Profiling the New Zealand Thoroughbred racing industry. 1. Training, racing and general health patterns. N. Z. Vet. J. 2004, 53, 59–68. [Google Scholar] [CrossRef]
- Rogers, C.W.; Firth, E.C. Musculoskeletal responses of 2-year-old Thoroughbred horses to early training. 2. Measurement error and effect of training stage on the relationship between objective and subjective criteria of training workload. N. Z. Vet. J. 2004, 52, 272–279. [Google Scholar] [CrossRef]
- Morrice-West, A.V.; Hitchens, P.L.; Walmsley, E.A.; Stevenson, M.A.; Whitton, R.C. Training practices, speed and distances undertaken by Thoroughbred racehorses in Victoria, Australia. Equine Vet. J. 2020, 52, 273–280. [Google Scholar] [CrossRef]
- Bolwell, C.F.; Rogers, C.W.; French, N.P.; Firth, E.C. Associations between yearling exercise and interruptions during race training in Thoroughbred racehorses. Am. J. Vet. Res. 2012, 73, 1610–1616. [Google Scholar] [CrossRef] [PubMed]
- Bolwell, C.F.; Rogers, C.W.; French, N.P.; Firth, E.C. The effect of interruptions during training on the time to the first trial and race start in Thoroughbred racehorses. Prev. Vet. Med. 2013, 108, 188–198. [Google Scholar] [CrossRef] [PubMed]
- Bolwell, C.F.; Russell, L.J.; Rogers, C.W. A cross-sectional survey of training practices of 2-year-old racehorses in the North Island of New Zealand. Comp. Exerc. Physiol. 2010, 7, 37–42. [Google Scholar] [CrossRef]
- Hill, T.; Carmichael, D.; Maylin, G.; Krook, L. Track condition and racing injuries in thoroughbred horses. Cornell Vet. 1986, 76, 361–379. [Google Scholar] [PubMed]
- Parkin, T.D.; Clegg, P.D.; French, N.P.; Proudman, C.J.; Riggs, C.M.; Singer, E.R.; Webbon, P.M.; Morgan, K.L. Horse-level risk factors for fatal distal limb fracture in racing Thoroughbreds in the UK. Equine Vet. J. 2004, 36, 513–519. [Google Scholar] [CrossRef]
- Firth, E.C. The response of bone, articular cartilage and tendon to exercise in the horse. J. Anat. 2006, 208, 513–526. [Google Scholar] [CrossRef]
- Firth, E.C.; Rogers, C.W. Musculoskeletal responses of 2-year-old Thoroughbred horses to early training. 7. Bone and articular cartilage response in the carpus. N. Z. Vet. J. 2005, 53, 113–122. [Google Scholar] [CrossRef]
- Firth, E.C.; Rogers, C.W.; Anderson, B.H. Musculoskeletal responses of 2-year-old Thoroughbred horses to early training. 4. Morphometric, microscopic and biomechanical properties of the digital tendons of the forelimb. N. Z. Vet. J. 2004, 52, 285–292. [Google Scholar] [CrossRef]
- Firth, E.C.; Rogers, C.W.; Doube, M.; Jopson, N.B. Musculoskeletal responses of 2-year-old Thoroughbred horses to early training. 6. Bone parameters in the third metacarpal and third metatarsal bones. N. Z. Vet. J. 2005, 53, 101–112. [Google Scholar] [CrossRef] [PubMed]
- Firth, E.C.; Rogers, C.W.; Perkins, N.R.; Anderson, B.H.; Grace, N.D. Musculoskeletal responses of 2-year-old Thoroughbred horses to early training. 1. Study design, and clinical, nutritional, radiological and histological observations. N. Z. Vet. J. 2004, 52, 261–271. [Google Scholar] [CrossRef]
- Perkins, N.R.; Rogers, C.W.; Firth, E.C.; Anderson, B.H. Musculoskeletal responses of 2-year-old Thoroughbred horses to early training. 3. In vivo ultrasonographic assessment of the cross-sectional area and echogenicity of the superficial digital flexor tendon. N. Z. Vet. J. 2004, 52, 280–284. [Google Scholar] [CrossRef] [PubMed]
- Rogers, C.W.; Firth, E.C.; Anderson, B.H. Musculoskeletal responses of 2-year-old Thoroughbred horses to early training. 5. Kinematic effects. N. Z. Vet. J. 2005, 53, 95–100. [Google Scholar] [CrossRef] [PubMed]
- Rogers, C.W.; Firth, E.C.; McIlwraith, C.W.; Barneveld, A.; Goodship, A.E.; Kawcak, C.E.; Smith, R.K.; van Weeren, P.R. Evaluation of a new strategy to modulate skeletal development in Thoroughbred performance horses by imposing track-based exercise during growth. Equine Vet. J. 2008, 40, 111–118. [Google Scholar] [CrossRef]
- Rogers, C.W.; Firth, E.C.; McIlwraith, C.W.; Barneveld, A.; Goodship, A.E.; Kawcak, C.E.; Smith, R.K.; van Weeren, P.R. Evaluation of a new strategy to modulate skeletal development in racehorses by imposing track-based exercise during growth: The effects on 2- and 3-year-old racing careers. Equine Vet. J. 2008, 40, 119–127. [Google Scholar] [CrossRef] [PubMed]
- Racing Queensland. Premierships. Available online: https://www.racingqueensland.com.au/racing-and-results/premierships (accessed on 2 December 2020).
- Queensland Racing and Integrity Commission, Trainers. Available online: https://en.calameo.com/read/000373495b7c6c260f76b (accessed on 2 December 2020).
- Australian Stud Book Database. Available online: https://www.studbook.org.au/ (accessed on 1 November 2020).
- Racing Australia Database. Available online: http://www.racingaustralia.horse/home.aspx (accessed on 1 November 2017).
- Chen, X.; Ender, P.; Mitchell, M.; Wells, C. Regression with Stata; UCLA Institute for Digital Research and Education Statistical Consulting: Los Angeles, CA, USA, 2003. [Google Scholar]
- Perkins, N.R.; Reid, S.W.J.; Morris, R.S. Effect of training location and time period on racehorse performance in New Zealand. 1. Descriptive analysis. N. Z. Vet. J. 2004, 52, 236–242. [Google Scholar] [CrossRef]
- Morrice-West, A.V.; Hitchens, P.L.; Walmsley, E.A.; Whitton, R.C. Track Surfaces Used for Ridden Workouts and Alternatives to Ridden Exercise for Thoroughbred Horses in Race Training. Animals 2018, 8, 221. [Google Scholar] [CrossRef] [Green Version]
- Bolwell, C.F.; Rogers, C.W.; French, N.P.; Firth, E.C. Risk factors for interruptions to training occurring before the first trial start of 2-year-old Thoroughbred racehorses. N. Z. Vet. J. 2012, 60, 241–246. [Google Scholar] [CrossRef]
- Bailey, C.J.; Reid, S.W.; Hodgson, D.R.; Rose, R.J. Impact of injuries and disease on a cohort of two- and three-year-old thoroughbreds in training. Vet. Rec. 1999, 145, 487–493. [Google Scholar] [CrossRef]
- Von Wittke, P.; Lindner, A.; Deegen, E.; Sommer, H. Effects of training on blood lactate-running speed relationship in thoroughbred racehorses. J. Appl. Physiol. 1994, 77, 298–302. [Google Scholar] [CrossRef]
- Rivero, J.-L.L.; Ruz, A.; Martí-Korff, S.; Estepa, J.-C.; Aguilera-Tejero, E.; Werkman, J.; Sobotta, M.; Lindner, A. Effects of intensity and duration of exercise on muscular responses to training of thoroughbred racehorses. J. Appl. Physiol. 2007, 102, 1871–1882. [Google Scholar] [CrossRef] [PubMed]
- Frisbie, D.D.; Mc Ilwraith, C.W.; Arthur, R.M.; Blea, J.; Baker, V.A.; Billinghurst, R.C. Serum biomarker levels for musculoskeletal disease in two- and three-year-old racing Thoroughbred horses: A prospective study of 130 horses. Equine Vet. J. 2010, 42, 643–651. [Google Scholar] [CrossRef] [PubMed]
- Giannitti, F.; Petrov, R.; Parker, J.; Booth, M.; Anderson, M. Diagnostic exercise: Poor performance in a racehorse. Vet. Pathol. 2014, 51, 824–827. [Google Scholar] [CrossRef] [Green Version]
- Jackson, B.F.; Dyson, P.K.; Lonnell, C.; Verheyen, K.L.P.; Pfeiffer, D.U.; Price, J.S. Bone biomarkers and risk of fracture in two- and three-year-old Thoroughbreds. Equine Vet. J. 2009, 41, 410–413. [Google Scholar] [CrossRef] [PubMed]
- Jackson, B.F.; Lonnell, C.; Verheyen, K.L.; Dyson, P.; Pfeiffer, D.U.; Price, J.S. Biochemical markers of bone metabolism and risk of dorsal metacarpal disease in 2-year-old Thoroughbreds. Equine Vet. J. 2005, 37, 87–91. [Google Scholar] [CrossRef] [PubMed]
- Cappelli, K.; Verini-Supplizi, A.; Capomaccio, S.; Silvestrelli, M. Analysis of peripheral blood mononuclear cells gene expression in endurance horses by cDNA-AFLP technique. Res. Vet. Sci. 2007, 82, 335–343. [Google Scholar] [CrossRef]
- Witkowska-Pilaszewicz, O.; Pingwara, R.; Winnicka, A. The Effect of Physical Training on Peripheral Blood Mononuclear Cell Ex Vivo Proliferation, Differentiation, Activity, and Reactive Oxygen Species Production in Racehorses. Antioxidants 2020, 9, 1155. [Google Scholar] [CrossRef]
| All Two-Year-Old Horses | Small Stables | Medium Stables | Large Stables | p-Value ‡ | ||||||
|---|---|---|---|---|---|---|---|---|---|---|
| (n = 377) | (n = 96) | (n = 152) | (n = 129) | |||||||
| General training characteristics | ||||||||||
| Median | IQR | Median | IQR | Median | IQR | Median | IQR | |||
| Rest period before (wks) | † | † | † | † | † | † | † | † | † | |
| Pre-training (wks) | † | † | † | † | † | † | † | † | † | |
| Prep length (wks) | 4 | 2–6 | 4 | 3–10 | 4 | 2–7 | 3 | 2–4 | <0.001 | |
| Low speed exercise | ||||||||||
| Total cumulative days | ||||||||||
| Median | IQR ¥ | Median | IQR ¥ | Median | IQR ¥ | Median | IQR ¥ | |||
| Slow | 17 | 10–28 | 24 | 16–45 | 19 | 12–28 | 10 | 4–16 | <0.001 | |
| Average days per week in training | ||||||||||
| Median | IQR ¥ | Median | IQR ¥ | Median | IQR ¥ | Median | IQR ¥ | |||
| Slow | 5 | 4–5 | 5 | 5–6 | 5 | 4–6 | 4 | 3–4 | <0.001 | |
| Non-ridden exercise | ||||||||||
| Total cumulative days | ||||||||||
| Median | IQR ¥ | Median | IQR ¥ | Median | IQR ¥ | Median | IQR ¥ | |||
| Non-ridden | 0 | 0–1 | 0 | (0–24) | 0 | (0–72) | 0 | 0–1 | 0.02 | |
| Average days per week in training | ||||||||||
| Median | IQR ¥ | Median | IQR ¥ | Median | IQR ¥ | Median | IQR ¥ | |||
| Non-ridden | 0 | 0–0.05 | 0 | (0–6) | 0 | (0–4) | 0 | 0–0.3 | 0.01 | |
| High-speed exercise | ||||||||||
| Total cumulative days | ||||||||||
| Median | IQR ¥ | Median | IQR ¥ | Median | IQR ¥ | Median | IQR ¥ | |||
| Three-quarter pace | 1 | 0–1 | 1 | 0–1 | 1 | 0–1 | 1 | 0–1 | 0.24 | |
| Track gallop | 0 | 0–2 | 0 | 0–2 | 0 | 0–2 | 0 | 0–3 | 0.30 | |
| Jump-outs | 0 | 0–1 | 0 | 0–1 | 0 | 0–1 | 0 | (0–3) | 0.03 | |
| Trials | 0 | (0–4) | 0 | (0–4) | 0 | (0–2) | 0 | (0–2) | 0.01 | |
| Races | 0 | (0–7) | 0 | (0–3) | 0 | (0–7) | 0 | (0–2) | 0.13 | |
| Total gallop days | 0 | 0–4 | 0 | 0–5 | 0 | 0–4 | 0 | 0–3 | 0.12 | |
| Average days per week | ||||||||||
| Median | IQR ¥ | Median | IQR ¥ | Median | IQR ¥ | Median | IQR ¥ | |||
| Three-quarter pace | 1 | 0–1 | 1 | 0–1 | 1 | 0–1 | 1 | 0–1 | 0.23 | |
| Track gallop | 0 | 0–0.4 | 0 | 0–0.3 | 0 | 0–0.4 | 0 | 0–0.5 | 0.47 | |
| Jump-outs | 0 | 0–0.1 | 0 | 0–0.2 | 0 | 0–0.1 | 0 | (0–0.5) | 0.06 | |
| Trials | 0 | (0–0.5) | 0 | (0–0.5) | 0 | (0–0.3) | 0 | (0–0.3) | 0.01 | |
| Races | 0 | (0–0.5) | 0 | (0–0.3) | 0 | (0–0.5) | 0 | (0–0.2) | 0.13 | |
| Total gallop days | 0 | 0–0.6 | 0 | 0–0.5 | 0 | 0–0.8 | 0 | 0–0.7 | 0.30 | |
| Total cumulative distance (f) | ||||||||||
| Median | IQR ¥ | Median | IQR ¥ | Median | IQR ¥ | Median | IQR ¥ | |||
| Three-quarter pace | 4 | 0–14 | 6 | 0–16 | 6 | 0–17 | 3 | 0–9 | 0.12 | |
| Track gallop | 0 | 0–4 | 0 | 0–4 | 0 | 0–4 | 0 | 0–4 | 0.34 | |
| Jump-outs | 0 | 0–2 | 0 | 0–4 | 0 | 0–2 | 0 | (0–9) | 0.34 | |
| Trials | 0 | (0–19) | 0 | (0–19) | 0 | (0–9) | 0 | (0–8) | 0.02 | |
| Races | 0 | (0–49) | 0 | (0–15) | 0 | (0–49) | 0 | (0–12) | 0.14 | |
| Total gallop distance | 0 | 0–7 | 0 | 0–9 | 0 | 0–9 | 0 | 0–4 | 0.11 | |
| Average distance per week in training (f) | ||||||||||
| Median | IQR ¥ | Median | IQR ¥ | Median | IQR ¥ | Median | IQR ¥ | |||
| Three-quarter pace | 1 | 0–2.4 | 1.2 | 0–2.3 | 1.4 | 0–2.8 | 1 | 0–2 | 0.09 | |
| Track gallop | 0 | 0–0.6 | 0 | 0–0.5 | 0 | 0–0.8 | 0 | 0–0.7 | 0.52 | |
| Jump-out | 0 | 0–0.3 | 0 | 0–0.5 | 0 | 0–0.3 | 0 | (0–1) | 0.03 | |
| Trials | 0 | (0–3) | 0 | (0–3) | 0 | (0–1) | 0 | (0–1) | 0.01 | |
| Races | 0 | (0–3) | 0 | (0–2) | 0 | (0–3) | 0 | (0–1) | 0.13 | |
| Total gallop distance | 0 | 0–1.2 | 0 | 0–1 | 0 | 0–1.6 | 0 | 0–1 | 0.20 | |
| Training and racing milestones | ||||||||||
| Reached milestones | ||||||||||
| N | % | N | % | N | % | N | % | |||
| Three-quarter pace | 0.68 | |||||||||
| No | 147 | 39 | 41 | 43 | 58 | 38 | 48 | 37 | ||
| Yes | 230 | 61 | 55 | 57 | 94 | 62 | 81 | 63 | ||
| Track gallop | 0.40 | |||||||||
| No | 229 | 60 | 58 | 60 | 87 | 57 | 84 | 65 | ||
| Yes | 148 | 40 | 38 | 40 | 65 | 43 | 45 | 35 | ||
| Jump-out | 0.10 | |||||||||
| No | 266 | 71 | 63 | 66 | 103 | 68 | 100 | 78 | ||
| Yes | 111 | 29 | 33 | 34 | 49 | 32 | 29 | 22 | ||
| Trial | 0.02 | |||||||||
| No | 331 | 88 | 86 | 90 | 125 | 82 | 120 | 93 | ||
| Yes | 46 | 12 | 10 | 10 | 27 | 18 | 9 | 7 | ||
| Race | 0.23 | |||||||||
| No | 347 | 92 | 87 | 91 | 137 | 90 | 123 | 95 | ||
| Yes | 30 | 8 | 9 | 9 | 15 | 10 | 6 | 5 | ||
| Time to reach milestones (wks) | ||||||||||
| Median | IQR | Median | IQR | Median | IQR | Median | IQR | |||
| Three-quarter pace | 2 | 1–4 | 4 | 1–4 | 2 | 1–4 | 2 | 2–3 | 0.001 | |
| Track gallop | 4 | 3–5 | 5 | 2–8 | 4 | 3–5 | 3 | 3–4 | 0.06 | |
| Jump-out | 5 | 4–7 | 6 | 4–8 | 5 | 3–7 | 4 | 4–5 | 0.33 | |
| Trial | 8 | 6–11 | 9 | 6–11 | 8 | 5–10 | 8 | 7–12 | 0.58 | |
| Race | 11 | 8–14 | 13 | 7–15 | 11 | 8–14 | 9 | 9–10 | 0.37 |
| All Two-Year-Old Horses | Small Stables | Medium Stables | Large Stables | p-Value ‡ | ||||||
|---|---|---|---|---|---|---|---|---|---|---|
| (n = 350) | (n = 72) | (n = 119) | (n = 159) | |||||||
| General training characteristics | ||||||||||
| Median | IQR | Median | IQR | Median | IQR | Median | IQR | |||
| Rest period before (wks) | 6 | 4–8 | 5 | 4–9 | 7 | 5–8 | 5 | 4–7 | 0.05 | |
| Pre-training (wks) | 2 | 0–3 | 2 | 0–2 | 2 | 1–3 | 2 | 0–3 | 0.001 | |
| Prep length (wks) | 6 | 4–10 | 8 | 6–12 | 7 | 4–12 | 5 | 3–8 | <0.001 | |
| Low speed exercise | ||||||||||
| Total cumulative days | ||||||||||
| Median | IQR ¥ | Median | IQR ¥ | Median | IQR ¥ | Median | IQR ¥ | |||
| Slow | 25 | 14–42 | 37 | 28–55 | 29 | 17–51 | 18 | 9–27 | <0.001 | |
| Average days per week in training | ||||||||||
| Median | IQR ¥ | Median | IQR ¥ | Median | IQR ¥ | Median | IQR ¥ | |||
| Slow | 4 | 4–5 | 5 | 4–5 | 5 | 4–5 | 4 | 3–4 | <0.001 | |
| Non-ridden exercise | ||||||||||
| Total cumulative days | ||||||||||
| Median | IQR ¥ | Median | IQR ¥ | Median | IQR ¥ | Median | IQR ¥ | |||
| Non-ridden | 0 | 0–3 | 0 | 0–1 | 0 | 0–4 | 0 | 0–3 | 0.04 | |
| Average days per week in training | ||||||||||
| Median | IQR ¥ | Median | IQR ¥ | Median | IQR ¥ | Median | IQR ¥ | |||
| Non-ridden | 0 | 0–0.5 | 0 | 0–0.1 | 0 | 0–0.7 | 0 | 0–0.5 | 0.03 | |
| High-speed exercise | ||||||||||
| Total cumulative days | ||||||||||
| Median | IQR ¥ | Median | IQR ¥ | Median | IQR ¥ | Median | IQR ¥ | |||
| Three-quarter pace | 6 | 2–11 | 8 | 5–14 | 6 | 3–11 | 5 | 2–9 | 0.003 | |
| Track gallop | 3 | 0–6 | 3 | 0–7 | 3 | 1–7 | 3 | 1–6 | 0.37 | |
| Jump-outs | 1 | 0–1 | 0 | 0–2 | 1 | 0–2 | 0 | 0–1 | <0.001 | |
| Trials | 0 | 0–1 | 0 | 0–1 | 0 | 0–1 | 0 | 0–1 | 0.87 | |
| Races | 0 | (0–5) | 0 | (0–5) | 0 | 0–1 | 0 | (0–3) | 0.002 | |
| Total gallop days | 4 | 1–9 | 4 | 0–9 | 5 | 2–11 | 4 | 1–8 | 0.06 | |
| Average days per week in training | ||||||||||
| Median | IQR ¥ | Median | IQR ¥ | Median | IQR ¥ | Median | IQR ¥ | |||
| Three-quarter pace | 1 | 1–1 | 1 | 1–1 | 1 | 0–1 | 1 | 1–1 | 0.36 | |
| Track gallop | 0.5 | 0–0.8 | 0.3 | 0–0.6 | 0.4 | 0.1–0.7 | 0.6 | 0.2–1 | <0.001 | |
| Jump-outs | 0.1 | 0–0.2 | 0 | 0–0.1 | 0.1 | 0–0.2 | 0 | 0–0.2 | <0.001 | |
| Trials | 0 | 0–0.1 | 0 | 0–0.04 | 0 | 0–0.1 | 0 | 0–0.1 | 0.48 | |
| Races | 0 | (0–1) | 0 | (0–0.4) | 0 | 0–0.1 | 0 | (0–0.4) | 0.01 | |
| Total gallop days | 0.7 | 0.2–1.3 | 0.5 | 0–0.8 | 0.8 | 0.3–1.1 | 0.8 | 0.3–1.1 | <0.001 | |
| Total cumulative distance (f) | ||||||||||
| Median | IQR ¥ | Median | IQR ¥ | Median | IQR ¥ | Median | IQR ¥ | |||
| Three-quarter pace | 14 | 4–26 | 20 | 12–33 | 14 | 6–30 | 10 | 3–17 | <0.001 | |
| Track gallop | 4 | 0–11 | 4 | 0–10 | 5 | 1–12 | 4 | 1–10 | 0.26 | |
| Jump-outs | 2 | 0–4 | 0 | 0–4 | 2 | 0–4 | 0 | 0–2 | <0.001 | |
| Trials | 0 | 0–4 | 0 | 0–3 | 0 | 0–3 | 0 | 0–4 | 0.84 | |
| Races | 0 | (0–29) | 0 | (0–27) | 0 | 0–6 | 0 | (0–17) | 0.002 | |
| Total gallop distance | 8 | 1–20 | 6 | 0–20 | 10 | 2–27 | 8 | 1–16 | 0.04 | |
| Average distance per week in training (f) | ||||||||||
| Median | IQR ¥ | Median | IQR ¥ | Median | IQR ¥ | Median | IQR ¥ | |||
| Three-quarter pace | 2.1 | 1–3.1 | 2.3 | 1.2–3.5 | 2.3 | 1.2–3.3 | 1.9 | 0.8–2.9 | 0.04 | |
| Track gallop | 0.8 | 0–1.4 | 0.4 | 0–0.8 | 0.8 | 0.3–1.3 | 1 | 0.3–1.6 | <0.001 | |
| Jump-out | 0.1 | 0–0.5 | 0 | 0–0.4 | 0.3 | 0–0.6 | 0 | 0–0.4 | <0.001 | |
| Trials | 0 | 0–0.3 | 0 | 0–0.2 | 0 | 0–0.3 | 0 | 0–0.4 | 0.47 | |
| Races | 0 | (0–6) | 0 | (0–2) | 0 | 0–0.4 | 0 | (0–2) | 0.005 | |
| Total gallop distance | 1.4 | 0.3–2.4 | 0.8 | 0–1.9 | 1.5 | 0.5–2.5 | 1.5 | 0.3–2.5 | 0.01 | |
| Training and racing milestones | ||||||||||
| Reached milestones | ||||||||||
| N | % | N | % | N | % | N | % | |||
| Three-quarter pace | 0.91 | |||||||||
| No | 44 | 13 | 10 | 14 | 14 | 12 | 20 | 13 | ||
| Yes | 306 | 87 | 62 | 86 | 105 | 88 | 139 | 87 | ||
| Track gallop | 0.20 | |||||||||
| No | 88 | 25 | 24 | 33 | 27 | 23 | 37 | 23 | ||
| Yes | 262 | 75 | 48 | 67 | 92 | 77 | 122 | 77 | ||
| Jump-out | <0.001 | |||||||||
| No | 172 | 49 | 37 | 51 | 37 | 31 | 98 | 62 | ||
| Yes | 178 | 51 | 35 | 49 | 82 | 69 | 61 | 38 | ||
| Trial | 0.89 | |||||||||
| No | 250 | 71 | 53 | 74 | 85 | 71 | 112 | 70 | ||
| Yes | 100 | 29 | 19 | 26 | 34 | 29 | 47 | 30 | ||
| Race | 0.01 | |||||||||
| No | 273 | 78 | 56 | 78 | 82 | 69 | 135 | 85 | ||
| Yes | 77 | 22 | 16 | 22 | 37 | 31 | 24 | 15 | ||
| Time to reach milestones (wks) | ||||||||||
| Median | IQR | Median | IQR | Median | IQR | Median | IQR | |||
| Three-quarter pace | 2 | 1–4 | 4 | 2–5 | 3 | 1–4 | 1 | 1–2 | <0.001 | |
| Track gallop | 4 | 2–5 | 6 | 4–7 | 5 | 3–5 | 3 | 1–4 | <0.001 | |
| Jump-out | 6 | 4–7 | 7 | 5–9 | 6 | 4–7 | 4 | 3–6 | <0.001 | |
| Trial | 8 | 6–9 | 9 | 8–13 | 8 | 7–10 | 6 | 5–8 | <0.001 | |
| Race | 11 | 8–12 | 11 | 9–14 | 11 | 9–14 | 9 | 8–10 | 0.07 |
| All Two-Year-Old Horses | Small Stables | Medium Stables | Large Stables | p-Value ‡ | ||||||
|---|---|---|---|---|---|---|---|---|---|---|
| (n = 349) | (n = 28) | (n = 84) | (n = 237) | |||||||
| General training characteristics | ||||||||||
| Median | IQR | Median | IQR | Median | IQR | Median | IQR | |||
| Rest period before (wks) | 6 | 4–9 | 5 | 2–9 | 6 | 3–8 | 6 | 4–9 | 0.24 | |
| Pre-training (wks) | 0 | 0–2 | 1 | 0–4 | 2 | 0–3 | 0 | 0–2 | <0.001 | |
| Prep length (wks) | 8 | 5–12 | 7 | 4–11 | 9 | 5–13 | 7 | 4–12 | 0.12 | |
| Low speed exercise | ||||||||||
| Total cumulative days | ||||||||||
| Median | IQR ¥ | Median | IQR ¥ | Median | IQR ¥ | Median | IQR ¥ | |||
| Slow | 25 | 14–43 | 32 | 18–47 | 37 | 20–52 | 21 | 12–36 | <0.001 | |
| Average days per week in training | ||||||||||
| Median | IQR ¥ | Median | IQR ¥ | Median | IQR ¥ | Median | IQR ¥ | |||
| Slow | 4 | 3–4 | 5 | 4–5 | 4 | 4–4 | 3 | 2–4 | <0.001 | |
| Non-ridden exercise | ||||||||||
| Total cumulative days | ||||||||||
| Median | IQR ¥ | Median | IQR ¥ | Median | IQR ¥ | Median | IQR ¥ | |||
| Non-ridden | 2 | 0–17 | 0 | (0–30) | 2 | 0–16 | 3 | 0–20 | <0.001 | |
| Average days per week in training | ||||||||||
| Median | IQR ¥ | Median | IQR ¥ | Median | IQR ¥ | Median | IQR ¥ | |||
| Non-ridden | 0.3 | 0–2 | 0 | (0–3) | 0.1 | 0–2 | 0.4 | 0–2 | <0.001 | |
| High-speed exercise | ||||||||||
| Total cumulative days | ||||||||||
| Median | IQR ¥ | Median | IQR ¥ | Median | IQR ¥ | Median | IQR ¥ | |||
| Three-quarter pace | 7 | 3–14 | 7 | 4–13 | 11 | 5–18 | 7 | 3–12 | 0.003 | |
| Track gallop | 4 | 1–8 | 2 | 0–5 | 6 | 2–11 | 4 | 2–8 | 0.01 | |
| Jump-outs | 0 | 0–1 | 0 | 0–1 | 1 | 0–2 | 0 | 0–1 | 0.002 | |
| Trials | 0 | 0–1 | 0 | 0–1 | 0 | 0–1 | 0 | 0–1 | 0.23 | |
| Races | 0 | 0–1 | 0 | (0–5) | 0 | 0–2 | 0 | (0–5) | <0.001 | |
| Total gallop days | 6 | 2–11 | 2 | 0–8 | 9 | 2–15 | 6 | 2–10 | 0.003 | |
| Average days per week in training | ||||||||||
| Median | IQR ¥ | Median | IQR ¥ | Median | IQR ¥ | Median | IQR ¥ | |||
| Three-quarter pace | 1 | 1–1 | 1 | 0–1 | 1 | 1–2 | 1 | 1–1 | 0.01 | |
| Track gallop | 0.5 | 0.2–0.8 | 0.2 | 0–0.5 | 0.6 | 0.3–0.8 | 0.5 | 0.3–0.8 | 0.001 | |
| Jump-outs | 00 | 0–0.1 | 0 | 0–0.1 | 0.1 | 0–0.2 | 0 | 0–0.1 | 0.04 | |
| Trials | 0 | 0–0.1 | 0 | 0–0.03 | 0 | 0–0.1 | 0 | 0–0.1 | 0.19 | |
| Races | 0 | 0–0.1 | 0 | (0–0.3) | 0 | 0–0.1 | 0 | (0–0.3) | 0.001 | |
| Total gallop days | 0.8 | 0.3–1.1 | 0.3 | 0–0.8 | 0.9 | 0.4–1.1 | 0.8 | 0.3–1.1 | 0.001 | |
| Total cumulative distance (f) | ||||||||||
| Median | IQR ¥ | Median | IQR ¥ | Median | IQR ¥ | Median | IQR ¥ | |||
| Three-quarter pace | 18 | 7–34 | 18 | 9–28 | 31 | 16–52 | 14 | 6–31 | <0.001 | |
| Track gallop | 8 | 2–16 | 2 | 0–9 | 11 | 3–18 | 8 | 2–16 | <0.001 | |
| Jump-outs | 0 | 0–4 | 0 | 0–3 | 2 | 0–6 | 0 | 0–3 | 0.002 | |
| Trials | 0 | 0–5 | 0 | 0–2 | 0 | 0–4 | 0 | 0–5 | 0.15 | |
| Races | 0 | 0–5 | 0 | (0–30) | 0 | 0–11 | 0 | (0–30) | <0.001 | |
| Total gallop distance | 13 | 3–29 | 4 | 0–18 | 22 | 4–34 | 12 | 3–28 | 0.01 | |
| Average distance per week in training (f) | ||||||||||
| Median | IQR ¥ | Median | IQR ¥ | Median | IQR ¥ | Median | IQR ¥ | |||
| Three-quarter pace | 2.3 | 1.3–2.6 | 2.5 | 1.3–3.8 | 3.6 | 2.2–4.4 | 2 | 1–3.1 | <0.001 | |
| Track gallop | 1.1 | 0.3–1.5 | 0.2 | 0–0.9 | 1.1 | 0.5–1.4 | 1.2 | 0.4–1.6 | <0.001 | |
| Jump-out | 0 | 0–0.4 | 0 | 0–0.4 | 0.2 | 0–0.6 | 0 | 0–0.4 | 0.02 | |
| Trials | 0 | 0–0.4 | 0 | 0–0.1 | 0 | 0–0.4 | 0 | 0–0.5 | 0.11 | |
| Races | 0 | 0–0.4 | 0 | (0–2) | 0 | 0–0.7 | 0 | (0–2) | 0.001 | |
| Total gallop distance | 1.8 | 0.5–2.7 | 0.5 | 0–1.5 | 2.1 | 0.7–2.8 | 1.8 | 0.5–2.7 | 0.001 | |
| Training and racing milestones | ||||||||||
| Reached milestones | ||||||||||
| N | % | N | % | N | % | N | % | |||
| Three-quarter pace | 0.54 | |||||||||
| No | 44 | 13 | 5 | 18 | 12 | 14 | 27 | 11 | ||
| Yes | 305 | 87 | 23 | 82 | 72 | 86 | 210 | 89 | ||
| Track gallop | 0.06 | |||||||||
| No | 76 | 22 | 11 | 39 | 18 | 21 | 47 | 20 | ||
| Yes | 273 | 78 | 17 | 61 | 66 | 79 | 190 | 80 | ||
| Jump-out | 0.02 | |||||||||
| No | 192 | 55 | 16 | 57 | 35 | 42 | 141 | 59 | ||
| Yes | 157 | 45 | 12 | 43 | 49 | 58 | 96 | 41 | ||
| Trial | 0.26 | |||||||||
| No | 213 | 61 | 21 | 75 | 52 | 62 | 140 | 59 | ||
| Yes | 136 | 39 | 7 | 25 | 32 | 38 | 97 | 41 | ||
| Race | 0.001 | |||||||||
| No | 256 | 73 | 24 | 86 | 49 | 58 | 183 | 77 | ||
| Yes | 93 | 27 | 4 | 14 | 35 | 42 | 54 | 23 | ||
| Time to reach milestones (wks) | ||||||||||
| Median | IQR | Median | IQR | Median | IQR | Median | IQR | |||
| Three-quarter pace | 2 | 2–4 | 3 | 2–4 | 2 | 1–3 | 2 | 2–4 | 0.14 | |
| Track gallop | 4 | 3–6 | 5 | 4–7 | 4 | 3–6 | 4 | 3–5 | 0.06 | |
| Jump-out | 6 | 4–7 | 5 | 4–7 | 6 | 4–7 | 6 | 4–7 | 0.84 | |
| Trial | 8 | 6–10 | 7 | 5–13 | 9 | 8–10 | 8 | 6–10 | 0.36 | |
| Race | 11 | 8–12 | 11 | 7–15 | 10 | 8–13 | 11 | 8–12 | 0.98 |
Publisher’s Note: MDPI stays neutral with regard to jurisdictional claims in published maps and institutional affiliations. |
© 2021 by the authors. Licensee MDPI, Basel, Switzerland. This article is an open access article distributed under the terms and conditions of the Creative Commons Attribution (CC BY) license (http://creativecommons.org/licenses/by/4.0/).
Share and Cite
Crawford, K.L.; Finnane, A.; Greer, R.M.; Phillips, C.J.C.; Bishop, E.L.; Woldeyohannes, S.M.; Perkins, N.R.; Ahern, B.J. A Prospective Study of Training Methods for Two-Year-Old Thoroughbred Racehorses in Queensland, Australia, and Analysis of the Differences in Training Methods between Trainers of Varying Stable Sizes. Animals 2021, 11, 928. https://doi.org/10.3390/ani11040928
Crawford KL, Finnane A, Greer RM, Phillips CJC, Bishop EL, Woldeyohannes SM, Perkins NR, Ahern BJ. A Prospective Study of Training Methods for Two-Year-Old Thoroughbred Racehorses in Queensland, Australia, and Analysis of the Differences in Training Methods between Trainers of Varying Stable Sizes. Animals. 2021; 11(4):928. https://doi.org/10.3390/ani11040928
Chicago/Turabian StyleCrawford, Kylie L., Anna Finnane, Ristan M. Greer, Clive J. C. Phillips, Emma L. Bishop, Solomon M. Woldeyohannes, Nigel R. Perkins, and Benjamin J. Ahern. 2021. "A Prospective Study of Training Methods for Two-Year-Old Thoroughbred Racehorses in Queensland, Australia, and Analysis of the Differences in Training Methods between Trainers of Varying Stable Sizes" Animals 11, no. 4: 928. https://doi.org/10.3390/ani11040928