3.1. Descriptive Statistics
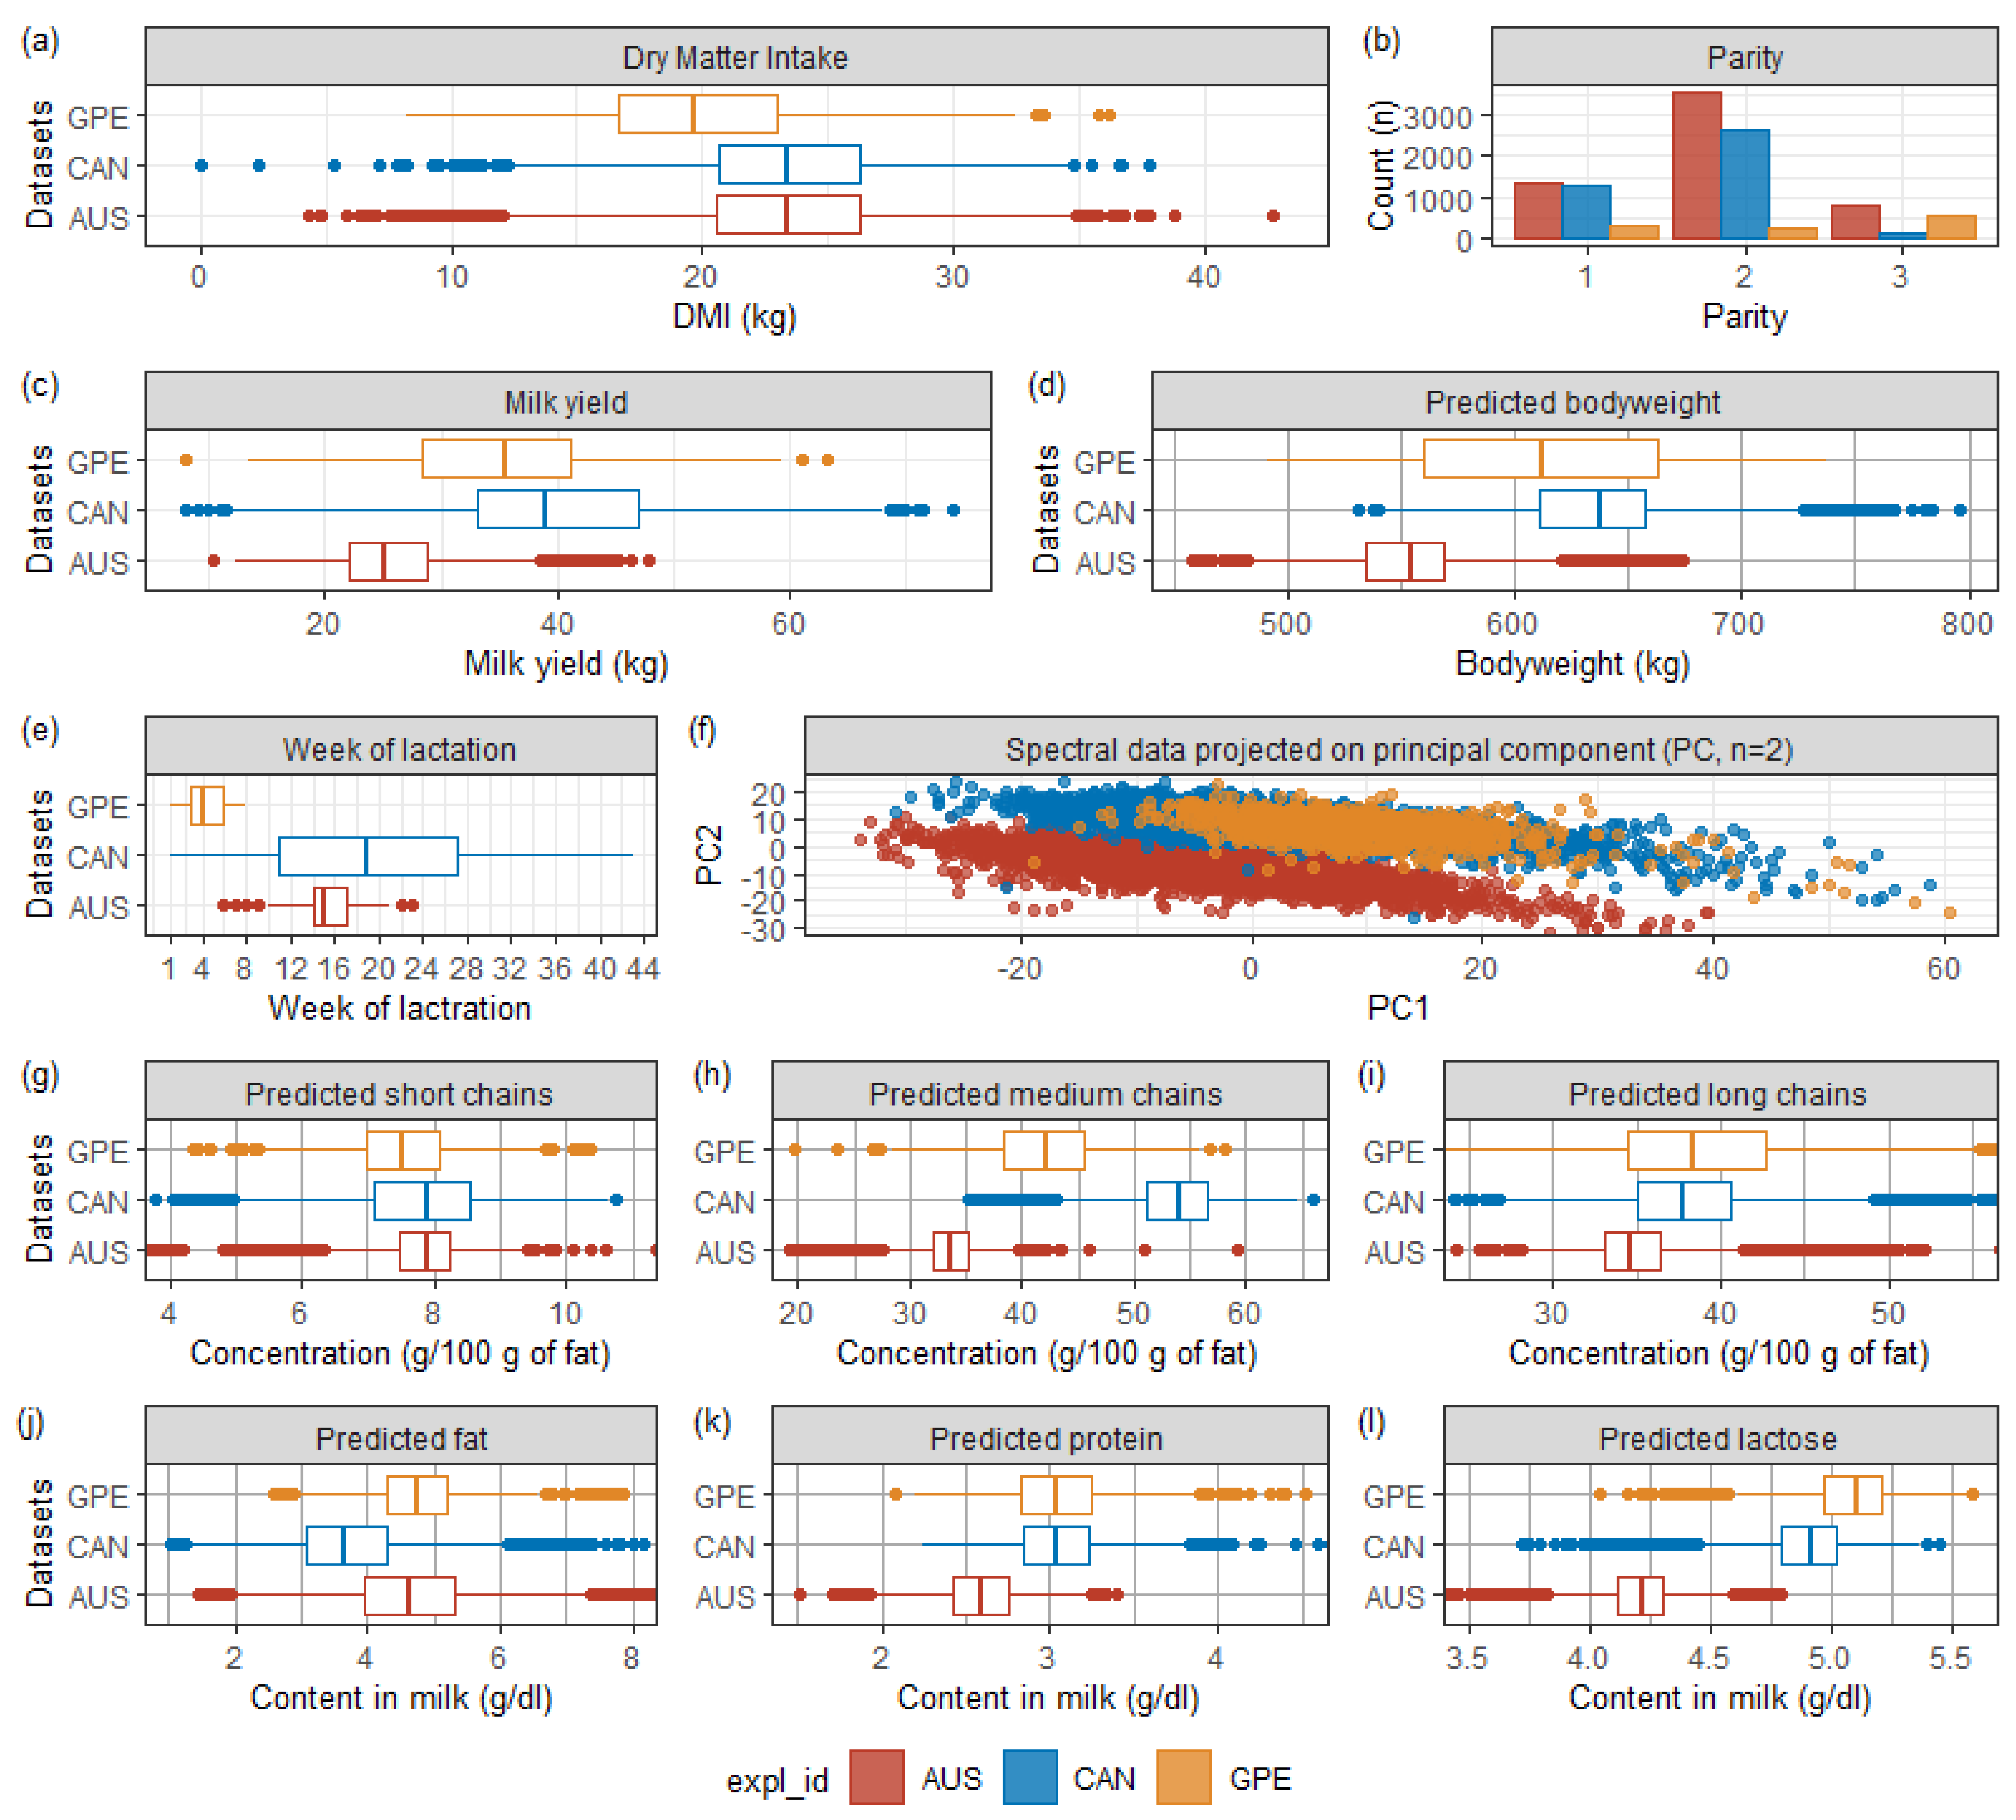
Figure 1 shows the distribution of data before cleaning. The corresponding tabular form of the descriptive statistics is provided in
Appendix A Table A1.
The 536 cows were unevenly distributed over 43 weeks of lactation and the three parity categories (first, second, and third+). Cows from GPE, AUS, and CAN were concentrated at the beginning (week 1–8), middle (week 6–23), and throughout the lactation period (week 1–43), respectively. Significant differences appeared, especially on milk yield and MIR spectral data, which directly affected the predictions of bodyweight, fatty acids, and milk composition (protein, fat, and lactose).
Regarding the differences in the milk analysis data, AUS dairy cows’ lower milk production may affect the milk composition and indirectly the MIR spectra. Besides, since the AUS dataset spectral measurement was not made at the same absorbance points as GPE and CAN, due to the use of different spectrometers (i.e., model 2000 (Bentley Instruments, Chaska, MN, USA) for AUS; FT2, or FT6000 spectrometers (Foss Analytics, Hillerød, Denmark), or standard lactoscope FT-MIR automatic (PerkinElmer, Waltham, MA, USA) for {CAN U GPE}), we performed a linear interpolation of the AUS spectral data to make the measurement coincide. Additionally, we standardized the interpolated AUS data with an imperfect and far-in-time conversion table. These combined factors explained why the concentration of AUS spectral points projected onto the first two principal components in
Figure 1f, calculated from a principal component analysis on the {AUS, CAN, GPE} data, was so far apart.
Regarding the DMI, as suggested by
Figure 1, an F-test confirmed that the three samples’ DMI means were significantly different (
p-value < 0.0001). An unpaired t-test revealed that AUS and CAN shared a similar DMI mean value (
p-value = 0.37) while the mean values for both combinations AUS vs. GPE and CAN vs. GPE were significantly dissimilar (
p-value < 0.0001). After cleaning the dataset (i.e., spectral outliers and MY, and DMI out of ranges), there were 10,711 records (−2.30%) remaining, of which 5629 AUS (−1.99%), 4063 CAN (−1.02%) and 1019 GPE (−8.61%), for a total of 534 cows.
3.3. Between Datasets Prediction Performances
Models M1 to M7 (
Table 2) considered each group of predictors individually to measure their contribution in explaining DMI variance. The coefficient of determination (R
2), which indicates the square of linear correlation between the reference values and their predictions, is a good indicator for estimating the underlying model’s contribution. We thus examined the cross-validated R
2 (R
2cv) to select the best contributors among the groups of predictors. For each of those models, R
2cv varied depending on the underlying training dataset (AUS, CAN, or GPE). Nevertheless, when taken individually to explain the DMI variance, the highest contributor on average was milk MIR (26%) following by MY (23%), pBW (23%), PRT (19%), and pFA (18%) (
Table 2).
Shetty et al. (2017) [
11] and Lahart et al. (2019) [
14] both achieved higher contributions for MY and MIR (
Table 1), while those obtained by Wallén et al. (2018) [
15] were lower than those observed in
Table 2. However, they all showed how relevant those variables were for DMI prediction. In a predictive model, the data quantity and structure, such as homogeneity, processing, or quality of measurement, might directly impact the inner volatility and, consequently, the coefficient of determination [
41]. Such differences existed between the studies previously mentioned and ours, Shetty et al. (2017) [
11] smoothed their data by computing week-of-lactation averaged variables (DMI and every other related explicative variable), while Lahart et al. (2019) [
14] used an adapted n-alkane C
33-C
32 technique [
42] to estimate animals’ DMI.
Specifically for the GPE data,
Table 2 shows a strong relationship between DMI and MY (R
2cv = 37%), directly related to the animal’s production function. GPE data focused on early lactation (weeks 1 to 8) while the animal experienced mechanical feeding difficulties due to a post-gestation rumen reduced in size [
5]. While the rumen was regaining its size, the animal, which slowly improved its ability to feed, moved towards its lactation peak, increasing its milk production. Therefore, even if the cow met a negative energy balance [
5,
6], drawing on its resources to produce [
7], its quantity of DMI and milk production evolved in the same linear direction in early lactation, since the peak of lactation arises between 4 and 8 weeks postpartum, while the DMI usually peaks between 10 and 14 weeks [
1]. Consequently, the M5 regression lines’ slopes (β
1) were positive for GPE data (β
1,MYGPE = 2.75) and weaker for AUS and CAN data (β
1,MYAUS = 1.52, β
1,MYCAN = 1.79), which covered lactation periods spreading out beyond the peak (
Figure 1), thus mitigating the relationship between DMI and early lactation effect, such as the MIR contribution, which were lower for AUS (R
2cv = 0.20) and CAN (R
2cv = 0.24) relatively to GPE (R
2cv = 35%).
The magnitude of such variability was observed across previous studies (
Table 1), where R
2cv fluctuated between 0.14 for Wallén et al. (2018) [
15], 0.37 for Shetty et al. (2017) [
11], and 0.48 for Lahart et al. (2019) [
14]. For the present study, the factors making R
2cv vary significantly between the calibrations directly related to the data structure, such as coverage of lactation stages, parity, or the kinds of diets.
In M2 and M4, parity and predicted bodyweight were separately involved in Ordinary Least Square (OLS) regressions. Whatever the datasets, such as for the milk yield, both features showed a positive relationship with DMI, indicating that DMI was higher, on average, for older and heavier animals. The National Research Council equation already revealed the positive relationship between DMI and both milk yield and bodyweight [
1,
13], while higher parity cows are heavier on average [
43], they would ingest more dry matter.
Table 2 reveals that fatty acids profile in milk fat, being predicted from milk MIR spectrometry (pFA), presented a lower R
2cv than milk MIR spectrum in predicting DMI, which was explained by the supplementary information brought by MIR spectra such as protein, lactose, or fat [
22] content in milk. Indeed, although less important than the other variables in the explanation of DMI,
Table 2 quantifies milk composition (pMC: fat, protein, lactose) contribution with non-zero R
2cv. Furthermore, we observed that R
2cv for linear regressions involving MIR or pFAs were higher for GPE, whose dataset exclusively described early lactation than for AUS or CAN datasets. From the first week postpartum to the twelfth, short-chain C10:0 and medium-chain C12:0, C14:0, and C16:0 concentrations in milk increase while long-chain C18:0, C18:1 cis9 decrease [
23]. These changes coincide with the rising of the DMI to its peak undergone by dairy cows in early lactation.
Models M8 to M11, in
Table 2, displayed simple mixes of these predictors. R
2cv increased for M8 to M10, showing a variables’ complementary in explaining the DMI variability for PRT, pBW, MY combined with MIR, even if pBW were predicted using those other features [
21]. On the other hand, M11 and M1 cross-validated statistics were very close or similar, which was explained by the redundancy of pFA compared to milk MIR spectra.
M12 to M14 increased R2cv for models calibrated with AUS and CAN datasets, manifesting synergy between pBW, MY, PRT, and MIR. Besides, M12, relatively to M13 and M14, provided good performance and consistency in out-of-sample country-independent validation. We sought models with good external metrics because they are essential features linked to robustness and generalization, making M12 particularly interesting.
The combination in M15 brought little interest in terms of cross-validation metrics compared to M16, nor did it fully increase M12 robustness. The interest of augmenting M15 with WOL, which was far from being the most important variable when taken individually, was not to improve the cross-validation statistics but to enhance the model’s capacity to generalize.
All other additions of variables to M16 had little or no impact on cross-validation metrics. The interest was instead on the improvement of the out-of-sample country-independent validation. In addition to M12, M15, and M16, the models M19, M20 and M22 seemed interesting as potential good generalizers. Conclusively, we decided to deepen the analysis of these models.
3.4. Prediction Performance Using Multiple Country Approach
Table 3 presents the models M12, M15, M16, M19, M20, and M22 calibrated using the data combination {AUS U CAN}, {AUS U GPE}, {CAN U GPE}, or {AUS U CAN U GPE}. Only the cross-validation metrics were available for the latter as all the data was used for models’ training.
Regarding the statistics reported in
Table 3, the advantage of moving from model M12 to M15 by adding variable MY was straightforward because (i) every metrics were improved and (ii) MY’s VIP score was above 1 (VIP
MY = 4.41), meaning that the variable was important enough for the modelization to be kept [
44]. The advantage of adding the ordinal variable WOL was not so evident as it was with MY. The cross-validation statistics barely stayed unchanged, while out-of-sample country-independent validation went wrong except for the calibration {CAN U GPE}. The analysis of the VIP score indicated that some polynomial transformations of WOL were above 1, especially the first three (VIP
wol.L = 1.74, VIP
wol.Q = 2.00, VIP
wol.C = 1.54, with L, Q, and C respectively standing for linear, quadratic and cubic), suggesting an interest of going forward with WOL.
By analyzing M19 and M20, the advantage of adding pFA or pMC to M16 was not directly apparent (
Table 3). Indeed, RMSEcv did not change, and R
2cv were quite roughly the same, which meant neither pFA nor pMC added some value to model calibration regarding the cross-validated statistics, mainly because spectra contain all the information regarding milk FA and main components, making those variables redundant and less informative. However, the out-of-sample country-independent performance was better for M20 than M16, suggesting that pMC made the model M20 more generalizable than M16. However, M19 VIP score for pFA were all greater than one (1.25 ≤ VIP
FA ≤ 2.37) while only protein and lactose were greater than, or approached one in M19 (VIP
fat = 0.699, VIP
protein = 1.27, VIP
lactose = 0.989). Furthermore, the analysis of M22 revealed that VIP scores for pFA (1.26 ≤ VIP
FA ≤ 2.38) systematically outweighed pMC scores (VIP
fat = 0.679, VIP
protein = 1.19, VIP
lactose = 1.06) when taken simultaneously in modelization to predict DMI, suggesting that it was more relevant to consider pFA rather than pMC in a model already involving MY, pBW, WOL, PRT, and MIR.
With equivalent performance, both in out-of-sample country-independent and cross-validation, we preferred M19 to M22 because it was the most parsimonious. Consequently, we chose to keep model M19 (PRT + MIR + pBW + MY + WOL + pFA) for ANN regression.
3.5. Artificial Neural Network Regression Models to Predict the Dry Matter Intake
Table 4 describes the results obtained for the calibration of ANN models incorporating the predictors of M19. However, to reduce the number of features, MIR spectral data were replaced by their PLS factors (DMI~MIR), explaining 99% of the spectral variance.
With a maximum number of nodes settled to 5, the ANN converged to a two-node single-layer perceptron for {CAN U GPE}, {AUS U CAN U GPE}, and to a three-node single-layer perceptron for {AUS U CAN}, and {AUS U CAN}. With R
2cv interval of (0.39 ± 0.04, 0.51 ± 0.06) and RMSE
cv within (3.00 ± 0.17 and 3.46 ± 0.15) kg, the cross-validation metrics were almost identical between PLS (
Table 3) and the ANN (
Table 4). However, the out-of-sample country-independent validation metrics were systematically better for the ANN, with values ranging from 3.69 to 5.08 versus 3.73 to 6.03 kg for PLS M19 (
Table 3). For the model including the entire dataset, the final RMSE
cv was of 3.25 ± 0.13 kg.
The PLS M19 and ANN M19 models’ predictions were highly correlated (95%). However, the DMI predicted using the NRC equation (NRC2001) [
1,
13] were moderately correlated with the predictions obtained from PLS M19 (0.60) and ANN M19 (0.57). While NRC2001 featured an accuracy of 1.84 kg [
1], it output an RMSE of 4.84 kg when applied on {AUS U CAN U GPE}. It would tend to show that the error associated with NRC2001 was higher than those of models PLS M19 (RMSE
cv = 3.27 ± 0.08 kg) and ANN M19 (RMSE
cv = 3.25 ± 0.13 kg). However, although the validation of PLS M19 and ANN M19 was conducted as cow-independent 10-fold cross-validation repeated ten times, in order to reduce overfitting associated with an overly complacent model with the calibration data, the validation sets still retained nuances belonging to the whole sample that benefited the internal evaluation of the models’ performance. A fairer comparison would have compared PLS M19, ANN M19, and NRC2001 on a fully independent dataset. To this end, we used the out-of-sample country-independent RMSE (RMSE
v) of PLS M19 and ANN M19 obtained when calibrated with {AUS U CAN}, {CAN U GPE} and {AUS U GPE} and those of the NRC2001 equation out of the same datasets.
Table 5 shows the results achieved.
The ANN M19 performance was better than PLS M19. This result was in line with the interest in using ANN regression rather than a linear model such as PLS to predict DMI with the data at hand, as showed by Soyeurt et al. in predicting the lactoferrin content in milk [
20]. The differences between NRC2001 and ANN M19 were more nuanced. Sometimes the out-of-sample country-independent performance was definitely in favor of ANN M19, sometimes in favor of NRC2001.
The worst out-of-sample country-independent performance was achieved when predicting DMI of AUS data using ANN M19 calibrated with {CAN U GPE}. The explanation lay in the difference in the MIR spectra and milk yield distributions between the calibration and the validation data (AUS). Regarding milk analysis, to make the output of the different devices coincide (i.e., model 2000 (Bentley Instruments, Chaska, MN, USA) for AUS; FT2 or FT6000 spectrometers (Foss Analytics, Hillerød, Denmark), or standard lactoscope FT-MIR automatic (PerkinElmer, Waltham, MA, USA) for {CAN U GPE}), we performed a linear interpolation of the {AUS} spectral data to get it in the same absorbance domain than {CAN U GPE}. Besides, we did not conduct rigorous standardization of MIR spectra such as described by Grelet et al. [
26], but instead, we approached it using a delayed standardization table. Both approximations in milk analysis measurement largely explained the difference between {CAN U GPE} and AUS spectral points (
Figure 1). Conclusively, the discrepancy between both datasets’ milk yield and spectral points harmed the out-of-sample country-independent performance even more as these predictors’ contributions were among the most important (
Table 2). On the other hand, the NRC2001 equation did not suffer from this lack of representativeness since the model’s evaluation was established on a dataset covering various horizons, eight years of collection, and a variety of 100 different diets, whose data were selected from 25 papers of which 23 used Holsteins [
1].
The out-of-sample country-independent performance of ANN M19 when validated on GPE was also to be contrasted. Indeed, the calibration data {AUS U CAN} covered 43 weeks of lactation with little data at the beginning. However, the validation (GPE) included early lactation data when the milk’s fatty acids profile changed due to NEB [
23]. Regarding the calibration data,
Figure 1 shows a shift of the medium-chains pFA distribution mean, whose representatives in ANN M19 were C12:0, and C14:0, being among the three fatty acids with the most significant contribution to DMI, the other being the long-chain C18:1 cis-9 (
Figure 2). Besides, it was interesting to see that the calibration of a variant ANN M19 model with {AUS U CAN} data, whose constructs were identical to ANN M19 but without pFA, revealed an RMSE
v similar to NRC2001, of 3.90 kg (results not shown).
Ultimately though their dissimilarity, the calibration using {AUS U GPE} featured an RMSEv of 3.69 kg despite the CAN data spread out over 43 weeks of lactation while the calibration stopped 23 weeks. The previous result suggested that the end of the lactation DMI curve was monotonic and somewhat linear since the linear extrapolation on out-of-domain WOL data fitted well, according to RMSEv.
3.6. Large Scale Dry Matter Intake Prediction
The current study’s DMI prediction should be considered an indicator, bringing valuable information for management or genetic purposes based on the observed performance. To assess the relevancy, we implemented PLS M19 and ANN M19 on a large-scale DHI database to compare the observed trends with those found in the literature.
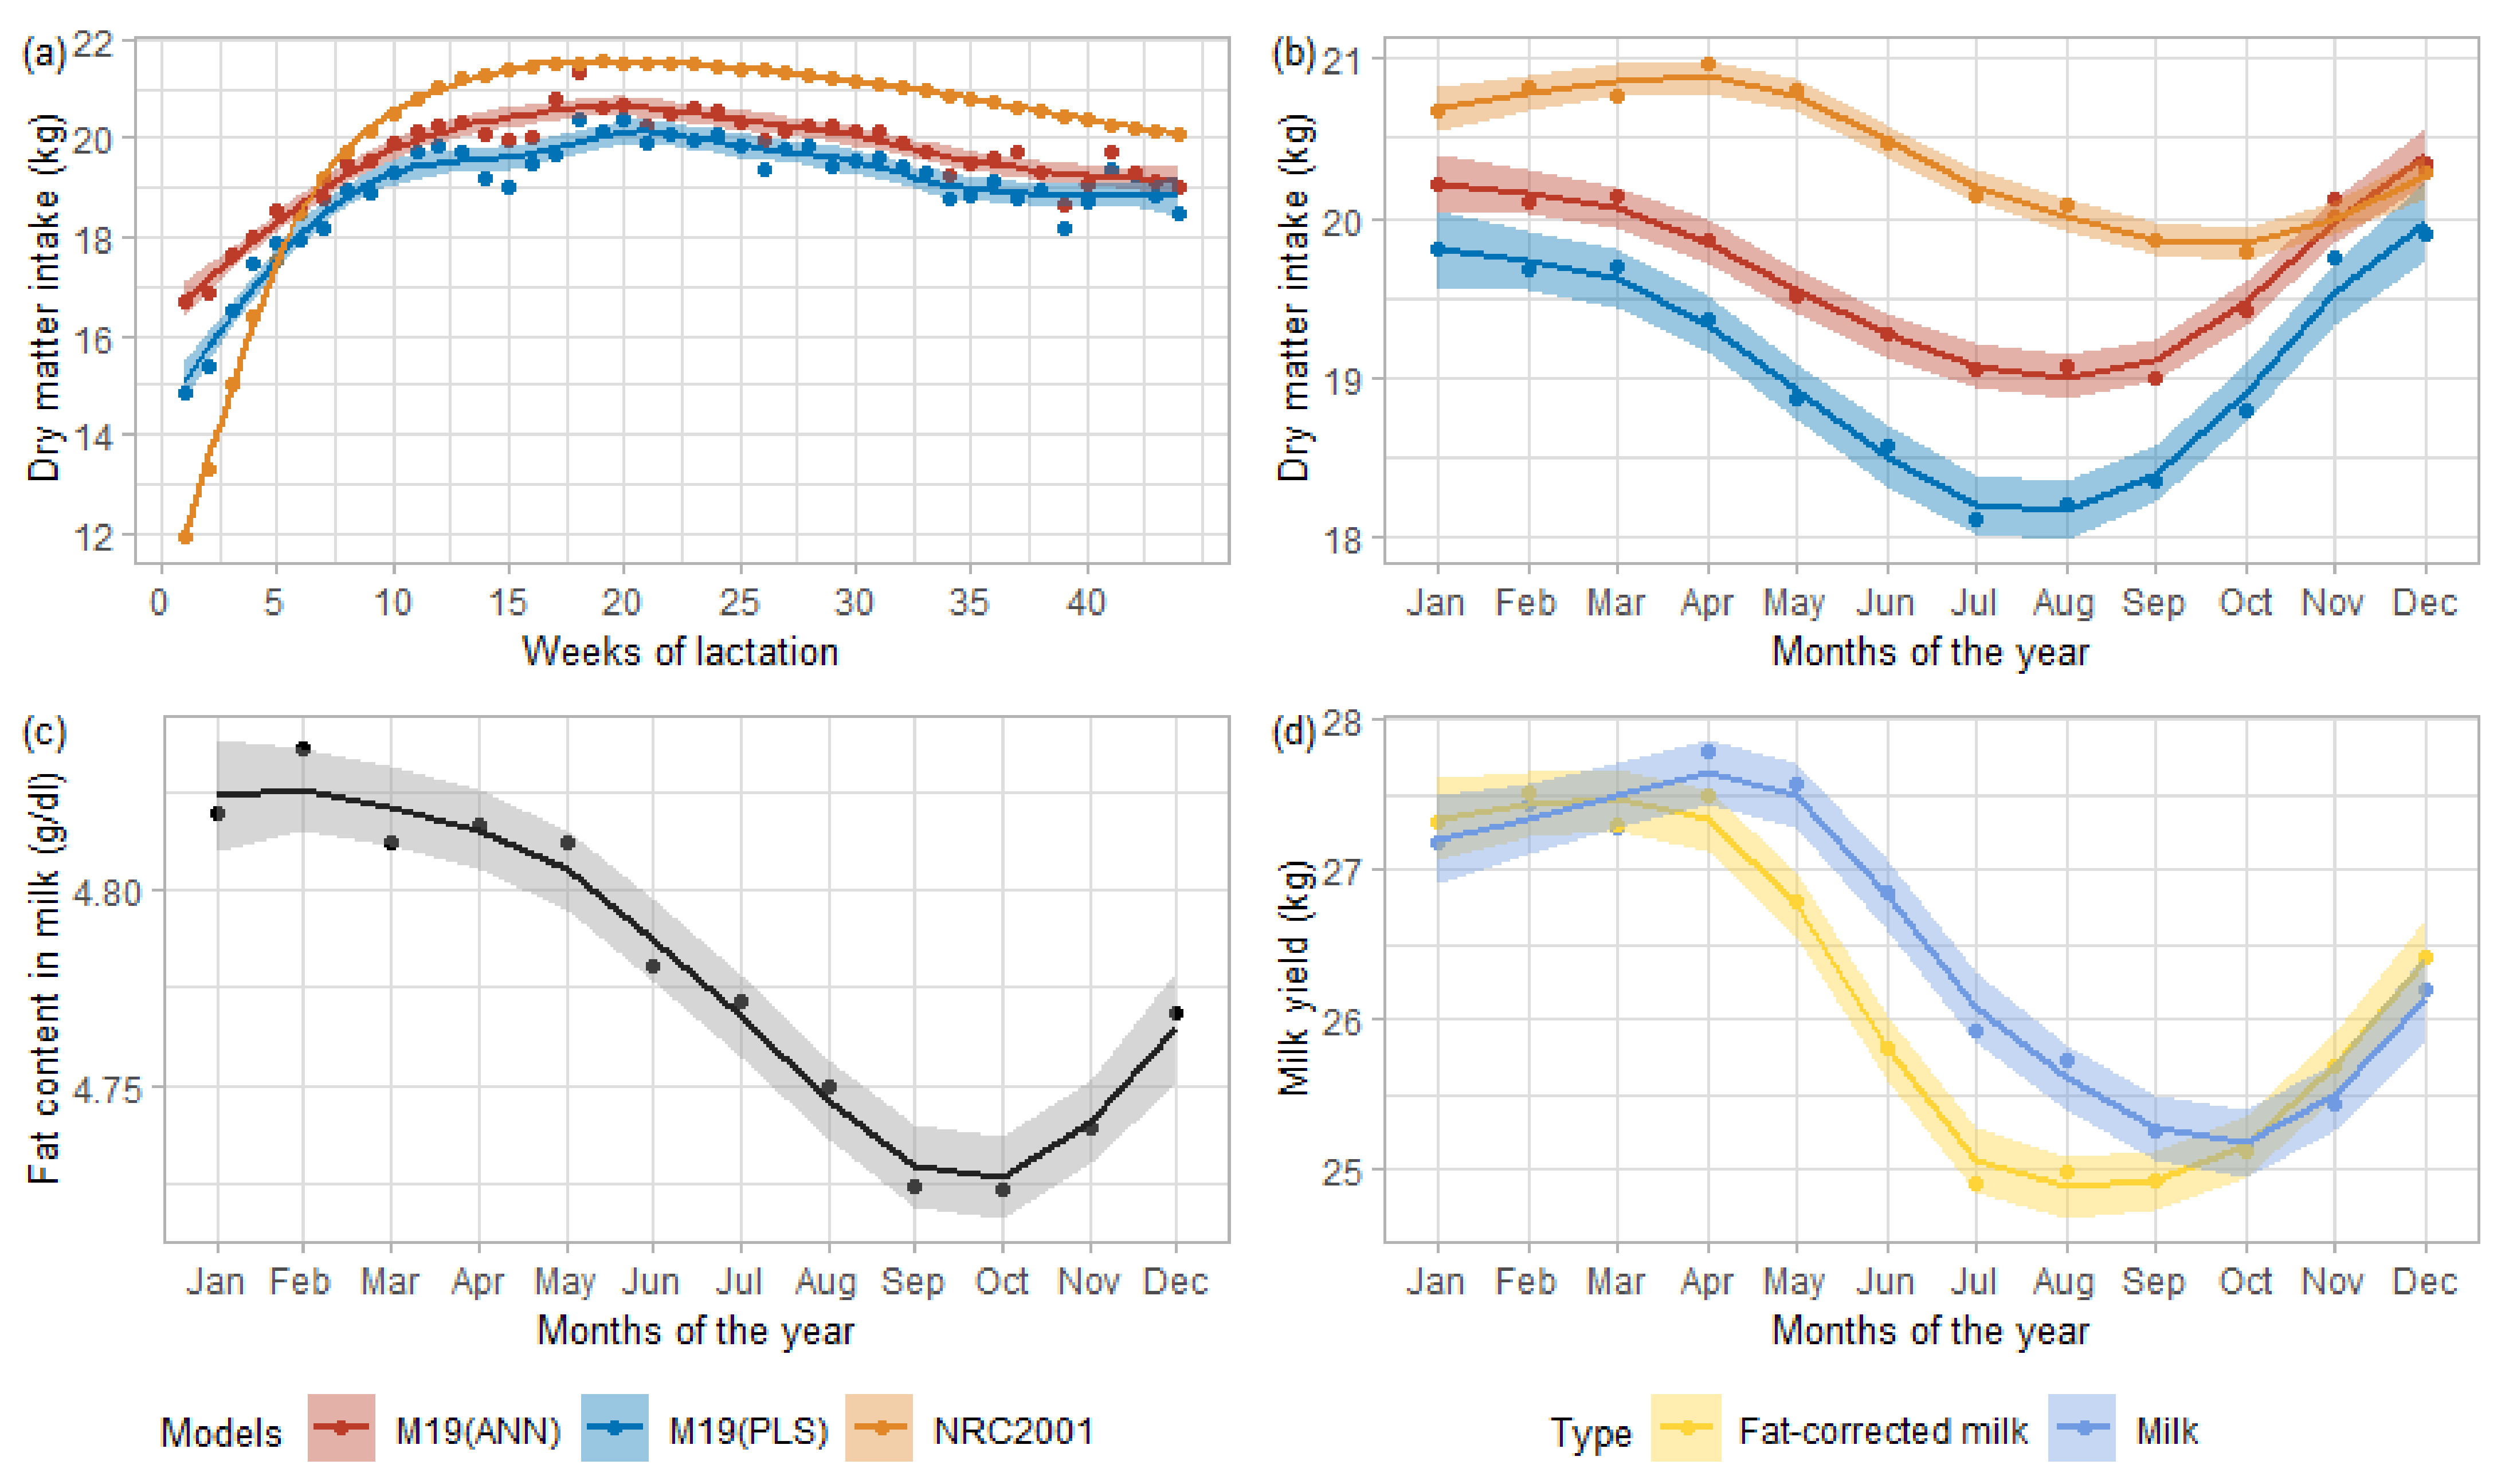
Figure 3 presents the DMI predictions averaged by weeks of lactation or by test months.
Figure 3a shows the evolution of these averaged predictions per week of lactation, all parity included.
Figure 3b displays the evolution of averaged DMI predictions throughout the year, from January to December.
Figure 3 also describes the evolution of fat proportion in milk (
Figure 3c) and the monthly averaged milk yield (
Figure 3d, blue) and 4% fat-corrected milk yield (
Figure 3d, yellow) of DHI data.
According to the smoothing curves in
Figure 3a, for each model, the minimum values of the average predicted DMI appeared in the very early lactation (first week), and the peak arose between weeks 15 and 20, to then decrease until the end of lactation. This shape corresponded to the expected trend, although the peak DMI should have occurred around weeks 10 to 14 [
1]. Unlike the trends, the models’ amplitudes widely varied between the NRC2001 and M19 models (ANN or PLS). This magnitude might originate from the underlying calibration data. Those used to evaluate the NRC2001 equation ranged from about 12.5 to 25 kg [
1] against 18 to 23 kg on average for the {AUS U CAN U GPE} data. The bigger opening between early-lactation DMI and its peak for NRC2001 data explained the more extensive range of DMI predicted by NRC2001 than M19 (PLS or ANN).
It was expected that the yield of milk and its solids such as fat, protein, or lactose increase on average when cows were offered indoors mixed ration than when they were grazing outdoor in pasture [
45]. Besides, higher milk production was associated with higher DMI [
39]. Conclusively outdoor grazing would imply lower milk and fat yield, which in turn would indicate lower DMI. These effects were observed through
Figure 3b–d, with the monthly averaged predicted DMI (b) that dropped in conjunction with fat content (c) and milk yield (d). The monthly averaged fat curve started to decrease slowly around February-March, indicating a diet change. M19 models (ANN and PLS) showed the same trend starting between February–March in
Figure 3b, while the averaged predicted NRC2001 DMI started to decline from April, driven by a fall in the 4% fat corrected milk. We could associate this difference between the equations with the use of MIR spectra in PLS and ANN M19, in which fat, lactose, and protein were highly related [
22]. Furthermore, M19 models also used fatty acids in their predictive equations of which their proportions in milk fat related to the use of pasture or diet in general [
40].


 ,
, 