1. Introduction
Monitoring ventilation is essential to ensure adequate gas exchange during general anaesthesia. Ventilation is defined as the process through which a volume of gas is transported to and from the lungs. The gas volume that it is inhaled during a normal tidal breath is called tidal volume (VT). This volume can be divided into a part that takes part in gas exchange (alveolar tidal volume, VTalv) and one that does not (dead space). Dead space volume includes airway dead space (VDaw; volume in conducting airway) and alveolar dead space (volume in ventilated but not perfused alveoli).
Changes in VT
alv correspond to changes in alveolar (P
ACO
2) and arterial partial pressure of carbon dioxide (P
aCO
2), a variable than can be assessed via blood gas analysis and represents the gold standard of ventilation monitoring. However, blood gas analysis is an intermittent way to monitor ventilation. In clinical settings, ventilation adequacy on a breath-by-breath basis is assessed using end tidal carbon dioxide (P
ETCO
2). End-tidal CO
2 values (in kPa or mmHg) are obtained non-invasively via capnography and are used to monitor adequacy of ventilation. In anaesthetised horses, however, ventilation/perfusion (V/Q) mismatch develops rapidly after induction [
1]. Any increase in V/Q mismatch causes a broadened partial pressure gradient between P
ETCO
2 and P
aCO
2. Therefore, in anaesthetised horses, P
ETCO
2 is not a reliable indicator of ventilation adequacy [
2,
3].
Spirometry assesses gas flows, airway pressures and tidal volumes and allows continuous monitoring of respiratory mechanics [
4]. For equine application, only few spirometers have been described. Some examples include the Fleish pneumotachograph, the ultrasonic-spirometry and the thermal mass flowmeter [
5,
6,
7]. A piston driven large animal ventilator also measures tidal volume but has been shown to underestimate it by up to 20% [
8]. To accommodate for the large flows and volumes encountered during large animal anaesthesia, human spirometry equipment has been adapted and/or remodelled for equine application [
9,
10,
11,
12,
13]. For instance, a flow partitioning device can be used to split the flow in four smaller parts enabling measurement of larger volumes [
9,
10]. To date continuous spirometry monitoring is not yet consistently applied in equine clinical anaesthesia.
Electrical impedance tomography is a non-invasive thoracic imaging technology which measures the change in electrical potentials resulting from weak alternating currents applied at the surface of the body using an electrode belt [
14]. The potential difference fluctuation between pairs of electrodes enables measurement of the change in electric impedance (∆Z
breath) that occurs as air moves in and out of lungs over respiratory cycles [
15,
16].
The relationship between ∆Z
breath, measured with EIT, and VT, measured with spirometry, has been investigated under standardised experimental conditions in a variety of species including dogs, pigs, humans and horses [
17,
18,
19,
20]. A strong relationship was found in dogs and pigs when incremental volumes were delivered [
17,
18] and this relationship persisted regardless of body position and anthropometric features in a human study [
19]. Recently, EIT was applied in anaesthetised and mechanically ventilated horses to compare ∆Z and VT
SPIRO under experimental conditions, using a wide range of delivered tidal volumes between 4 L (8 mL/kg) and 10 L (20 mL/kg) [
20]. This equine study also described a strong linear relationship between the two variables. Based on these finding, it was suggested that EIT may offer the potential to estimate tidal volume based on increases and decreases in impedance [
20].
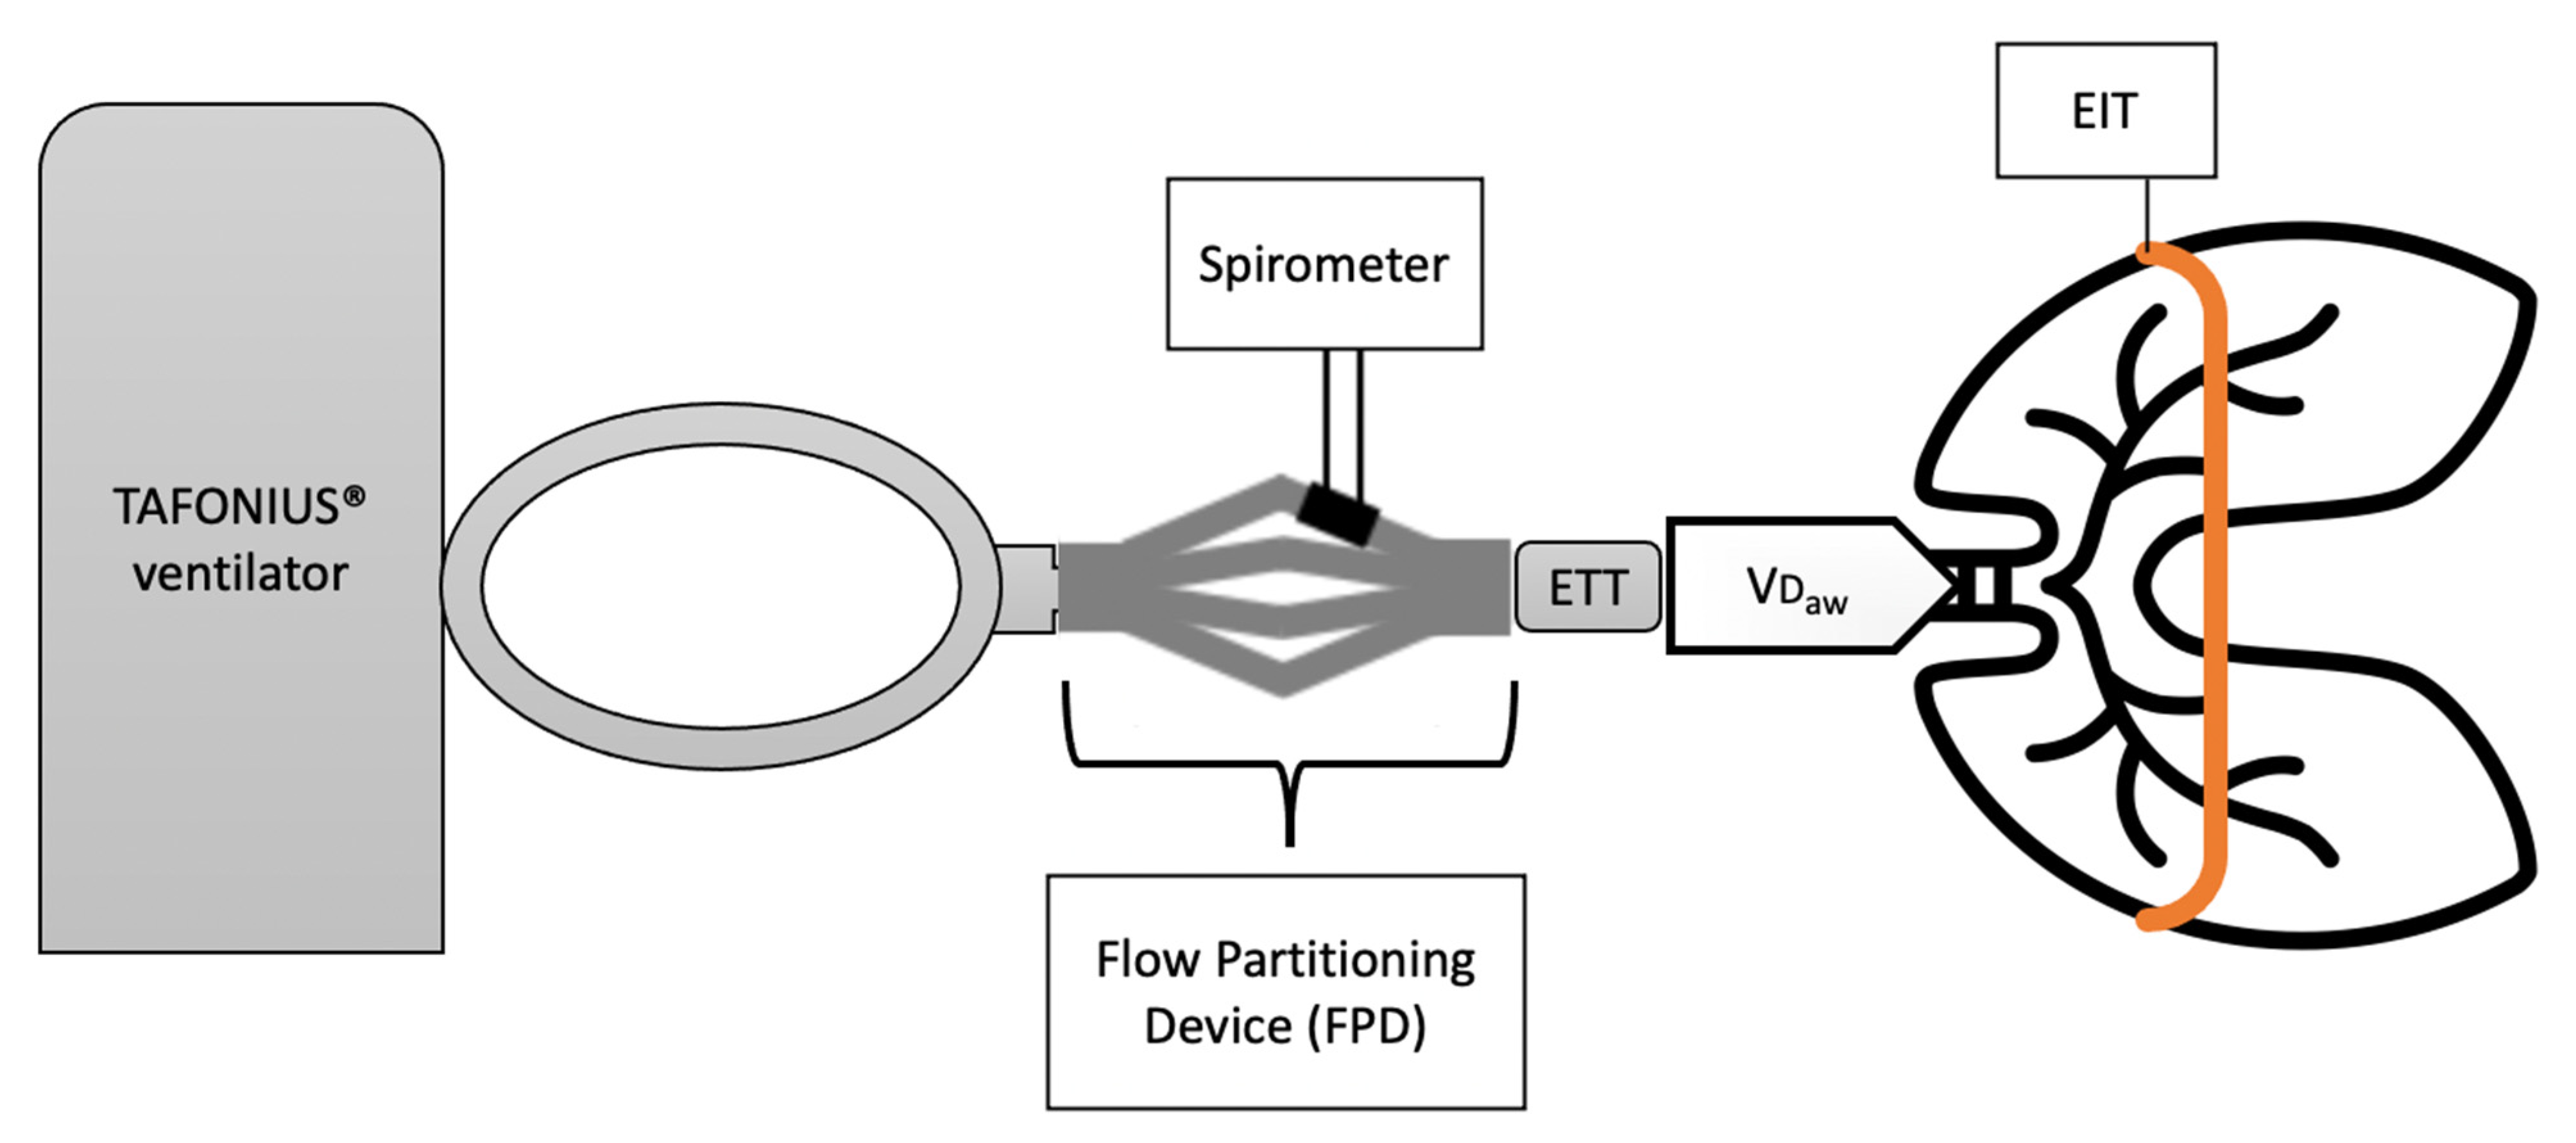
It is important to highlight that spirometry and EIT operate at different levels (
Figure 1). Spirometric measurements are taken proximally, at the level of the incisors, and comprise the volume in the endotracheal tube and conducting airways where gas exchange does not occur (equipment and VD
aw). In contrast, EIT represents a cross-sectional area of the lungs taken at the level of the 5–6th intercostal space and is unaffected by equipment and VD
aw. Dead space volumes can be derived from volumetric capnography (VCap). Volumetric capnography plots the expired CO
2 concentration over the exhaled volume of a single breath and uses Fowler’s method to calculate VD
aw and VT
alv [
21,
22]. For large animal applications, volumetric capnography and spirometry measurements are made possible by a flow partitioning device (FPD) [
2,
8,
10].
The advantages of EIT over spirometry are that it provides continuous breath-by-breath measurements without the use of a face mask or intubation of the patient. EIT also avoids the drawbacks of spirometry, for equine applications, by accommodating large tidal volumes without the need to adapt existing equipment and not increasing equipment dead space.
However, as it is not yet an established technology in veterinary medicine, EIT is a highly expensive monitoring tool for routine clinical anaesthesia.
The first aim of this study was to confirm the findings of the experimental equine study and determine the relationship ∆Zbreath and VT measured by spirometry (VTSPIRO) in horses anaesthetised for clinical purposes, over progressive increases in clinically relevant delivered tidal volumes (Part 1). It was hypothesized that a positive linear relationship between ∆Zbreath and VTSPIRO would be present in all horses.
The second aim was to use this relationship to estimate tidal volume (VT
EIT) in litres from measured ∆Z
breath and compare the estimated VT
EIT with the actual measured VT
SPIRO (Part 2). It was hypothesised that VT
EIT would have good agreement with VT
SPIRO with limits of agreement within 20% of the measured VT [
23,
24].
To the authors’ knowledge, this is the first study in which the relationship between ∆Zbreath and VTSPIRO was tested over a clinically relevant range of tidal volumes using a stabilization period between changes in the delivered volume. It is also the first study to estimate VT in litres from ∆Z measurements.
2. Materials and Methods
This study was approved by the Animal Ethics Committee of Murdoch University (permit number R3023/18) and performed according to the Animal Welfare Act of Western Australia (2003). All animals were cared for according the Australian code for care and use of animals for scientific purposes (2013). In addition, informed owner consent was obtained.
2.1. Animals
A total of 26 healthy, adult horses (ASA I and II), with no evidence of pulmonary disease, presenting for elective procedures requiring dorsal recumbency, were enrolled in the study. Horses were defined as healthy based on medical history, physical examination and routine pre-anaesthetic haematologic tests. Horses with ASA physical status greater than II, with abnormal clinic–pathologic findings or physical evidence of pulmonary disease, were excluded from the study. Young or unhandled horses, or those with a difficult temperament were considered unsuitable to wear an EIT electrode belt and excluded from the study.
2.2. Anaesthesia
Horses were fasted for at least 12 h before induction of anaesthesia but had free access to water until premedication. A 14-gauge catheter was placed in the jugular vein, on the morning of the procedure. The anaesthetic protocol (premedication and induction) was tailored to meet the specific needs of each animal and was left to the discretion of the anaesthetist in charge (
Table S2). Orotracheal intubation with cuffed silicone endotracheal tubes (ETT) was performed in all horses after induction. The horses were then hoisted into the surgical theatre and positioned in dorsal recumbency on the padded operating table.
The ETT was connected to a large animal ventilator (Tafonius Junior; Vetronic, UK) and volume-controlled mechanical ventilation (CMV) started.
Anaesthesia was maintained with isoflurane (IsoFlo, Zoetis Australia Pty Ltd.) delivered in oxygen. End-tidal isoflurane (ETiso) concentration was adjusted based on anaesthetic depth. Anaesthetic depth was assessed in relation to eye position, presence or absence of palpebral reflex, nystagmus and/or tear production. Routine monitoring was performed using a multi-parameter monitor (Solomon system, Vetronic, UK), and included electrocardiography, invasive blood pressure, pulse-oximetry, end-tidal carbon dioxide partial pressure, and concentration of inhaled and exhaled isoflurane. Physiological variables, expired and inspired agent % and ventilatory setting were recorded manually every 5 min. A catheter was inserted in the facial artery for invasive monitoring of blood pressure and blood gas analysis. Hartmann’s solution (Baxter Healthcare, Australia) was administered throughout the general anaesthesia at the rate of 5–10 mL/kg/hour. If mean arterial pressure (MAP) decreased below 70 mmHg, dobutamine (Hospira Pty Limited, Australia) was infused at 0.5–1.5 µg/kg/min IV and titrated to maintain MAP between 70 and 80 mmHg.
2.3. Instrumentation
The chest circumference of each horse, at the level of the 5th and 6th intercostal space, was measured and recorded. Body condition score (BCS) was assessed from 1 to 9 as described by Henneke et al. [
25]. After premedication, nonconductive ultrasound gel was applied on the unclipped skin around the thorax between the 5–6th intercostal space, directly behind the scapula. The custom made EIT belt was placed, under slight tension, around the thorax on top of the gel [
26]. An elastic bandage was placed over the EIT belt to maintain its position and ensure all electrodes were in firm contact with the skin during induction and hoisting. The position of the belt and contact of the electrodes were visually inspected and corrected before the horse was positioned on the table. Once the horse was positioned on the surgical table, CMV was started. The start of CMV represented the beginning of the study. Initial ventilatory settings were set as follows: VT = 10 mL/kg body weight; respiratory rate (
fR) = 8 breaths/min; inspiratory:expiratory time (I:E) = 1:2; positive end-expiratory pressure (PEEP) = 0 cmH
2O. The belt was then connected to the EIT device and data recorded using a dedicated software package (BBVet, SenTec, Landquart, Switzerland).
The accuracy of the used human spirometer (NICO, Respironics Inc. Murrysville, Pennsylvania, PA, USA) was verified with a calibration syringe. For the verification, volumes ranging from 100 mL to 500 mL were delivered in stepwise 100 mL increments. To enable the application of standard human spirometry to large animal anaesthesia, a Flow Partitioning Device (FPD) was used. The FPD was inserted between the Y-piece of the breathing system and the ETT. As the name suggests, this device splits the flow into four parts and directs it through four spirometry connectors, one of which is coupled with the spirometry monitor whereas the other were sealed to prevent leakage [
9,
10]. In order to correct for the flow splitting from the FPD, all volume measurements were multiplied by 4. The final set-up is represented in
Figure 1.
2.4. Data Collection
Prior to data collection, leak volume was assessed and corrected if required. For this purpose, the difference between inspiratory and expiratory tidal volume was calculated. Additionally, the spirometry flow-volume curves were inspected. A difference of ≥10% identified by either the difference between the two tidal volumes or visual inspection of the flow-volume loop, was predefined as an unacceptable leak, and the cuff of the endotracheal tube was re-inflated. The final leak volume after correction was recorded for retrospective evaluation.
The study period comprised of a minimum of 4 to a maximum of 6 measurement points. The number of measurement points collected depended on the duration of the procedure.
Part 1 (∆Zbreath and VTSPIROrelationship):
The first part of the study investigated the relationship between change in impedance, measured with EIT (∆Zbreath), and tidal volume, measured with spirometry (VTSPIRO). It comprised 3 measurements at tidal volumes of 10 mL/kg (M10), 12 mL/kg (M12) and 15 mL/kg (M15). A stabilisation period of 15 min was allowed in between measurement points, followed by a 2-min interval dedicated to data collection.
Part 2 (Estimation of VTEITin litres):
Based on the relationship determined in part 1 between ∆Zbreath and VTSPIRO, data collected at the subsequent measurement points were used to estimate VT (VTEIT). For this part, the delivered tidal volume was adjusted to maintain end tidal carbon dioxide tension (PETCO2) at 50 ± 5 mmHg. Depending on the duration of the procedure up to 3 measurement points (MA, MB and MC) were collected at 15 min intervals, followed by a 2-min window dedicated to data collection. Data collection ceased at the end of the surgical procedure or after MC.
At each measurement point, EIT raw data were electronically recorded continuously over 2 min (16 breaths) while data for VT
SPIRO were manually recorded every 20 s (6 breathes). Volumetric capnography (VCap) data, alveolar ventilation (VT
alv) and airway dead space (VD
aw) were recorded once per measurement point [
27].
Arterial blood gases samples were collected at M12 and MA and analysed immediately after collection with the in-house blood gas analyser (ABL 800 flex, Radiometer medical Aps, Denmark).
2.5. Data Extraction
For data analysis, a maximum of 10 stable and consecutive breaths were selected from the 16 breaths collected over the two minutes of EIT recording at each time point using a dedicated software (ibeX 2018, SenTec).
Impedance change data (∆Zbreath) was extracted from these breaths as well as variables to ascertain which factors may alter the relationship between ∆Zbreath and VTSPIRO. These included centre of ventilation (CoVVD) and dependent silent spaces (DSSs).
Total impedance change was calculated for each breath (∆Zbreath) by subtracting the impedance (Z) at the beginning of inspiration from the impedance at the end of inspiration. For each time point, the average ∆Zbreath from all analysed breaths was calculated.
Centre of Ventilation (CoV) represents the focal area of the functional EIT image where ventilation occurs and is a parameter used to quantify the overall distribution of ventilation. The ventro-dorsal CoV (CoV
VD) is generally expressed as a percentage of the ventro-dorsal extension of the predefined region of interest (ROI) within the functional EIT image that represents the lung regions [
14,
28,
29]. The measured % varies between 0 and 100% where 0% represents ventilation being distributed within the most ventral aspect of the lung and 100% represents ventilation being distributed within the most dorsal lung region. For all horses, CoV
VD was calculated at each measurement point as an average of all breaths selected.
Silent spaces refer to pixels within the ROI with an impedance change <10% of the maximal impedance change of any pixel within the ROI [
30,
31]. They are expressed as a percentage of the total lung region of interest. For the purpose of this study, only dependent silent spaces were calculated (DSS
S). Dependent silent spaces comprise poorly ventilated (pixel in the ROI with 0 < ∆Z ≤ 10% of maximal ∆Z within ROI) or collapsed (pixel in the ROI with ∆Z = 0%) regions of the dependent lung. For all horses, DSS
S were calculated as an average of all breaths selected, at each measurement point.
Expiratory tidal volume (VTSPIRO) was recorded at each measurement point. Peak inspiratory airway pressure (PIP) was also recorded to determine its effect on the relationship between ∆Zbreath and VTSPIRO. Tidal volume measurements from the six representative breaths were multiplied by four to account for the split then averaged for each time point.
Volumetric capnography variables which may have influenced the relationship were recorded. These included alveolar ventilation (VTalv) and airway dead space (VDaw) (mL) in 12 horses. Measurements were obtained using the VCap software integrated in the spirometer, which is based on Fowler’s method. As an FPD was used in this study, all VCap variables recorded were normalised with the recorded VTSPIRO (VTalv/VTSPIRO; VDaw/VTSPIRO).
F-shunt, an oxygen index, was retrospectively calculated from arterial blood gas results and haemoglobin measurements at M
12 and M
A to estimate the amount of venous admixture. F-shunt equation was calculated as follow [
32,
33,
34,
35]:
Further details on the calculation can be found in
Appendix A.
2.6. Statistical Analysis
Continuous variables were assessed for normality using a Shapiro–Wilk test with the null hypothesis of normality rejected at p < 0.05. Unless specified otherwise, parametric data are reported as mean and standard deviation (mean ± SD) and non-parametric data are reported as median and range.
Data from each of the 17 horses were analysed for a correlation between VTEIT and VTSPIRO using simple linear regression for measurement M10, M12 and M15. The coefficients for slope and intercept were then used to estimate VTEIT for subsequent data points MA, MB and MC from the measured ∆Zbreath. The estimated VTEIT and measured VTSPIRO for MA, MB and MC were evaluated for agreement using Bland Altman analysis for repeated measurements (MedCalc Software Ltd. Ostend, Belgium). The mean difference (bias), 95% confidence interval of the bias (limits of agreement; LOA) and the 95% confidence limits of the LOA were calculated.
To determine components of variance in the ∆Zbreath and VTSPIRO correlation, the variables: leak volume; PIP; PETCO2; VDaw/VTSPIRO; VTalv/VTSPIRO; CoVVD; and DSSS; were explored using multiple regression with estimation of variance based on assessment of the coefficient of determination (R2) or adjusted R2 for models of two or more variables. Data for 12 horses was complete for all variables and was included in this multiple regression analysis.
All statistical analysis, unless specified was performed using SAS V 9.4.
3. Results
Of the 26 horses enrolled in the study, 17 data sets were included in data analysis (
Figure 2). Data from nine of the 26 horses were not available: the EIT belt was positioned incorrectly (
n = 2), the belt did not fit around the thorax of a horse (
n = 1), EIT laptop failure which precluded data recording (
n = 1), and finally, incomplete data due to short surgical procedure (
n = 5).
Demographic data of the 17 horses included in final analysis are summarised in
Table S1. Mean body weight of the horses was 485 kg ± 51 kg with a mean chest circumference of 182 cm ± 11 cm and BCS ranging from 4/9 (
n = 3) to 5/9 (
n = 11) to 6/9 (
n = 3). The median age was 39 (range 23–227) months.
Procedures performed in the 17 horses included arthroscopy (n = 7), castration (n = 8), sequestrum removal (n = 1), and stifle cyst removal (n = 1). The surgical and anaesthetic procedures were uneventful in all horses. Mean duration of anaesthesia was 107 ± 29 min. Of the 17 horses, 12 required dobutamine support to maintain mean arterial pressure between 70 and 80 mmHg (0.6 ± 0.2 µg/kg/min).
None of the breaths analysed had a leak that exceeded the 10% cut-off.
3.1. Linear Relationship between VTSPIRO and ∆Zbreath
A positive linear correlation between ∆Z
breath and VT
SPIRO measured at M
10, M
12 and M
15 was observed in each horse during progressive increases in delivered volume, with a mean correlation coefficient of 0.99 (range 0.90–0.99). The estimated intercepts and coefficients describing the correlation in each horse varied and did not support pooling the data and determining a global correlation between ∆Z
breath and VT
SPIRO (
Figure 3;
Table S3). Our first hypothesis was then disproved.
Descriptive statistics of ∆Z
breath, VT
SPIRO, leak data, PIP, P
ETCO
2, VD
aw/VT
SPIRO, VT
alv/VT
SPIRO, CoV
VD, DSS
S and F-Shunt are summarised in
Table 1. Multiple regression of the 12 complete data set showed that the single variable that explained the most variance in the ∆Z
breath and VT
SPIRO relationship was VD
aw/VT
SPIRO (43%).
3.2. Estimation of VTEIT from ∆Zbreath
The tidal volume delivered ranged from 6.0 to 8.1 L between horses. Tidal volume was kept stable in 11 horses for measurement points MA, MB and MC. Two horses required a decrease in VT and 4 required an increase to maintained PETCO2 within the predefined range of 50 ± 5 mmHg. All changes made to VT for this purpose did not exceed 1 L.
For each horse, VT
EIT was estimated from measured ∆Z
breath using the line of best fit (
Table S4). Bland–Altman analysis of the estimated VT
EIT and VT
SPIRO revealed a bias of 0.26 L with limits of agreement (95% confidence interval of LOA) of −0.36 (−0.69–0.155) to 0.88 (0.68–1.21) (
Figure 4). The negative bias reflects a tendency to underestimate VT
EIT compared to VT
SPIRO.
4. Discussion
This study confirmed, in equine clinical cases, the presence of a strong positive linear correlation between tidal volume, measured with spirometry, and impedance changes, measured with EIT within each horse. This finding suggests that EIT impedance changes can be used clinically to monitor changes in tidal volume. However, a high variability of this relationship was observed between horses and, for this reason, it was not possible to pool the data and to determine a global correlation between the two variables.
Using the assessed individual correlation, this study reveals good agreement between the tidal volume estimated from EIT and tidal volume measured by spirometry. In these horses, the LOA were within 20% of the tidal volume measured with spirometry, supporting the potential for EIT to estimate tidal volume with sufficient accuracy for clinical application after evaluation of the individual linear relationship.
4.1. Linear Correlation between VTSPIRO and ∆Zbreath
The first aim of the study was to explore the relationship between tidal volume, measured with spirometry, and impedance changes, measured with EIT, during clinical cases. A strong positive correlation between the two variables was previously determined experimentally in anaesthetised and mechanically ventilated horses with the authors reporting minimal variation in the relationship between horses [
20]. In the present study, EIT was applied in equine clinical cases undergoing elective procedures. We documented a similar strong linear correlation between spirometry and EIT tidal volume. In contrast to the previous study however, we observed substantial variation in the responses of each individual horse to changes in the delivered volume with varying intercepts and slope of the regression line (
Figure 3) Therefore, we were unable to define a single, global correlation for all horses in our study as hypothesised.
There are a number of possible explanations that may clarify the individual variability observed. Variables such as breed, age and body condition, could affect pulmonary mechanics, their response to a delivered volume and, therefore, be partly responsible for the individual variability of the relationship [
36,
37,
38]. In this study, we enrolled horses of different breeds and age. Furthermore, a range of body sizes was supported by the large standard deviation in chest circumference in the population under exam (SD
11 cm).
The experimental settings between the experimental study and this clinical study also varied. In the experimental study no surgery was performed, delivered tidal volume ranged from 4 L to 10 L, higher peak inspiratory pressures were reached, and each volume was maintained for only 2 min [
20]. In contrast to this, we used volumes and peak pressure that are used in clinical settings. A longer stabilisation period was allowed between measurements to permit adaptation of the lung tissue to changes in respiratory mechanics due to alterations in tidal volume [
39]. This may add to the higher individual variability seen in our study as more time was allowed for alveolar dynamics to reach a steady state which has been shown to be different between individuals [
40]. The stable lung conditions throughout our study period can be confirmed by stable values for centre of ventilation, dependent silent space and F-shunt over all measurement points.
The linear correlation observed in this study and previously described experimentally, suggests that changes in impedance are directly related to volume. The clinical relevance of this finding is that an increase in impedance corresponds to an increase in volume and vice versa, which gives the clinician the possibility to observe changes in tidal volume over time by assessing changes in impedance.
The effects of several variables of pulmonary function on the variance of tidal volume measured with EIT were explored. Preliminary examination of spirometry and EIT data from the first 5 horses suggested the presence of individual variability. This prompted investigation and recording of possible factors that could contribute to this variation. For this reason, volumetric capnography data was subsequently recorded in the remaining 12 horses. Of all the variables explored, airway dead space had the greatest influence on the variance of the relationship under examination. Airway dead space represents the volume of gas not taking part in gas exchange and being exhaled from the conducting airway [
21,
22,
27]. This finding was expected as airway dead space represents the gas volume between the two measurement sites of the spirometer and EIT (
Figure 1). This is even more true as the volume of the airway dead space is not constant, and it varies between individuals and between breaths [
41]. Particularly relevant to this study are factors that may have affected airway dead space including the size of the patient, their age and the position of the neck. Airway dead space is also affected by flow characteristics [
41]. According to Poiseuille’s equation, airway dimension (radius or diameter of a tube) affects both flow characteristics and resistance to flow. Endotracheal tube sizes were different between horses (
Table S2). Changes in diameter from the endotracheal tube to conducting airway may have changed the characteristics of the flow and altered the tidal volume relationship.
None of the other recorded factors explored to determine components of variance in the tidal volume relationship were found to have influence on the linearity. As leaks in the system influence the accuracy of spirometric measurements, the flow-volume curves and the difference between inspiratory to expiratory volume were checked and inspiratory and expiratory tidal volume recorded, to be able to correct leaks by inflating the ETT cuff if necessary, prior to each data collection period. The leak was below 10% of the measured tidal volume in all measurements.
4.2. Estimation of Tidal Volume from EIT Measurements
To compensate for the individual variation between horses, the line of best fit was used to make a clinically acceptable estimate of tidal volume in litres from EIT impedance changes measurements. The limits of agreement between estimated tidal volume from EIT and tidal volume from spirometry were within 20% of the tidal volume measured using spirometry. Currently, in veterinary medicine, there are no established accuracy standards for clinical applicability of multiple methods for monitoring vital parameters. Instead, we are reliant on human accuracy standards. In human studies, an agreement of
15% between measurement methods for lung volume has been considered acceptable for clinical application [
23,
24]. The measured agreement of less than 20% in this study is encouraging and supports the potential of EIT to estimate VT in litres in anaesthetised and mechanically ventilated horses after the individual correlation has been established.
We observed a tendency for the estimated tidal volume from EIT to be lower than tidal volume measured with spirometry. This is expected, as spirometric measurements are taken proximally at the level of the mouth and includes airway dead space as explained above and shown in
Figure 1. EIT, in contrast, represents cross-section of the lungs at the level of the 5th–6th intercostal space and does not include airway dead space. In a cattle study, which used EIT measurement to evaluate the effect of PEEP on tidal volume, it was observed that airway dead space contributed to the explanation of variance together with peak inspiratory pressure up to an adjusted R
2 of 0.76 [
42].
Future study should explore the relationship between alveolar ventilation and tidal volume measured with EIT. According to our observations of airway dead space, it would not be surprising if impedance changes would have a better agreement with alveolar ventilation, than with tidal volume itself.
4.3. Clinical Observation of Ease of Use of EIT
To the authors knowledge, this is the first study on EIT in clinical equine cases. The electrode belt was easily placed around the thorax of sedated horses after gel was applied. A soft elastic bandage was placed around the belt to prevent its movement during induction and hoisting of the horse. The belt was visually inspected before positioning the horse on the surgical table. Overall, the electrode-skin contact was good in all horses without prior hair clipping.
Belt mispositioning, due to operator error and rough induction, caused the exclusion of two horses from our study [
43]. Our experience confirmed that accurate EIT belt positioning was a key factor to measurement consistency. EIT laptop failure prevented data recording in one horse. This was resolved by updating the software.
In horses that underwent castration (n = 8), EIT measurement artefacts were observed when electrocautery was used making data collection impossible at the same time. This resulted in less than 10 analysed breaths in three horses with one horse having only 3 breaths analysed at one measurement point. The use of electrocautery needs to be considered when using EIT as monitoring tool in a theatre setting. Prompt and consistent communication with the surgeon was implemented to limit electrical artifacts during data collection.
4.4. Limitations of the Study
The linearity of the relationship and estimation of tidal volume rely on the accuracy of the spirometric measurement adopted. According to the manufacturer specifications, the flow sensor used has an accuracy of ±3%. A recent in vitro study highlighted an increase in the margin of errors in calibrated Pedilite flow sensors following increasing volumes delivered [
44]. This observation is consistent with what has been reported in studies related to the accuracy of FPD in association with the spirometer used in this study [
8,
10].
We tested the accuracy of the spirometer with a calibration syringe before each anaesthesia. The margin of error identified was in agreement with manufacturer specifications. In general, accuracy of spirometry is affected by gas viscosity, temperature and the presence of water vapour [
45]. These variables change when considered in in vivo and in vitro settings and may affect volume measurements. When performing accuracy tests on measurement methods, it should be noted that some variables can be controlled in experimental settings, but not in clinical conditions, which means that the accuracy of any measurement methods may vary depending on the conditions implemented.
Another limitation of the study is attributed to the use of the FPD. The FPD enabled the application of standard human spirometry to large animal anaesthesia in a simple and reproducible way. Previous research supported the use of FPD paired with a commercially available spirometer as an accurate and reliable way to measure tidal volume in anaesthetised horses, therefore this method was chosen for this study as the reference method [
8,
10]. The downside of using an FDP is that a correction factor of 4 is required for volume measurements [
10]. Applying the correction factor also causes the measured error to be multiplied by 4.
The differences in demographic data together may explain the individual variability in the relationship we observed. Individual features such as breed, sex, age, weight and chest circumference, BCS were measured but not included in the statistical analysis. Three consecutive measurement points were used to estimate tidal volume from EIT; however, we did not evaluate time as an influencing variable. Future studies should include more data point to further characterised the relationship and also explore the influence of time in the stability of the relationship.
A final limitation was the differences in the number of selected breaths analysed at each measurement point for different horses. Electrical interferences caused by the use of the electrocautery, affected EIT measurements and impaired their interpretation, making it necessary to exclude these breaths. This should be taken into account in future studies where EIT is used in clinical cases.


 ,
, 


