
Evaluation of an Image Analysis Approach to Predicting Primal Cuts and Lean in Light Lamb Carcasses


 , , ,
, , ,  and
and 
Abstract
:Simple Summary
Abstract
1. Introduction
2. Materials and Methods
2.1. Animals and Carcasses
2.2. Acquisition of VIA Images and Measurements
2.3. Carcass Cuts and Composition
2.4. Models and Statistical Analysis
3. Results
3.1. Commercial Dataset Description
3.2. Prediction of Cut Weight and Percentage
3.3. Prediction of Lean Meat Weight and Percentage
4. Discussion
5. Conclusions
Author Contributions
Funding
Institutional Review Board Statement
Data Availability Statement
Acknowledgments
Conflicts of Interest
References
- Hopkins, D.L.; Gardner, G.E.; Toohey, E.S. Australian view on lamb carcass and meat quality–the role of measurement technologies in the Australian sheep industry. In Farm Animal Imaging—A Summary Report; Maltin, C., Craigie, C., Bünger, L., Eds.; SRUC: Edinburgh, UK, 2015; pp. 17–21. [Google Scholar]
- Silva, S.; Guedes, C.; Rodrigues, S.; Teixeira, A. Non-destructive imaging and spectroscopic techniques for assessment of carcass and meat quality in sheep and goats: A review. Foods 2020, 9, 1074. [Google Scholar] [CrossRef] [PubMed]
- Craigie, C.R.; Navajas, E.A.; Purchas, R.W.; Maltin, C.A.; Bünger, L.; Hoskin, S.O.; Ross, D.W.; Morris, S.T.; Roehe, R. A review of the development and use of video image analysis (VIA) for beef carcass evaluation as an alternative to the current EUROP system and other subjective systems. Meat Sci. 2012, 92, 307–318. [Google Scholar] [CrossRef] [PubMed]
- Teixeira, A.; Silva, S.; Rodrigues, S. Advances and sheep and goat meat products research. In Advances in Food and Nutrition Research; Toldra, F., Ed.; Academic Press: Cambridge, MA, USA, 2019; Volume 87, pp. 305–370. [Google Scholar]
- Stanford, K.; Jones, S.D.M.; Price, M.A. Methods of predicting lamb carcass composition: A review. Small Rumin. Res. 1998, 29, 241–254. [Google Scholar] [CrossRef]
- Scholz, A.M.; Bünger, L.; Kongsro, J.; Baulain, U.; Mitchell, A.D. Non-invasive methods for the determination of body and carcass composition in livestock: Dual energy X-ray absorptiometry, computed tomography, magnetic resonance imaging and ultrasound: Invited review. Animal 2015, 9, 1250–1264. [Google Scholar] [CrossRef] [Green Version]
- Hopkins, D.L.; Safari, E.; Thompson, J.M.; Smith, C.R. Video image analysis in the Australian meat industry–precision and accuracy of predicting lean meat yield in lamb carcasses. Meat Sci. 2004, 67, 269–274. [Google Scholar] [CrossRef]
- Araújo, J.C.; Lima, A.C.S.; Nunes, M.P.M.; Sousa, M.A.P.; Serrão, G.X.; Morais, E.C.; Daher, L.C.C.; Silva, A.G.M. Relationships among carcass shape, tissue composition, primal cuts and meat quality traits in lambs: A PLS path modeling approach. Small Rumin. Res. 2020, 182, 52–66. [Google Scholar] [CrossRef]
- Connaughton, S.L.; Williams, A.; Anderson, F.; Kelman, K.R.; Gardner, G.E. Dual energy X-ray absorptiometry precisely and accurately predicts lamb carcass composition at abattoir chain speed across a range of phenotypic and genotypic variables. Animal 2020, 14, 2194–2202. [Google Scholar] [CrossRef]
- Toohey, E.S.; van de Ven, R.; Hopkins, D.L. The value of objective online measurement technology: Australian red meat processor perspective. Anim. Prod. Sci. 2018, 58, 1559–1565. [Google Scholar] [CrossRef]
- Delgado-Pando, G.; Allen, P.; Troy, D.J.; McDonnell, C.K. Objective carcass measurement technologies: Latest developments and future trends. Trends Food Sci. Tech. 2021, 111, 771–782. [Google Scholar] [CrossRef]
- Allen, P. Automated grading of beef carcasses. In Improving the Sensory and Nutritional Quality of Fresh Meat; Kerry, J.P., Ledward, D., Eds.; Woodhead Publishing: Cambridge, UK, 2009; pp. 479–492. [Google Scholar]
- Pabiou, T.; Fikse, W.F.; Cromie, A.R.; Keane, M.G.; Nasholm, A.; Berry, D.P. Use of digital images to predict carcass cut yields in cattle. Livest. Sci. 2011, 137, 130–140. [Google Scholar] [CrossRef]
- Ngo, L.; Ho, H.; Hunter, P.; Quinn, K.; Thomson, A.; Pearson, G. Post-mortem prediction of primal and selected retail cut weights of New Zealand lamb from carcass and animal characteristics. Meat Sci. 2016, 112, 39–45. [Google Scholar] [CrossRef]
- Commission Regulation (EC) No 1107/96 of 12 June 1996 on the Registration of Geographical Indications and Designations of Origin under the Procedure Laid down in Article 17 of Council Regulation (EEC) No 2081/92. Available online: https://www.legislation.gov.uk/eur/1996/1107 (accessed on 5 April 2021).
- Rasband, W.S.; ImageJ, U.S. National Institutes of Health, Bethesda, Maryland, USA. 2018. Available online: https://imagej.nih.gov/ij/ (accessed on 1 January 2019).
- Oliver, A.; Mendizabal, J.A.; Ripoll, G.; Alberti, P.; Purroy, A. Predicting meat yields and commercial meat cuts from carcasses of young bulls of Spanish breeds by the SEUROP method and an image analysis system. Meat Sci. 2010, 84, 628–633. [Google Scholar] [CrossRef]
- Rius-Vilarrasa, E.; Bünger, L.; Brotherstone, S.; Macfarlane, J.M.; Lambe, N.R.; Matthews, K.R.; Haresign, W.; Roehe, R. Genetic parameters for carcass dimensional measurements from Video Image Analysis and their association with conformation and fat class scores. Livest. Sci. 2010, 128, 92–100. [Google Scholar] [CrossRef] [Green Version]
- Santos, V.A.C.; Cabo, A.; Raposo, P.; Silva, J.A.; Azevedo, J.M.T.; Silva, S.R. The effect of carcass weight and sex on carcass composition and meat quality of “Cordeiro Mirandes”-Protected designation of origin lambs. Small Rumin. Res. 2015, 130, 136–140. [Google Scholar] [CrossRef]
- Panea, B.; Ripoll, G.; Albertí, P.; Joy, M.; Teixeira, A. Atlas of dissection of ruminant’s carcass. Inf. Tec. Econ. Agrar. 2012, 108, 3–105. [Google Scholar]
- Rodrigues, S.; Cadavez, V.; Teixeira, A. Breed and maturity effects on Churra Galega Bragançana and Suffolk lamb carcass characteristics: Killing-out proportion and composition. Meat. Sci. 2006, 17, 130–140. [Google Scholar] [CrossRef]
- Viscarra Rossel, R.A.; McGlynn, R.N.; McBratney, A.B. Determining the composition of mineral-organic mixes using UV-vis-NIR diffuse reflectance spectroscopy. Geoderma 2006, 137, 70–82. [Google Scholar] [CrossRef]
- Santos, V.A.C.; Silva, S.R.; Mena, E.G.; Azevedo, J.M.T. Live weight and sex effects on carcass and meat quality of “Borrego terrincho-PDO” suckling lambs. Meat Sci. 2007, 77, 288–293. [Google Scholar] [CrossRef]
- Sañudo, C.; Alfonso, M.; Sanchez, A.; Delfa, R.; Teixeira, A. Carcass and meat quality in light lambs from different fat classes in the EU carcass classification system. Meat Sci. 2000, 56, 89–94. [Google Scholar] [CrossRef]
- Diaz, M.T.; de la Fuente, J.; Perez, C.; Lauzurica, S.; Alvarez, I.; Ruiz de Huidobro, F.; Velasco, S.; Caneque, V. Body composition in relation to slaughter weight and gender in suckling lambs. Small Rumin. Res. 2006, 64, 126–132. [Google Scholar] [CrossRef]
- Miguelez, E.; Zumalacarregui, J.M.; Osorio, M.T.; Beteta, O.; Mateo, J. Carcass characteristics of suckling lambs protected by the PGI “Lechazo de Castilla y Leon” European quality label: Effect of breed, sex and carcass weight. Meat Sci. 2006, 73, 82–89. [Google Scholar] [CrossRef]
- Einarsson, E.; Eythorsdottir, E.; Smith, C.R.; Jonmundsson, J.V. The ability of video image analysis to predict lean meat yield and EUROP score of lamb carcasses. Animal 2014, 8, 1170–1177. [Google Scholar] [CrossRef] [PubMed]
- Gardner, G.E.; Anderson, F.; Smith, C.; Williams, A. Using dual energy X-ray absorptiometry to estimate commercial cut weights at abattoir chain-speed. Meat Sci. 2021, 173, 108400. [Google Scholar] [CrossRef]
- Brady, A.S.; Belk, K.E.; LeValley, S.B.; Dalsted, N.L.; Scanga, J.A.; Tatum, J.D.; Smith, G.C. An evaluation of the lamb vision system as a predictor of lamb carcass red meat yield percentage. J. Anim. Sci. 2003, 81, 1488–1498. [Google Scholar] [CrossRef] [Green Version]
- Monteiro, A.; Teixeira, A.; Azevedo, J.; Silva, S. Determination of carcass composition of goats by video image analysis. In Proceedings of the IV CIGR International Workshop on Computer Image Analysis and Spectroscopy in Agriculture, C0737, Valencia, Spain, 8–12 July 2012; p. 6. [Google Scholar]
- Rius-Vilarrasa, E.; Bünger, L.; Maltin, C.; Matthews, K.R.; Roehe, R. Evaluation of Video Image Analysis (VIA) technology to predict meat yield of sheep carcasses on-line under UK abattoir conditions. Meat Sci. 2009, 82, 94–100. [Google Scholar] [CrossRef]
- Cunha, B.C.N.; Belk, K.E.; Scanga, J.A.; LeValley, S.B.; Tatum, J.D.; Smith, G.C. Development and validation of equations utilizing lamb vision system output to predict lamb carcass fabrication yields. J. Anim. Sci. 2004, 82, 2069–2076. [Google Scholar] [CrossRef] [Green Version]
- Normand, J.; Ferrand, M. Evaluation des performances de la machine à classer les carcasses ovines VIASCAN®. In Compte rendu n° 00 11 32 028; Département Techniques d’Elevage et Qualité, Institut de l’Elevage, Institut de l’Élevage: Paris, France, 2011; p. 169. [Google Scholar]
- Stanford, K.; Richmond, R.J.; Jones, S.D.M.; Robertson, W.M.; Price, M.A.; Gordon, A.J. Video image analysis for on-line classification of lamb carcasses. Anim. Sci. 1998, 67, 311–316. [Google Scholar] [CrossRef]
- Normand, J.; Ferrand, M. Evaluation de la conformation, de l’état d’engraissement et du pourcentage de muscle des carcasses d’agneau par analyse d’image: Les performances de la machine à classer ovine dans le contexte des abattoirs français. Renc. Rech. Rumin. 2015, 22, 371–374. [Google Scholar]

| Description | Mean | sd | Min | Max | CV (%) | |
|---|---|---|---|---|---|---|
| CCW (g) | Cold carcass weight | 4523 | 1324 | 2162 | 7622 | 29.27 |
| Weight (g) | ||||||
| HVC | High-value cuts | 1962 | 578 | 946 | 3442 | 29.50 |
| MVC | Medium-value cuts | 1416 | 412 | 700 | 2298 | 29.09 |
| LVC | Low-value cuts | 834 | 277 | 370 | 1564 | 33.27 |
| AllC | All cuts | 4212 | 1254 | 2016 | 7112 | 29.78 |
| LM_HVC | Lean meat in HVC | 1260 | 370 | 574 | 2244 | 29.43 |
| LM_MVC | Lean meat in MVC | 856 | 247 | 410 | 1408 | 28.95 |
| LM_LVC | Lean meat in MVC | 427 | 127 | 204 | 731 | 29.94 |
| LM_AllC | Lean meat in all cuts | 2543 | 740 | 1189 | 4305 | 29.11 |
| Percentage of CCW (%) | ||||||
| HVC | High-value cuts | 43.40 | 1.09 | 40.00 | 46.10 | 2.50 |
| MVC | Medium-value cuts | 31.36 | 1.60 | 24.90 | 37.40 | 5.11 |
| LVC | Low-value cuts | 18.28 | 1.40 | 15.50 | 21.60 | 7.65 |
| AllC | All cuts | 93.05 | 1.99 | 83.20 | 98.70 | 2.14 |
| LM_HVC | Lean meat yield in HVC | 27.90 | 1.17 | 25.80 | 31.30 | 4.21 |
| LM_MVC | Lean meat yield in MVC | 18.96 | 1.22 | 15.00 | 22.50 | 6.42 |
| LM_LVC | Lean meat yield in MVC | 9.45 | 0.57 | 8.30 | 10.80 | 6.08 |
| LM_AllC | Lean meat yield in all cuts | 56.30 | 2.34 | 51.10 | 63.80 | 4.16 |
| Description | Variable | Mean | sd | Min | Max | CV (%) |
|---|---|---|---|---|---|---|
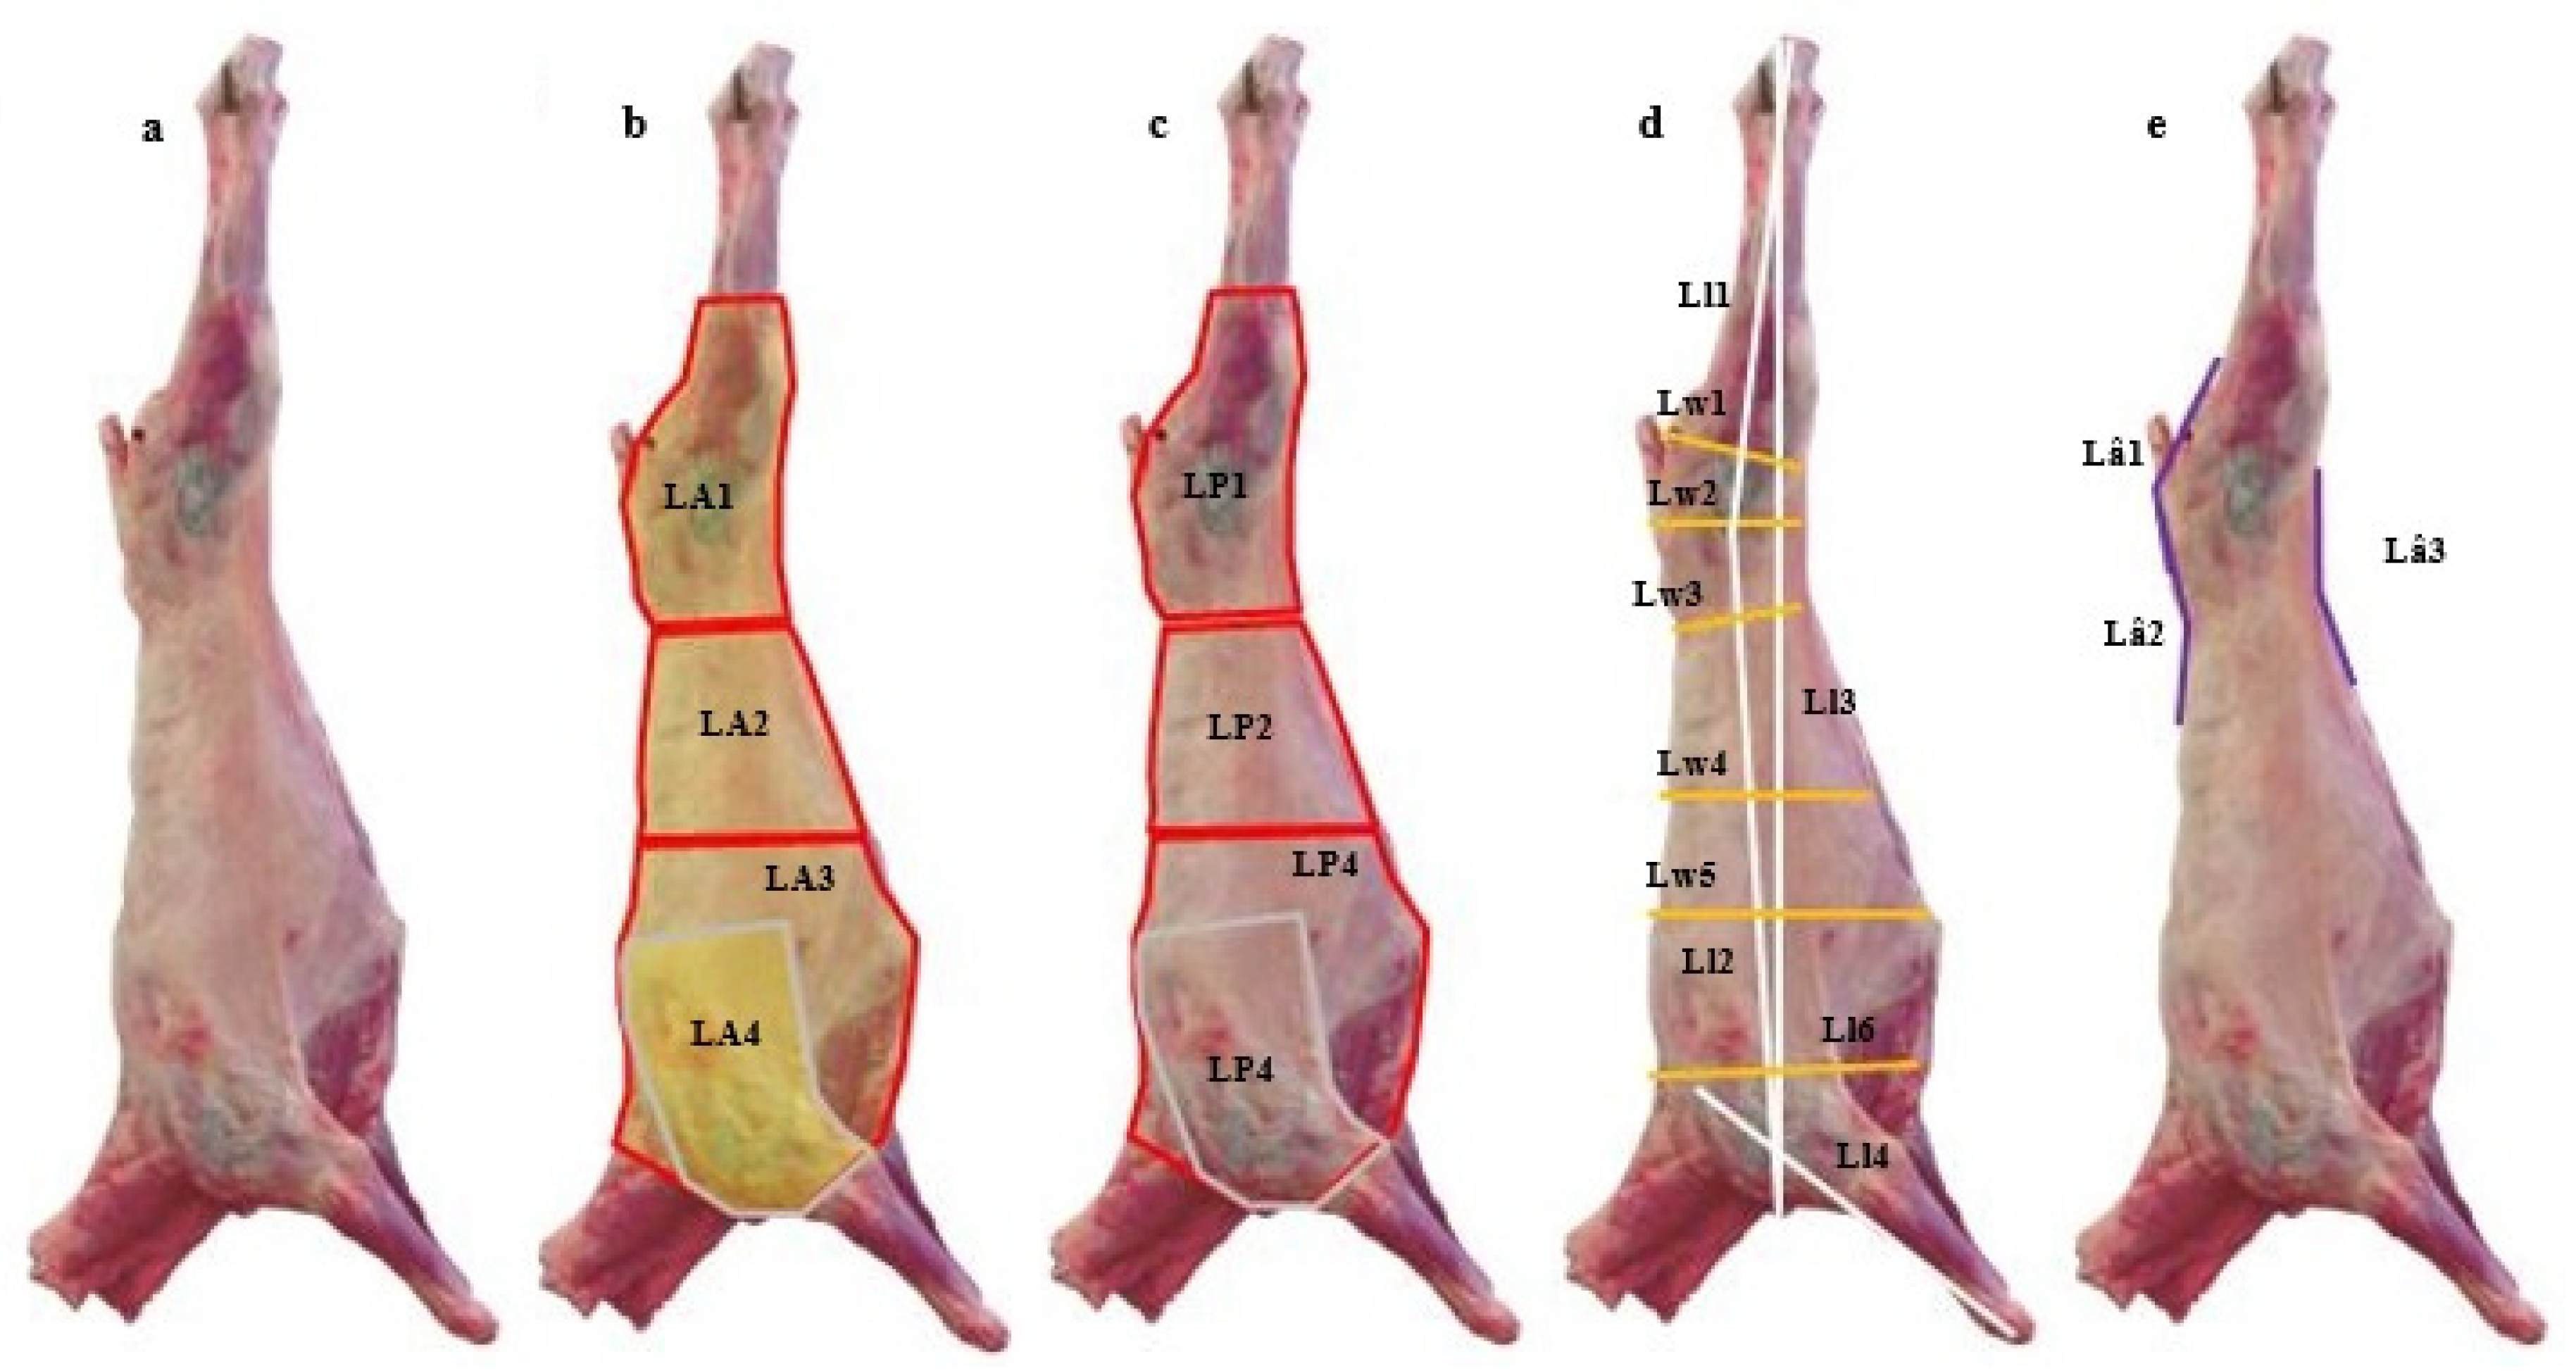
| Area (cm2) | ||||||
| Leg | LA1 | 185.24 | 42.41 | 107.70 | 271.60 | 22.89 |
| Loin | LA2 | 163.06 | 39.43 | 97.80 | 270.60 | 24.18 |
| Forequarter | LA3 | 337.77 | 66.84 | 204.20 | 471.30 | 19.79 |
| Shoulder | LA4 | 140.50 | 35.35 | 83.50 | 260.70 | 25.16 |
| Perimeter (cm) | ||||||
| Leg | LP1 | 58.64 | 7.08 | 44.00 | 70.70 | 12.07 |
| Loin | LP2 | 50.82 | 7.80 | 14.00 | 65.70 | 15.34 |
| Forequarter | LP3 | 69.79 | 10.31 | 15.30 | 83.20 | 14.77 |
| Shoulder | LP4 | 48.81 | 8.13 | 11.40 | 67.50 | 16.65 |
| Angle (θ) | ||||||
| Leg angle 1 | Lâ1 | 142.44 | 5.77 | 129.80 | 153.90 | 4.05 |
| Leg angle 2 | Lâ2 | 160.43 | 5.60 | 149.20 | 172.80 | 3.49 |
| Leg angle 3 | Lâ3 | 154.55 | 9.37 | 136.00 | 178.90 | 6.06 |
| Length (cm) | ||||||
| Length of the leg | Ll1 | 30.84 | 3.36 | 23.00 | 38.00 | 10.89 |
| Thoracolumbar length | Ll2 | 39.18 | 4.25 | 29.70 | 47.00 | 10.85 |
| Length between the calcaneus and the greater tubercle of humerus | Ll3 | 26.89 | 3.22 | 18.90 | 32.40 | 11.96 |
| Length of the forearm | Ll4 | 72.72 | 6.88 | 55.30 | 86.40 | 9.46 |
| Width (cm) | ||||||
| Thinnest width of leg | Lw1 | 9.70 | 1.12 | 7.20 | 12.00 | 11.59 |
| Largest width of the leg | Lw2 | 10.25 | 1.29 | 7.70 | 13.00 | 12.58 |
| Minimum waist width | Lw3 | 9.42 | 1.19 | 7.10 | 12.70 | 12.58 |
| Maximum waist width | Lw4 | 13.17 | 1.70 | 9.20 | 16.60 | 12.88 |
| Maximum thoracic width | Lw5 | 17.17 | 2.06 | 13.10 | 20.90 | 11.98 |
| Widest part of the chest | L16 | 17.40 | 1.99 | 13.10 | 22.70 | 11.42 |
| With CCW Included in the Analysis | With CCW Included in the Analysis | |||||||||||||||
|---|---|---|---|---|---|---|---|---|---|---|---|---|---|---|---|---|
| HVC | MVC | LVC | AllC | HVC | MVC | LVC | AllC | |||||||||
| Intercept | −16.598 | −167.333 | −20.561 | −149.094 | −772.794 | −587.231 | −560.911 | −1811.698 | ||||||||
| Independent variables | 0.425 | CCW | 0.289 | CCW | 0.185 | CCW | 0.917 | CCW | 34.901 | Ll2 | 24.69 | Ll2 | 17.178 | Ll2 | 74,348 | Ll2 |
| 24.182 | Lw2 | 10.343 | Ll4 | −14.904 | Ll1 | 1.308 | LA2 | 85.558 | L16 | 62.057 | L16 | 45.212 | Lw6 | 212,244 | L16 | |
| −17.278 | L16 | 17.67 | L16 | −41.504 | LP1 | −28.220 | LP1 | −19.362 | LP1 | −94,902 | LP1 | |||||
| 0.661 | LA2 | 1.053 | LA2 | 12.487 | LA1 | 8.702 | LA1 | 4.287 | LA1 | 26,909 | LA1 | |||||
| 1.697 | LA2 | |||||||||||||||
| k-fold- R2 | 0.994 | 0.977 | 0.959 | 0.997 | 0.849 | 0.86 | 0.836 | 0.862 | ||||||||
| RSDcv | 46.596 | 63.914 | 58.726 | 75.28 | 233.533 | 160.399 | 118.034 | 484.759 | ||||||||
| RPD | 12.42 | 6.45 | 4.72 | 16.66 | 2.48 | 2.57 | 2.35 | 2.59 | ||||||||
| With CCW Included in the Analysis | Without CCW Included in the Analysis # | |||||||||||
|---|---|---|---|---|---|---|---|---|---|---|---|---|
| HVC | MVC | LVC | AllC | MVC | AllC | |||||||
| Intercept | 43.021 | 27.154 | 17.772 | 86.229 | 30.734 | 99.551 | ||||||
| Independent variables | 0.161 | Ll1 | −0.001 | CCW | −0.314 | Ll1 | −0.001 | CCW | −0.126 | Ll2 | −0.067 | Lâ1 |
| 0.43 | Lw2 | 0.249 | Ll4 | 0.42 | L16 | 0.696 | Lw3 | 0.206 | Ll4 | 0.019 | LA2 | |
| −0.516 | L16 | 0.018 | LA2 | 0.024 | LA2 | |||||||
| k-fold- R2 | 0.219 | 0.124 | 0.425 | 0.214 | 0.077 | 0.16 | ||||||
| RSDcv | 0.977 | 1.527 | 1.089 | 1.816 | 1.568 | 1.858 | ||||||
| RPD | 1.12 | 1.05 | 1.29 | 1.1 | 1.02 | 1.07 | ||||||
| With CCW Included in the Analysis | Without CCW Included in the Analysis | |||||||||||||||
|---|---|---|---|---|---|---|---|---|---|---|---|---|---|---|---|---|
| LM_HVC | LM_MVC | LM_LVC | LM_AllC | LM_HVC | LM_MVC | LM_LVC | LM_ALLCuts | |||||||||
| Intercept | −77.604 | −201.327 | −24.377 | −176.522 | −873.782 | −575.884 | −13.793 | −1813.733 | ||||||||
| Independent variables | 0.254 | CCW | 0.175 | CCW | 0.086 | CCW | 0.498 | CCW | 69.959 | L16 | 47.266 | L16 | 1.881 | LA1 | 148.297 | L16 |
| 12.243 | Ll1 | −8.805 | Ll2 | 0.397 | LA2 | 19.008 | Ll1 | 4.95 | LA1 | 3.292 | LA1 | 0.757 | LA2 | 9.595 | LA1 | |
| −22.046 | L16 | 11.069 | Ll4 | −11.557 | Ll2 | −4.425 | LP4 | |||||||||
| 1.040 | LA1 | 5.728 | Ll3 | 1.798 | LA1 | 1.317 | LA4 | |||||||||
| −0.625 | LA2 | |||||||||||||||
| k-fold- R2 | 0.989 | 0.976 | 0.956 | 0.991 | 0.836 | 0.838 | 0.843 | 0.847 | ||||||||
| RSDcv | 40.001 | 40.109 | 27.438 | 72.954 | 153.157 | 101.537 | 52.696 | 295.271 | ||||||||
| RPD | 9.27 | 6.18 | 4.66 | 10.15 | 2.42 | 2.44 | 2.43 | 2.51 | ||||||||
| With CCW Included in the Analysis | Without CCW Included in the Analysis # | |||||||||||
|---|---|---|---|---|---|---|---|---|---|---|---|---|
| LM_HVC | LM_MVC | LM_LVC | LM_AllC | LM_MVC | LM_AllC | |||||||
| Intercept | 26.829 | 16.257 | 10.423 | 51.198 | 18.062 | 37.971 | ||||||
| Independent variables | 0.325 | Ll1 | −0.001 | CCW | −0.048 | Ll2 | −0.002 | CCW | −0.148 | Ll2 | 0.488 | Ll1 |
| −0.174 | Ll2 | −0.101 | Ll2 | 0.006 | LA2 | 0.495 | Ll1 | 0.311 | Ll4 | −0.390 | Ll2 | |
| −0.487 | L16 | 0.266 | Ll4 | −0.274 | Ll2 | −0.010 | LA2 | 0.130 | Lâ1 | |||
| 0.107 | LP1 | 0.017 | LA1 | 0.043 | LA1 | |||||||
| k-fold- R2 | 0.433 | 0.357 | 0.133 | 0.438 | 0.287 | 0.364 | ||||||
| RSDcv | 0.919 | 1.013 | 0.547 | 1.827 | 1.056 | 1.923 | ||||||
| RPD | 1.27 | 1.20 | 1.04 | 1.28 | 1.16 | 1.22 | ||||||
Publisher’s Note: MDPI stays neutral with regard to jurisdictional claims in published maps and institutional affiliations. |
© 2021 by the authors. Licensee MDPI, Basel, Switzerland. This article is an open access article distributed under the terms and conditions of the Creative Commons Attribution (CC BY) license (https://creativecommons.org/licenses/by/4.0/).
Share and Cite
Batista, A.C.; Santos, V.; Afonso, J.; Guedes, C.; Azevedo, J.; Teixeira, A.; Silva, S. Evaluation of an Image Analysis Approach to Predicting Primal Cuts and Lean in Light Lamb Carcasses. Animals 2021, 11, 1368. https://doi.org/10.3390/ani11051368
Batista AC, Santos V, Afonso J, Guedes C, Azevedo J, Teixeira A, Silva S. Evaluation of an Image Analysis Approach to Predicting Primal Cuts and Lean in Light Lamb Carcasses. Animals. 2021; 11(5):1368. https://doi.org/10.3390/ani11051368
Chicago/Turabian StyleBatista, Ana Catharina, Virgínia Santos, João Afonso, Cristina Guedes, Jorge Azevedo, Alfredo Teixeira, and Severiano Silva. 2021. "Evaluation of an Image Analysis Approach to Predicting Primal Cuts and Lean in Light Lamb Carcasses" Animals 11, no. 5: 1368. https://doi.org/10.3390/ani11051368
APA StyleBatista, A. C., Santos, V., Afonso, J., Guedes, C., Azevedo, J., Teixeira, A., & Silva, S. (2021). Evaluation of an Image Analysis Approach to Predicting Primal Cuts and Lean in Light Lamb Carcasses. Animals, 11(5), 1368. https://doi.org/10.3390/ani11051368