
Gene Expression Profile and Co-Expression Network of Pearl Gentian Grouper under Cold Stress by Integrating Illumina and PacBio Sequences

 , ,
, ,
Abstract
:Simple Summary
Abstract
1. Introduction
2. Materials and Methods
2.1. Cold Stress Experiment and RNA Extraction
2.2. PacBio SMRT-Seq and Analysis
2.2.1. Library Construction and Sequencing
2.2.2. Transcripts Assembly and Annotation of PacBio SMRT-Seq
2.3. Illumina RNA-Seq and Analysis
2.3.1. Library Construction and Sequencing
2.3.2. Differential Expression Analysis
2.3.3. STEM Analysis
2.3.4. WGCNA Analysis
2.4. Quantitative Real-Time PCR (qRT-PCR) Validation
3. Results
3.1. PacBio SMRT-Seq Sequencing, Assembly, and Functional Annotation
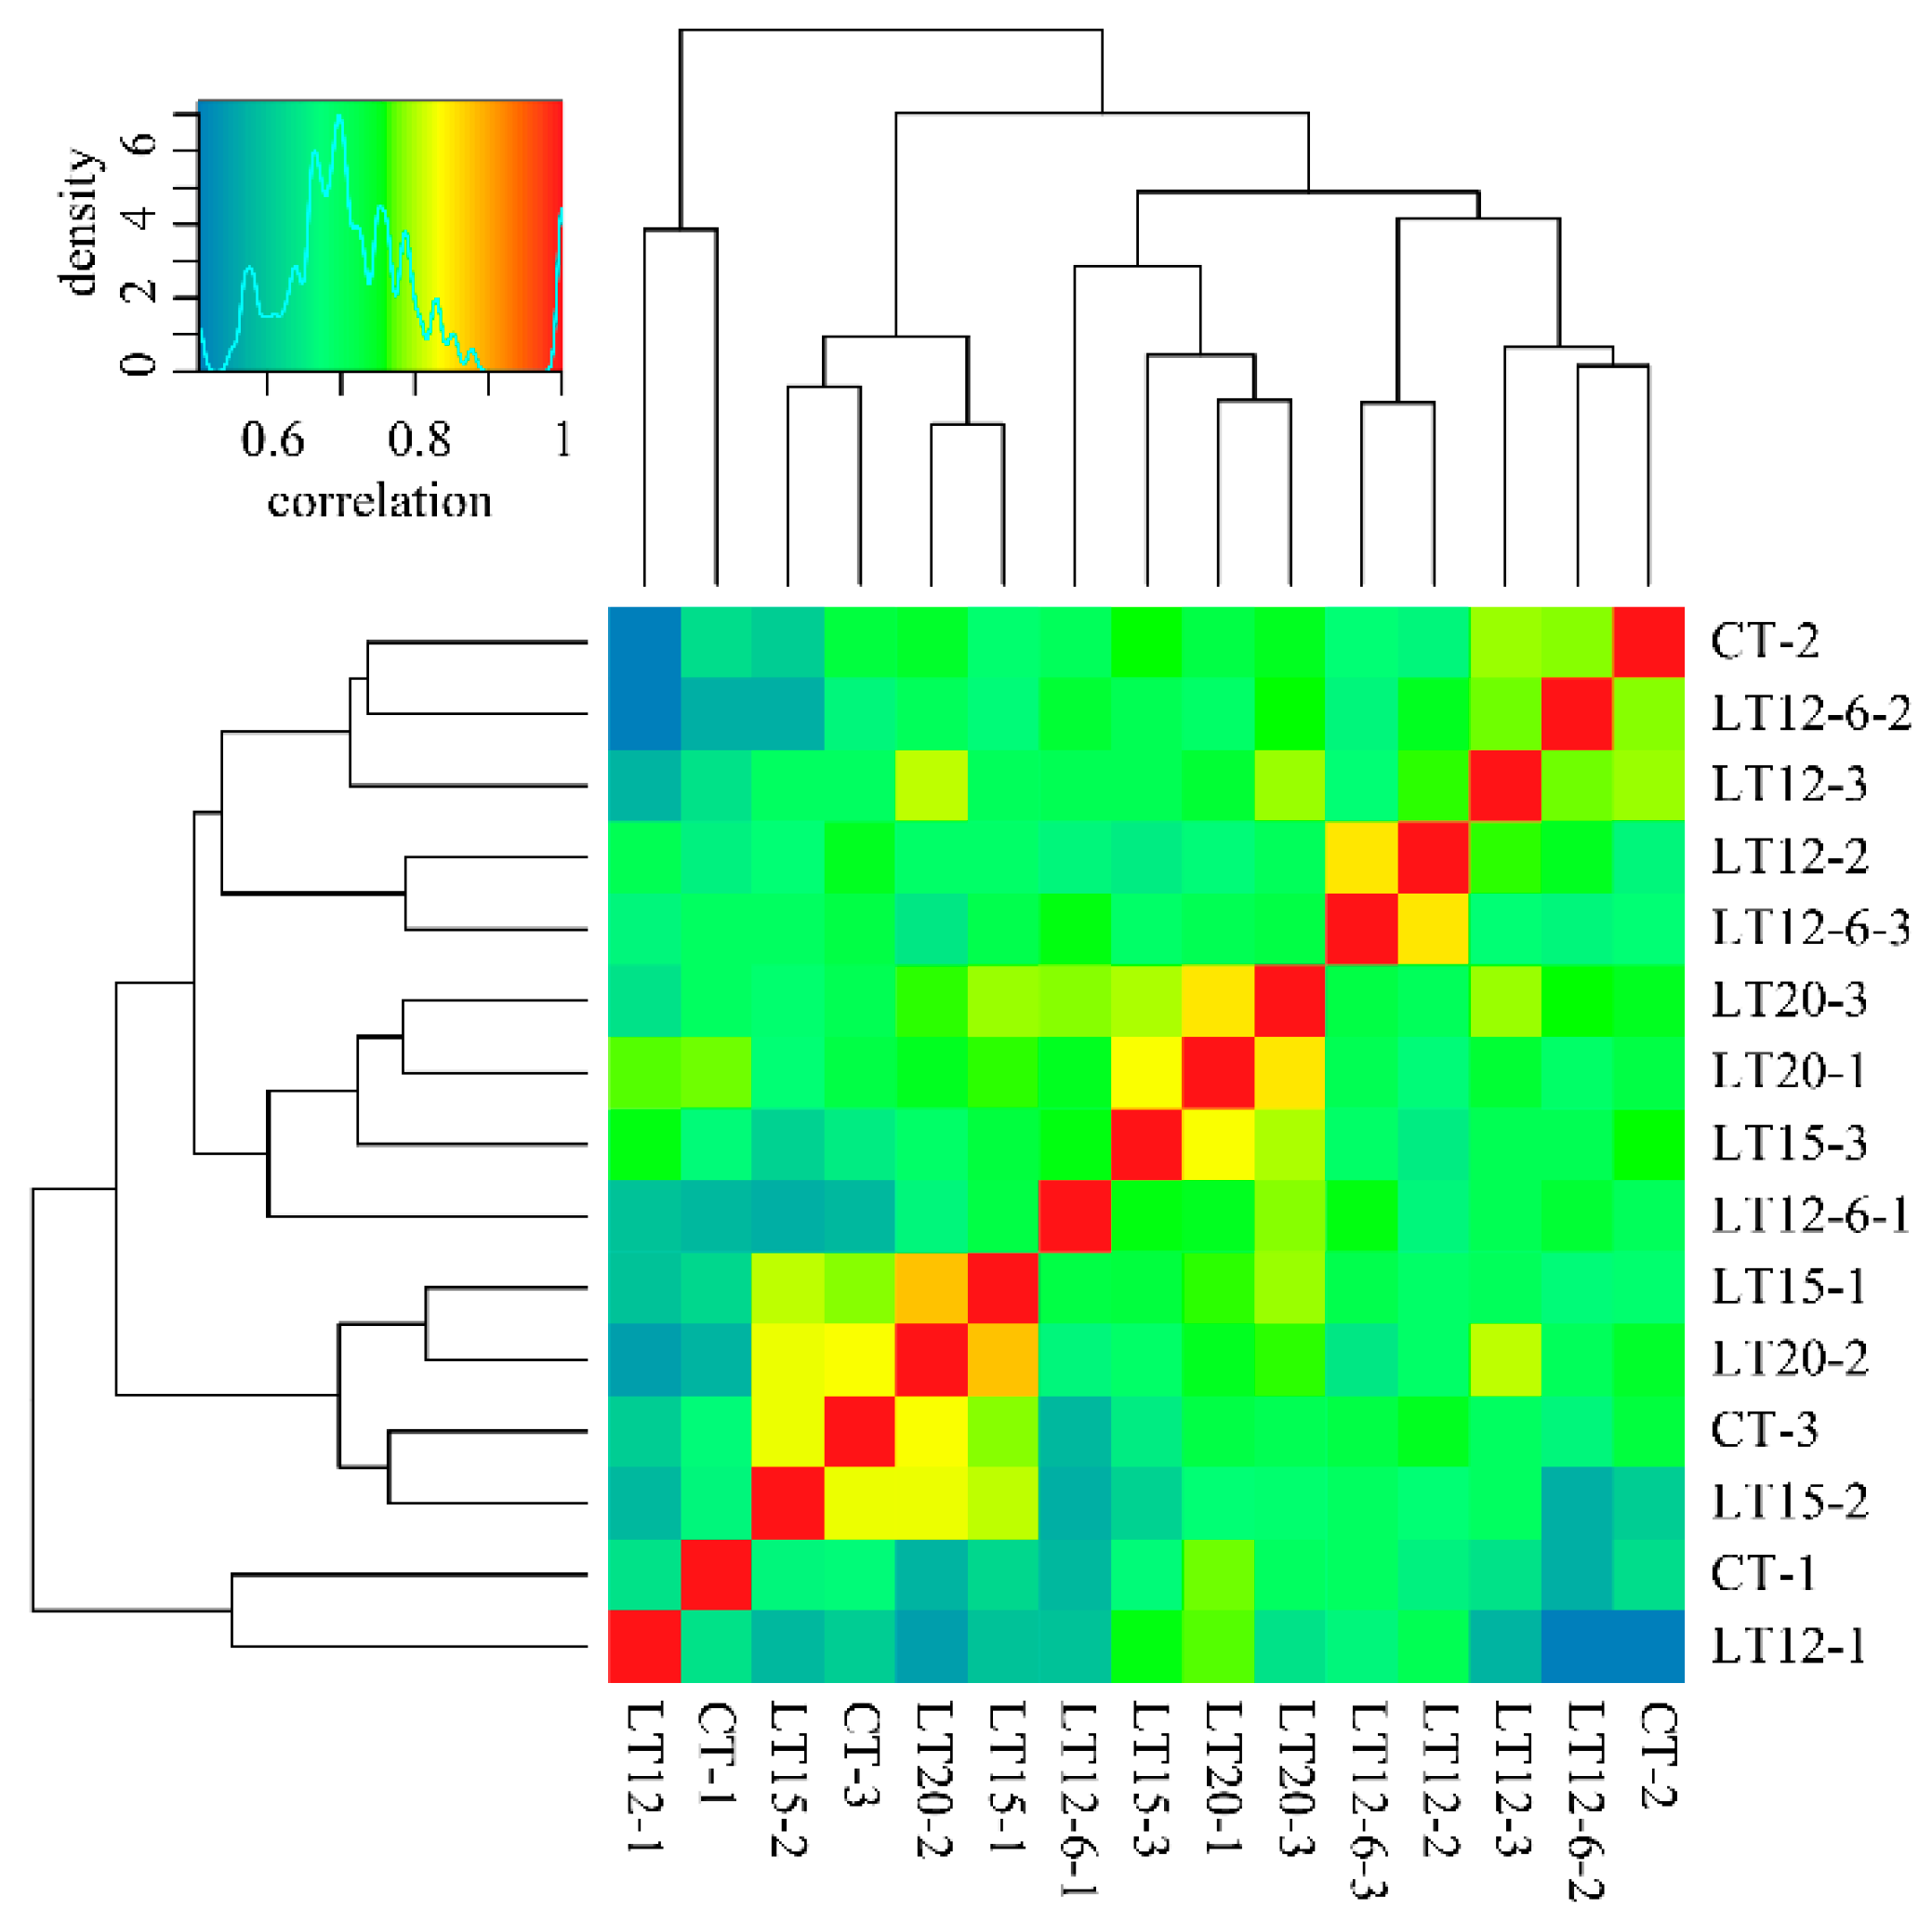
3.2. Illumina RNA-Seq Analysis
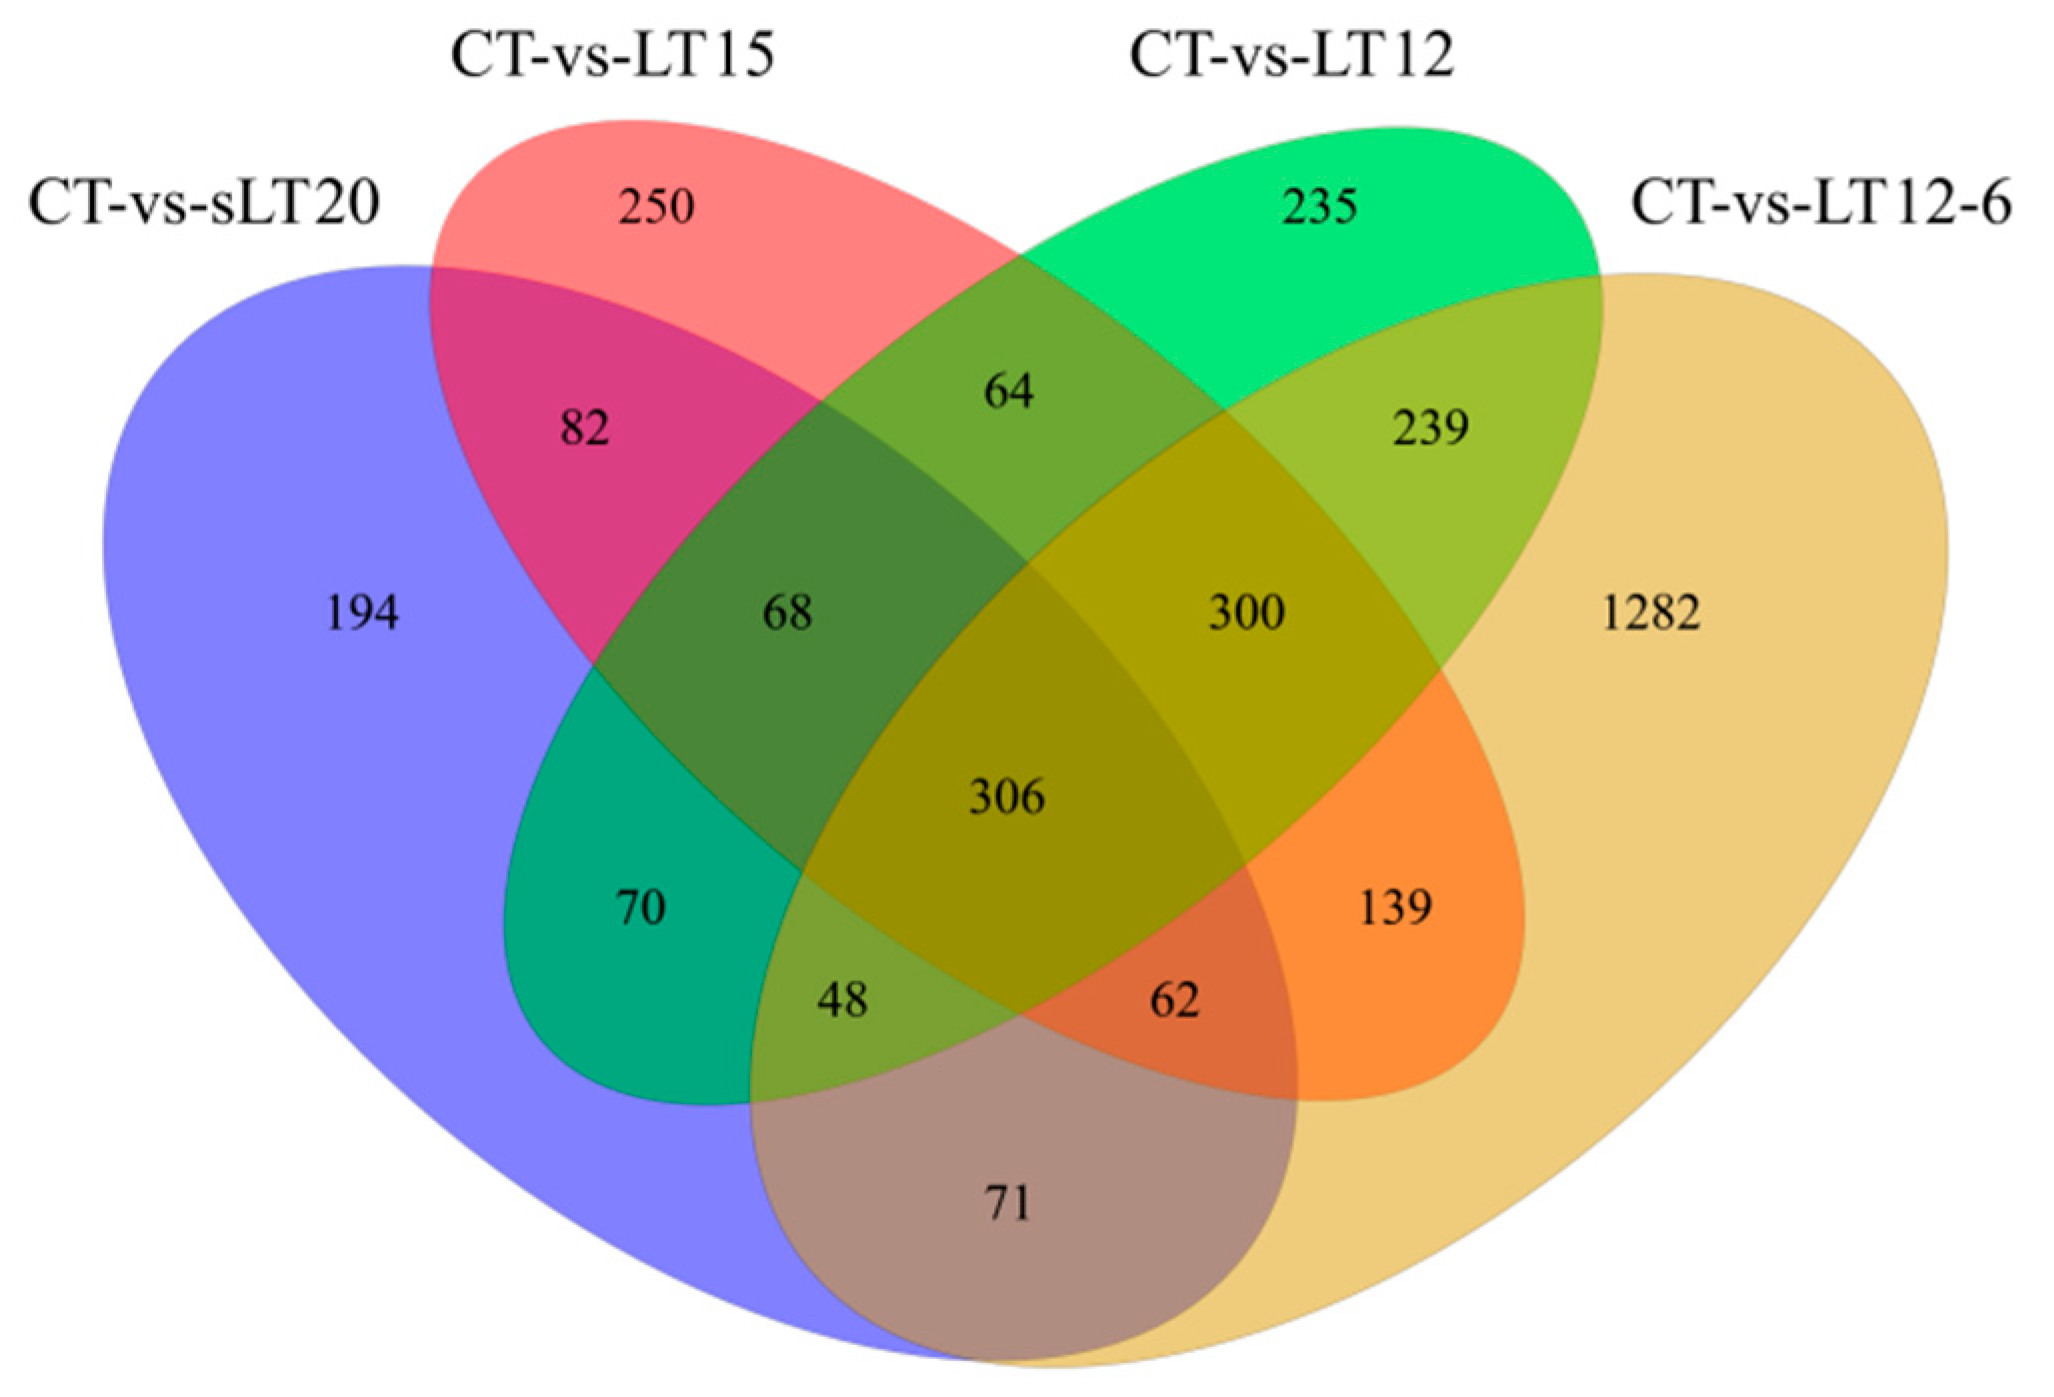
3.3. DEGs Identification
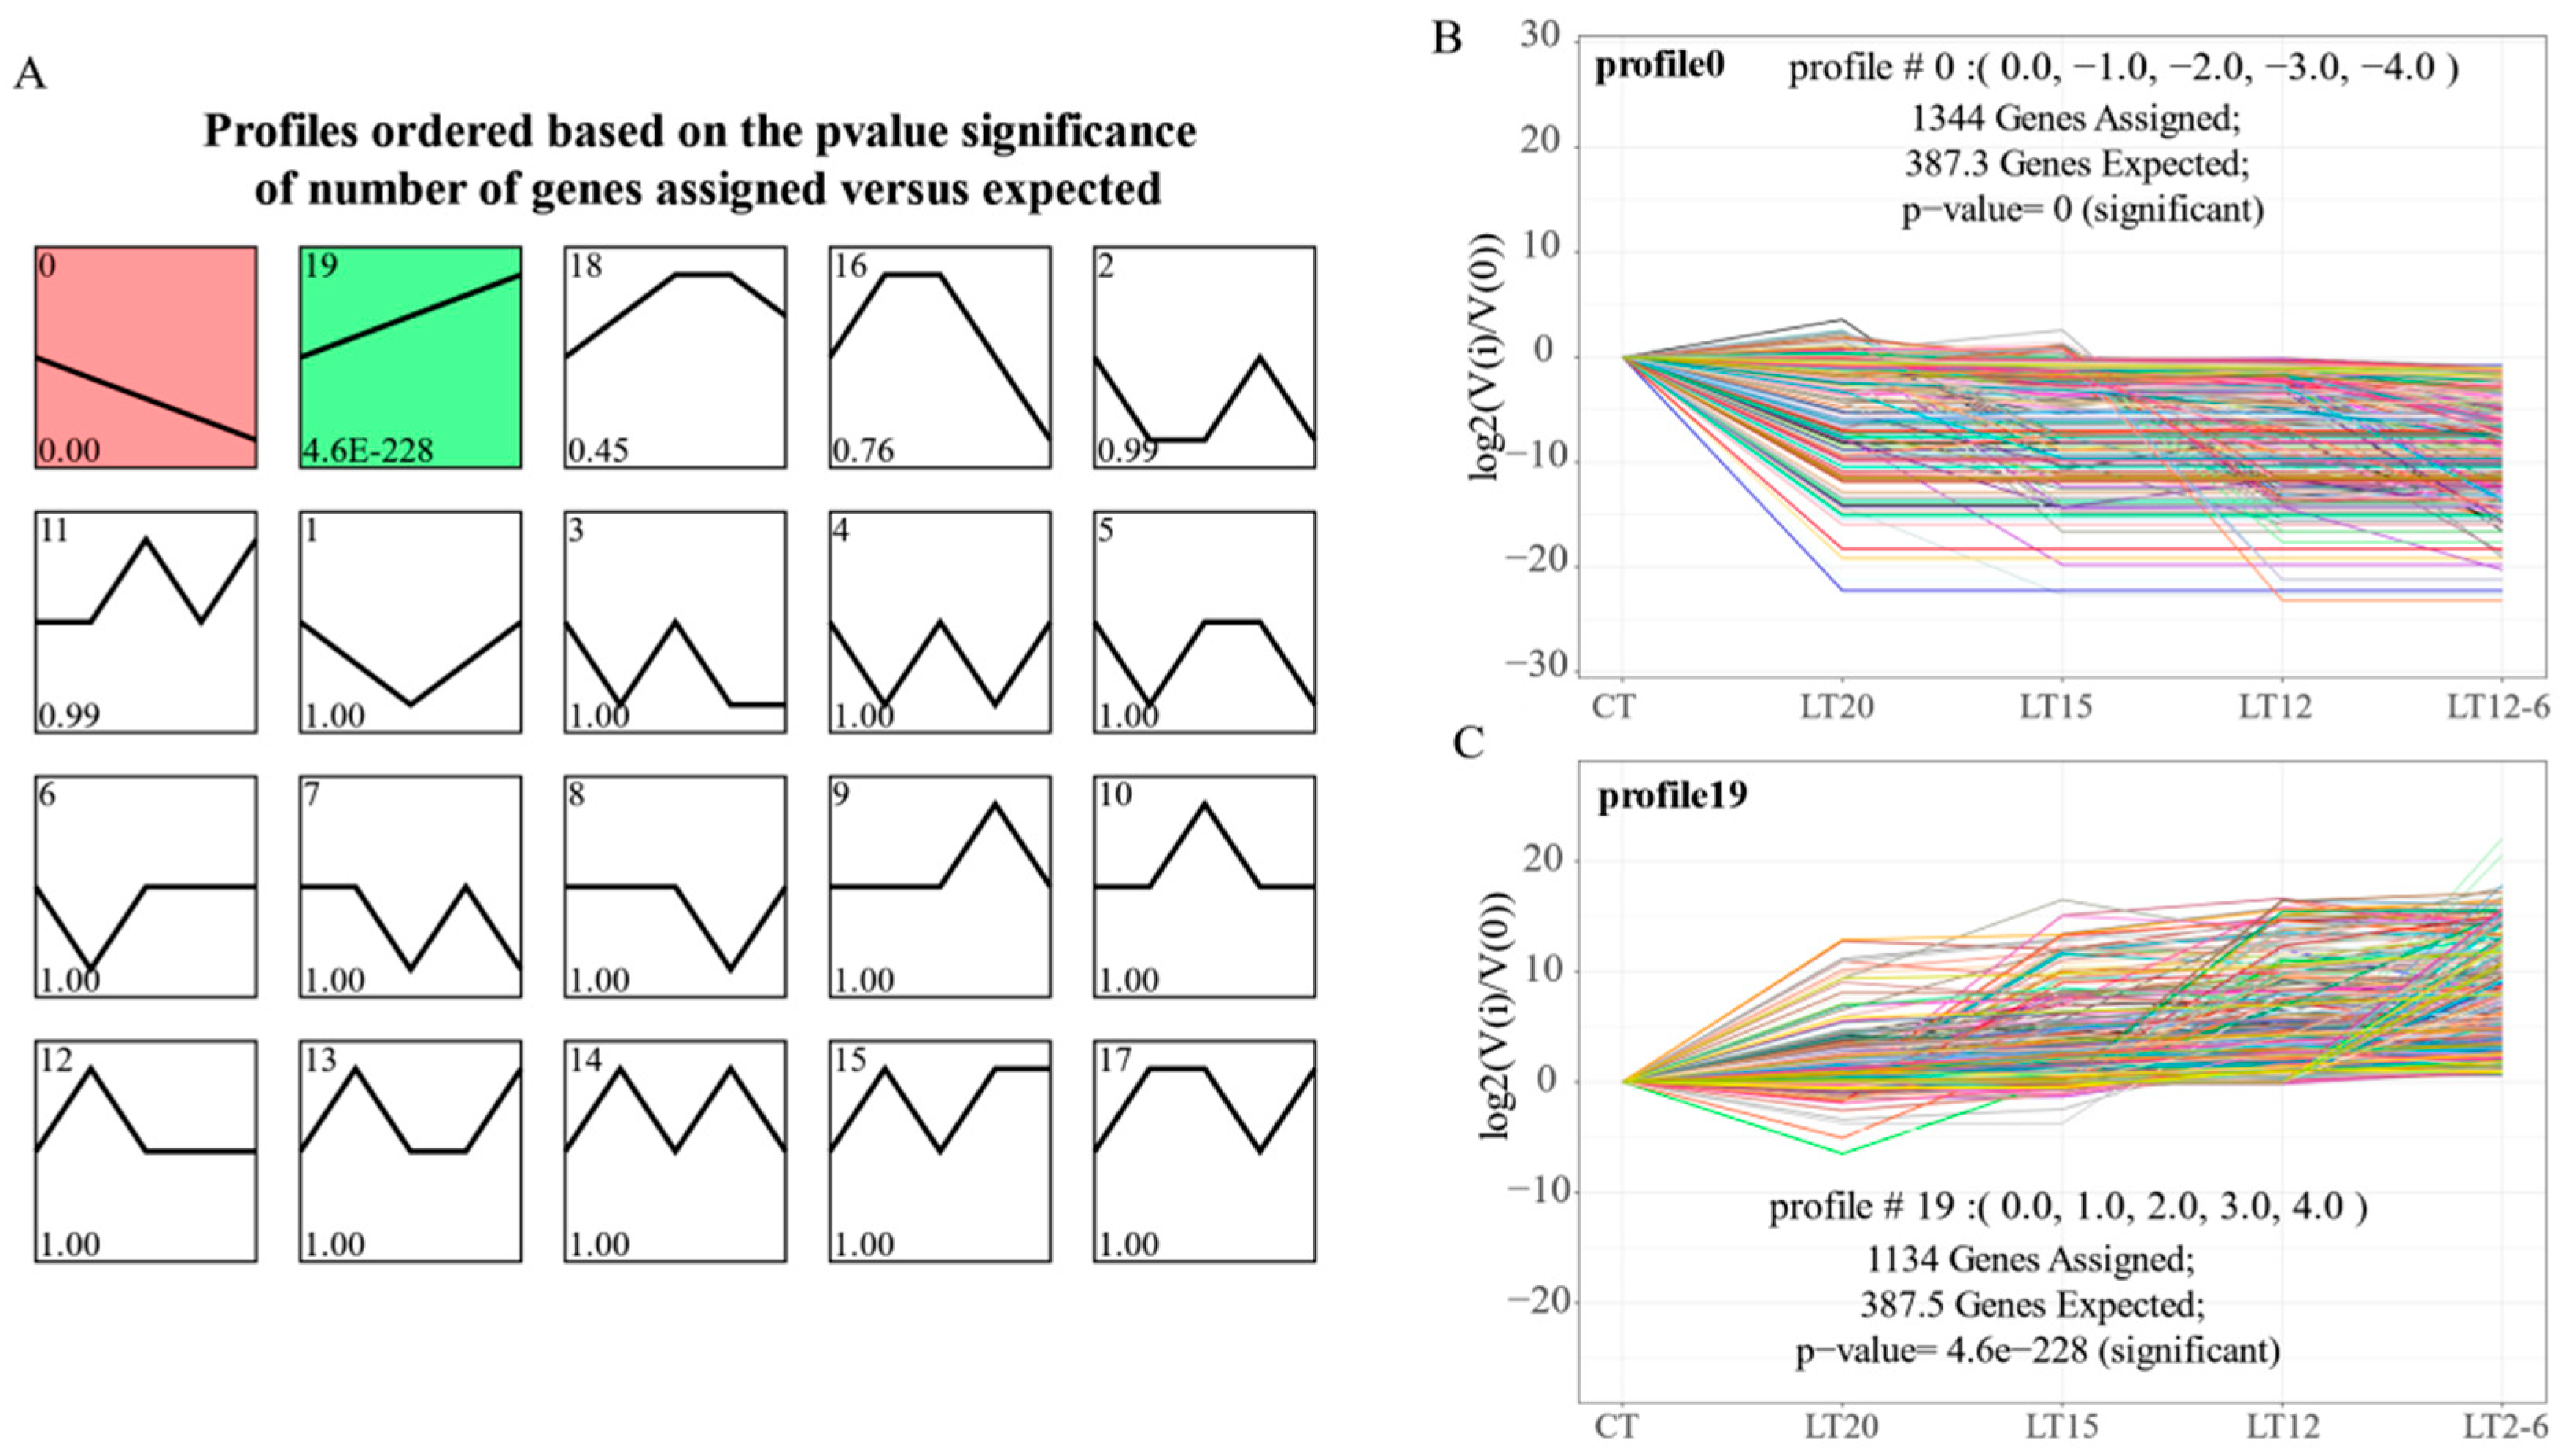
3.4. STEM Analysis
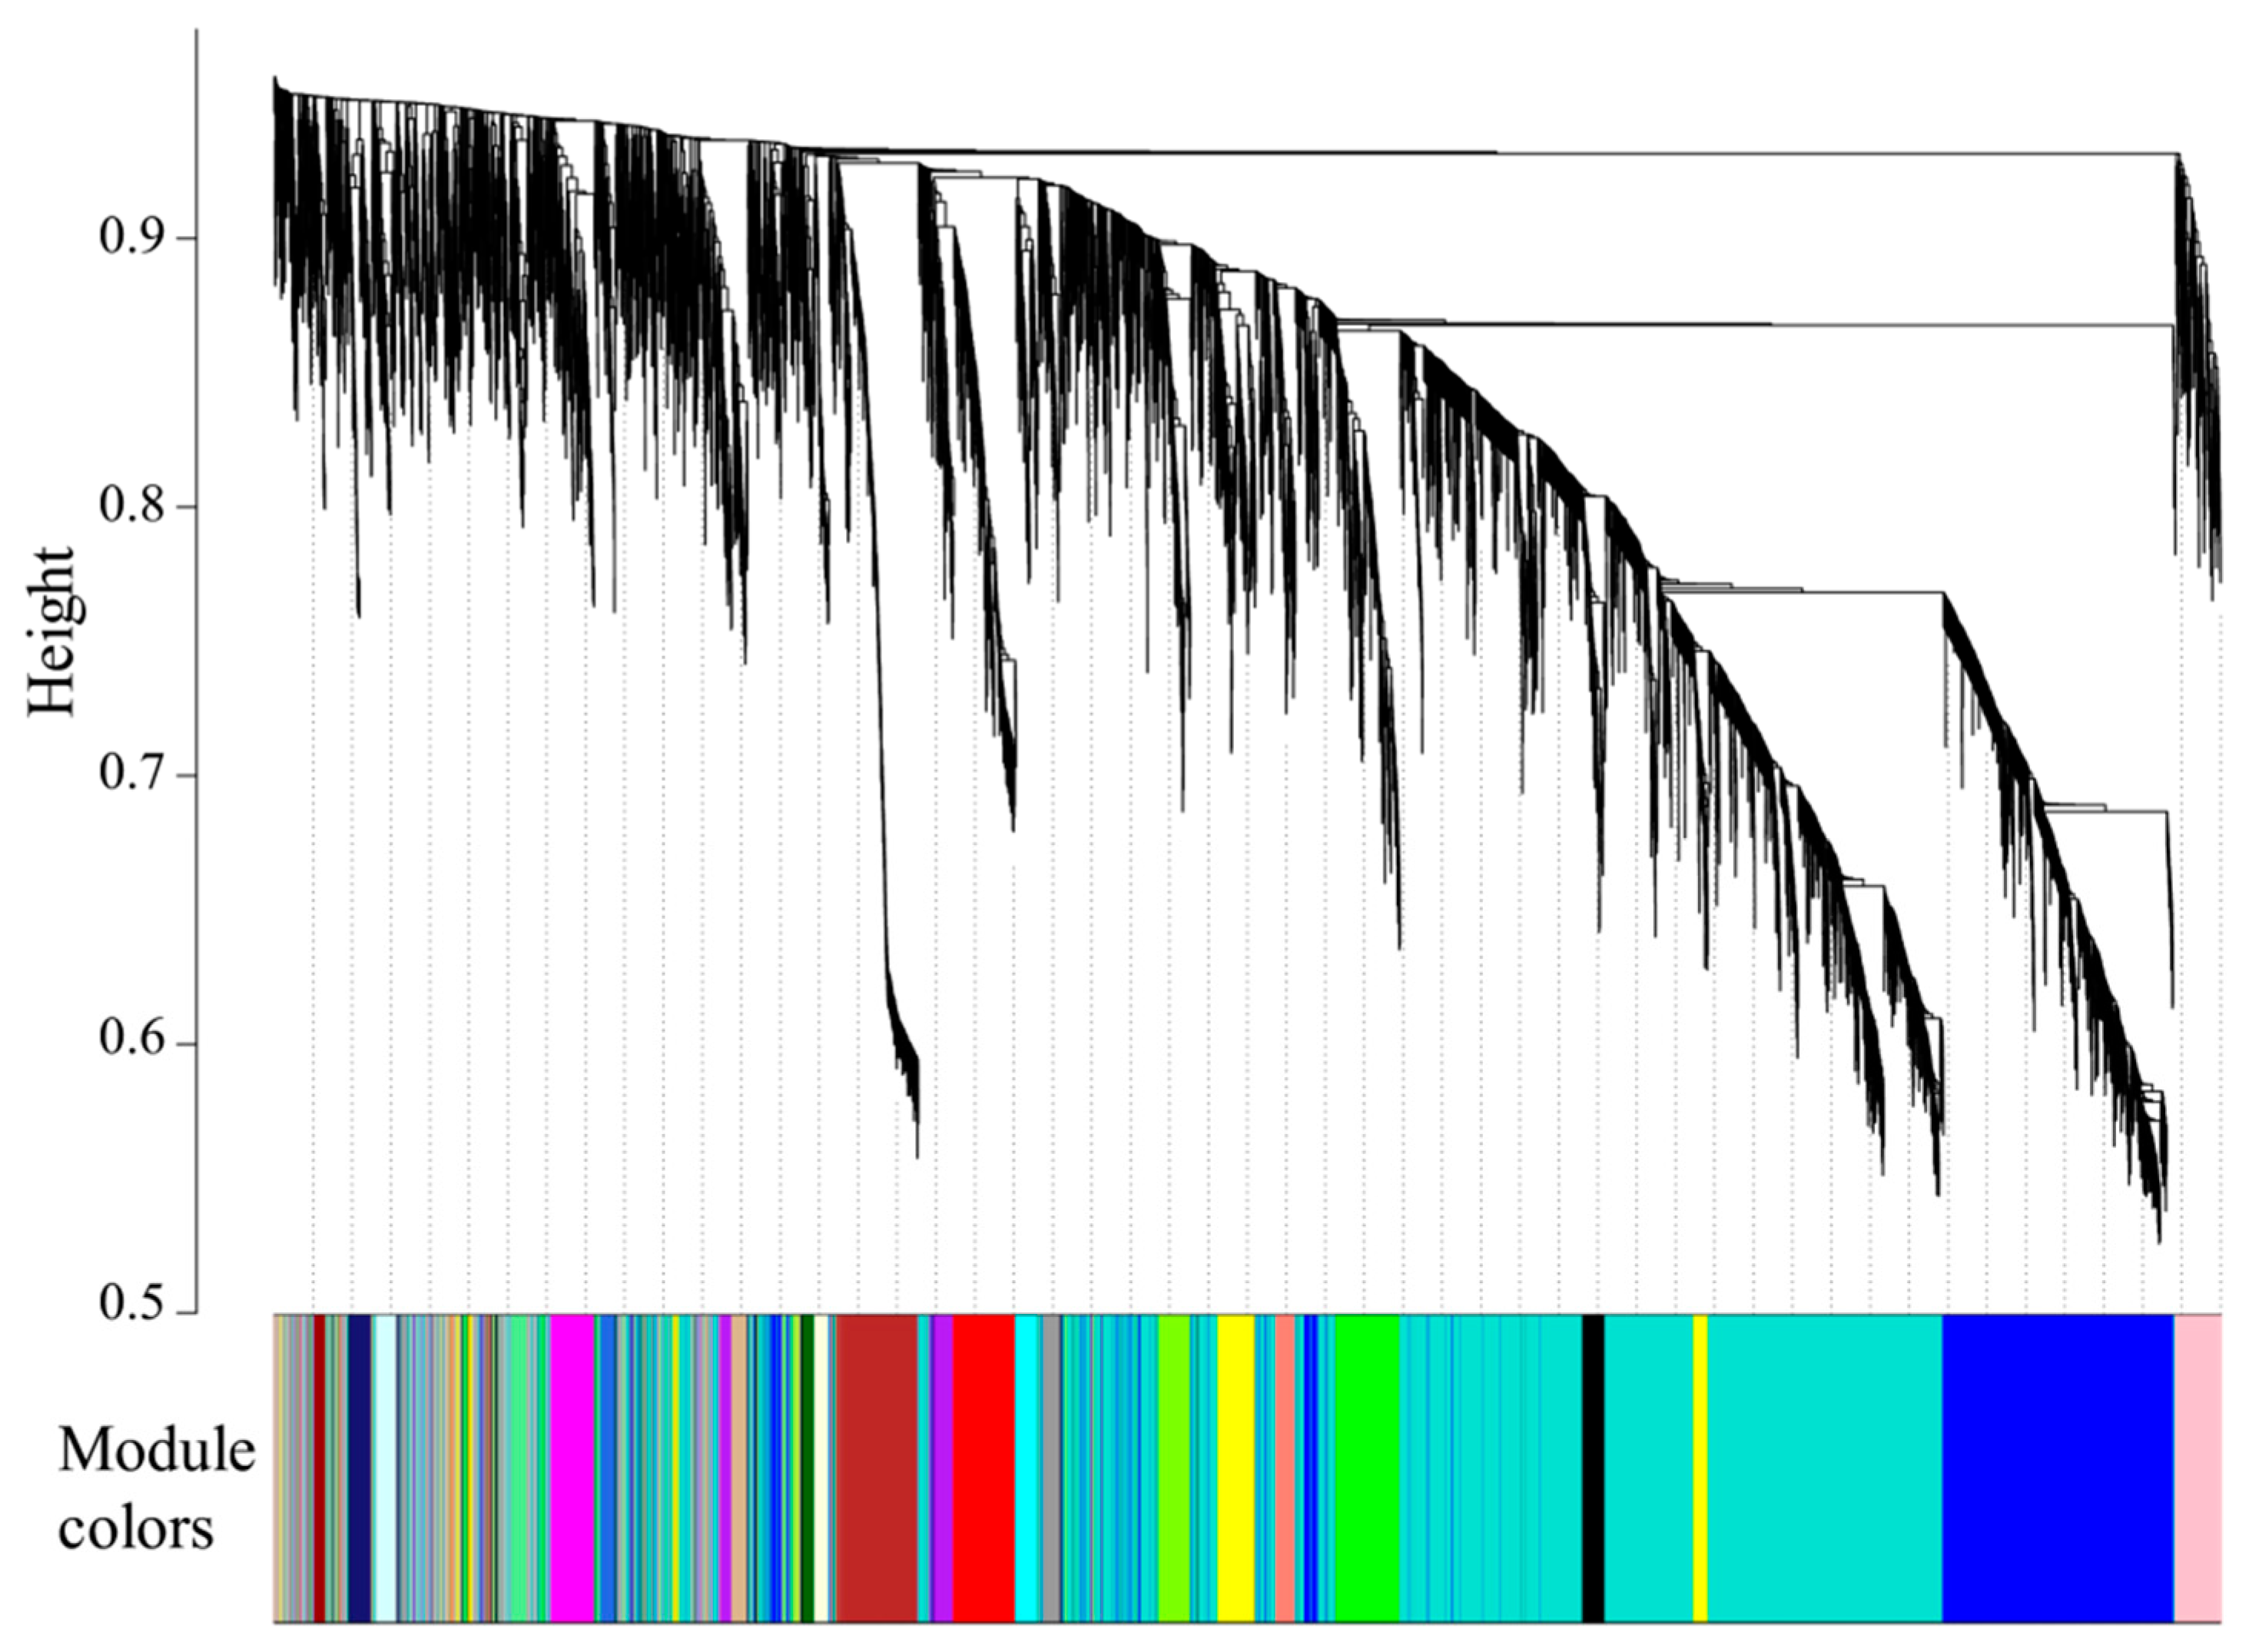
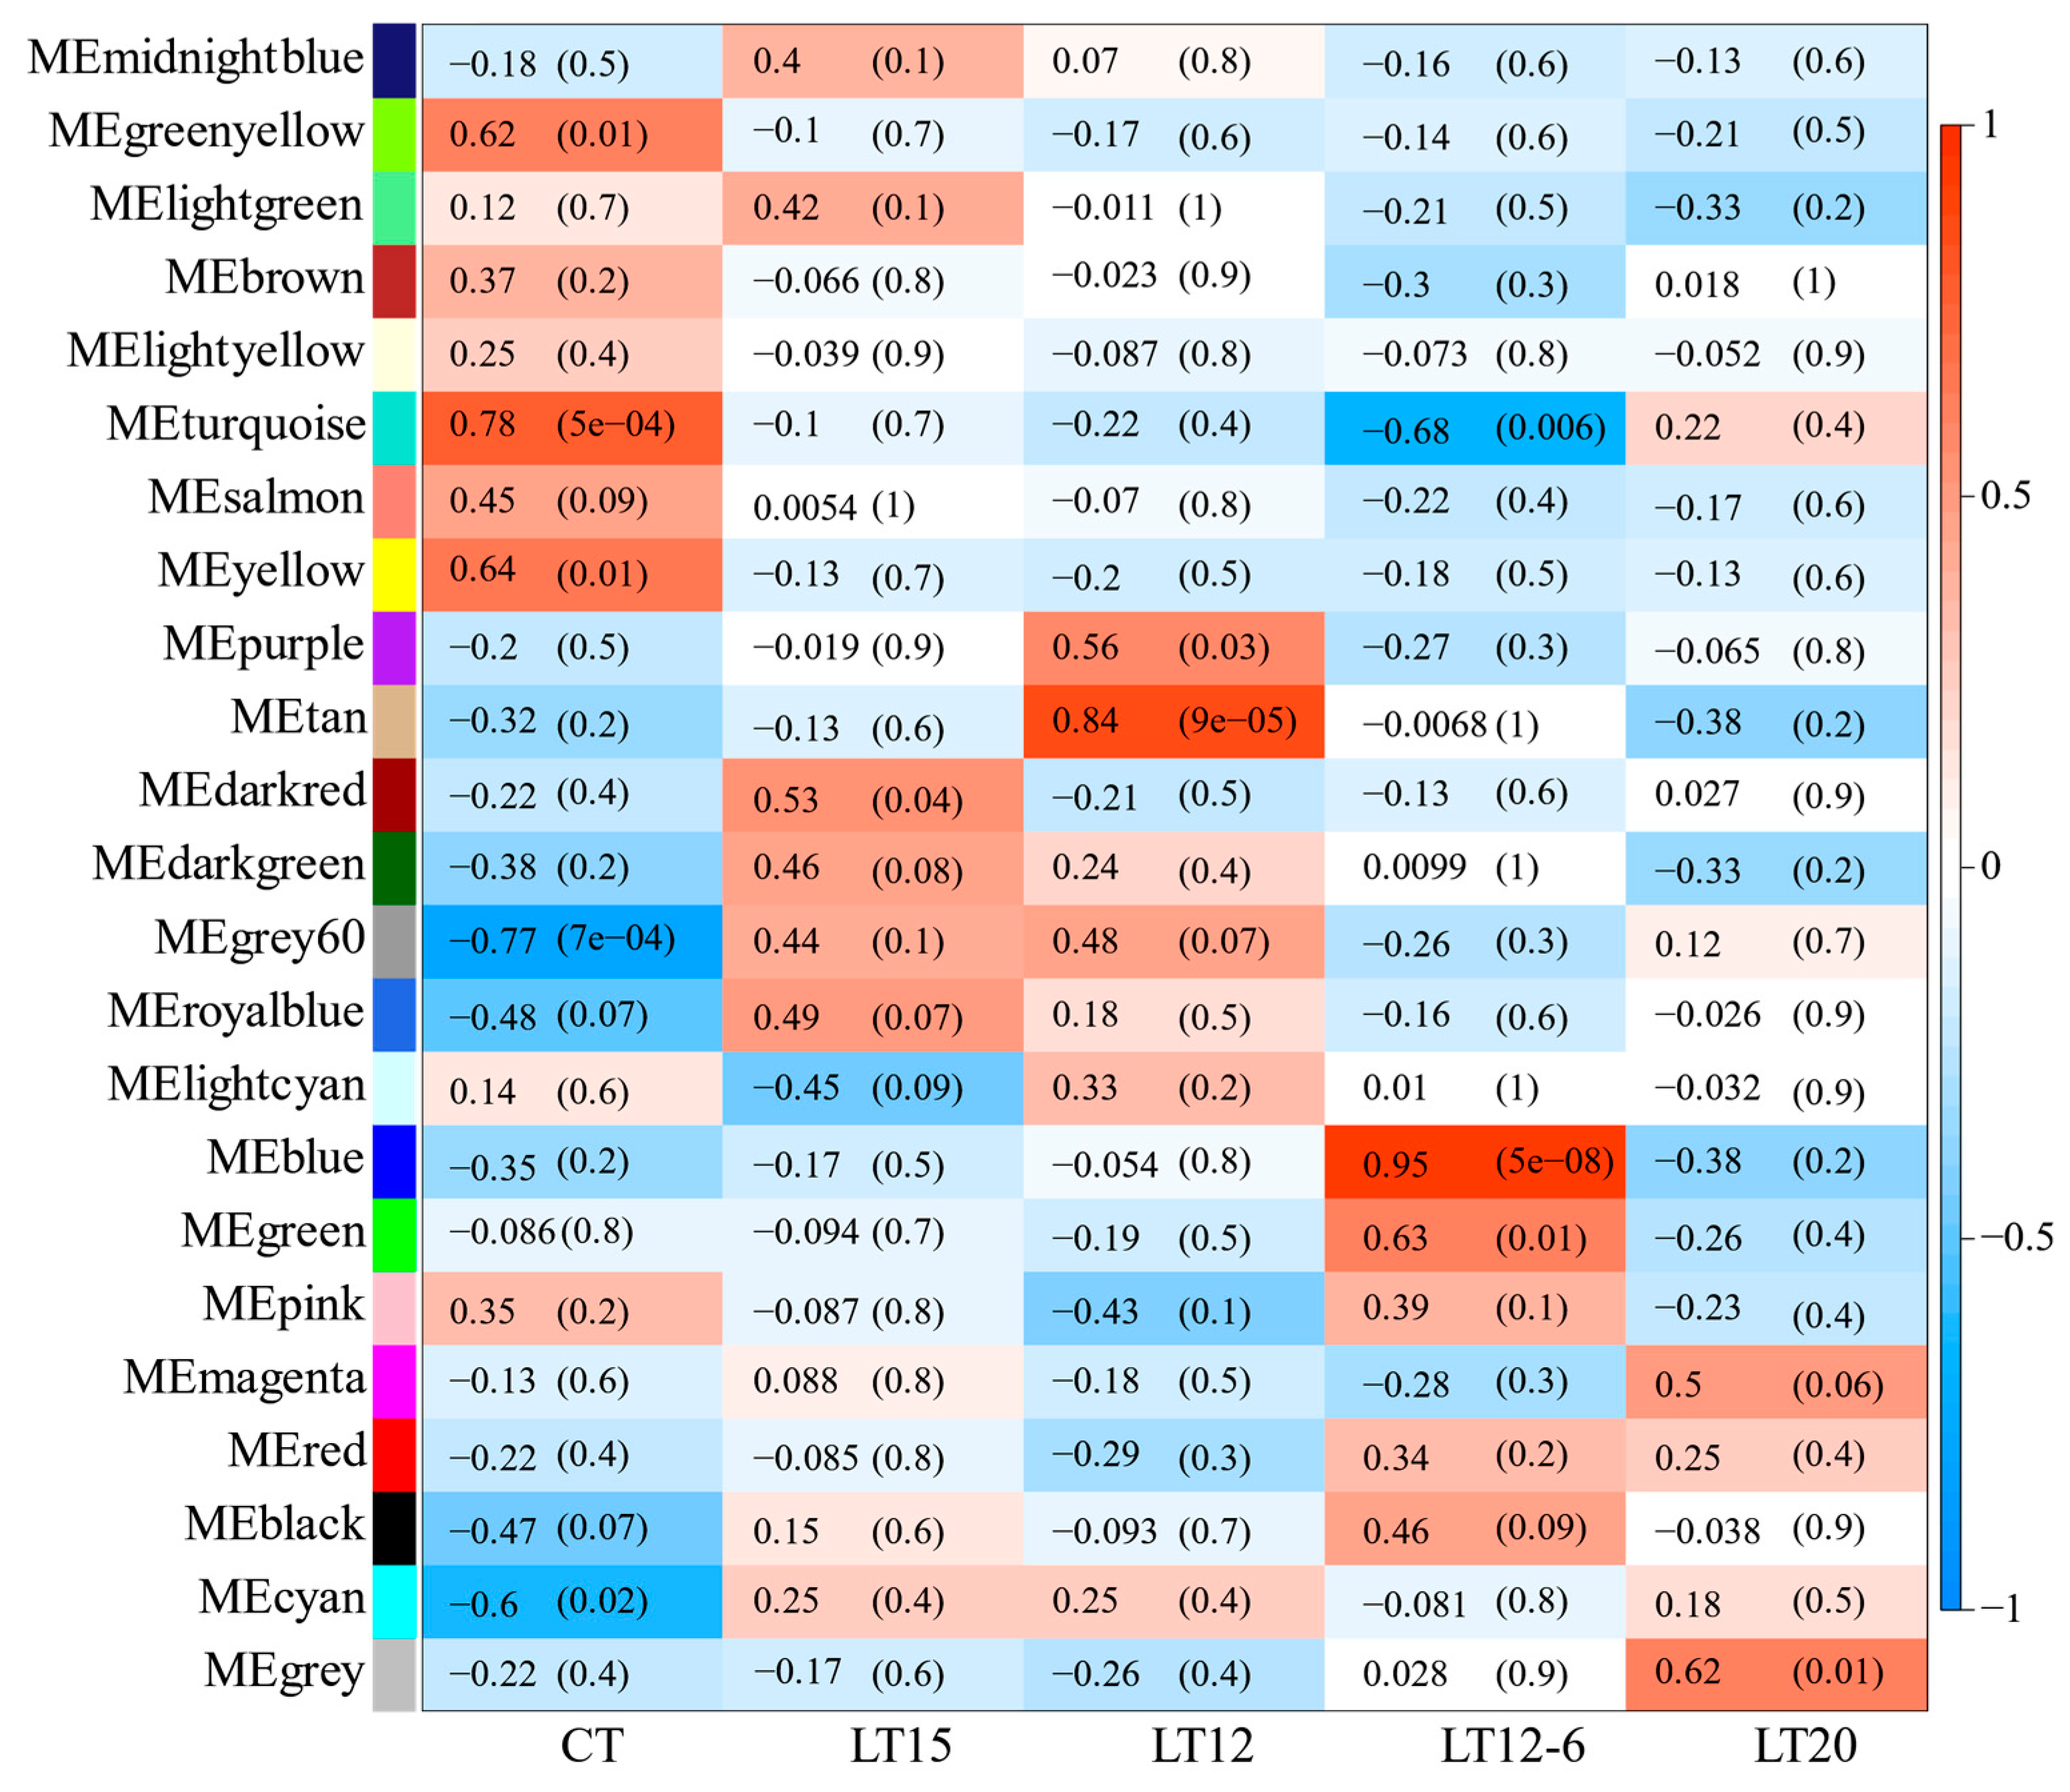
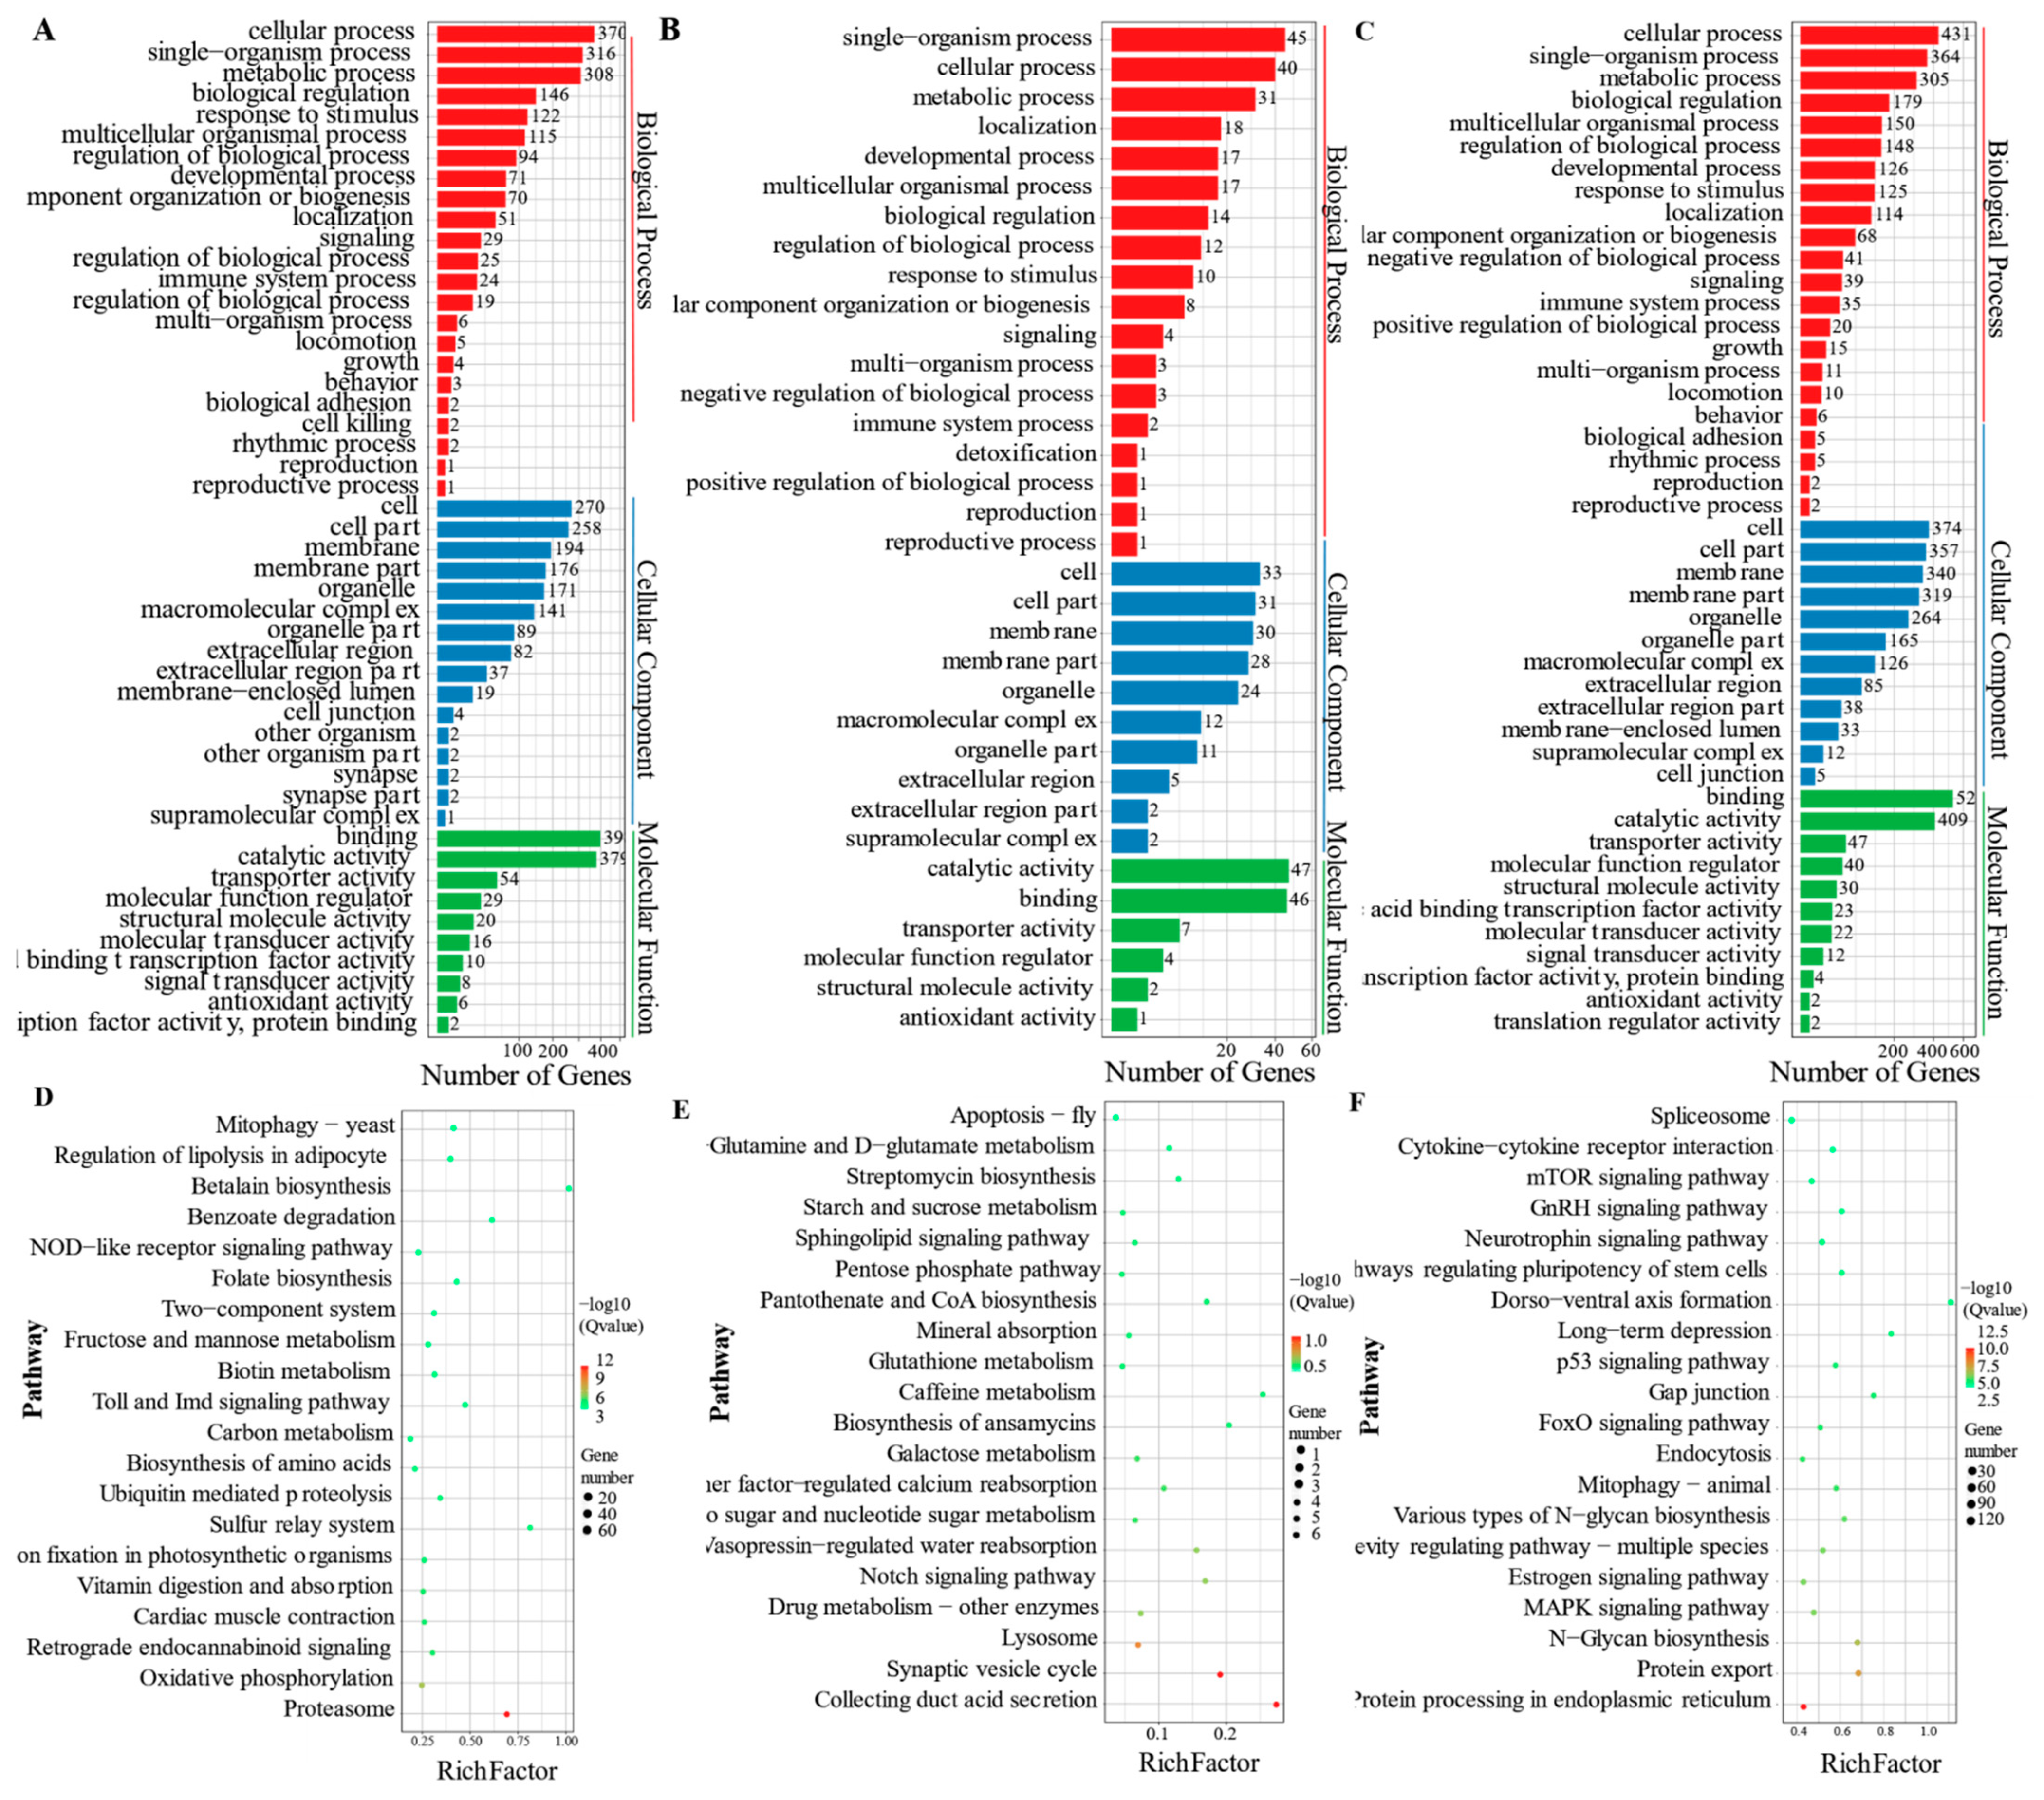
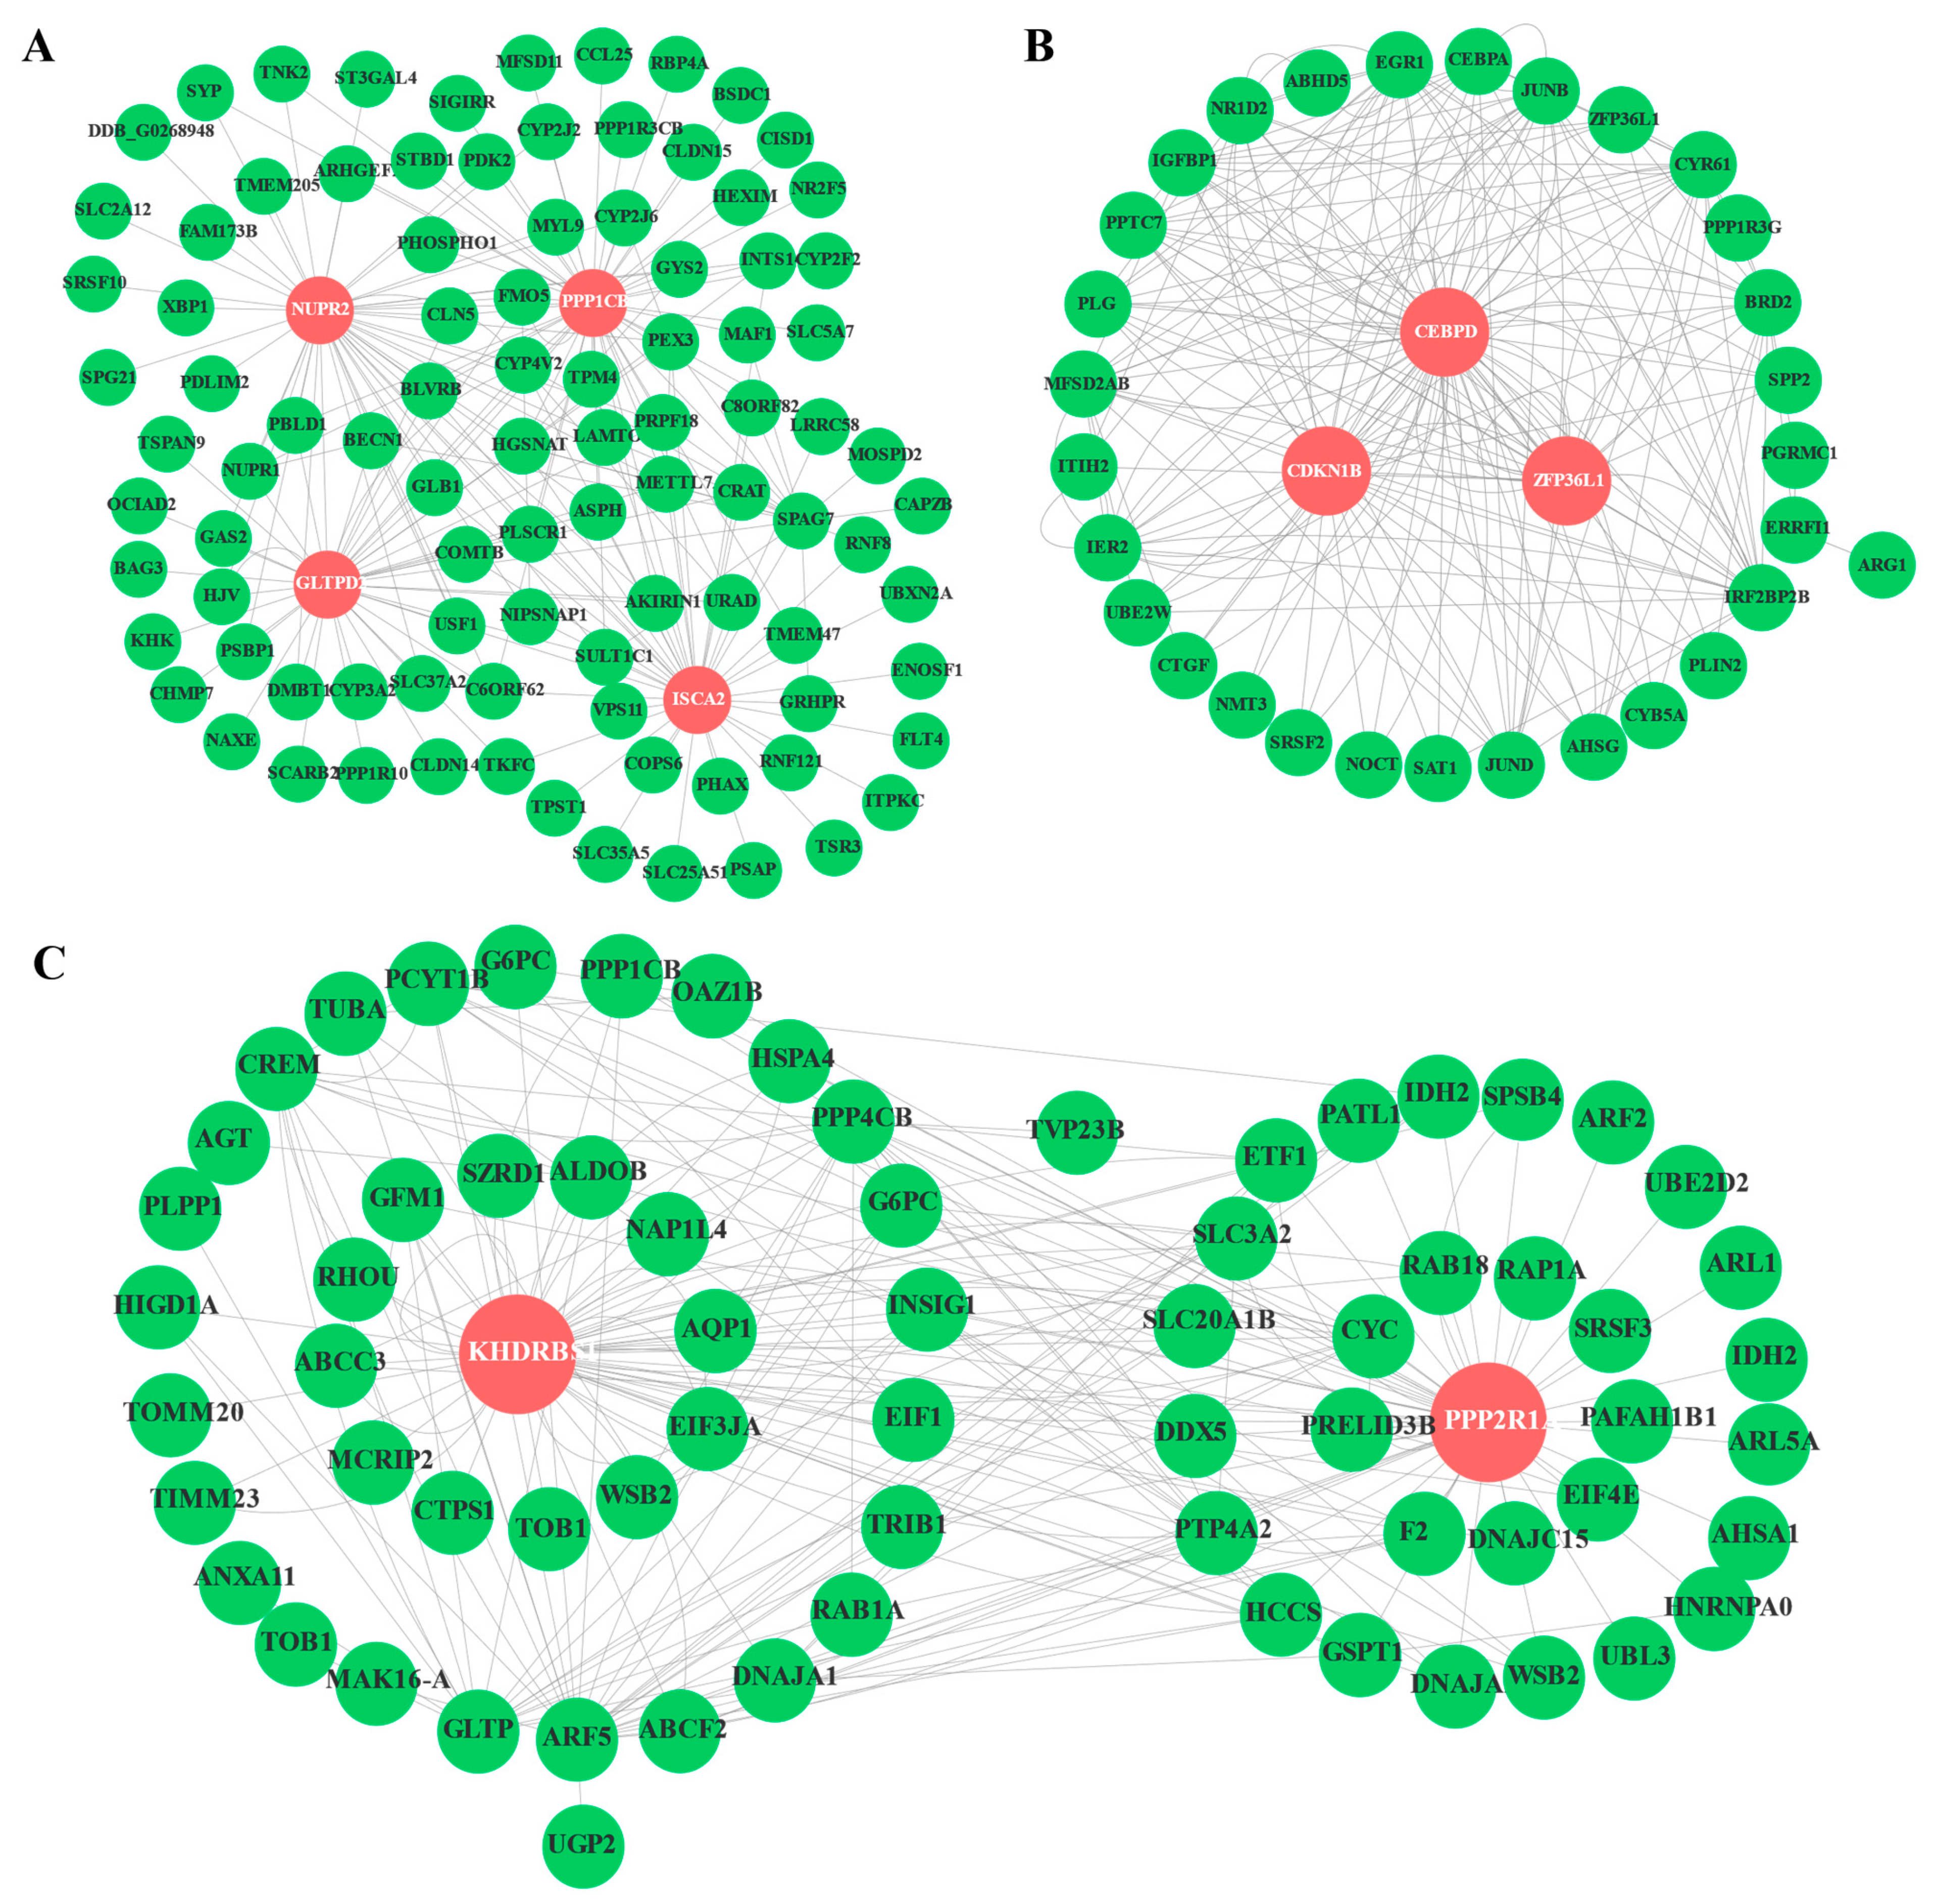
3.5. WGCNA
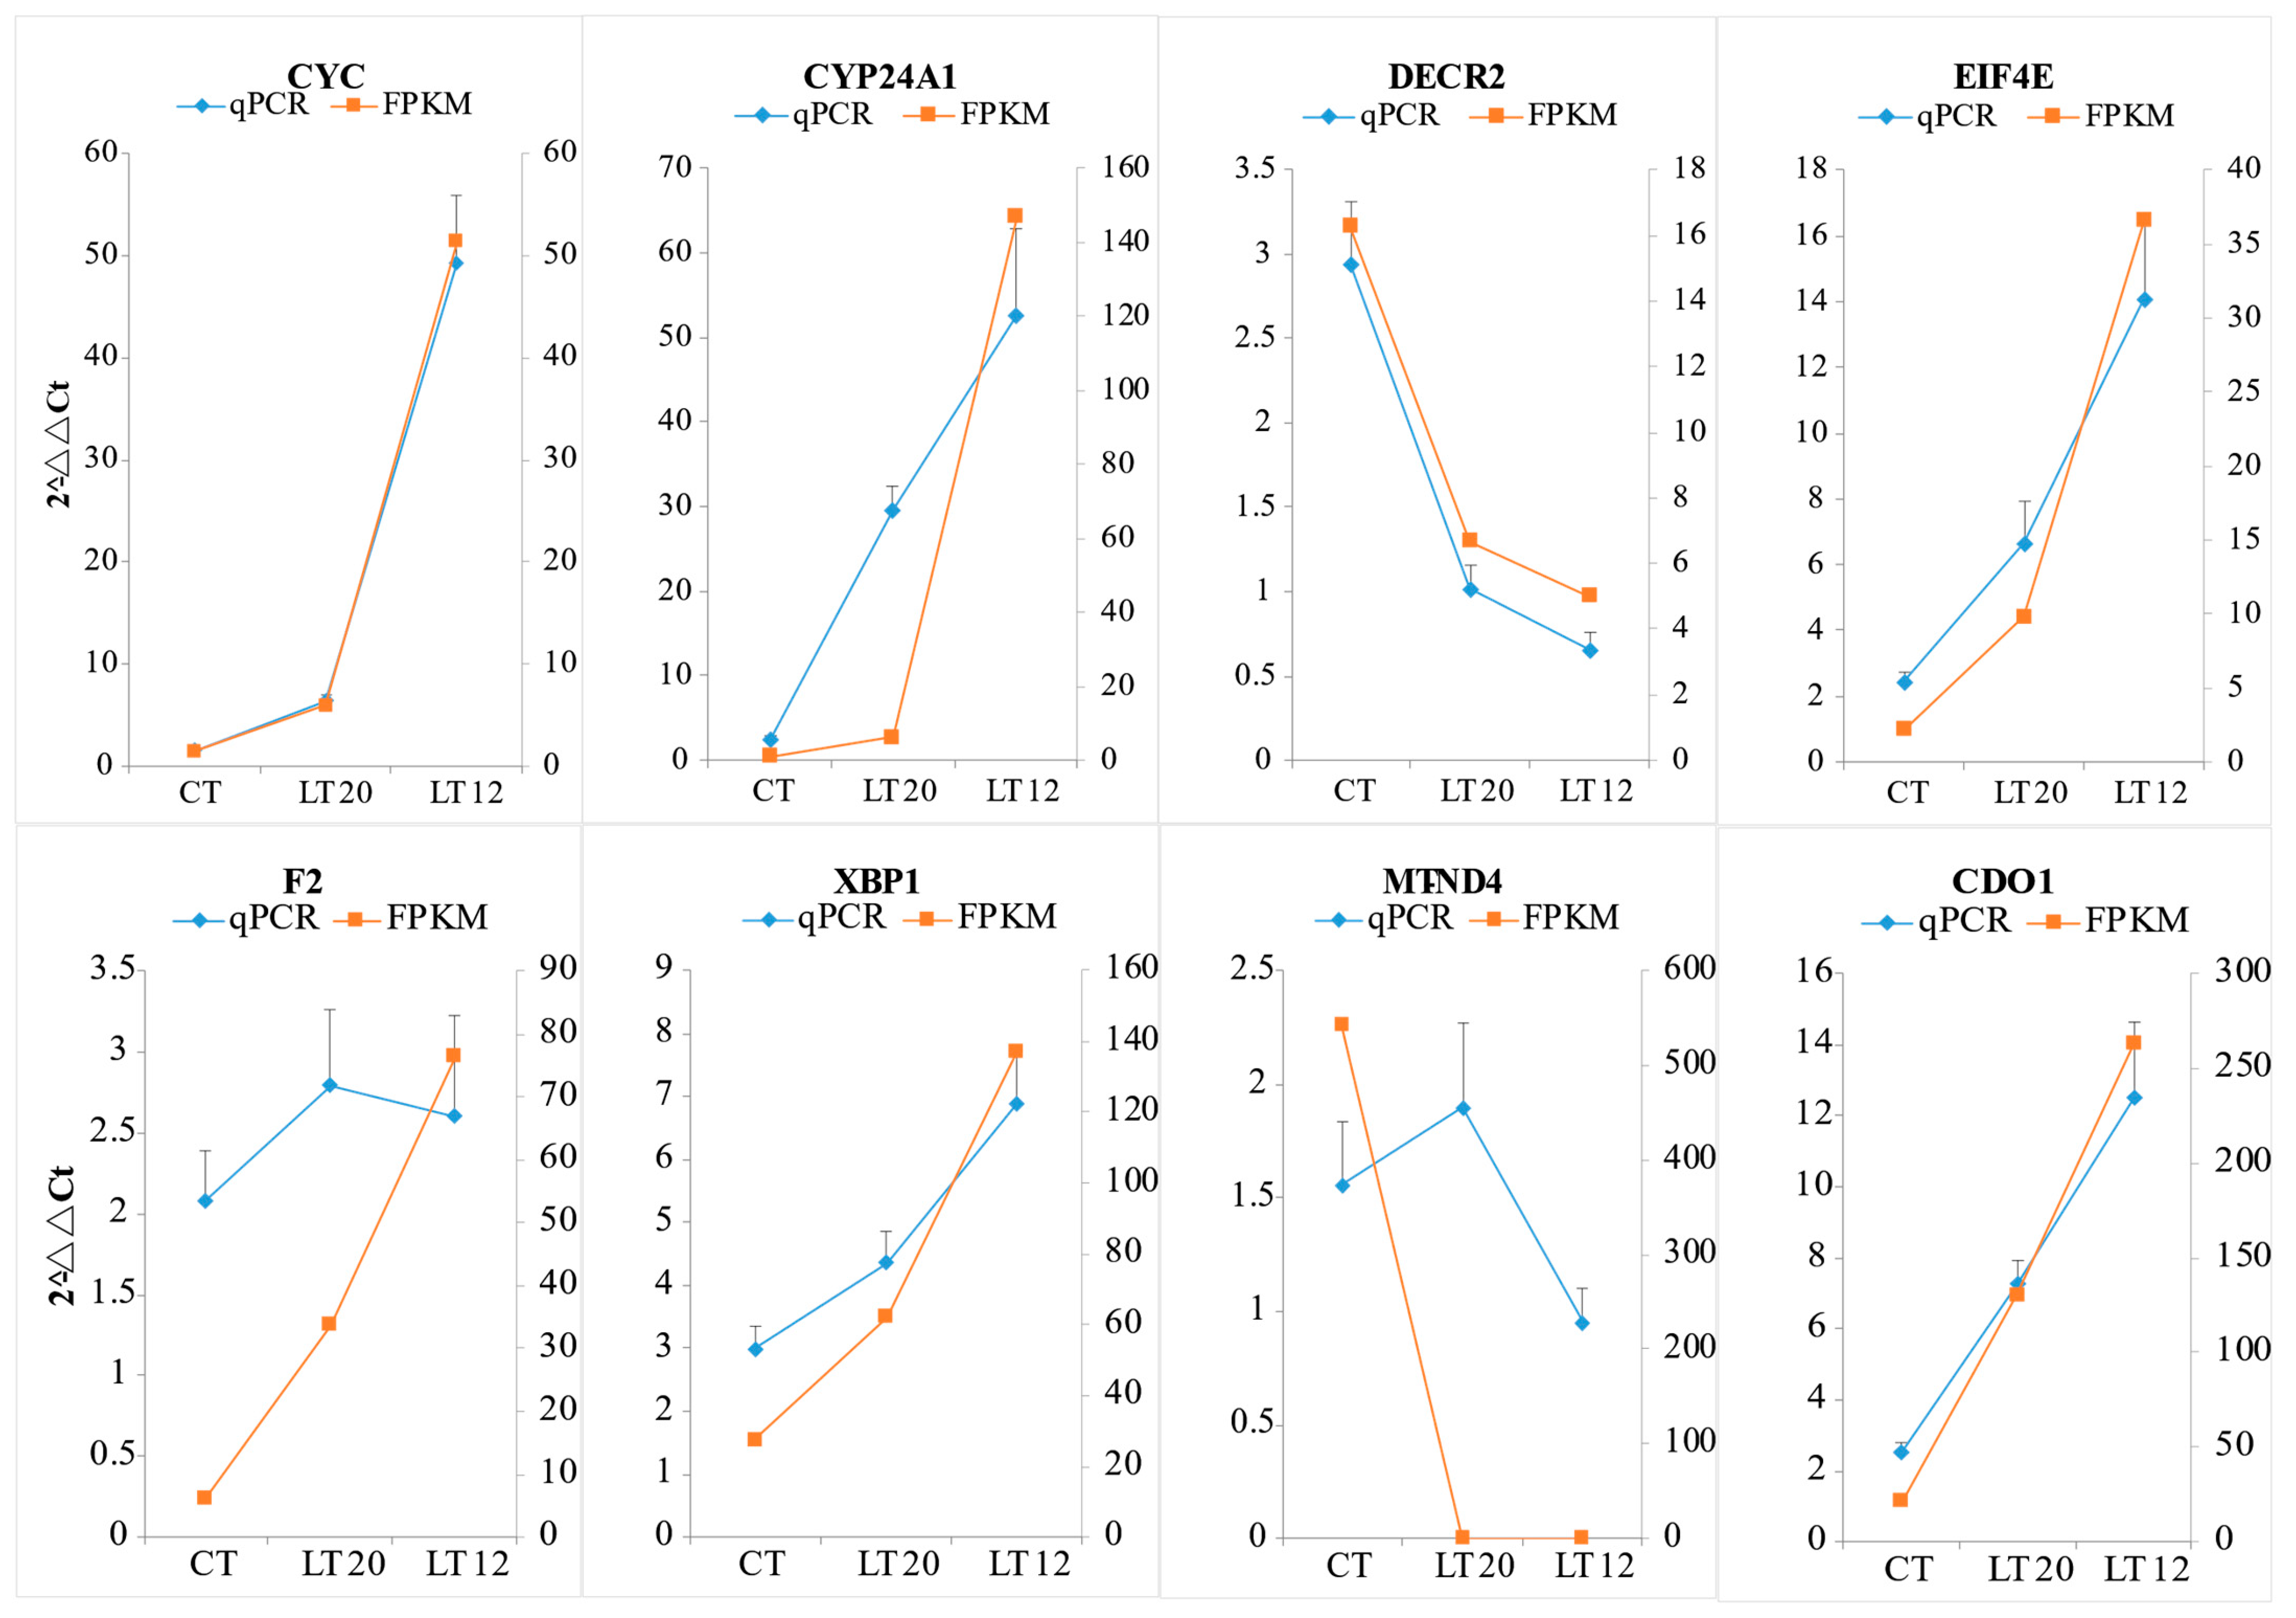
3.6. Validation of DEGs Using qRT-PCR
4. Discussion
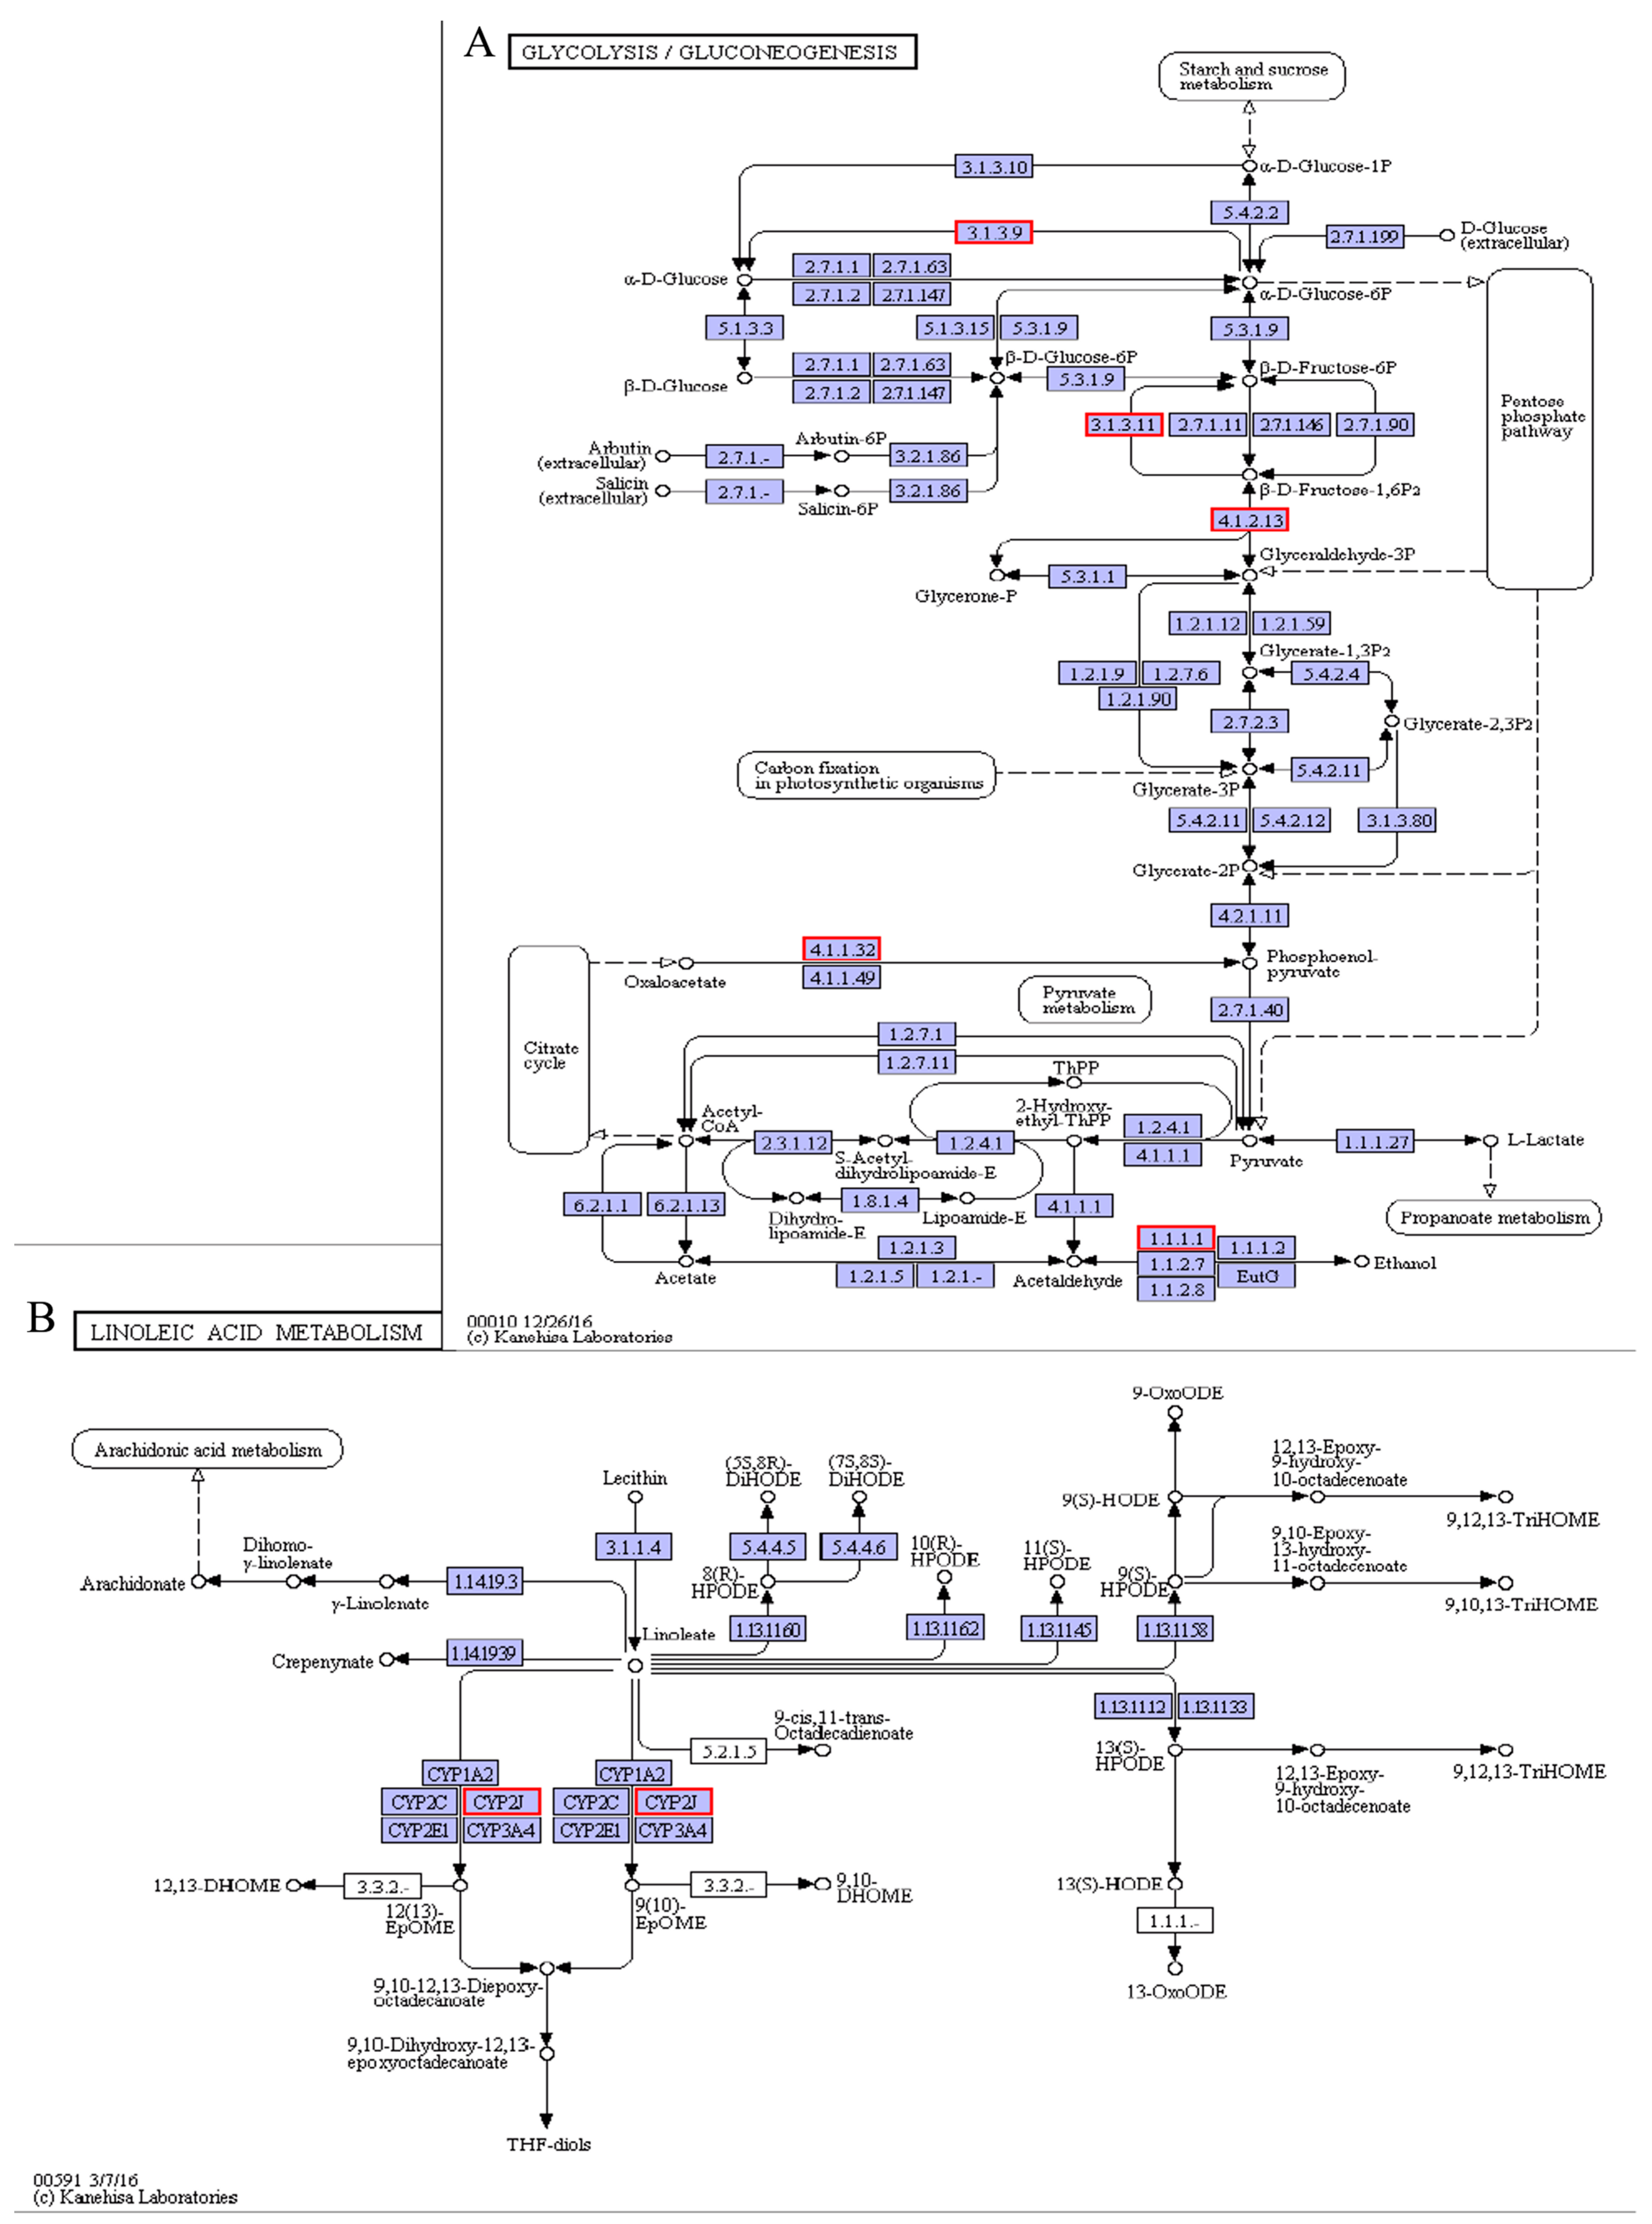
4.1. Metabolic Processes Associated with Cold Stress
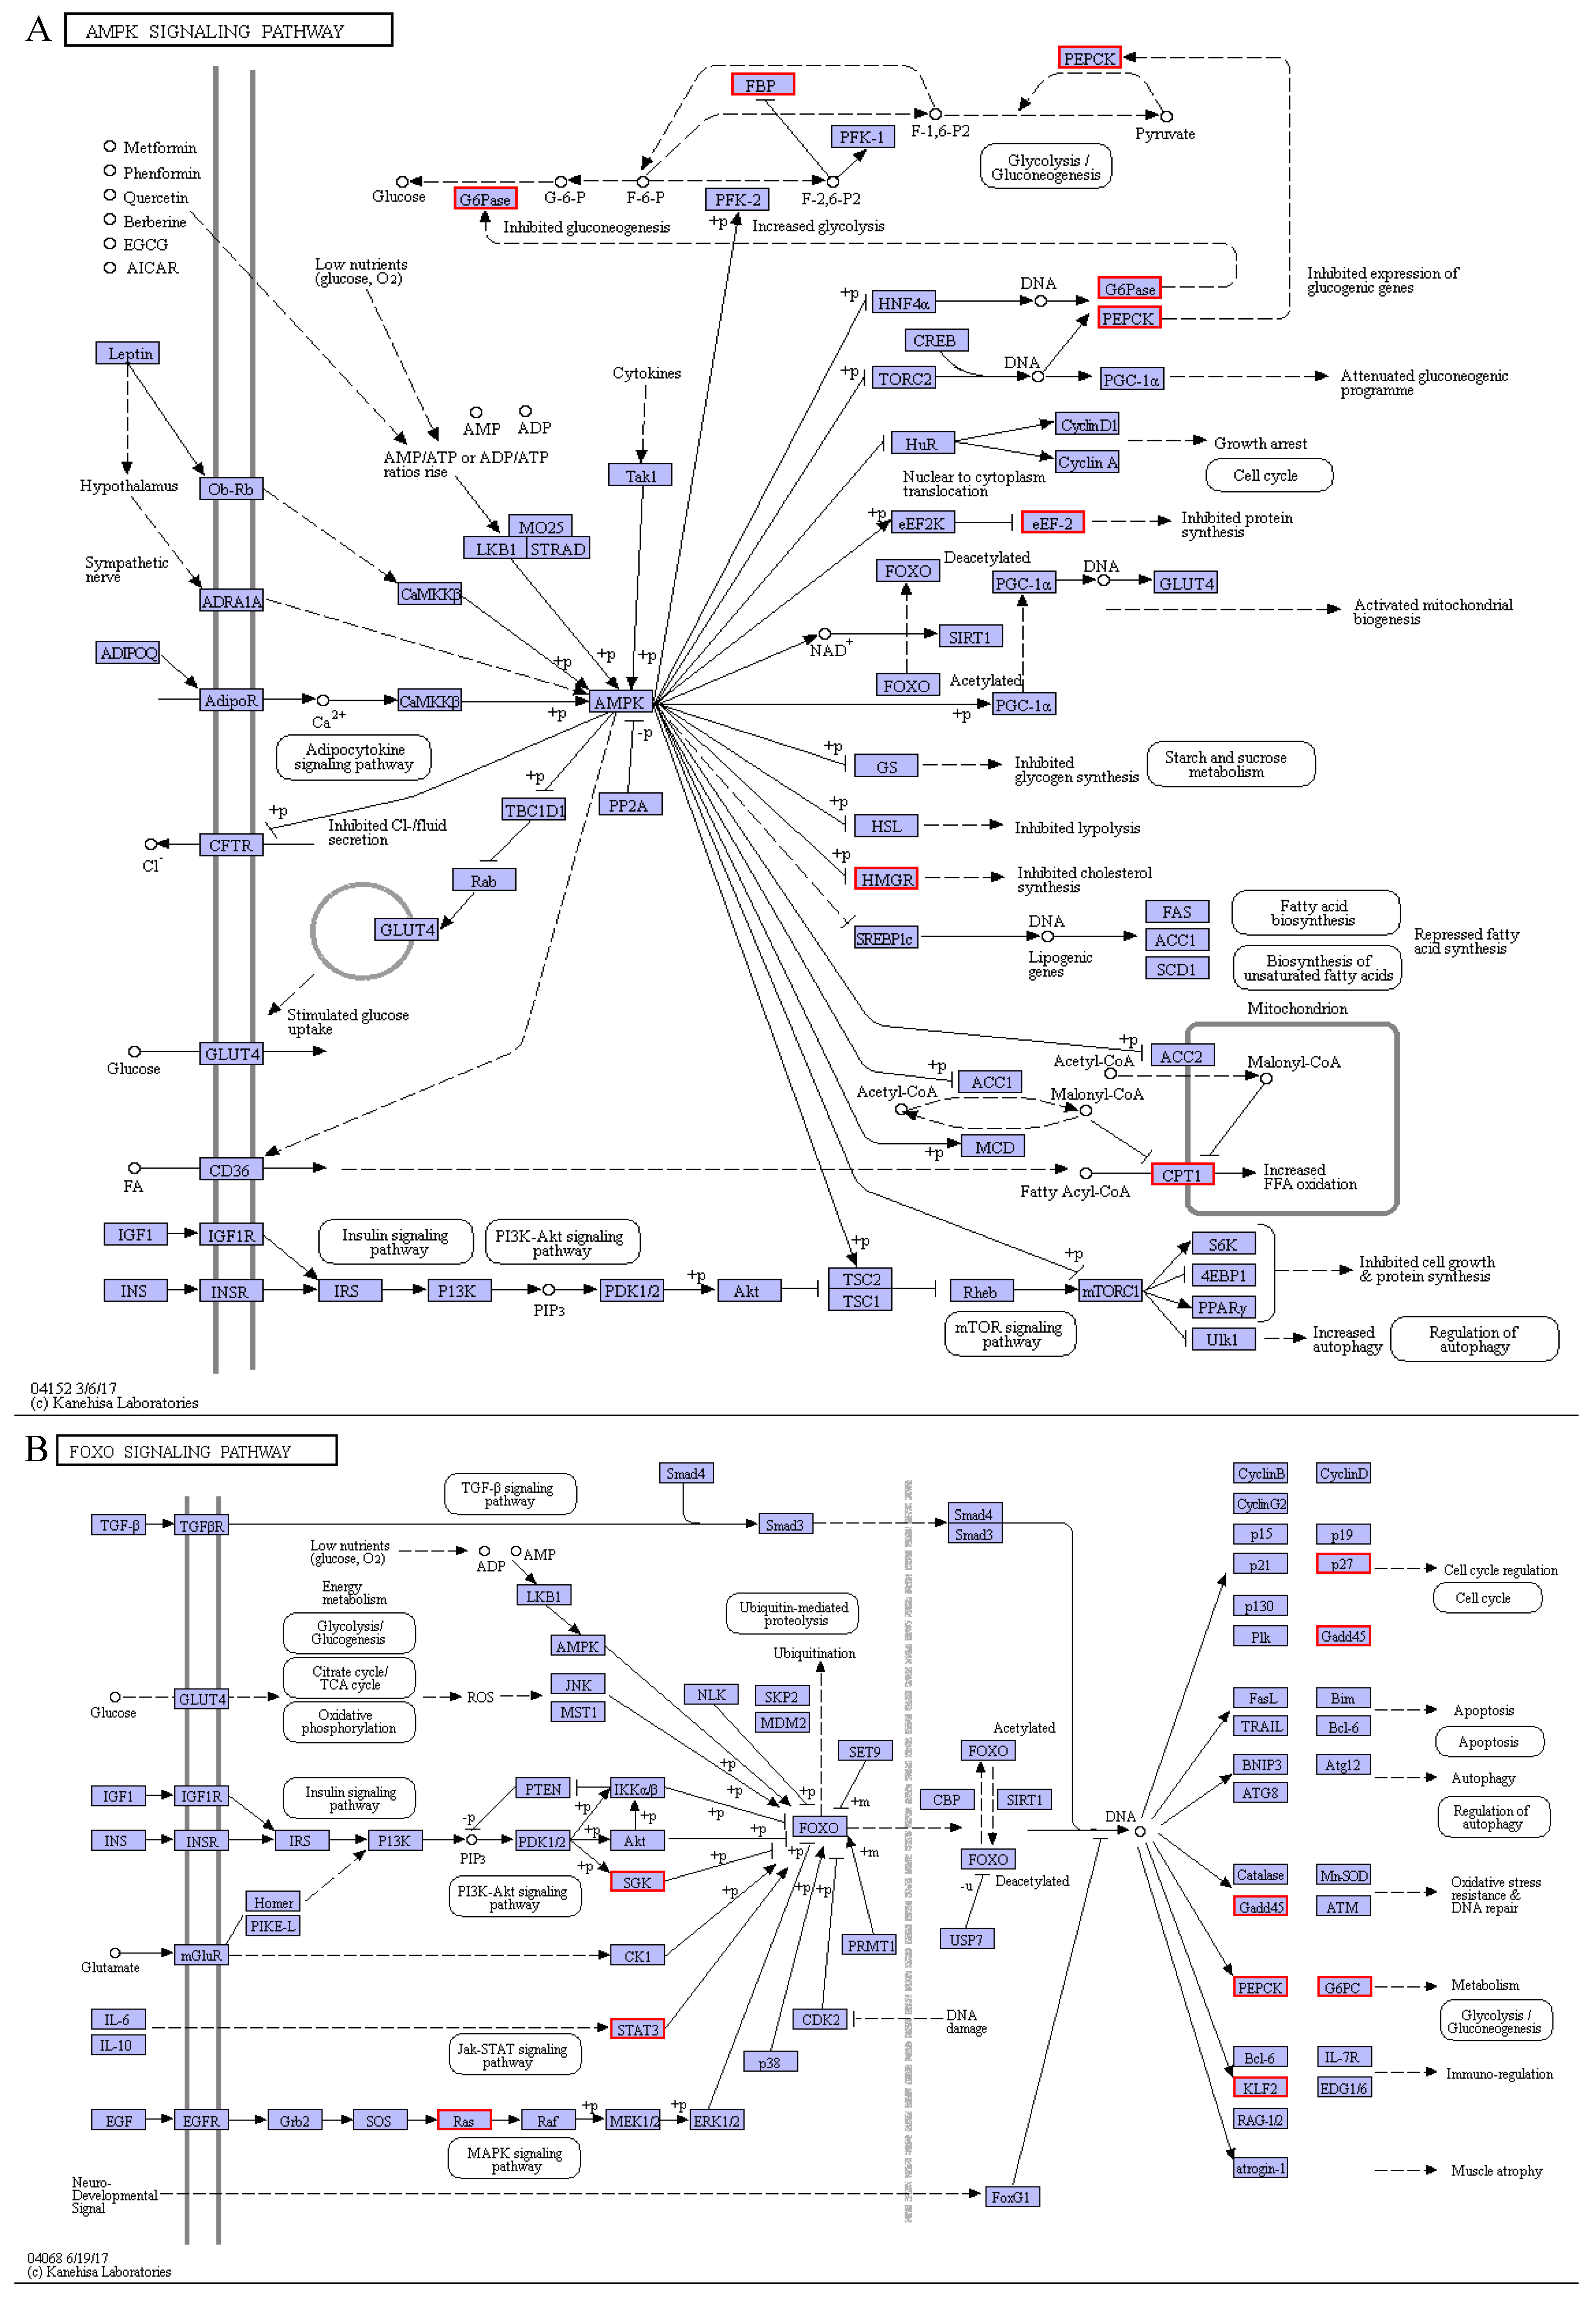
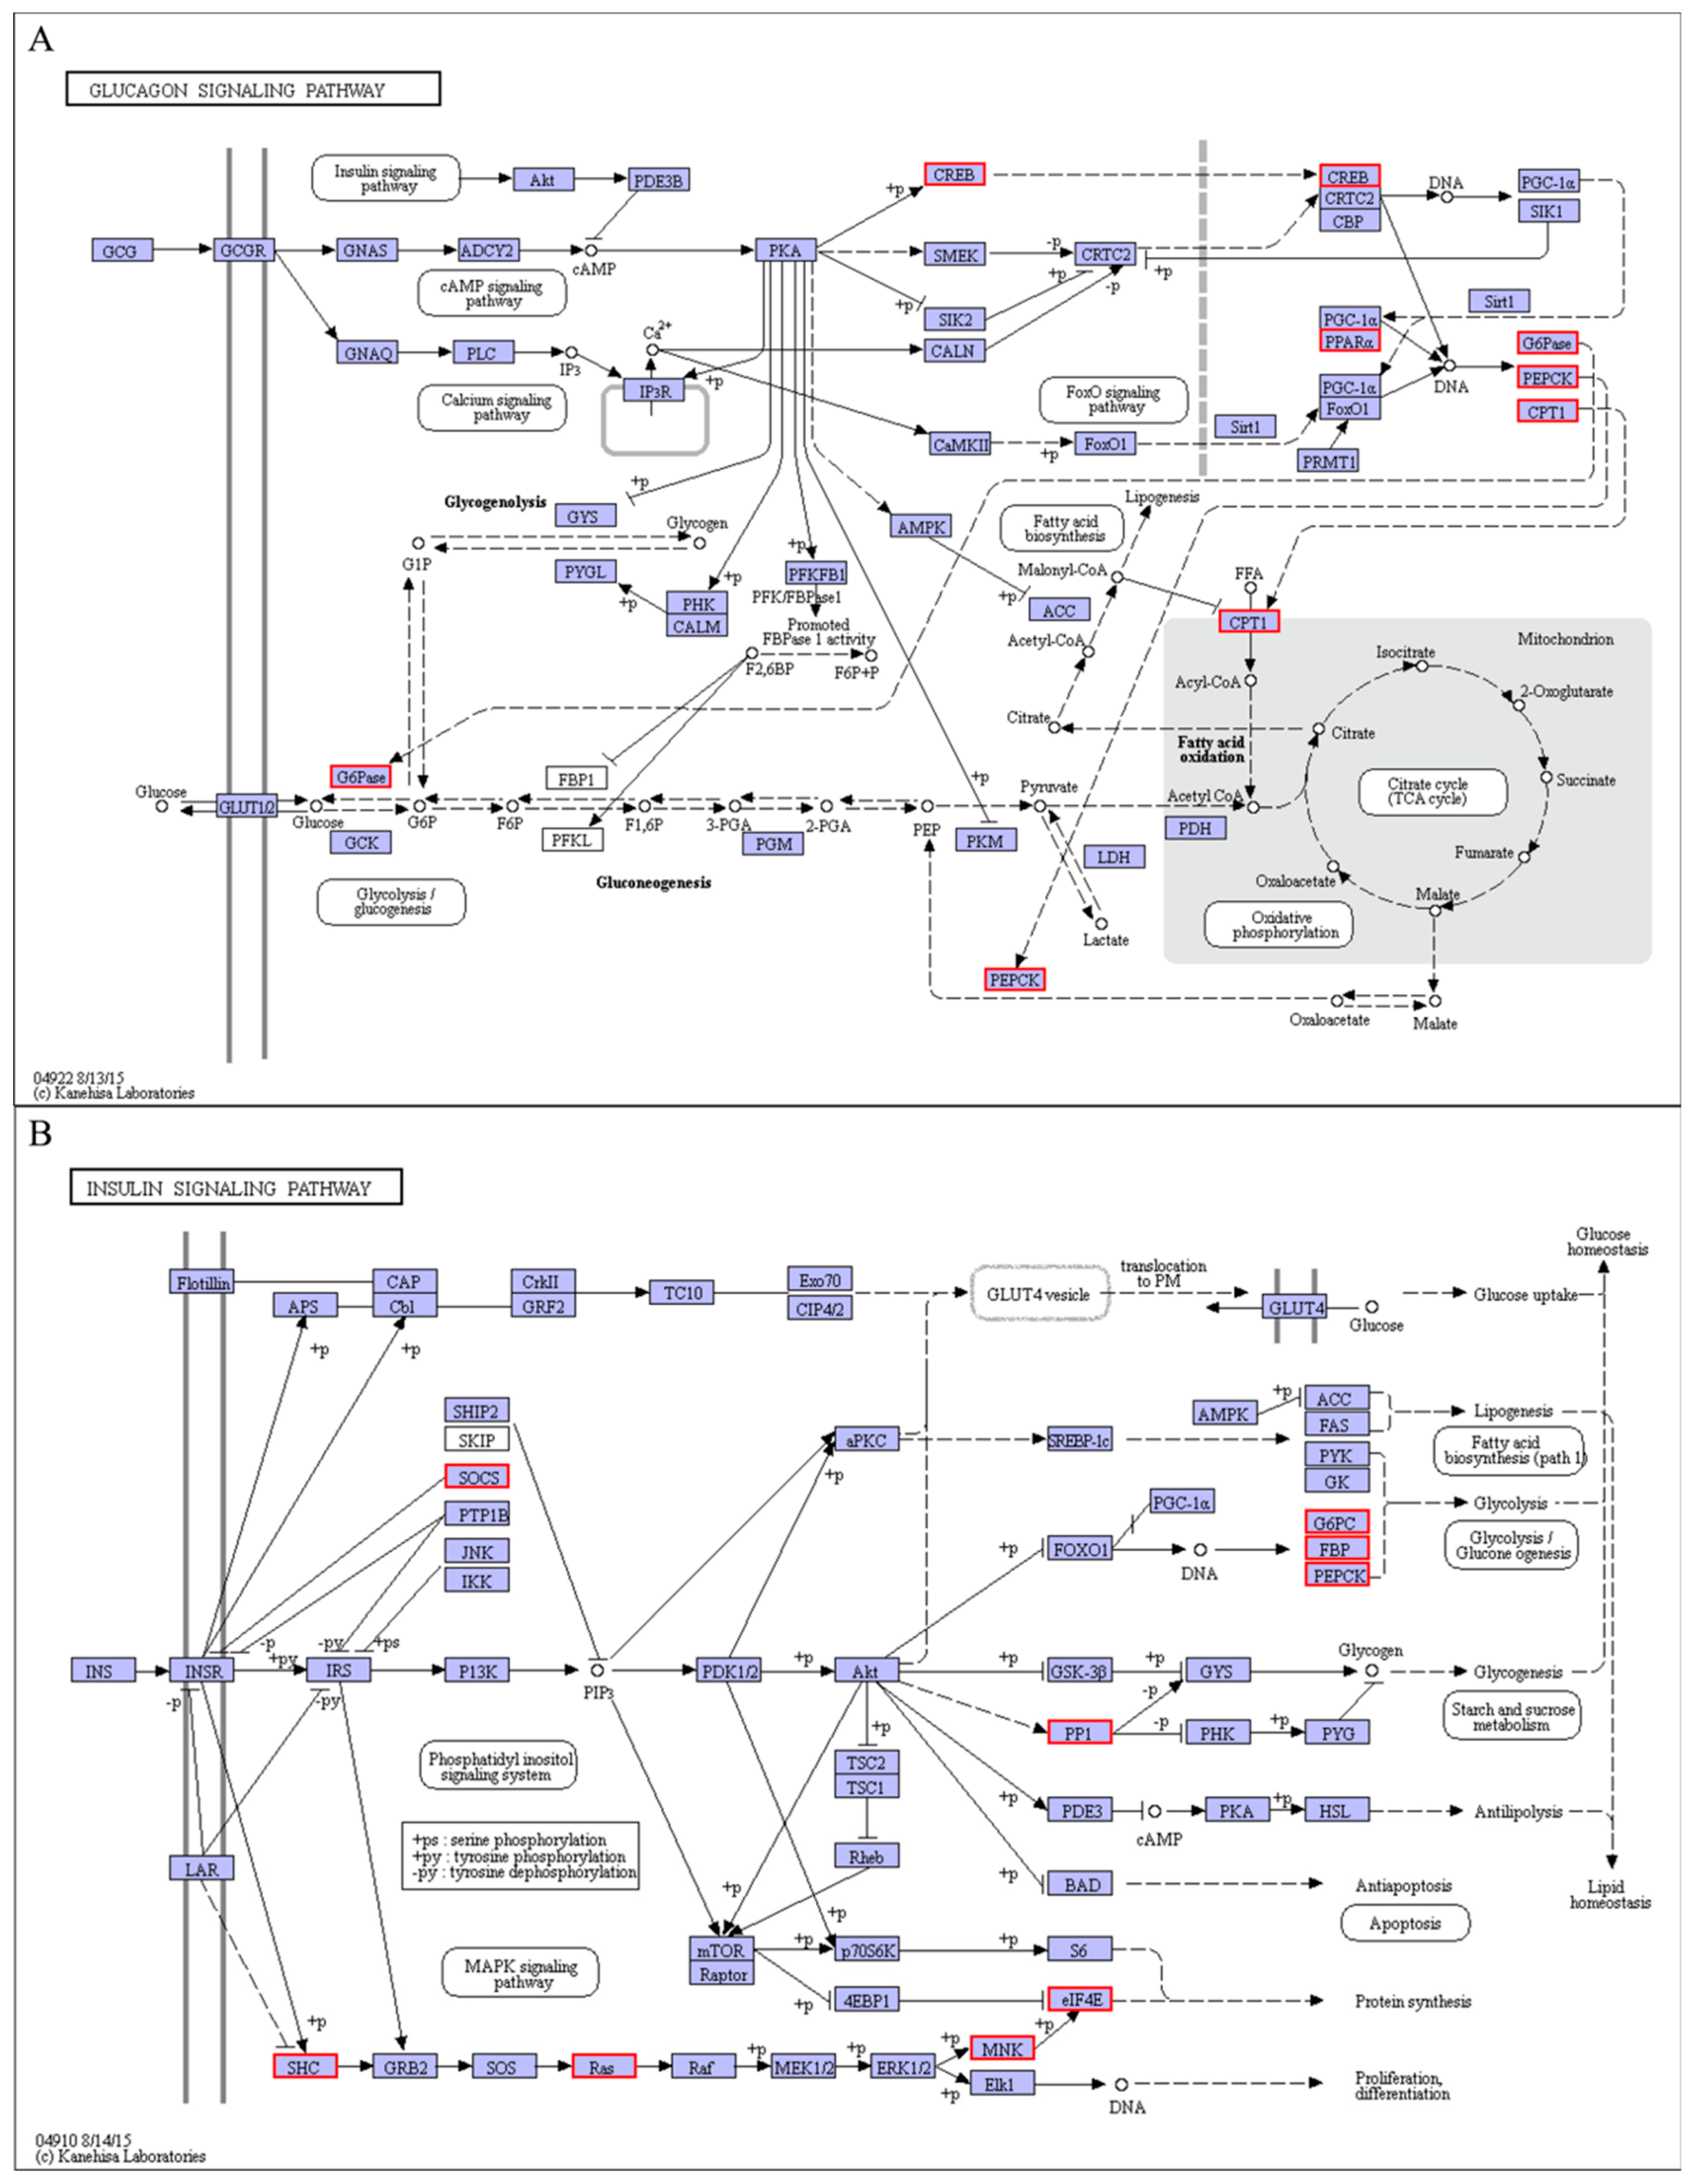
4.2. Response of Signal Transductions to Cold Stress
4.3. Endocrine System and Cold Stress
5. Conclusions
Supplementary Materials
Author Contributions
Funding
Institutional Review Board Statement
Informed Consent Statement
Data Availability Statement
Acknowledgments
Conflicts of Interest
References
- Donaldson, M.R.; Cooke, S.J.; Patterson, D.A.; Macdonald, J.S. Cold shock and fish. J. Fish Biol. 2008, 73, 1491–1530. [Google Scholar] [CrossRef]
- Samaras, A.; Papandroulakis, N.; Costari, M.; Pavlidis, M. Stress and metabolic indicators in a relatively high (European sea bass, Dicentrarchus labrax) and a low (meagre, Argyrosomus regius) cortisol responsive species, in different water temperatures. Aquac. Res. 2016, 47, 3501–3515. [Google Scholar] [CrossRef]
- Long, Y.; Li, L.; Li, Q.; He, X.; Cui, Z. Transcriptomic characterization of temperature stress responses in larval zebrafish. PLoS ONE 2012, 7, e37209. [Google Scholar] [CrossRef] [Green Version]
- Fan, X.; Qin, X.; Zhang, C.; Zhu, Q.; Chen, J.; Chen, P. Metabolic and anti-oxidative stress responses to low temperatures during the waterless preservation of the hybrid grouper (Epinephelus fuscogutatus ♀ × Epinephelus lanceolatus ♂). Aquaculture 2019, 508, 10–18. [Google Scholar] [CrossRef]
- Lu, D.L.; Ma, Q.; Sun, S.X.; Zhang, H.; Chen, L.Q.; Zhang, M.L.; Du, Z.Y. Reduced oxidative stress increases acute cold stress tolerance in zebrafish. Comp. Biochem. Physiol. Part A Mol. Integr. Physiol. 2019, 235, 166–173. [Google Scholar] [CrossRef]
- Wang, Q.; Tan, X.; Jiao, S.; You, F.; Zhang, P.J. Analyzing cold tolerance mechanism in transgenic zebrafish (Danio rerio). PLoS ONE 2014, 9, e102492. [Google Scholar] [CrossRef] [Green Version]
- Wentworth, S.A.; Thede, K.; Aravindabose, V.; Monroe, I.; Thompson, A.W.; Molyneaux, N.; Owen, C.L.; Burns, J.R.; Vicente, A.G.; Garvin, J.L.; et al. Transcriptomic analysis of changes in gene expression of immune proteins of gill tissue in response to low environmental temperature in fathead minnows (Pimephales promelas). Comp. Biochem. Physiol. Part D Genom. Proteom. 2018, 25, 109–117. [Google Scholar] [CrossRef]
- Nitzan, T.; Kokou, F.; Doron-Faigenboim, A.; Slosman, T.; Biran, J.; Mizrahi, I.; Zak, T.; Benet, A.; Cnaani, A. Transcriptome analysis reveals common and differential response to low temperature exposure between tolerant and sensitive blue tilapia (Oreochromis aureus). Front. Genet. 2019, 10. [Google Scholar] [CrossRef]
- Chu, T.; Liu, F.; Qin, G.; Zhan, W.; Wang, M.; Lou, B. Transcriptome analysis of the Larimichthys polyactis under heat and cold stress. Cryobiology 2020, 96, 175–183. [Google Scholar] [CrossRef]
- Wen, X.; Hu, Y.; Zhang, X.; Wei, X.; Wang, T.; Yin, S. Integrated application of multi-omics provides insights into cold stress responses in pufferfish Takifugu fasciatus. BMC Genom. 2019, 20, 1–15. [Google Scholar] [CrossRef] [Green Version]
- Mininni, A.N.; Milan, M.; Ferraresso, S.; Petochi, T.; Di Marco, P.; Marino, G.; Livi, S.; Romualdi, C.; Bargelloni, L.; Patarnello, T. Liver transcriptome analysis in gilthead sea bream upon exposure to low temperature. BMC Genom. 2014, 15, 1–12. [Google Scholar] [CrossRef] [Green Version]
- Lin, J.; Shi, X.; Fang, S.; Zhang, Y.; You, C.; Ma, H.; Lin, F. Comparative transcriptome analysis combining SMRT and NGS sequencing provides novel insights into sex differentiation and development in mud crab (Scylla paramamosain). Aquaculture 2019, 513, 734447. [Google Scholar] [CrossRef]
- Huang, B.; Rong, H.; Ye, Y.; Ni, Z.; Xu, M.; Zhang, W.; Xu, L. Transcriptomic analysis of flower color variation in the ornamental crabapple (Malus spp.) half-sib family through Illumina and PacBio Sequel sequencing. Plant Physiol. Biochem. 2020, 149, 27–35. [Google Scholar] [CrossRef]
- Sharon, D.; Tilgner, H.; Grubert, F.; Snyder, M. A single-molecule long-read survey of the human transcriptome. Nat. Biotechnol. 2013, 31, 1009–1014. [Google Scholar] [CrossRef]
- Li, Y.; Fang, C.; Fu, Y.; Hu, A.; Li, C.; Zou, C.; Li, X.; Zhao, S.; Zhang, C. A survey of transcriptome complexity in Sus scrofa using single-molecule long-read sequencing. DNA Res. 2018, 25, 421–437. [Google Scholar] [CrossRef]
- Zhang, Z.; Yang, Z.; Ding, N.; Xiong, W.; Zheng, G.; Lin, Q.; Zhang, G. Effects of temperature on the survival, feeding, and growth of pearl gentian grouper (female Epinephelus fuscoguttatus × male Epinephelus lanceolatus). Fish. Sci. 2018, 84, 399–404. [Google Scholar] [CrossRef]
- Fan, B.; Liu, X.C.; Meng, Z.N.; Tan, B.H.; Wang, L.; Zhang, H.F.; Zhang, Y.; Wang, Y.X.; Lin, H.R. Cryopreservation of giant grouper Epinephelus lanceolatus (Bloch, 1790) sperm. J. Appl. Ichthyol. 2014, 30, 334–339. [Google Scholar] [CrossRef]
- Zhou, Y.; Han, Y.L.; Luo, J.; Wang, X.; Chen, G.H. MSAP analysis of DNA methylation of Epinephelus malabaricus, Epinephelus malabaricus and their hybrid offspring. Nat. Sci. J. Hainan Univ. 2017. [Google Scholar] [CrossRef]
- Shapawi, R.; Ebi, I.; Yong, A.S.K.; Ng, W.K. Optimizing the growth performance of brown-marbled grouper, Epinephelus fuscoguttatus (Forskal), by varying the proportion of dietary protein and lipid levels. Anim. Feed Sci. Technol. 2014, 191, 98–105. [Google Scholar] [CrossRef]
- Liang, H.F.; Huang, D.K.; Wu, Y.H.; Wang, C.Q.; Zhong, W.J. Effects of temperature and salinity on survival and food intake of grouper hybrid (Epinephelus lanceolatus ♂ × E. fuscoguttatus ♀). J. Guangdong Ocean Univ. 2013, 33, 22–26. [Google Scholar]
- Zhou, T.; Gui, L.; Liu, M.; Li, W.; Hu, P.; Duarte, D.F.C.; Niu, H.; Chen, L. Transcriptomic responses to low temperature stress in the Nile tilapia, Oreochromis niloticus. Fish Shellfish Immunol. 2019, 84, 1145–1156. [Google Scholar] [CrossRef]
- Jiang, S.; Wu, X.; Li, W.; Wu, M.; Luo, Y.; Lu, S.; Lin, H. Effects of dietary protein and lipid levels on growth, feed utilization, body and plasma biochemical compositions of hybrid grouper (Epinephelus lanceolatus ♂ × Epinephelus fuscoguttatus ♀) juveniles. Aquaculture 2015, 446, 148–155. [Google Scholar] [CrossRef]
- Xu, D.; You, Q.; Chi, C.; Luo, S.; Song, H.; Lou, B.; Takeuchi, Y. Transcriptional response to low temperature in the yellow drum (Nibea albiflora) and identification of genes related to cold stress. Comp. Biochem. Physiol. Part D Genom. Proteom. 2018, 28, 80–89. [Google Scholar] [CrossRef]
- Song, S.G.; Chi, S.Y.; Tan, B.P.; Liang, G.L.; Lu, B.Q.; Dong, X.H.; Yang, Q.H.; Liu, H.Y.; Zhang, S. Effects of fishmeal replacement by Tenebrio molitor meal on growth performance, antioxidant enzyme activities and disease resistance of the juvenile pearl gentian grouper (Epinephelus lanceolatus ♂ × Epinephelus fuscoguttatus ♀). Aquac. Res. 2018, 49, 2210–2217. [Google Scholar] [CrossRef]
- Deng, Y.; Zhang, Y.; Chen, H.; Xu, L.; Wang, Q.; Feng, J. Gut–liver immune response and gut microbiota profiling reveal the pathogenic mechanisms of vibrio harveyi in pearl gentian grouper (Epinephelus lanceolatus ♂ × E. fuscoguttatus ♀). Front. Immunol. 2020, 11, 1–13. [Google Scholar] [CrossRef] [PubMed]
- Xing, J.; Zhang, Z.; Sheng, X.; Tang, X.; Chi, H.; Zhan, W. Identification and characterization of a new strain of nervous necrosis virus isolated from pearl gentian grouper (Epinephelus lanceolatus × Epinephelus fuscoguttatus) in China. Aquaculture 2020, 529, 735663. [Google Scholar] [CrossRef]
- Zhu, K.; Zhang, D.; Wei, J.; Huang, G.; Guo, Y.; Jiang, S. The complete mitochondrial genome of the hybrid grouper Epinephelus fuscoguttatus (♀)×Epinephelus lanceolatus (♂). Mitochondrial DNA Part A DNA Mapp. Seq. Anal. 2016, 27, 1968–1969. [Google Scholar]
- Gordon, S.P.; Tseng, E.; Salamov, A.; Zhang, J.; Meng, X.; Zhao, Z.; Kang, D.; Underwood, J.; Grigoriev, I.V.; Figueroa, M.; et al. Widespread polycistronic transcripts in fungi revealed by single-molecule mRNA sequencing. PLoS ONE 2015, 10, e0132628. [Google Scholar] [CrossRef] [Green Version]
- Salmela, L.; Rivals, E. LoRDEC: Accurate and efficient long read error correction. Bioinformatics 2014, 30, 3506–3514. [Google Scholar] [CrossRef]
- Li, W.; Godzik, A. Cd-hit: A fast program for clustering and comparing large sets of protein or nucleotide sequences. Bioinformatics 2006, 22, 1658–1659. [Google Scholar] [CrossRef] [Green Version]
- Buchfink, B.; Xie, C.; Huson, D.H. Fast and sensitive protein alignment using DIAMOND. Nat. Methods 2014, 12, 59–60. [Google Scholar] [CrossRef]
- Langmead, B.; Salzberg, S.L. Fast gapped-read alignment with Bowtie 2. Nat. Methods 2012, 9, 357–360. [Google Scholar] [CrossRef] [PubMed] [Green Version]
- Li, B.; Dewey, C.N. RSEM: Accurate transcript quantification from RNA-Seq data with or without a reference genome. BMC Bioinform. 2011, 12, 323. [Google Scholar] [CrossRef] [Green Version]
- Love, M.I.; Huber, W.; Anders, S. Moderated estimation of fold change and dispersion for RNA-seq data with DESeq2. Genome Biol. 2014, 1–21. [Google Scholar] [CrossRef] [Green Version]
- Shinkawa, T.; Taoka, M.; Yamauchi, Y.; Ichimura, T.; Kaji, H.; Takahashi, N.; Isobe, T. STEM: A software tool for large-scale proteomic data analyses. J. Proteome Res. 2005, 4, 1826–1831. [Google Scholar] [CrossRef]
- Wang, R.; Du, X.; Zhi, Y. Screening of critical genes involved in metastasis and prognosis of high-grade serous ovarian cancer by gene expression profile data. J. Comput. Biol. 2019, 27, 1–11. [Google Scholar] [CrossRef]
- Yu, L.; Wei, M.; Li, F. Longitudinal analysis of gene expression changes during cervical carcinogenesis reveals potential therapeutic targets. Evol. Bioinform. 2020, 16, 1–10. [Google Scholar] [CrossRef]
- Langfelder, P.; Horvath, S. WGCNA: An R package for weighted correlation network analysis. BMC Bioinform. 2008, 9. [Google Scholar] [CrossRef] [Green Version]
- Fu, M.C.; Li, H.; Chen, Y.Z.; Liu, Z.J.; Liu, R.Z.; Wang, L.G. Identification of co-expressed modules of cotton genes responding to Verticillium dahliae infection by WGCNA. Acta Agron. Sin. 2020, 46, 668–679. [Google Scholar] [CrossRef]
- Shannon, P.; Markiel, A.; Ozier, O.; Baliga, N.S.; Wang, J.T.; Ramage, D.; Amin, N.; Schwikowski, B.; Ideker, T. Cytoscape: A Software environment for integrated models of biomolecular interaction networks. Genome Res. 2003, 2498–2504. [Google Scholar] [CrossRef]
- Livak, K.J.; Schmittgen, T.D. Analysis of Relative Gene Expression Data Using Real-Time Quantitative PCR and the 2−ΔΔCT Method. Methods 2001, 25, 402–408. [Google Scholar] [CrossRef]
- Qian, B.; Xue, L. Liver transcriptome sequencing and de novo annotation of the large yellow croaker (Larimichthy crocea) under heat and cold stress. Mar. Genom. 2016, 25, 95–102. [Google Scholar] [CrossRef]
- Zhou, P.; Li, Q.; Liu, G.; Xu, N.; Yang, Y.; Zeng, W.; Chen, A.; Wang, S. Integrated analysis of transcriptomic and metabolomic data reveals critical metabolic pathways involved in polyphenol biosynthesis in Nicotiana tabacum under chilling stress. Funct. Plant Biol. 2019, 46, 30–43. [Google Scholar] [CrossRef] [PubMed]
- Wang, J.Y. Biochemistry, 3rd ed.; Higher Education Press: Beijing, China, 2002; pp. 63–195. [Google Scholar]
- Latorre-Muro, P.; Baeza, J.; Armstrong, E.A.; Hurtado-Guerrero, R.; Corzana, F.; Wu, L.E.; Sinclair, D.A.; López-Buesa, P.; Carrodeguas, J.A.; Denu, J.M. Dynamic acetylation of phosphoenolpyruvate carboxykinase toggles enzyme activity between gluconeogenic and anaplerotic reactions. Mol. Cell 2018, 71, 718–732. [Google Scholar] [CrossRef] [PubMed] [Green Version]
- Lamont, B.J.; Visinoni, S.; Fam, B.C.; Kebede, M.; Weinrich, B.; Papapostolou, S.; Massinet, H.; Proietto, J.; Favaloro, J.; Andrikopoulos, S. Expression of human fructose-1,6-bisphosphatase in the liver of transgenic mice results in increased glycerol gluconeogenesis. Endocrinology 2006, 147, 2764–2772. [Google Scholar] [CrossRef] [PubMed] [Green Version]
- Matern, D.; Seydewitz, H.H.; Bali, D.; Lang, C.; Chen, Y.T. Glycogen storage disease type I: Diagnosis and phenotype/genotype correlation. Eur. J. Pediatr. Suppl. 2002, 161, S10–S19. [Google Scholar] [CrossRef]
- Jobin, M.L.; Bonnafous, P.; Temsamani, H.; Dole, F.; Grélard, A.; Dufourc, E.J.; Alves, I.D. The enhanced membrane interaction and perturbation of a cell penetrating peptide in the presence of anionic lipids: Toward an understanding of its selectivity for cancer cells. Biochim. Biophys. Acta 2013, 1828, 1457–1470. [Google Scholar] [CrossRef]
- Kepinska, M.; Gdula-Argasinska, J.; Dabrowski, Z.; Szarek, M.; Pilch, W.; Kreska-Korus, A.; Szygula, Z. Fatty acids composition in erythrocyte membranes of athletes after one and after a series of whole body cryostimulation sessions. Cryobiology 2017, 74, 121–125. [Google Scholar] [CrossRef]
- Cheng, C.H.; Ye, C.X.; Guo, Z.X.; Wang, A.L. Immune and physiological responses of pufferfish (Takifugu obscurus) under cold stress. Fish Shellfish Immunol. 2017, 64, 137–145. [Google Scholar] [CrossRef]
- Sun, Z.; Tan, X.; Liu, Q.; Ye, H.; Zou, C.; Xu, M.; Zhang, Y.; Ye, C. Physiological, immune responses and liver lipid metabolism of orange-spotted grouper (Epinephelus coioides) under cold stress. Aquaculture 2019, 498, 545–555. [Google Scholar] [CrossRef]
- Zhai, Z.H. Cell Biology, 4th ed.; Higher Education Press: Beijing, China, 2011; pp. 54–84. [Google Scholar]
- Sun, Z.; Tan, X.; Xu, M.; Liu, Q.; Ye, H.; Zou, C.; Ye, C. Liver transcriptome analysis and de novo annotation of the orange-spotted groupers (Epinephelus coioides) under cold stress. Comp. Biochem. Physiol. Part D Genom. Proteom. 2019, 29, 264–273. [Google Scholar] [CrossRef]
- Long, Y.; Song, G.; Yan, J.; He, X.; Li, Q.; Cui, Z. Transcriptomic characterization of cold acclimation in larval zebrafish. BMC Genom. 2013, 14. [Google Scholar] [CrossRef] [Green Version]
- Cantó, C.; Auwerx, J. AMP-activated protein kinase and its downstream transcriptional pathways. Cell. Mol. Life Sci. 2010, 67, 3407–3423. [Google Scholar] [CrossRef] [PubMed] [Green Version]
- Gobin, S.; Thuillier, L.; Jogl, G.; Faye, A.; Tong, L.; Chi, M.; Bonnefont, J.P.; Girard, J.; Prip-Buus, C. Functional and structural basis of carnitine palmitoyltransferase 1A deficiency. J. Biol. Chem. 2003, 278, 50428–50434. [Google Scholar] [CrossRef] [PubMed] [Green Version]
- Cuccioloni, M.; Mozzicafreddo, M.; Spina, M.; Tran, C.N.; Falconi, M.; Eleuteri, A.M.; Angeletti, M. Epigallocatechin-3-gallate potently inhibits the in vitro activity of hydroxy-3-methyl-glutaryl-CoA reductase. J. Lipid Res. 2011, 52, 897–907. [Google Scholar] [CrossRef] [Green Version]
- Farhan, M.; Wang, H.; Gaur, U.; Little, P.J.; Xu, J.; Zheng, W. FOXO signaling pathways as therapeutic targets in cancer. Int. J. Biol. Sci. 2017, 13, 815–827. [Google Scholar] [CrossRef] [PubMed]
- Amato, R.; D’Antona, L.; Porciatti, G.; Agosti, V.; Menniti, M.; Rinaldo, C.; Costa, N.; Bellacchio, E.; Mattarocci, S.; Fuiano, G.; et al. Sgk1 activates MDM2-dependent p53 degradation and affects cell proliferation, survival, and differentiation. J. Mol. Med. 2009, 87, 1221–1239. [Google Scholar] [CrossRef]
- Hahn, W.H.; Suh, J.S.; Cho, S.H.; Cho, B.S.; Kim, S. Do Polymorphisms of signal transducers and activators of transcription 1 and 4 (STAT1 and STAT4) contribute to progression of childhood IgA nephropathy. Cytokine 2010, 50, 69–74. [Google Scholar] [CrossRef] [PubMed]
- Gremer, L.; Merbitz-Zahradnik, T.; Dvorsky, R.; Cirstea, I.C.; Kratz, C.P.; Zenker, M.; Wittinghofer, A.; Ahmadian, M.R. Germline KRAS mutations cause aberrant biochemical and physical properties leading to developmental disorders. Hum. Mutat. 2011, 32, 33–43. [Google Scholar] [CrossRef] [Green Version]
- McGrath, D.A.; Fifield, B.; Marceau, A.H.; Tripathi, S.; Porter, L.A.; Rubin, S.M. Structural basis of divergent cyclin-dependent kinase activation by Spy1/ RINGO proteins. EMBO J. 2017, 36, 2251–2262. [Google Scholar] [CrossRef]
- Takekawa, M.; Saito, H. A family of stress-inducible GADD45-like proteins mediate activation of the stress-responsive MTK1/MEKK4 MAPKKK. Cell 1998, 95, 521–530. [Google Scholar] [CrossRef] [Green Version]
- Hu, P.; Liu, M.; Liu, Y.; Wang, J.; Zhang, D.; Niu, H.; Chen, L. Transcriptome comparison reveals a genetic network regulating the lower temperature limit in fish. Sci. Rep. 2016, 6, 1–12. [Google Scholar] [CrossRef]
- Liebermann, D.A.; Hoffman, B. Gadd45 in the response of hematopoietic cells to genotoxic stress. Blood Cells Mol. Dis. 2007, 39, 329–335. [Google Scholar] [CrossRef] [PubMed] [Green Version]
- Li, C.; Gu, Y.; Tang, S.; Fang, H.; Jiang, G.; Jiang, Z. Effects of acute low temperature stress on the endocrine reactions of the Qinghai toad-headed lizard. Curr. Zool. 2011, 57, 775–780. [Google Scholar] [CrossRef]
- Berglund, E.D.; Kang, L.; Lee-Young, R.S.; Hasenour, C.M.; Lustig, D.G.; Lynes, S.E.; Donahue, E.P.; Swift, L.L.; Charron, M.J.; Wasserman, D.H. Glucagon and lipid interactions in the regulation of hepatic AMPK signaling and expression of PPARα and FGF21 transcripts in vivo. Am. J. Physiol. Endocrinol. Metab. 2010, 299. [Google Scholar] [CrossRef] [PubMed]
- Talbert, M.E.; Langefeld, C.D.; Ziegler, J.; Mychaleckyj, J.C.; Haffner, S.M.; Norris, J.M.; Bowden, D.W. Polymorphisms near SOCS3 are associated with obesity and glucose homeostasis traits in Hispanic Americans from the Insulin Resistance Atherosclerosis Family Study. Hum. Genet. 2009, 125, 153–162. [Google Scholar] [CrossRef] [PubMed] [Green Version]
- Baldi, P.; Valè, G.; Mazzucotelli, E.; Govoni, C.; Faccioli, P.; Stanca, A.M.; Cattivelli, L. The transcripts of several components of the protein synthesis machinery are cold-regulated in a chloroplast-dependent manner in barley and wheat. J. Plant Physiol. 2001, 158, 1541–1546. [Google Scholar] [CrossRef]
- Haque, M.S.; Haque, M.A.; Roy, S.K.; Khan, M.M.H.; Hossain, M.M. Regulatory mechanism on enhancing protein synthesis in skeletal muscles of cold exposed fresh water fish (Channa punctata). J. Saudi Soc. Agric. Sci. 2014, 13, 148–154. [Google Scholar] [CrossRef] [Green Version]


| Primer Name | Forward Primer (5′ to 3′) | Reverse Primer (5′ to 3′) |
|---|---|---|
| 18S rRNA | GACTCTGGCGTGCTAACTA | CAATCTCGTGTGGCTGAAC |
| Cysteine dioxygenase type 1 (CDO1) | CCACGGCAGTAGCATCCA | CCATTCAAACAGCGTCTCCTTC |
| Cytochrome c (CYC) | AGACACCCTGATGATTTACTTGGA | CGTTCGCCCTTCTTCTTGATG |
| 1,25-dihydroxyvitamin D (3) 24-hydroxylase, mitochondrial (CYP24A1) | TACGCAGCCATCACAGAG | AATCTCCTTCAGCAACTTCCT |
| Peroxisomal 2,4-dienoyl-CoA reductase (DECR2) | CTGCTGTGGATGAGACACTGAGAG | GGCGTTGAAGGAAAGTGCTGATG |
| Eukaryotic translation initiation factor 4E (EIF4E) | GCTTTGGCTGCGATTATTGTTT | GGTCATTGTGTCTCTGTTGCTTA |
| Prothrombin (F2) | GCTGCTGTTCTCCTGCTGTT | CGACGGCTCCTGACCAAC |
| NADH-ubiquinone oxidoreductase chain 4 (MT-ND4) | ATAACCCAGCGAGGACCC | GTAATGGTAGGAGGTGGAGTGT |
| X-box-binding protein 1 (XBP1) | GGTGGTGGAGGAGGAGAC | GGAGGAGGTTTCGGAGAAGA |
| Sample | Raw Reads | Raw Bases | Clean Reads | Clean Bases | Error (%) | Q20 (%) | Q30 (%) | GC (%) |
|---|---|---|---|---|---|---|---|---|
| CT-1 | 40,457,922 | 6.07 G | 40,193,928 | 6.03 G | 0.03 | 97.62 | 93.14 | 50.06 |
| CT-2 | 44,821,082 | 6.72 G | 44,525,618 | 6.68 G | 0.03 | 97.54 | 93.01 | 49.11 |
| CT-3 | 44,301,766 | 6.65 G | 43,997,216 | 6.6 G | 0.03 | 97.31 | 92.49 | 49.09 |
| LT20-1 | 40,314,958 | 6.05 G | 40,050,718 | 6.01 G | 0.03 | 97.84 | 93.61 | 49.68 |
| LT20-2 | 44,029,006 | 6.6 G | 43,747,514 | 6.56 G | 0.03 | 97.63 | 93.16 | 49.28 |
| LT20-3 | 40,525,754 | 6.08 G | 40,259,138 | 6.04 G | 0.03 | 97.45 | 92.77 | 49.53 |
| LT15-1 | 43,878,738 | 6.58 G | 43,597,452 | 6.54 G | 0.03 | 97.59 | 93.07 | 49.53 |
| LT15-2 | 43,106,336 | 6.47 G | 42,820,278 | 6.42 G | 0.03 | 97.46 | 92.81 | 49.45 |
| LT15-3 | 58,979,158 | 8.85 G | 58,580,046 | 8.79 G | 0.03 | 97.46 | 92.82 | 49.44 |
| LT12-1 | 51,108,766 | 7.67 G | 50,768,078 | 7.62 G | 0.03 | 97.52 | 92.95 | 49.29 |
| LT12-2 | 56,321,806 | 8.45 G | 55,947,676 | 8.39 G | 0.03 | 97.55 | 93.03 | 49.32 |
| LT12-3 | 49,213,672 | 7.38 G | 48,877,820 | 7.33 G | 0.03 | 97.42 | 92.73 | 49.12 |
| LT12-6-1 | 41,337,836 | 6.2 G | 41,069,634 | 6.16 G | 0.03 | 97.56 | 93.03 | 49.16 |
| LT12-6-2 | 50,932,700 | 7.64 G | 50,598,692 | 7.59 G | 0.03 | 97.53 | 92.95 | 49.27 |
| LT12-6-3 | 48,065,372 | 7.21 G | 47,731,214 | 7.16 G | 0.03 | 97.4 | 92.74 | 49.21 |
| Module Colors | Genes | Module Colors | Genes | Module Colors | Genes |
| turquoise | 3412 | pink | 204 | lightcyan | 86 |
| blue | 1343 | magenta | 198 | grey60 | 77 |
| grey | 747 | purple | 175 | lightgreen | 73 |
| brown | 382 | greenyellow | 165 | lightyellow | 70 |
| yellow | 375 | tan | 133 | royalblue | 64 |
| green | 332 | cyan | 104 | darkred | 57 |
| red | 324 | salmon | 104 | darkgreen | 55 |
| black | 244 | midnightblue | 102 |
| Transcripts | Genes | LogFC | KEGG Pathways |
|---|---|---|---|
| shibanyu_transcript_846 | PCK1 (Phosphoenolpyruvate carboxykinase, cytosolic) | 12.37 | Glycolysis/Gluconeogenesis, AMPK signaling pathway, FoxO signaling pathway, Insulin signaling pathway, Glucagon signaling pathway |
| shibanyu_transcript_6873 | ALDOB (Fructose-bisphosphate aldolase B) | −14.17 | Glycolysis/Gluconeogenesis |
| shibanyu_transcript_9393 | FBP1 (Fructose-1,6-bisphosphatase 1) | 2.01 | Glycolysis/Gluconeogenesis, AMPK signaling pathway, Insulin signaling pathway |
| shibanyu_transcript_9234 | FBP2 (Fructose-1,6-bisphosphatase isozyme 2) | 2.68 | Glycolysis/Gluconeogenesis AMPK signaling pathway, Insulin signaling pathway |
| shibanyu_transcript_599 | G6PC (Glucose-6-phosphatase) | 1.02 | Glycolysis/Gluconeogenesis, AMPK signaling pathway, FoxO signaling pathway, Insulin signaling pathway, Glucagon signaling pathway |
| shibanyu_transcript_1763 | CYP2J1 (Cytochrome P450 2J1) | −1.13 | Linoleic acid metabolism |
| shibanyu_transcript_511 | CYP2J2 (Cytochrome P450 2J2) | −1.69 | Linoleic acid metabolism |
| shibanyu_transcript_1230 | CYP2J6 (Cytochrome P450 2J6) | −1.55 | Linoleic acid metabolism |
| shibanyu_transcript_7206 | CPT1A (Carnitine O-palmitoyltransferase 1, liver isoform) | 4.73 | AMPK signaling pathway, Glucagon signaling pathway |
| shibanyu_transcript_168 | PCK2 (Phosphoenolpyruvate carboxykinase [GTP], mitochondrial) | 1.39 | AMPK signaling pathway, FoxO signaling pathway, Insulin signaling pathway, Glucagon signaling pathway |
| shibanyu_transcript_1860 | HMGCR (3-hydroxy-3-methylglutaryl-coenzyme A reductase) | 3.19 | AMPK signaling pathway |
| shibanyu_transcript_6395 | DHCR7 (7-dehydrocholesterol reductase) | 1.41 | Steroid biosynthesis |
| shibanyu_transcript_4825 | CYP24A1 (1,25-dihydroxyvitamin D(3) 24-hydroxylase, mitochondrial) | 7.53 | Steroid biosynthesis |
| shibanyu_transcript_371 | SOAT1 (Sterol O-acyltransferase 1) | 2.42 | Steroid biosynthesis |
| shibanyu_transcript_1553 | DHCR24 (Delta(24)-sterol reductase) | 1.63 | Steroid biosynthesis |
| shibanyu_transcript_4386 | SGK1 (Serine/threonine-protein kinase Sgk1) | 2.95 | FoxO signaling pathway |
| shibanyu_transcript_397 | STAT1 (Signal transducer and activator of transcription 1-alpha/beta) | 1.50 | FoxO signaling pathway |
| shibanyu_transcript_4950 | CDKN1B (Cyclin-dependent kinase inhibitor 1B) | 2.53 | FoxO signaling pathway |
| shibanyu_transcript_5980 | GADD45B (Growth arrest and DNA damage-inducible protein GADD45 beta) | 3.23 | FoxO signaling pathway |
| shibanyu_transcript_639 | PPARα (Peroxisome proliferator-activated receptor alpha) | 3.62 | Glucagon signaling pathway |
| shibanyu_transcript_1906 | SOCS3 (Suppressor of cytokine signaling 3) | 3.16 | Insulin signaling pathway |
| shibanyu_transcript_2800 | PPP1CC-a (Serine/threonine-protein phosphatase PP1-gamma catalytic subunit A) | 4.01 | Insulin signaling pathway |
| shibanyu_transcript_229 | SHC1 (SHC-transforming protein 1) | 1.04 | Insulin signaling pathway |
| shibanyu_transcript_8219 | KRAS (GTPase KRas) | 1.45 | Insulin signaling pathway, FoxO signaling pathway |
| shibanyu_transcript_37 | MKNK2 (MAP kinase-interacting serine/threonine-protein kinase 2) | 2.55 | Insulin signaling pathway |
| shibanyu_transcript_3250 | EIF4E (Eukaryotic translation initiation factor 4E) | 4.14 | Insulin signaling pathway |
| shibanyu_transcript_4069 | EEF2 (Elongation factor 2) | 13.22 | AMPK signaling pathway |
Publisher’s Note: MDPI stays neutral with regard to jurisdictional claims in published maps and institutional affiliations. |
© 2021 by the authors. Licensee MDPI, Basel, Switzerland. This article is an open access article distributed under the terms and conditions of the Creative Commons Attribution (CC BY) license (https://creativecommons.org/licenses/by/4.0/).
Share and Cite
Miao, B.-B.; Niu, S.-F.; Wu, R.-X.; Liang, Z.-B.; Tang, B.-G.; Zhai, Y.; Xu, X.-Q. Gene Expression Profile and Co-Expression Network of Pearl Gentian Grouper under Cold Stress by Integrating Illumina and PacBio Sequences. Animals 2021, 11, 1745. https://doi.org/10.3390/ani11061745
Miao B-B, Niu S-F, Wu R-X, Liang Z-B, Tang B-G, Zhai Y, Xu X-Q. Gene Expression Profile and Co-Expression Network of Pearl Gentian Grouper under Cold Stress by Integrating Illumina and PacBio Sequences. Animals. 2021; 11(6):1745. https://doi.org/10.3390/ani11061745
Chicago/Turabian StyleMiao, Ben-Ben, Su-Fang Niu, Ren-Xie Wu, Zhen-Bang Liang, Bao-Gui Tang, Yun Zhai, and Xue-Qi Xu. 2021. "Gene Expression Profile and Co-Expression Network of Pearl Gentian Grouper under Cold Stress by Integrating Illumina and PacBio Sequences" Animals 11, no. 6: 1745. https://doi.org/10.3390/ani11061745