Article

Potential Distribution of Amphibians with Different Habitat Characteristics in Response to Climate Change in South Korea

1
EcoBank Team, National Institute of Ecology, Seocheon-gun, Chungnam 33657, Korea
2
Institute of Ecological Phytochemistry, Hankyong National University, Anseong-si 17579, Korea
3
Environmental Impact Assessment Team, National Institute of Ecology, Seocheon-gun, Chungnam 33657, Korea
4
Division of Ecological Assessment, National Institute of Ecology, Seocheon-gun, Chungnam 33657, Korea
*
Author to whom correspondence should be addressed.
Animals 2021, 11(8), 2185; https://doi.org/10.3390/ani11082185
Submission received: 7 July 2021 / Revised: 15 July 2021 / Accepted: 16 July 2021 / Published: 23 July 2021
(This article belongs to the Section Ecology and Conservation)

Abstract

:

Simple Summary

Amphibian species are one of one of the groups most vulnerable to climate change according to the International Union for Conservation of Nature (IUCN). Limited research has been conducted investigating the effects of climate change on amphibian species in South Korea. In our study, we aimed to predict the impacts of climate change on the distribution of 16 of the 18 species of amphibians currently reported in South Korea. Altogether, 30,281 occurrence points, six bioclimatic variables, and one environmental variable (altitude) were used in modeling. Moreover, we classified 16 Korean amphibians into three groups based on their habitat characteristics: wetland amphibians (Group 1), migrating amphibians (Group 2), and forest-dwelling amphibians (Group 3). Altitude has been predicted to be a major factor in present amphibian distributions in South Korea. In general, our results show that the seven species in Group 1 should be the most resistant to climate change. The five migrating amphibians (Group 2) should decline with preferred habitat reductions. The forest-dwelling amphibian species (Group 3) are the most vulnerable to climate change and their protection requires the immediate implementation of conservation strategies. We will continue to refine our model as it evolves into a useful tool for our endeavor to preserve South Korea’s amphibians as climate change progresses.

Abstract

Amphibian species are highly vulnerable to climate change with significant species decline and extinction predicted worldwide. However, there are very limited studies on amphibians in South Korea. Here, we assessed the potential impacts of climate change on different habitat groups (wetland amphibians, Group 1; migrating amphibians, Group 2; and forest-dwelling amphibians, Group 3) under future climate change and land cover change in South Korea using a maximum entropy modelling approach. Our study revealed that all amphibians would suffer substantial loss of suitable habitats in the future, except Lithobates catesbeianus, Kaloula borealis, and Karsenia koreana. Similarly, species richness for Groups 2 and 3 will decline by 2030, 2050, and 2080. Currently, amphibian species are widely distributed across the country; however, in future, suitable habitats for amphibians would be concentrated along the Baekdudaegan Mountain Range and the southeastern region. Among the three groups, Group 3 amphibians are predicted to be the most vulnerable to climate change; therefore, immediate conservation action is needed to protect them. We expect this study could provide crucial baseline information required for the government to design climate change mitigation strategies for indigenous amphibians.

1. Introduction

Global climate was fairly stable before the 20th century, with organisms being well adapted to the typical climate variability. However, organisms have struggled to adapt to rapid climate changes in the late 20th century [1]. These ongoing changes are predicted to negatively impact global species richness and distribution as many organisms change their physiology, phenology, and adaptive capacity [2,3].
Amphibians are excellent indicators of environmental change due to their particular characteristics [4]. Their unshelled eggs, highly permeable skin, and unique biphasic life-cycles make them highly sensitive to changes in thermal and hydric environments [5,6]. Amphibians also require appropriate levels of humidity, temperature, and light, as well as habitats for retreat [7]. Moreover, amphibians play an important role in various food webs as significant predators and food sources of a diverse array of animals [8]. Thus, a decline in amphibian populations negatively impacts ecosystem structure.
Amphibians are one of the most threatened animal groups on Earth [5,9,10]. More than 50% of the 8000 known amphibian species are threatened with extinction [6,11]. The causes for the global decline in their numbers are numerous and complex. These include excessive exploitation of food resources, wildlife trade, habitat destruction and fragmentation caused by land-use change, introduction of alien species such as fish and crayfish, and excessive use of pesticides [11,12,13,14,15].
Climate change is another important factor influencing amphibian decline [6,16]. Climate change severely impacts amphibian populations due to interactions with chytridiomycosis, a fungal disease that is fatal to them [9]; an increase in ultraviolet-B irradiation due to anthropogenic ozone depletion; and the spread of invasive species [11,17]. Therefore, quantifying climate change-driven shifts in species distribution and abundance is necessary for the implementation of effective conservation policies.
Many researchers in South Korea have studied the distribution of amphibian species. Do et al. [18] studied the distribution of eight endangered amphibian and reptile species; identifying altitude as the bioclimatic variable which had the strongest effect on their distributions. Jeong et al. [19] analyzed the microhabitat characteristics of amphibian species living in riparian areas using a habitat suitability model. Jung et al. [20] reported the factors that contributed significantly to the distribution of Karsenia koreana. Borzée et al. [21] modeled the current and future predicted distributions of K. koreana using a maximum entropy-based (MaxEnt) habitat suitability model which considered four representative concentration pathways (RCPs). However, most of the previous studies have focused on a single species or a limited geographical area. Furthermore, their analyses did not investigate amphibians with similar habitat characteristics.
In this study, we investigated the potential effects of climate change on amphibian species with similar habitat characteristics in South Korea. We used a MaxEnt Model to estimate the suitable habitats for each amphibian species under two climate change scenarios using representative concentration pathways (RCP) 4.5 and 8.5 for the years 2030, 2050, and 2080. We assumed that the species had no dispersal limits, allowing their future distribution to occupy the entire area predicted by the model.

2. Materials and Methods

2.1. Site Description

The simulation study encompassed the 17 provinces in South Korea, including seven mega-cities and a self-governing city, Sejong (Figure 1). South Korea has a total area of 100,411 km2 (Ministry of Land Infrastructure and Transport, 2018). It is largely mountainous, and forests cover over 65% of the land area. The biodiversity of the Korean Peninsula cannot be adequately discussed without mentioning the Baekdudagan Mountain Range [22]. The Baekdudagan Mountain Range is the “backbone” of the Korean Peninsula, stretching from Mt. Jiri in South Korea to Mt. Baekdu in North Korea (Figure 2). It is a well-known biodiversity hotspot across South and North Korea and is relatively untouched by human beings. It harbors approximately one-third of the total flora of the Korean Peninsula, and also diverse fauna including 26% of total bird species, 29% of all mammal species, approximately 30% of the freshwater fish species, and 60% of the amphibian and reptile species in South Korea [22,23]. The country has a temperate climate with four distinct seasons. Moreover, South Korea’s climate is spatially divided into warm temperate (the southern coast and islands), temperate (the central and northern regions), and cold temperate (the high mountains).
The northern region is relatively cold and continental while the southern region is warm and wet. The mean annual precipitation is 1237.4 mm, of which 2/3 falls during the summer season from June to August. The precipitation during the remaining nine months is relatively low. The average annual temperature is 13.2 °C. In the last 30 years, temperature and precipitation have risen by 1.4 °C and 124 mm, respectively, relative to the early 20th century [24].

2.2. Species Occurrence Data

According to the Korean Society of Herpetologists, there are 20 amphibian species in South Korea (http://www.krsh.co.kr/html/sub0201.html, accessed on 20 July 2021), and three more Hynobius species were reported very recently [25]. Among those 23 amphibians, we obtained occurrence data from the 3rd Natural Ecosystem Survey (Figure 3) [26], and a total of 18 amphibian species were identified [27]. These datasets are available in EcoBank, the first ecological database platform in Korea [28] (Appendix A). However, Hynobius yangi and Dryophytes suweonensis had less than 10 occurrence points and were therefore excluded from our analysis to obtain accurate model predictions of other species’ distributions. As such, a total of 16 amphibian species and 30,281 species occurrence points (Table 1, Figure 3) were analyzed in this study, and random points were determined from the raster map of South Korea using Arc GIS 10.5.1 (ESRI, Redlands, CA, USA).

2.3. Environmental Variables

We investigated 19 bioclimatic variables (Table 2) that influence the distribution of amphibian species. Monthly minimum temperature, maximum temperature, and precipitation data from the Korea Meteorological Administration (KMA) were used to estimate the current and future climate of South Korea. We used Pearson’s correlation between pairs of predictors to select the dominant bioclimatic variables and eliminate any weaker predictors [29,30]. A total of six bioclimate variables including annual mean temperature (Bio1), mean diurnal temperature range (Bio2), isothermality (Bio3), annual precipitation (Bio12), precipitation of the wettest month (Bio13), and precipitation of the driest month (Bio14) were selected for the MaxEnt modeling, similar to the methods of Adhikari et al. [30] and Jeon et al. [31]. Altitude was also weakly correlated with the six bioclimatic variables and was used in the models as an environmental variable. We used the HadGEM3-RA global circulation model via the R Dismo package to simulate future climate change according to the RCP 4.5 and RCP 8.5 scenarios [32,33]. We estimated the current climate conditions by averaging the climatic data from 1950 to 2000 (www.worldclim.org, accessed on 20 July 2021). The 2030 climate conditions were estimated as the average from 2026–2035; the 2050 climate conditions were averaged from 2046–2055; and the 2080 climate conditions were averaged from 2076–2085, similar to the methods of Adhikari et al. [29,30]. The model spatial resolution was 0.01° and approximately 1 km2 for all climate and altitude data.

2.4. Habitat Characteristics Related to Breeding Behavior

The amphibian species in South Korea are relatively distinct in their habitat characteristics, and we classified them into three groups (Table 3), as detailed by Kim and Song [28] and Lee and Park [34]. The first group (Group 1) were characterized as amphibians that live in low altitude wetlands. These wetland habitats include rice fields [35], riparian zones, and vegetative filter strips alongside streams and lakes [36]. These habitat types mainly occur at lower altitudes, although several wetlands in South Korea also occur at high altitudes [37]. Seven species, including Dryophytes japonicus, Kaloula borealis, Glandirana rugosa, Lithobates catesbeianus, Pelophylax chosenicus, Pelophylax nigromaculatus, and Rana coreana, were grouped into Group 1. The species in Group 2 are migrating amphibians, including Bombina orientalis, Bufo gargarizans, Hynobius leechii, Hynobius quelpaertensis, and Rana uenoi [38]. They live in terrestrial regions away from waterbodies but migrate to wetlands during breeding periods [38,39,40]. Group 3 consisted of four species, including Bufo stejnegeri, Karsenia koreana, Onychodactylus koreanus, and Rana huanrenensis. These species are forest-dwelling amphibians, commonly found in humid regions under rocks on the moist hills of montane woodlands [21,41,42].

2.5. Model Development, Evaluation, and Validation

We used the MaxEnt machine learning tool in R (version 1.3.3. https://cran.r-project.org/web/packages/maxent, accessed on 20 July 2021) to predict the current and future distribution of amphibian species in South Korea. During the simulation, 75% of the data was used in the model calibration and 25% was used to test the model’s predictive ability. We performed 10 replications and maintained cross-validation in the replicate runs to guarantee the accuracy of the model.
We evaluated the model’s goodness-of-fit using the area under the curve (AUC) values of the receiver operating characteristic (ROC) curves and the true skill statistic (TSS) [43]. The test data points were used to calculate the AUC and TSS values. The AUC is a threshold-independent technique used to evaluate model performance by differentiating presence from absence [44]. The AUC values varied from 0 to 1, with higher values indicating higher predictive accuracy. Based on the AUC values, the model performance was categorized into poor (0.5–0.6), fair (0.6–0.7), good (0.7–0.8), very good (0.8–0.9), and excellent (0.9–1). The TSS is threshold dependent and measures the model performance by assessing the classification accuracy after selecting a threshold value. The TSS values ranged between −1 and +1. The values “over 0.8” were considered excellent, “from 0.4 to 0.8” were useful, and “less than 0.4” indicated poor model performance [45].

2.6. Suitable Habitats and Species Richness

We calculated the suitable habitat areas of amphibian species for the current period, 2030, 2050, and 2080 under RCP 4.5 and 8.5. We summed the raster of each amphibian species to determine the current and potential species richness map. We then overlaid the South Korea shape file on the species richness maps and extracted the multi-values to points using the spatial analyst tool in ArcGIS 10.5.1 (ESRI, Redlands, CA, USA). The extracted richness at different points was used to determine the average and maximum species richness of each amphibian species. For more efficient comparison and explanation, species richness of each amphibian group was categorized into three classes: Low, Mid, and High.

3. Results

3.1. Model Evaluation and Validation

We established an independent species distribution model (SDM) for the current and future suitable habitats and distributions of the 16 amphibian species (Table 1). We used the AUC and TSS scores for evaluating model performance. The AUC scores ranged from 0.66 for H. japonica to 0.99 for H. quelpaertensis, and the average was 0.80. The TSS scores varied from 0.53 (D. japonicus) to 0.98 (H. quelpaertensis), and the average was 0.65. The mean value of AUC indicates good model performance and the mean value of TSS indicates useful model performance [43,44].
Relatively low average AUC values were observed in the species distributed widely across South Korea including D. japonica, H. leechii, P. nigromaculatus, and R. uenoi as the AUC is negatively correlated with widespread species distribution. Conversely, the highest AUC value was for the H. quelpaertensis model, which results from the rarity or limited locality of this species [44,46,47]. The occurrence points of H. quelpaertensis from the 3rd National Ecosystem Survey of Korea used in this study are restricted to Jeju Island [28]. To compensate the intrinsic prevalence characteristics of the AUC statistic, we used both the AUC and TSS. TSS is independent of prevalence and is less biased than AUC [44].
Even though the AUC and TSS values of some species were relatively low, they are still higher than those from previous studies (i.e., Préau et al. [45]). Therefore, the values are still acceptable to use in discussing current and future potential suitable habitats, distributions, and richness of amphibian species in South Korea.

3.2. Variable Contributions in the Model

We selected seven environmental variables for the MaxEnt modeling of 16 amphibian species (Table 3). Altitude showed the highest contribution for 12 of the 16 species, and mean annual temperature (Bio1) was the second-highest contributing factor in Group 1 (4 of 6 species) and Group 3 (3 of 4 species). However, water-related factors, such as Bio12, Bio13, and Bio14, had higher contributions than the temperature-related factors in Group 2. These results seem to relate to habitat characteristics. Species require sufficient water to breed and therefore migrate to waterways, such as wetlands or streams, during the breeding season. However, frequent droughts [48] during their breeding period (February to March for H. leechii, H. quelpaertensis, B. gargarizans, and R. uenoi; March to April for B. orientalis; and May to July for G. rugosa) (Chang, 2019. Unpublished data) may negatively impact the habitat suitability for these species.

3.3. Climate Change Impacts on Amphibian Species in Each Group

The range of climatically suitable habitats for the 16 amphibian species was estimated using MaxEnt modeling to show the distribution of each species, and calculate the area of potential habitats under current and future climate change conditions (Table 4; Appendix B). Under current climatic conditions, H. japonica possessed the largest suitable area (69,191 km2), while H. quelpaertensis had the smallest area of suitable habitat (1585 km2). Under future climatic conditions, K. koreana had the largest suitable area for both RCP 4.5 (87,674 km2) and RCP 8.5 by 2080 (87,252 km2). The smallest suitable areas existed for B. Stejnegeri under RCP 4.5 (265 km2) and RCP 8.5 (59 km2) by 2080. The highest rates of potential habitat expansion by 2080 were identified for K. borealis (150.9% increase) under RCP 4.5, and K. koreana (91.2% increase) under RCP 8.5. Meanwhile, the lowest rates of potential habitat loss by 2080 were observed in B. stejnegeri both under RCP 4.5 (98.5%) and under RCP 8.5 (99.7%). Thus, 14 of the 16 amphibian species under RCP 4.5, and 13 of the 16 under RCP 8.5, followed the general hypothesis that suitable habitat area would decrease by 2080 for both RCP scenarios. The rates of potential habitat loss by 2080 in both RCP scenarios were highest for B. stejinegeri. We concluded that B. stejinegeri is the most vulnerable amphibian species living in South Korea. However, we could not identify any overall trends when all 16 amphibian species were considered. As such, we present the results for the groups with different habitat characteristics.

3.4. Habitat Suitability

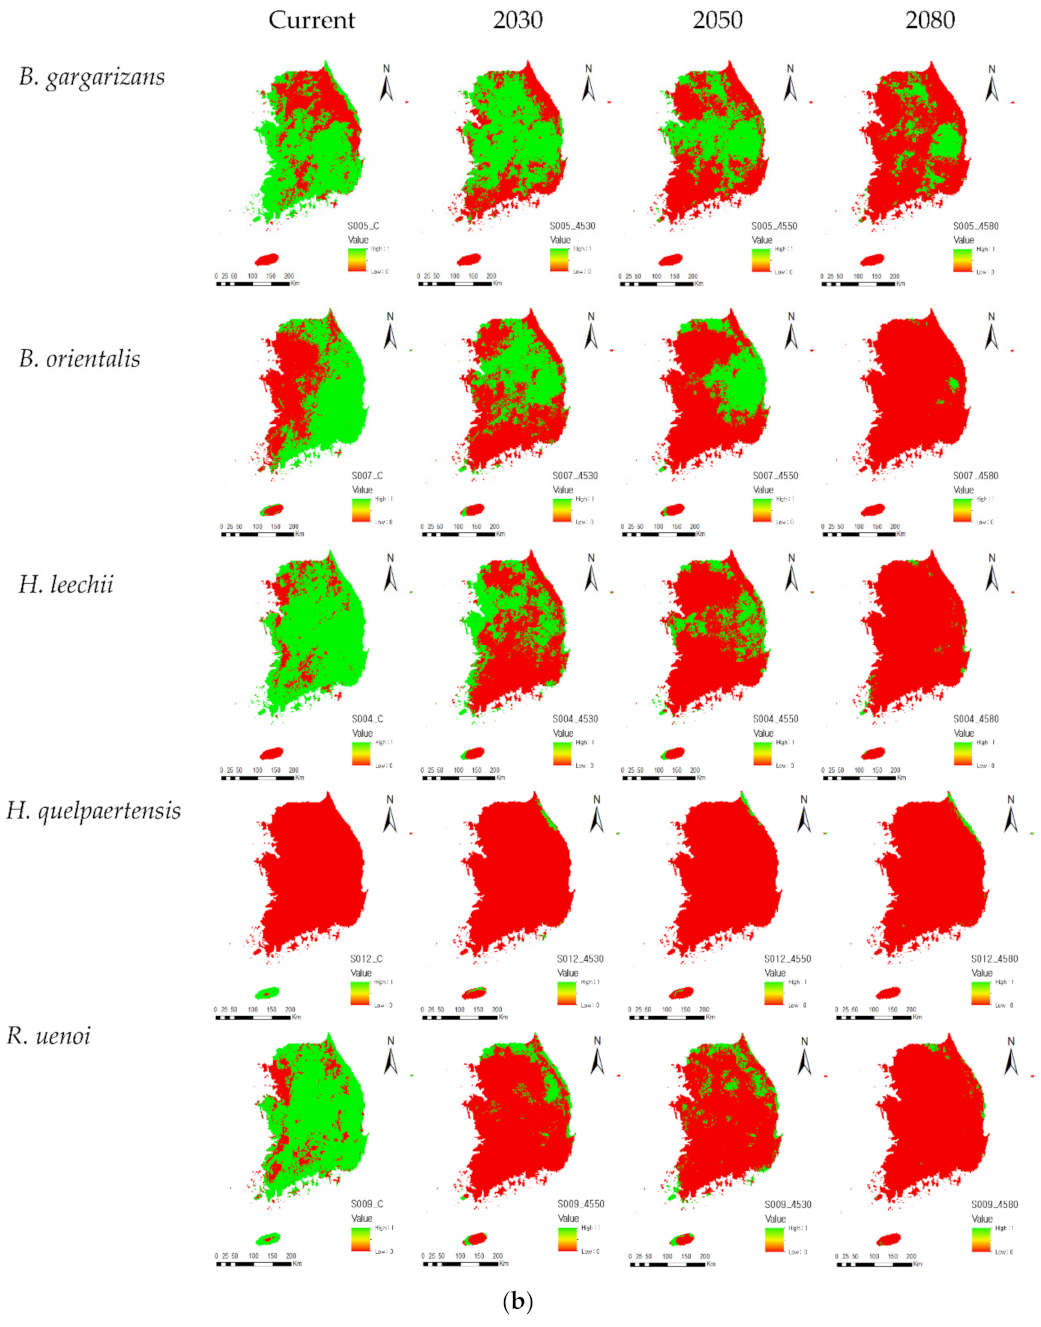
3.4.1. Group 1: Wetland Amphibians

Under current climatic conditions, H. japonica had the highest suitable habitat area (69,191 km2). This is the highest value among the 16 species regardless of group. On the other hand, P. chosenicus had the least area of suitable habitat (10,901 km2) (Table 4). Under future climatic conditions, K. borealis would have the highest suitable habitat area. P. chosenicus would have the least area of suitable habitat by 2080 under the RCP 4.5 and RCP 8.5 scenarios. The rates of potential habitat loss were high, ranging from 56.3–81.7% in RCP 4.5 and from 47.4–98.5% in RCP 8.5 by 2080, except for K. borealis (−150.9% in RCP 4.5 and −68.1% in RCP 8.5 by 2080) and L. catesbeianus (5.1% in RCP 4.5 and −48.3% in RCP 8.5 by 2080). Although the estimated rates and trends of area change were not consistent, the suitable area for amphibian species is predicted to reduce gradually (except for K. borealis under both RCP scenarios and L. catesbeianus for RCP 8.5).

3.4.2. Group 2: Migrating Amphibians

Under the current climatic conditions, H. leechi had the highest area of suitable habitat (68,673 km2), while H. quelpaertensis had the lowest area of suitable habitat (1585 km2) (Table 4). All other Group 2 species have relatively large suitable habitat areas compared to the other groups (Group 1 and Group 3). Under future climatic conditions, B. gargarizans had the largest area of suitable habitat, and H. quelpaertensis had the least area of suitable habitat by 2030, 2050, and 2080 under RCP 4.5 and RCP 8.5. By 2080, the rate of potential habitat loss for H. quelpaertensis was only 4.7% in RCP 4.5 and 23.0% in RCP 8.5. However, in the case of other amphibian species in Group 2, these rates ranged from 67.2% (B. gargarizans) to 96.6% (R. uenoi) in RCP 4.5 and ranged from 62.7% to 96.5% in RCP 8.5. Under RCP 4.5, the potential suitable areas for all five species consistently decreased by 2030, 2050, and 2080 as we predicted. Any trends in suitable area change were not identified in RCP 8.5, but suitable areas eventually decreased by 2080 for all five species in this group.

3.4.3. Group 3: Forest-Dwelling Amphibians

In the current climatic conditions, K. koreana had the highest potential suitable habitat area (45,627 km2), and B. stejnegeri had the lowest area of suitable habitat (17,160 km2) (Table 4). Potential suitable areas for Group 3 amphibian species were generally smaller than those of the other two groups. Interestingly, under future climatic conditions, potential suitable areas for K. koreana substantially increased to 92.2% under RCP 4.5, and 91.2% for RCP 8.5 by 2080. Other species in Group 3 experienced large reductions in suitable habitat area. The rate of potential habitat loss by 2080 for Group 3 species (except K. koreana) ranged from 97.8% (R. huanrenensis) to 98.5% (B. stejnegeri and O. koreanus) under RCP 4.5, and from 96.0% (R. huanrenensis) to 99.7% (B. stejnegeri) under RCP 8.5.

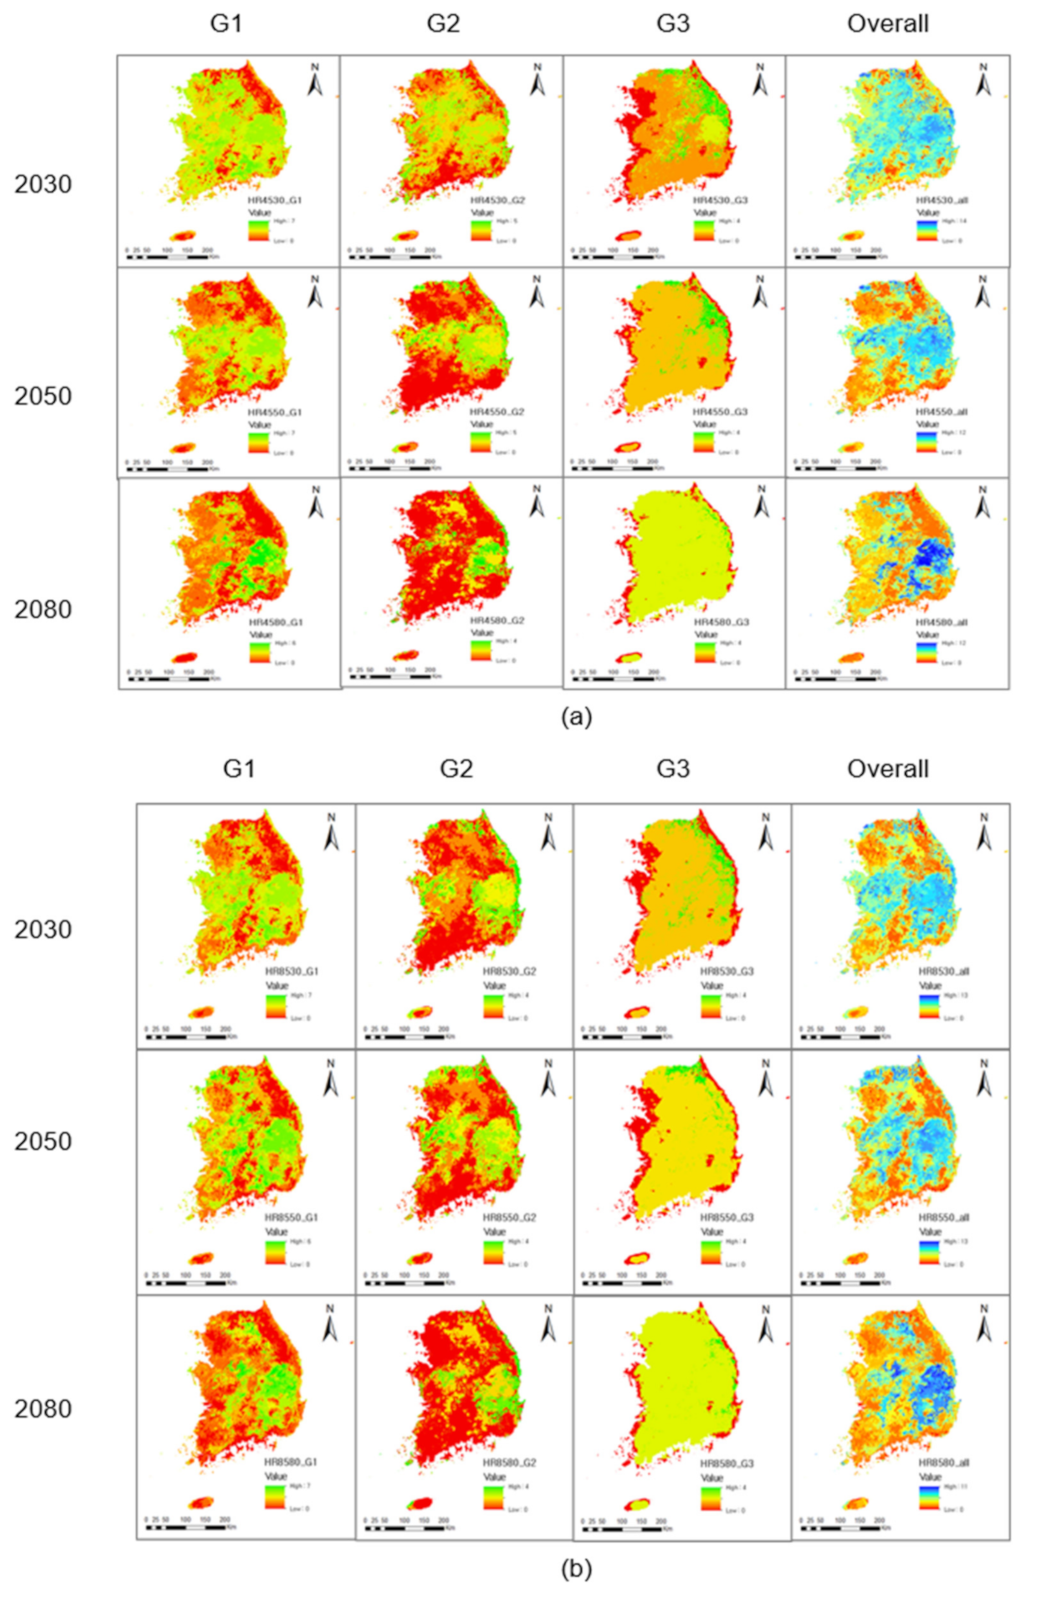
3.5. Species Richness

3.5.1. Group 1: Wetland Amphibians

The average species richness for Group 1 in South Korea under current climate conditions was 2.60, and the maximum was 6.00 (Table 5). The potential area with low species richness (Low), where 1 or no organisms were found, was 23,489 km2; middle species richness (Mid) with 2 to 4 species was 44,823 km2; and high species richness (High) with 5 to 7 species was 27,802 km2 (Table 6). In the current climate conditions (Figure 4), the potential richness of Group 1 species was highest in the western and southern coastal region along with the provinces, Gyeonggi, Chungcheongnam, Chungcheongbuk, Jeollabuk Jeollanam, Gyeongsangnam, southeastern Gyeongsangbuk, Busan, and Ulsan. Their lowest richness was found in the Baekdudaegan Mountain Range occupying almost all areas of Gangwon Province, along the border between Chungcheongbuk Province and Gyeongsangbuk Province, and the border of Jeollabuk and Gyeongsangnam Province where Mt. Jiri is located.
Under the future climatic conditions, the average species richness of Group 1 was slightly reduced to 2.35 by 2080 (Table 5). Areas of potentially low richness substantially increased from 15,970 km2 in 2030 to 34,572 km2 in 2050, and to 51,231 km2 by 2080 under the RCP 4.5 climate change scenario (Table 6). Under RCP 8.5, similar patterns of gradual increase were maintained but the potential areas of Low species richness in 2080 were larger than those of RCP 4.5. Conversely, potential areas of Mid species richness gradually decreased. Compared to current climate conditions, by 2030 the potential Mid areas increased in both RCP 4.5 (52,094 km2) and RCP 8.5 (47,418 km2). By 2050, the potential Mid areas had decreased to 48,351 km2 and by 2080 they had reached 48,351 km2 under RCP 4.5. In RCP 8.5, the potential Mid areas slightly increased by 2050 (48,409 km2), and then considerably decreased by 2080 (34,879 km2). The patterns of the potential High areas were similar to those of Mid areas, but with substantial variations, especially in 2080 (9672 km2 under RCP 4.5, and 8542 km2 under RCP 8.5).
The spatial distribution of species richness revealed that the hotspots (areas of high species richness) were restricted to Gyeongsangbuk and Gyeongsangnam Provinces (except for Daegu City and the southern coastal regions), eastern Chungcheongbuk Province, small parts of eastern Gyeonggi Province, and the western part of Gangwon Province under RCP 4.5 (Figure 5a). Under RCP 8.5 (Figure 5b), the average species richness slightly increased to 2.79 by 2080 (Table 5). The main hotspots were similar to those of RCP 4.5, but the areas of distribution extended slightly to adjacent regions. These results indicate that Group 1 amphibian species will respond to climate change better than the other two groups.

3.5.2. Group 2: Migrating Amphibians

Under current climate conditions, the maximum species richness of the second group (Group 2) was 5.00, and the average richness was 3.48 (Table 5). This result is higher than the Group 1 average for seven species. The differences are mainly due to the higher evenness for these species in the current climate conditions (Figure 4). Under current conditions, the potential area of Low (0–1 species) species richness was 22,604 km2, Mid (2–3 species) was 36,568 km2, and High (4 or more species) was 36,942 km2, respectively (Table 6).
Compared with the amphibian species in the other two groups, Group 2 species would be evenly distributed throughout South Korean regions except in the small inland regions of western Gangwon, northern Gyeonggi, eastern Jeollabuk, and Jeollanam Province; and western coastal areas in Gyeonggi, Chungcheongnam, and Jeollanam Province. The lowest richness was found in the Baekdudaegan Mountain Range occupying almost all of Gangwon Province, along the border between Chungcheongbuk and Gyeongsangbuk Provinces, and the border of Jeollabuk and Gyeongsangnam Provinces where Mt. Jiri is located.
Under future climatic conditions, areas of potential Low species richness substantially and constantly increased from 41,113 km2 (2030) to 62,642 km2 (2050) and then to 89,066 km2 (2080) in the RCP 4.5 scenario (Table 6). Under RCP 8.5, the potential Low area in 2050 (59,266 km2) is slightly decreased when compared with the Low area in 2030 (63,930 km2), but then increases again by 2080 (86,693 km2). On the other hand, potential areas of Mid species richness decrease considerably by 2080 for both RCP 4.5 (7098 km2) and RCP 8.5 (9359 km2) despite great variations in potential area values in 2030 and 2050. The reduction patterns in potential High species richness areas were constant without any unexpected decreases until 2080 (120 km2 under RCP 4.5, and 221 km2 under RCP 8.5).
Under RCP 4.5 (Figure 5a), the model predicted that the average Group 2 species richness would slightly reduce (to 2.35) by 2080. The hotspots shifted to Gyeongsangbuk and Gyeongsangnam Provinces (except for Daegu city), the southern coastal regions, eastern Chungcheongbuk, and small parts of eastern Gyeonggi and western Gangwon Province. In the RCP 8.5 (Figure 5b) scenario, the average species richness increased slightly to 2.94 by 2080. The main hotspots were similar to those of RCP 4.5, but with the areas slightly extended to adjacent regions. Except for H. quelpaertensis, Group 2 species were significantly vulnerable to climate change.

3.5.3. Group 3: Forest-Dwelling Amphibians

Under current climate conditions, the maximum Group 3 species richness was 4.00 and average species richness was 1.25 (Table 5). This result is the lowest among the three groups under current climatic conditions (Figure 4). The potential hotspots for Group 3 species were mainly confined to parts of the mountainous areas in Gangwon Province, and the border of Jeollabuk and Gyeongsangnam Provinces where Jirisan national park is located. Potential suitable habitats of any Group 3 species do not reach Jeju Island, where the Halla Mountain (the highest mountain in South Korea) is located. Under the current climatic conditions, the potential area of Low (0–1 species) species richness was 65,259 km2, the largest among the three groups. The potential area of Mid (2–3 species) richness was 25,866 km2, and High (4 or more species) was 4989 km2, the lowest among the three groups (Table 6).
Under future climatic conditions, potential Low areas substantially and constantly increased from 72,324 km2 (2030) to 86,187 km2 (2050), and then to 95,317 km2 (2080) using the RCP 4.5 scenario (Table 6). Similarly, using RCP 8.5, those values were 86,137 km2 in 2030, 92,280 km2 in 2050, and 95,001 km2 in 2080. On the other hand, potential areas of Mid species richness decrease abruptly and then constantly toward 2080 for both RCP 4.5 (909 km2) and RCP 8.5 (1262 km2). Reduction in the areas of potential High species richness were constant, and the most drastic, among all three groups under both RCP 4.5 (58 km2) and RCP 8.5 (10 km2) by 2080.
In the future climatic conditions, potential suitable regions for K. koreana were extended all over South Korea, even to Jeju Island, in RCP 4.5 and RCP 8.5. However, regions with high species richness drastically reduced by 2080. Under RCP 4.5 (Figure 5a), the Group 3 hotspots narrowed to the mountainous regions and the eastern Gangwon Province. Under RCP 8.5 (Figure 5b), the main hotspots were similar to RCP 4.5, but the regions were slightly extended into inner Gangwon and southern Gyeongsangbuk Provinces. Based on our results predicting the potential suitable habitats for species under the current and future climate conditions, Group 3 amphibian species (except K. koreana) are the most vulnerable to climate change among all three groups.

3.6. Overall Species Richness

Changes in potential suitable habitat for the 16 amphibian species can be summarized into three group patterns depending on their habitat characteristics (Table 6). Potential areas of Low species richness constantly increased under RCP 4.5 (73,827 km2) and RCP 8.5 (70,203 km2) toward 2080. Potential areas of Mid species richness (21,996 km2 under RCP 4.5 and 25,945 km2 under RCP 8.5) and High species richness (461 km2 under RCP 4.5 and 125 km2 under RCP 8.5) constantly and drastically decreased toward 2080.
Analyzing the spatial distribution of species richness changes (Figure 5), hotspots could shift into the Baekdudaegan Mountain Range, Daegu basin and its adjacent regions, and other fragmented mountainous areas in the western Gangwon Province, middle Chugcheongbuk Province, and southeastern Chungcheongnam Province.

4. Discussion

4.1. Current and Future Potential Habitat Suitability

The ranges of climatically suitable habitats and species richness for 16 amphibian species were estimated using MaxEnt modeling under current and future climate change scenarios. The change in the potential habitat suitability for amphibian species depends not only on the climatic variables related to precipitation and temperature used in the MaxEnt model, but also on different non-climatic factors such as overexploitation, habitat loss, and infectious diseases [6,16]. Thus, the suitable habitat for each species may vary under the same climatic conditions in the future.
Our results support previous studies which showed that the potential areas of suitable habitat for almost all the amphibian species in South Korea will decline in the future [11,17]. The rates and extents of habitat decline were not consistent among species but slightly consistent within the groups. The order of PHL was Group 3 > Group 2 > Group 1, indicating that Group 3 species are the most vulnerable, and Group 1 species are the most resistant to climate change.
Group 1 species distribution could be more sensitive to anthropogenic influence than that of the other two groups. Most of their habitats show possible overlaps with human urban and suburban regions which usually contain water bodies. Thus, interference by urbanization might be one of the most serious factors causing habitat loss and fragmentation [49]. The high-water requirements during migration for breeding are a major limitation for Group 2 species. As such, their habitation may be higher in high rainfall areas compared to areas with low water availability, which constitute a loss of species habitat for this group [38]. The land-use conversion from forest to agricultural land, and the resultant habitat fragmentation, may make forest-dwelling amphibians (Group 3) more vulnerable to climate change [41].
On the other hand, climate change may promote the distribution of some species, creating opportunities for ecosystem restoration [50]. In this study, the suitable habitat areas of three species, L. catesbeianus, K. borealis, and K. koreana, were predicted to increase by 2080.
The American bullfrog (L. catesbeianus) is not native to South Korea but has successfully adapted to Korean environment since it was first introduced in 1957. In 1998, it was designated as an ecosystem-disturbing, invasive species. This species has virtually no natural predators and eats insects, fish, snakes, and native frogs [51]. In 2030, the potential area of suitable habitat for the American bullfrog is predicted to substantially increase. Even though the total habitat area of the American bullfrog is predicted to slightly reduce in 2050 and 2080, this species is likely to spread across the country; therefore, a long-term management plan is required [52].
The distribution of the narrow-mouthed toad (K. borealis) had increased substantially by 2080. This result may be closely related to precipitation increases under RCP 4.5 and 8.5 [53]; 17.3% and 20.4%, respectively. More research is required to investigate the trends in this species’ future distribution.
The most striking results of this study were those regarding the potential distribution of the Korean crevice salamander (K. koreana), the first lungless salamander (Plethodontidae) species discovered in Asia [42]. Under current climate conditions, the potential suitable habitat for K. koreana was limited to the middle portion of South Korea. However, this species was predicted to spread widely throughout Korea in 2030, 2050, and 2080 (Figure 5). Borzée et al. [21] predicted a similar trend in the potential habitat distribution of K. koreana under climate change using the MaxEnt model with four RCP scenarios and six bioclimatic factors. Even though their projections only included the years 2050 and 2070, they found marked increases in the potential habitat areas under RCP 4.5 in both years. However, under RCP 8.5, there were substantial increases in 2050 followed by substantial decreases in 2070. These contrasting results may have been caused by the use of different bioclimatic variables. They used four temperature-related variables including bio2, bio3, bio4, and bio6, and two precipitation-related variables such as bio14 and bio16. Furthermore, they did not include altitude as an input environmental variable. In our study, altitude was identified as the most influential variable for habitat suitability in amphibians. As such, we suggest that future studies investigate various approaches with diverse bioclimatic input variables and ecological settings to understand the potential current and future distribution of this enigmatic species under climate change.

4.2. Potential Species Richness under Current Conditions

The current potential distributions of amphibian species reflect the patterns in the topography of Korea and are represented by the Baekdudaegan Mountain Range [22]. The potential distribution of Group 1 species was concentrated in the southwestern area of South Korea where wetlands are located, such as rice fields, riparian buffers, and vegetative filter strips. Group 2 amphibians were predicted to live throughout the South Korean region. The Baekdudaegan Mountain Range was predicted to be a main hotspot for Group 3 amphibian species.

4.3. Potential Species Richness under Future Conditions

As we briefly discussed, by 2080, the potential hotspots for Group 1 and Group 2 species under RCP 4.5 and 8.5 would shift to the Daegu basin, south of Mt. Taebaek in Baekdudaegan Mountain Range. This trend was more evident in Group 2 than in Group 1. This convergence could result from the high precipitation expected in this region in the future. The Korea Meteorological Association (Korea Meteorological Administration 2017) predicted that the rate of precipitation increase in the Daegu region would be higher than the average for the entire South Korean region until the end of the 21st century, but the rate of temperature increase would be lower than the South Korean average. As Group 2 species require a large amount of water during the breeding period, they are predicted to disperse into the areas of higher precipitation.
In the case of Group 3, the potential distributions drastically decreased for three species including B. stejnegeri, O. koreanus, and R. huanrenensis; and their habitats were generally limited to the northeastern region stretching from Mt. Seorak to Mt. Taebaek, in the middle of the Baekdudaegan Mountain Range. Our study suggests Group 3 species were the most vulnerable group to climate change. This finding is consistent with earlier studies investigating the impacts of climate change on high-altitude biodiversity, including amphibians [30,32,54]. However, this is an unexpected result considering the three different habitat characteristics. We assumed that larger areas of future Group 1 habitats were inclined to be overlapped with human activities, compared to the future habitat areas of Groups 2 and 3. In the case of Group 2, they could face water scarcity and road kill problems during the migration period. Therefore, we assumed that Group 1 or Group 2 were more vulnerable than Group 3. Moreover, as we discussed previously, a substantial increase in the potential distribution area of K. koreana was predicted. More studies on the various aspects which impact K. koreana distribution, including land-use change and habitat fragmentation, are required.
The results of this study may provide a baseline for designing different conservation strategies for amphibians indigenous to South Korea. In 2005, the International Union for Conservation of Nature hosted the Amphibian Conservation Summit and declared the Amphibian Conservation Action Plan (ACAP) [55]. The ACAP included four fundamental actions, first, understanding the causes of decline and extinction of amphibians. Second, ongoing documentation of amphibian diversity and changes therein. Third, development and implementation of a long-term conservation plan. Finally, undertaking emergency responses to urgent crises [55]. We expect that this study will provide baseline information about current and future potential habitats of amphibian species in South Korea, which could be an important reference for designing conservation policies, including in situ and ex situ conservation of threatened species [56]. We predicted that the middle part of the Baekdudaegan Mountain Region and southeastern Gyeongsangbuk Province would be future potential habitats for many species. Therefore, they could be priority regions for establishing amphibian conservation area in future. Policy-makers can use these results to establish the long-term conservation plan in this region, which should include habitat management, reductions in anthropogenic pressure, and controls on hunting. In addition, our study suggests that forest-dwelling amphibians are at high risk under future climate change and this requires species-specific conservation programs for their long-term conservation in South Korea [57].

4.4. Limitations and Possible Future Research

Our approach is comprehensive and deals with almost all amphibian species identified from the National Ecosystem Survey in South Korea, even though two species were excluded due to the lack of minimum occurrence points for MaxEnt modeling. However, there are still some limitations in this study. First, we did not include land-use data. The integration of land-use data in SDM may provide invaluable information to evaluate the future distribution changes of amphibians, improve the strength of predicted results, and assist in outlining potential conservation measures [45,58]. Land-use is also closely related to the scale problem. Pixel size in this study was 1 km2, but our baseline simulation results using a land-use variable with 1 km2 scale were not refined enough to provide any influence on the variations in suitable habitat and species richness of amphibian species. In addition, we assumed unlimited dispersal, though migration rates would assist in more accurately determining future potential distributions and species richness [59]. Consequently, this is the first step towards developing a future research program where we can utilize our results as a base and address the identified limitations.

5. Conclusions

We investigated the potential effects of climate change on the distribution of 16 amphibian species with different habitat characteristics in South Korea. These included wetland amphibians (Group 1), migrating amphibians (Group 2), and forest-dwelling amphibians (Group 3). Our results indicated that suitable amphibian habitats will decrease continuously toward 2080 under both RCP 4.5 and 8.5, except for three species; L. catesbeianus, K. borealis, and K. koreana. The future potential habitat expansion of K. koreana is the most striking, and immediate further investigation into the various factors affecting this species’ survival is required. The species richness of Group 1 and Group 2 will converge southeastward, around the Daegu basin. This trend was more obvious in Group 2 than in Group 1. The hotspots of Group 3 species (except K. koreana) will shift into the middle of the Baekdudaegan Mountain Range, along the eastern coast. Unexpectedly, species in Group 3 were the most vulnerable to climate change among the three groups. Thus, special conservation measures are required. The results of this study provide useful information on how climate change will influence the decline of amphibian species in South Korea based on their habitat characteristics.

Author Contributions

As the submitting author of this manuscript, H.W.K. designed the research, analyzed the data, wrote the draft, and practically communicated with the editor and reviewers. P.A. designed the research, analyzed the data, and contributed to converting the draft into this manuscript with the addition of invaluable comments, preparing figures and supporting information. M.H.C. contributed to differentiating this study from previous studies on amphibians in South Korea by classifying them into three groups according to previous references. As a principal investigator of this research project, and the official corresponding author, C.S. formulated and coordinated the overall research. All authors have read and agreed to the published version of the manuscript.

Funding

This study was supported by the Ministry of the Environment (NIE-B-2021-01); the ICT promotion fund of Korean Ministry of Science and ICT; the Korea Environment Industry and Technology Institute (KEITI) through the “Climate Change Response Technology Project” funded by the Korea Ministry of Environment (2014001310009); and the National Research Foundation of Korea grant funded by the Ministry of Education (Project No.: NRF-2014R1A1A2060140).

Institutional Review Board Statement

Not applicable.

Informed Consent Statement

Not applicable.

Data Availability Statement

All of the occurrence data in this study are available on the EcoBank official website (https://www.nie-ecobank.kr/cmmn/Index.do?lang=en, accessed on 20 July 2021). EcoBank is the first ecological database platform in Korea. For more information, please read: Kim, H.W.; Yoon, S.; Kim, M.; Shin, M.; Yoon, H.; Kim, K. EcoBank: A flexible database platform for sharing ecological data. Biodiversity Data Journal 2021, 9, e61866, doi:10.3897/BDJ.9.e61866.

Conflicts of Interest

The authors have no conflict of interest to declare.

Appendix A. Preliminary Results of Species Distribution Analysis Using EcoBank Analysis Module for 16 Amphibians in Korea

Figure A1. (a) H. japonica; (b) K. borealis; (c) G. rugosa; (d) L. catesbeianus; (e) P. chosenicus; (f) P. nigromaculatus; (g) R. coreana; (h) B. orientalis; (i) B. gargarizans; (j) H. leechii; (k) H. qualpartensis; (l) R. dyboskii; (m) B. stejnegeri; (n) K. koreana; (o) O. koreanus; (p) R. huanrenensis.
Animals 11 02185 g0a1

Appendix B. Potential Spatial Distribution of Individual Amphibian Species under RCP4.5

Figure A2. (a) Group 1. Wetland amphibians; (b) Group 2. Migrating amphibians; (c) Group 3. Forest dwelling amphibians.
Animals 11 02185 g0a2aAnimals 11 02185 g0a2bAnimals 11 02185 g0a2c

References

  1. Wilby, R.L.; Perry, G.L. Climate change, biodiversity and the urban environment: A critical review based on London, UK. Prog. Phys. Geogr. 2006, 30, 73–98. [Google Scholar] [CrossRef]
  2. Hughes, L. Biological consequences of global warming: Is the signal already apparent? Trends Ecol. Evol. 2000, 15, 56–61. [Google Scholar] [CrossRef]
  3. Walther, G.-R.; Post, E.; Convey, P.; Menzel, A.; Parmesan, C.; Beebee, T.J.C.; Fromentin, J.-M.; Hoegh-Guldberg, O.; Bairlein, F. Ecological responses to recent climate change. Nature 2002, 416, 389–395. [Google Scholar] [CrossRef] [PubMed]
  4. Díaz-García, J.M.; Pineda, E.; López-Barrera, F.; Moreno, C.E. Amphibian species and functional diversity as indicators of restoration success in tropical montane forest. Biodivers. Conserv. 2017, 26, 2569–2589. [Google Scholar] [CrossRef]
  5. Ochoa-Ochoa, L.M.; Rodríguez, P.; Mora, F.; Flores-Villela, O.; Whittaker, R.J. Climate change and amphibian diversity patterns in Mexico. Biol. Conserv. 2012, 150, 94–102. [Google Scholar] [CrossRef]
  6. Stuart, S.N.; Chanson, J.S.; Cox, N.A.; Young, B.E.; Rodrigues, A.S.L.; Fischman, D.L.; Waller, R.W. Status and Trends of Amphibian Declines and Extinctions Worldwide. Science 2004, 306, 1783. [Google Scholar] [CrossRef] [PubMed] [Green Version]
  7. Pough, H.F. Amphibian biology and husbandry. ILAR J. 2007, 48, 203–213. [Google Scholar] [CrossRef] [Green Version]
  8. Wells, K.D. The Ecology and Behavior of Amphibians; University of Chicago Press: Chicago, IL, USA, 2010; p. 1148. [Google Scholar]
  9. Pounds, J.A.; Bustamante, M.R.; Coloma, L.A.; Consuegra, J.A.; Fogden, M.P.; Foster, P.N.; La Marca, E.; Masters, K.L.; Merino-Viteri, A.; Puschendorf, R. Widespread amphibian extinctions from epidemic disease driven by global warming. Nature 2006, 439, 161–167. [Google Scholar] [CrossRef]
  10. Young, B.E.; Lips, K.R.; Reaser, J.K.; Ibáñez, R.; Salas, A.W.; Cedeño, J.R.; Coloma, L.A.; Ron, S.; La Marca, E.; Meyer, J.R. Population declines and priorities for amphibian conservation in Latin America. Conserv. Biol. 2001, 15, 1213–1223. [Google Scholar] [CrossRef]
  11. Hof, C.; Araújo, M.B.; Jetz, W.; Rahbek, C. Additive threats from pathogens, climate and land-use change for global amphibian diversity. Nature 2011, 480, 516–519. [Google Scholar] [CrossRef]
  12. Agostini, M.G.; Roesler, I.; Bonetto, C.; Ronco, A.E.; Bilenca, D. Pesticides in the real world: The consequences of GMO-based intensive agriculture on native amphibians. Biol. Conserv. 2020, 241, 108355. [Google Scholar] [CrossRef]
  13. Knapp, R.A. Effects of nonnative fish and habitat characteristics on lentic herpetofauna in Yosemite National Park, USA. Biol. Conserv. 2005, 121, 265–279. [Google Scholar] [CrossRef]
  14. Miró, A.; Ventura, M. Introduced fish in Pyrenean high mountain lakes: Impact on amphibians and other organisms, and conservation implications. Limnetica 2020, 39, 283–297. [Google Scholar]
  15. Pilliod, D.S.; Hossack, B.R.; Bahls, P.F.; Bull, E.L.; Corn, P.S.; Hokit, G.; Maxell, B.A.; Munger, J.C.; Wyrick, A. Non-native salmonids affect amphibian occupancy at multiple spatial scales. Divers. Distrib. 2010, 16, 959–974. [Google Scholar] [CrossRef] [Green Version]
  16. Ficetola, G.F.; Rondinini, C.; Bonardi, A.; Baisero, D.; Padoa-Schioppa, E. Habitat availability for amphibians and extinction threat: A global analysis. Divers. Distrib. 2015, 21, 302–311. [Google Scholar] [CrossRef]
  17. Pearson, R.G.; Dawson, T.P. Predicting the impacts of climate change on the distribution of species: Are bioclimate envelope models useful? Global Ecol. Biogeogr. 2003, 12, 361–371. [Google Scholar] [CrossRef] [Green Version]
  18. Do, M.S.; Lee, J.-W.; Jang, H.-J.; Kim, D.-I.; Park, J.; Yoo, J.-C. Spatial distribution patterns and prediction of hotspot area for endangerd herpetofauna species in Korea. Korean J. Environ. Ecol. 2017, 31, 381–396. (In Korean) [Google Scholar] [CrossRef]
  19. Jeong, S.; Seo, C.; Yoon, J.; Lee, D.K.; Park, J. A sutudy on riparian habitats for amphibians using habitat suitability model. J. Environ. Impact Assess. 2015, 24, 175–189. (In Korean) [Google Scholar] [CrossRef]
  20. Jung, J.-H.; Lee, E.-J.; Lee, W.-S.; Park, C.-D. Habitat suitability models of Korean crevice salamander (Karsenia koreana) at forested area in Daejeon metropolitan city, Republic of Korea. J. For. Res. 2019, 24, 349–355. [Google Scholar] [CrossRef]
  21. Borzée, A.; Andersen, D.; Groffen, J.; Kim, H.-T.; Bae, Y.; Jang, Y. Climate change-based models predict range shifts in the distribution of the only Asian plethodontid salamander: Karsenia koreana. Sci. Rep. 2019, 9, 11838. [Google Scholar] [CrossRef] [Green Version]
  22. Chung, M.Y.; Son, S.; Suh, G.U.; Herrando-Moraira, S.; Lee, C.H.; López-Pujol, J.; Chung, M.G. The Korean Baekdudaegan Mountains: A glacial refugium and a biodiversity hotspot that needs to be conserved. Front. Genet. 2018, 9, 489. [Google Scholar] [CrossRef] [PubMed] [Green Version]
  23. Lee, S.-D.; Miller-Rushing, A.J. Degradation, urbanization, and restoration: A review of the challenges and future of conservation on the Korean Peninsula. Biol. Conserv. 2014, 176, 262–276. [Google Scholar] [CrossRef]
  24. Kim, J.-U.; Boo, K.-O.; Choi, J.; Byun, Y.-H. One hundred years of climate change on the Korean Peninsula. Annu. Rep. Natl. Inst. Meteorol. Sci. 2018. [Google Scholar]
  25. Borzée, A.; Min, M.-S. Disentangling the Impacts of speciation, sympatry and the island effect on the morphology of seven Hynobius sp. salamanders. Animals 2021, 11, 187. [Google Scholar] [CrossRef]
  26. National Institute of Environmental Research. The Second and Third National Ecosystem Survey: 1997–2012; National Institute of Environmental Research: Incheon, Korea, 2013. (In Korean) [Google Scholar]
  27. Kim, J.-B.; Song, J.-Y. Amphibians and Reptiles of Korea; World Science Publisher: Seoul, Korea, 2010; p. 146. (In Korean) [Google Scholar]
  28. Kim, H.W.; Yoon, S.; Kim, M.; Shin, M.; Yoon, H.; Kim, K. EcoBank: A flexible database platform for sharing ecological data. Biodivers. Data J. 2021, 9, e61866. [Google Scholar] [CrossRef]
  29. Adhikari, P.; Jeon, J.-Y.; Kim, H.W.; Shin, M.-S.; Adhikari, P.; Seo, C. Potential impact of climate change on plant invasion in the Republic of Korea. J. Ecol. Environ. 2019, 43, 1–12. [Google Scholar] [CrossRef]
  30. Adhikari, P.; Shin, M.-S.; Jeon, J.-Y.; Kim, H.W.; Hong, S.; Seo, C. Potential impact of climate change on the species richness of subalpine plant species in the mountain national parks of South Korea. J. Ecol. Environ. 2018, 42, 36. [Google Scholar] [CrossRef]
  31. Jeon, J.-Y.; Adhikari, P.; Seo, C. Impact of climate change on potential dispersal of Paeonia obovata (paeoniaceae), a critically endangered medicinal plant of South Korea. Ecol. Environ. Conserv. 2020, 26, S145–S155. [Google Scholar]
  32. Hijmans, R.J.; Phillips, S.; Leathwick, J.; Elith, J. Package ‘dismo’. Circles 2017, 9, 1–68. [Google Scholar]
  33. Adhikari, P.; Jeon, J.-Y.; Kim, H.W.; Oh, H.-S.; Adhikari, P.; Seo, C. Northward Range Expansion of Southern Butterflies According to Climate Change in South Korea. J. Clim. Chang. Res. 2020, 11, 643–656. [Google Scholar] [CrossRef]
  34. Lee, J.H.; Park, D. The Encyclopedia of Korean Amphibians; The Nature and Ecology: Seoul, Korea, 2016. (In Korean) [Google Scholar]
  35. Hirai, T.; Matsui, M. Feeding Relationships between Hyla japonica and Rana nigromaculata in Rice Fields of Japan. J. Herpetol. 2002, 36, 662–667. [Google Scholar] [CrossRef]
  36. Muñoz-Carpena, R.; Parsons, J.E.; Gilliam, J.W. Numerical Approach to the Overland Flow Process in Vegetative Filter Strips. Trans. ASABE 1993, 36, 761–770. [Google Scholar] [CrossRef]
  37. Yoon, S.; Min, J.; Hwang, S. The climatic change during the historical age inferred from vegetation environment in alpine moors in the Korean Peninsula. Korean J. Geomorphol. Assoc. 2014, 21, 69–83. (In Korean) [Google Scholar]
  38. Todd, B.D.; Winne, C.T. Ontogenetic and interspecific variation in timing of movement and responses to climatic factors during migrations by pond-breeding amphibians. Can. J. Zool. 2006, 84, 715–722. [Google Scholar] [CrossRef]
  39. Choi, W.-J.; Park, D.; Kim, J.-K.; Lee, J.-H.; Kim, D.-I.; Kim, I.-H. Changes in the Reproductive Population Size of the Huanren Brown Frog (Rana huanrenensis) and Wonsan Salamander (Hynobius leechii), which Breeding in Mountain Valleys, According to Climate Change. Korean J. Environ. Ecol. 2018, 32, 582–590. (In Korean) [Google Scholar] [CrossRef]
  40. Park, D.; Park, S.-R. Multiple Insemination and Reproductive Biology of Hynobius leechii. J. Herpetol. 2000, 34, 594–598. [Google Scholar] [CrossRef]
  41. Kafash, A.; Ashrafi, S.; Ohler, A.; Yousefi, M.; Malakoutikhah, S.; Koehler, G.; Schmidt, B.R. Climate change produces winners and losers: Differential responses of amphibians in mountain forests of the Near East. Glob. Ecol. Conserv. 2018, 16, e00471. [Google Scholar] [CrossRef]
  42. Min, M.S.; Yang, S.Y.; Bonett, R.M.; Vieites, D.R.; Brandon, R.A.; Wake, D.B. Discovery of the first Asian plethodontid salamander. Nature 2005, 435, 87–90. [Google Scholar] [CrossRef]
  43. Allouche, O.; Tsoar, A.; Kadmon, R. Assessing the accuracy of species distribution models: Prevalence, kappa and the true skill statistic (TSS). J. Appl. Ecol. 2006, 43, 1223–1232. [Google Scholar] [CrossRef]
  44. Lobo, J.M.; Jiménez-Valverde, A.; Real, R. AUC: A misleading measure of the performance of predictive distribution models. Glob. Ecol. Biogeogr. 2008, 17, 145–151. [Google Scholar] [CrossRef]
  45. Préau, C.; Trochet, A.; Bertrand, R.; Isselin-Nondedeu, F. Modeling potential distributions of three european amphibian species comparing enfa and Maxent Préau et al.-MaxEnt and ENFA modeling on three amphibian species. Herpetol. Conserv. Biol. 2018, 13, 91–104. [Google Scholar]
  46. Swets, J. Measuring the accuracy of diagnostic systems. Science 1988, 240, 1285–1293. [Google Scholar] [CrossRef] [PubMed] [Green Version]
  47. Williams, J.N.; Seo, C.; Thorne, J.; Nelson, J.K.; Erwin, S.; O’Brien, J.M.; Schwartz, M.W. Using species distribution models to predict new occurrences for rare plants. Divers. Distrib. 2009, 15, 565–576. [Google Scholar] [CrossRef]
  48. Yoo, C.; Kim, S.; Kim, T.-W. Assessment of drought vulnerability based on the soil moisture PDF. Stoch. Environ. Res. Risk Assess. 2006, 21, 131–141. [Google Scholar] [CrossRef]
  49. Hamer, A.J.; McDonnell, M.J. Amphibian ecology and conservation in the urbanising world: A review. Biol. Conserv. 2008, 141, 2432–2449. [Google Scholar] [CrossRef]
  50. Manzoor, S.A.; Griffiths, G.; Iizuka, K.; Lukac, M. Land Cover and Climate Change May Limit Invasiveness of Rhododendron ponticum in Wales. Front. Plant Sci. 2018, 9, 664. [Google Scholar] [CrossRef] [Green Version]
  51. Oh, H.-S.; Hong, C.-E. Current conditions of habitat for Rana catesbeiana and Trachemys scripta elegans imported to Jeju-do, including proposed management plans. Korean J. Environ. Ecol. 2007, 21, 311–317. (In Korean) [Google Scholar]
  52. Kim, H.-M.; Kim, M.-J.; Baek, H.-J.; Kim, S.-H.; An, K.-G.; Lee, J.-H. Predicting demographical change and potential habitat of the American bullfrog introduced to Korean peninsula. In Proceedings of the 11th Conference, Korean Society of Herpetologists, National Institute of Ecology, Seocheon-gun, Korea, 13 July 2018. [Google Scholar]
  53. Baek, H.-J.; Lee, J.; Lee, H.-S.; Hyun, Y.-K.; Cho, C.; Kwon, W.-T.; Marzin, C.; Gan, S.-Y.; Kim, M.-J.; Choi, D.-H.J. Climate change in the 21st century simulated by HadGEM2-AO under representative concentration pathways. Asia Pac. J. Atmos. Sci. 2013, 49, 603–618. [Google Scholar] [CrossRef]
  54. Duan, R.-Y.; Kong, X.-Q.; Huang, M.-Y.; Varela, S.; Ji, X. The potential effects of climate change on amphibian distribution, range fragmentation and turnover in China. PeerJ 2016, 4, e2185. [Google Scholar] [CrossRef] [Green Version]
  55. Gascon, C.; Collins, J.P.; Moore, R.D.; Church, D.R.; McKay, J.E.; Mendelson, J.R., III (Eds.) Amphibian Conservation Action Plan; International Union for Conservation of Nature-Species Survival Commission (IUCN-SSC) Amphibian Specialist Group: Gland, Switzerland; Cambridge, UK, 2007; p. 64. [Google Scholar]
  56. Zippel, K.; Johnson, K.; Gagliardo, R.; Gibson, R.; McFadden, M.; Browne, R.; Martinez, C.; Townsend, E. The amphibian ark: A global community for ex situ conservation of amphibians. Herpetol. Conserv. Biol. 2011, 6, 340–352. [Google Scholar]
  57. Ortega-Andrade, H.M.; Rodes Blanco, M.; Cisneros-Heredia, D.F.; Guerra Arévalo, N.; López de vargas-Marchuca, K.G.; Sánchez-Nivicela, J.C.; Armijos-Ojeda, D.; Cáceres Andrade, J.F.; Reyes-Puig, C.; Quezada Riera, A.B. Red list assessment of amphibian species of Ecuador: A multidimensional approach for their conservation. PLoS ONE 2021, 16, e0251027. [Google Scholar] [CrossRef]
  58. Gonçalves, J.; Honrado, J.P.; Vicente, J.R.; Civantos, E. A model-based framework for assessing the vulnerability of low dispersal vertebrates to landscape fragmentation under environmental change. Ecol. Complex. 2016, 28, 174–186. [Google Scholar] [CrossRef]
  59. Subba, B.; Sen, S.; Ravikanth, G.; Nobis, M.P. Direct modelling of limited migration improves projected distributions of Himalayan amphibians under climate change. Biol. Conserv. 2018, 227, 352–360. [Google Scholar] [CrossRef]
Figure 1. Map of study area. The 17 colors in the map indicate different provinces and mega cities of South Korea.
Animals 11 02185 g001
Figure 2. The Baekdudaegan Mountain Region in Korea (Modified from: Chung et al., 2018 [22]). The Baekdudaegan Mountain Region is the “backbone” in Korean Peninsula. It stretches across the Korean peninsula and is a well-known biodiversity hotspot, harboring 1500 plant species (in the South Korean area.
Animals 11 02185 g002
Figure 3. Occurrence points for 16 amphibian species: (a) H. japonica; (b) K. borealis; (c) G. rugosa; (d) L. catesbeianus; (e) P. chosenicus; (f) P. nigromaculatus; (g) R. coreana; (h) B. orientalis; (i) B. gargarizans; (j) H. leechii; (k) H. qualpartensis; (l) R. dyboskii; (m) B. stejnegeri; (n) K. koreana; (o) O. koreanus; (p) R. huanrenensis.
Animals 11 02185 g003
Figure 4. Potential species richness of amphibian species under the current climate. The figures (ad) show the richness of amphibians for Group 1, Group 2, Group 3, and overall.
Animals 11 02185 g004
Figure 5. Potential species richness of amphibian under the future climate change: (a) RCP 4.5 (b) RCP 8.5.
Animals 11 02185 g005
Table 1. List of amphibian species in South Korea.
Family NameScientific NameCommon NamePresenceAUCTSS
BufonidaeBufo gargarizansAsian toad12330.790.59
BufonidaeBufo stejnegeriWater toad2330.920.72
DiscoglossidaeBombina orientalisOriental fire-bellied toad33020.730.54
HylidaeDryophytes japonicusJapanes tree frog49760.660.53
HynobiidaeHynobius leechiiKorean salamander34010.770.65
HynobiidaeHynobius quelpaertensisJeju salamander740.990.98
HynobiidaeOnychodactylus koreanusKorean clawed salamander2400.890.66
MicrohylidaeKaloula borealisNarrow-mouthed toad640.870.65
PlethodontidaeKarsenia koreanaKorean crevice salamander130.820.69
RanidaeGlandirana rugosaWrinkled frog16830.710.61
RanidaeLithobates catesbeianusAmerican bullfrog25270.870.59
RanidaePelophylax chosenicusKorean golden frog310.970.89
RanidaePelophylax nigromaculatusblack-spotted pond frog63140.780.65
RanidaeRana coreanaKorean brown frog15620.760.57
RanidaeRana uenoiKorean large brown frog37080.680.55
RanidaeRana huanrenensisHuanren brown frog9300.860.54
HylidaeDryophytes suweonensis *Suweon tree frogPresenc epoints < 10
HynobiidaeHynobius yangi *Kori salamanderPresenc epoints < 10
HylidaeDryophytes flaviventrisaYellow-bellied tree frogwww.krsh.co.kr
(accessed on 20 July 2021)
HynobiidaeHynobius geojeensis aGeoje salamanderBorzée and Min, 2021
HynobiidaeHynobius notialis aSouthern Korean salamanderBorzée and Min, 2021
HynobiidaeHynobius perplicatus aCryptic Uiryeong salamanderBorzée and Min, 2021
HynobiidaeHynobius unisacculus aKorean small salamanderwww.krsh.co.kr
(accessed on 20 July 2021)
* There are 23 amphibian species currently recorded in South Korea. We targeted 18 species to model, identified from the 3rd National Ecosystem Survey in Korea, but D. suweonensis and H. yangi were not included in analysis as their number of occurrence points were less than 10. a Newly reported amphibian species in South Korea. We excluded these species in analysis as their occurrence points are not available on the datasets collected by the 3rd National Ecosystem Survey. (Species in gray shaded area were not included in our simulation).
Table 2. Bioclimatic and environmental variables used in this study.
CodeDescriptionUnitSource
Bio1Annual mean temperature°CKMA
Bio2Mean diurnal temperature range°CKMA
Bio3Isothermality (BIO2/BIO7) (×100)PercentKMA
Bio4Temperature seasonality°CKMA
Bio5Max temperature of warmest month°CKMA
Bio6Min temperature of coldest month°CKMA
Bio7Temperature annual range°CKMA
Bio8Mean temperature of wettest quarter°CKMA
Bio9Mean temperature of driest quarter°CKMA
Bio10Mean temperature of warmest quarter°CKMA
Bio11Mean temperature of coldest quarter°CKMA
Bio12Annual precipitationmmKMA
Bio13Precipitation of wettest monthmmKMA
Bio14Precipitation of driest monthmmKMA
Bio15Precipitation seasonalityFractionKMA
Bio16Precipitation of wettest quartermmKMA
Bio17Precipitation of driest quartermmKMA
Bio18Precipitation of warmest quartermmKMA
Bio19Precipitation of coldest quartermmKMA
DemElevationmmKMA
KMA: Korea Meteorological Administration.
Table 3. Estimating the contributions of environmental variables for the modeling of 16 amphibian species among habitat groups.
GroupsSpeciesAltitudeBio01Bio02 Bio03Bio12 Bio13 Bio14
Group 1D. japonicus81.44.43.53.70.46.20.3
K. borealis48.57.10.36.916.910.69.7
G. rugosa60.12.66.912.711.61.94.3
L. catesbeianus31.246.10.82.32.616.40.6
P. chosenicus78.610.41.48.10.40.30.8
P. nigromaculatus77.49.03.67.31.60.80.2
R. coreana43.525.54.12.713.55.35.3
Group 2B. orientalis34.98.41.64.52.734.113.9
B. gargarizans56.09.42.06.710.115.50.3
H. leechii44.44.63.91.915.327.42.4
H. quelpaertensis0.06.70.30.360.10.332.3
R. uenoi74.62.94.83.21.57.85.2
Group 3B. stejnegeri16.059.22.77.91.14.18.9
K. koreana22.20.018.629.40.029.60.2
O. koreanus42.841.04.10.90.92.38.0
R. huanrenensis57.221.93.32.13.47.25.0
Table 4. Estimating the suitable habitat area of amphibians per habitat characteristics. (unit: km2).
GroupScientific NameCurrentRCP 4.5PHL * (%)RCP 8.5PHL * (%)
203020502080203020502080
Group 1H. japonica69,19174,27350,74823,11966.652,62641,46322,79867.1
K. borealis24,39230,81439,83561,206−150.948,42933,65641,009−68.1
G. rugosa60,73052,51841,88719,25668.335,12334,41131,95947.4
L. catesbeianus28,52362,43637,98627,0675.140,26355,54142,311−48.3
P. chosenicus10,9014298298200081.7325541216898.5
P. nigromaculatus65,55171,35849,65828,64856.357,88144,83119,90269.6
R. coreana47,79133,67517,12815,42067.728,21525,81516,61765.2
Group 2B. gargarizans65,14462,37041,38121,36867.246,99848,26824,26862.7
B. orientalis56,56147,63430,044252995.525,42730,774335494.1
H. leechii68,67338,85822,71111,74782.924,29931,16015,45277.5
H. quelpaertensis1585142788815104.71343253122023.0
R. uenoi66,41913,3699417226196.613,1307152235696.5
Group 3B. stejnegeri17,16016,158428826598.5391614485999.7
O. koreanus21,3519675519333098.54920295311899.4
K. koreana45,62776,57684,13087,674−92.279,89678,03587,252−91.2
R. huanrenensis31,06113,481660067097.864663026122896.0
Total area100,411 a
a Source: Ministry of Land Infrastructure and Transport, Republic of Korea, 2018. * PHL: Potential habitat loss rate = (current–2080)/current × 100. The minus values of this estimation indicate increasing the potential habitat by 2080.
Table 5. Basic statistics for the species richness of amphibians for different habitat characteristics in South Korea.
RCPYearAllGroup 1Group 2Group 3
AvgMaxAvgMaxAvgMaxAvgMax
Current7.3312.002.606.003.485.001.254.00
4.520306.1914.002.946.002.015.001.234.00
20504.7114.002.286.001.395.001.044.00
20803.7112.002.356.000.455.000.924.00
8.520305.0113.002.696.001.315.001.024.00
20505.0013.002.926.001.195.000.884.00
20804.3011.002.796.000.65.000.914.00
Table 6. Areas of the species richness classes of amphibians in South Korea from different habitat groups (unit: km2).
Habitat RCP4.5RCP8.5
GroupsSR * ClassesCurrent203020502080203020502080
Low (0–1)23,48915,97034,57251,23129,34833,02652,852
Group 1Mid (2–4)44,82352,09448,35135,38147,41848,40934,879
High (5~7)27,80228,22013,361967219,50514,8388542
Low (0–1)22,60441,11362,64289,06663,93059,26686,693
Group 2Mid (2–3)36,56849,69229,856709827,61433,6049359
High (4~5)36,9425479378612047273403221
Low (0–1)65,25972,32486,18795,31786,13792,28095,001
Group 3Mid (2–3)25,86619,7009125909945836251262
High (4)498942609725867636810
AllLow (0–4)13,78522,24150,03773,82743,61649,58670,203
Mid (5–8)68,19067,06944,22421,99650,80345,50625,945
High (9~14)14,1396974202346118521181125
* SR: Species Richness.
Publisher’s Note: MDPI stays neutral with regard to jurisdictional claims in published maps and institutional affiliations.

