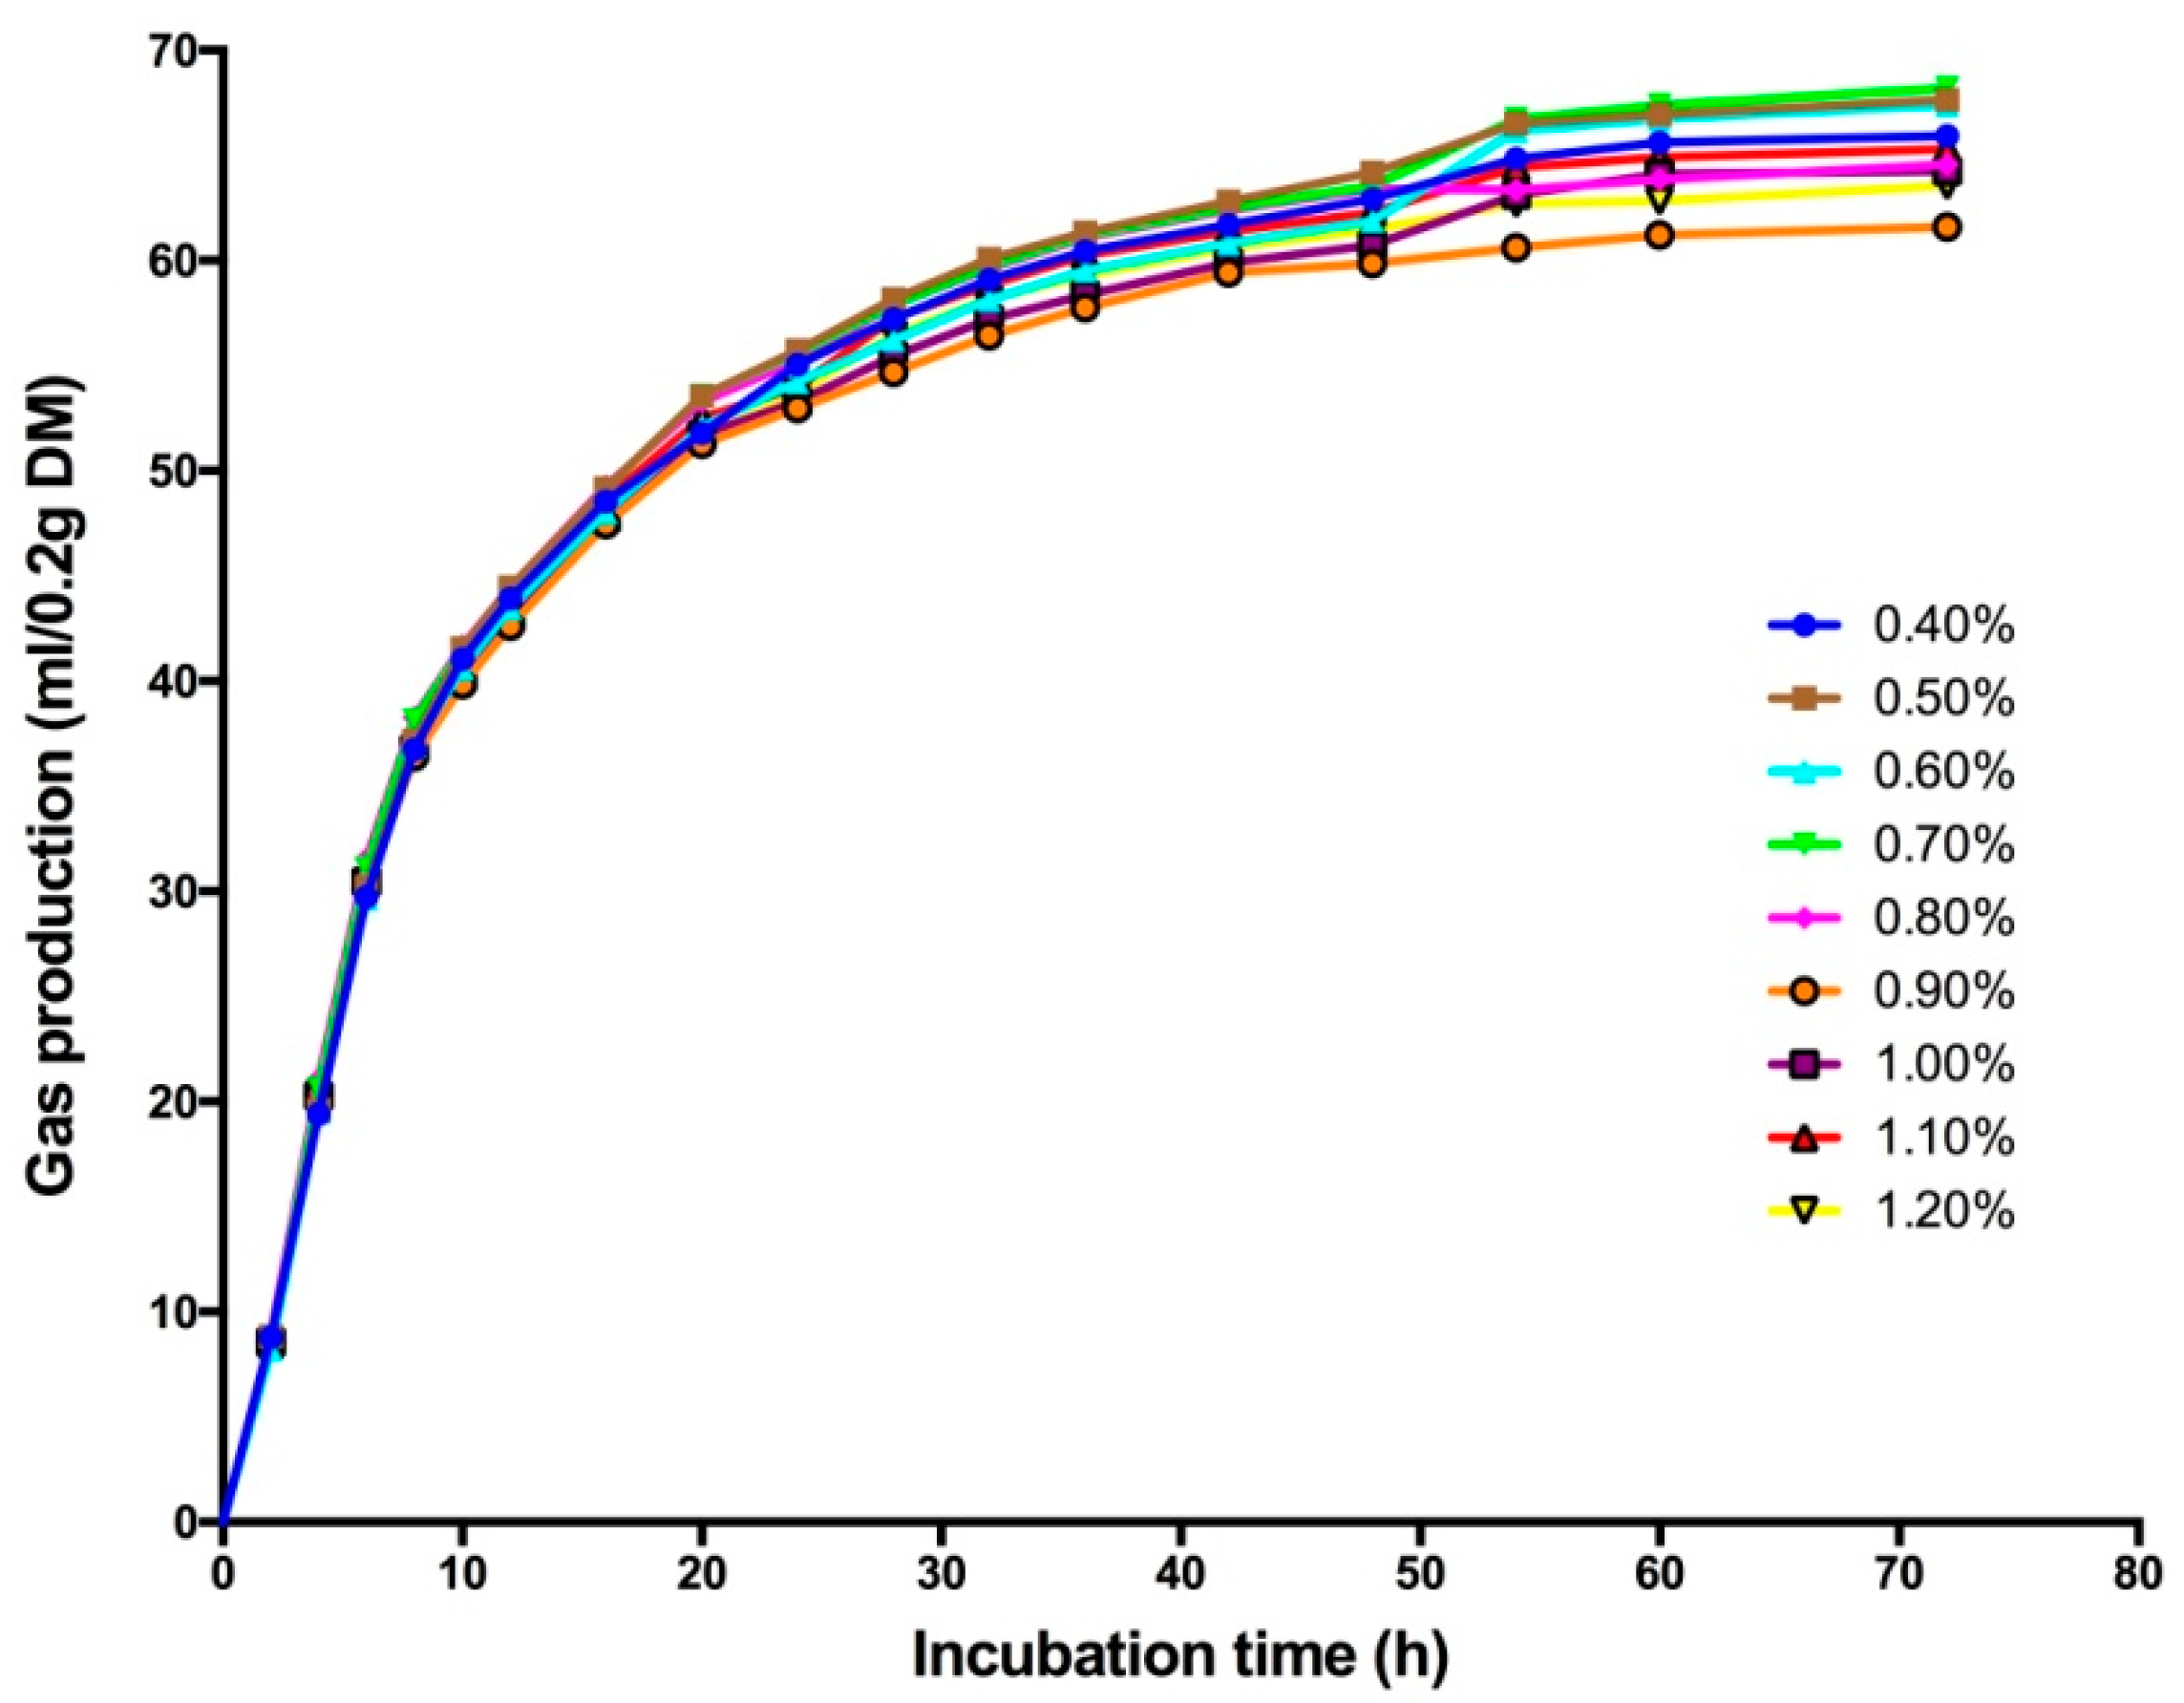
Figure 1.
Dynamic changes in the gas production of in vitro ruminal fermentation.
Figure 1.
Dynamic changes in the gas production of in vitro ruminal fermentation.
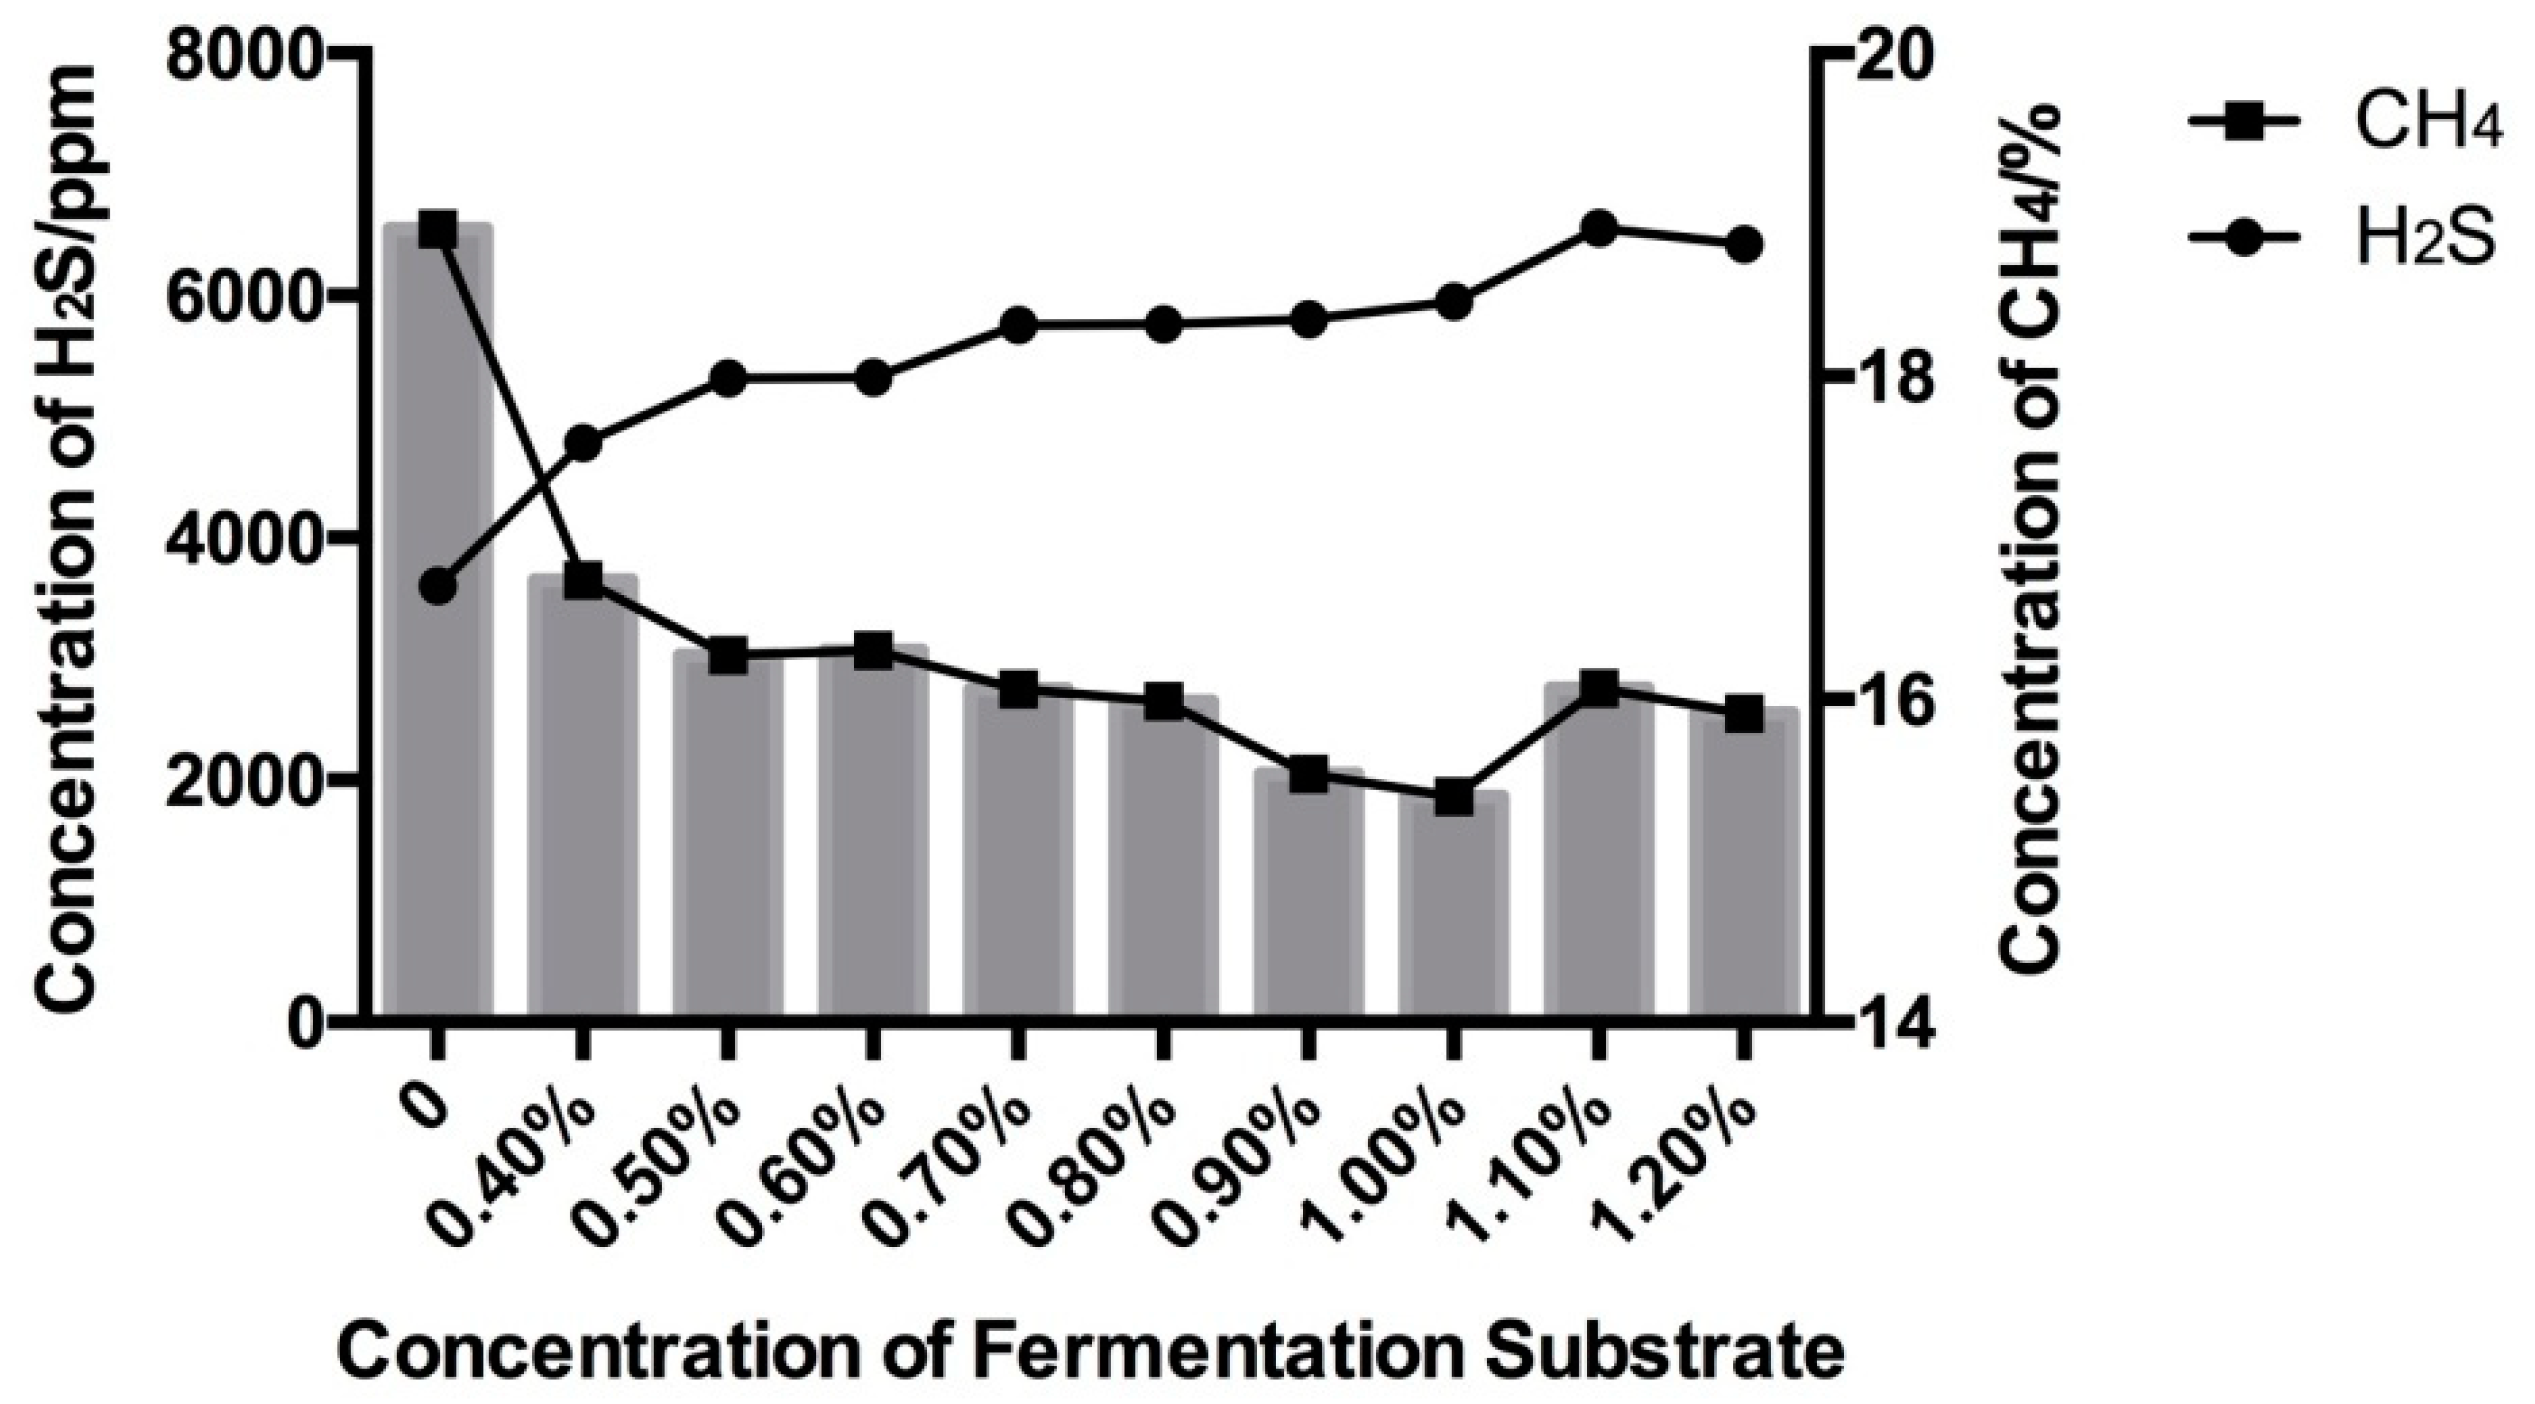
Figure 2.
Gas content of in vitro fermentation of substrate with different levels of sulfate.
Figure 2.
Gas content of in vitro fermentation of substrate with different levels of sulfate.
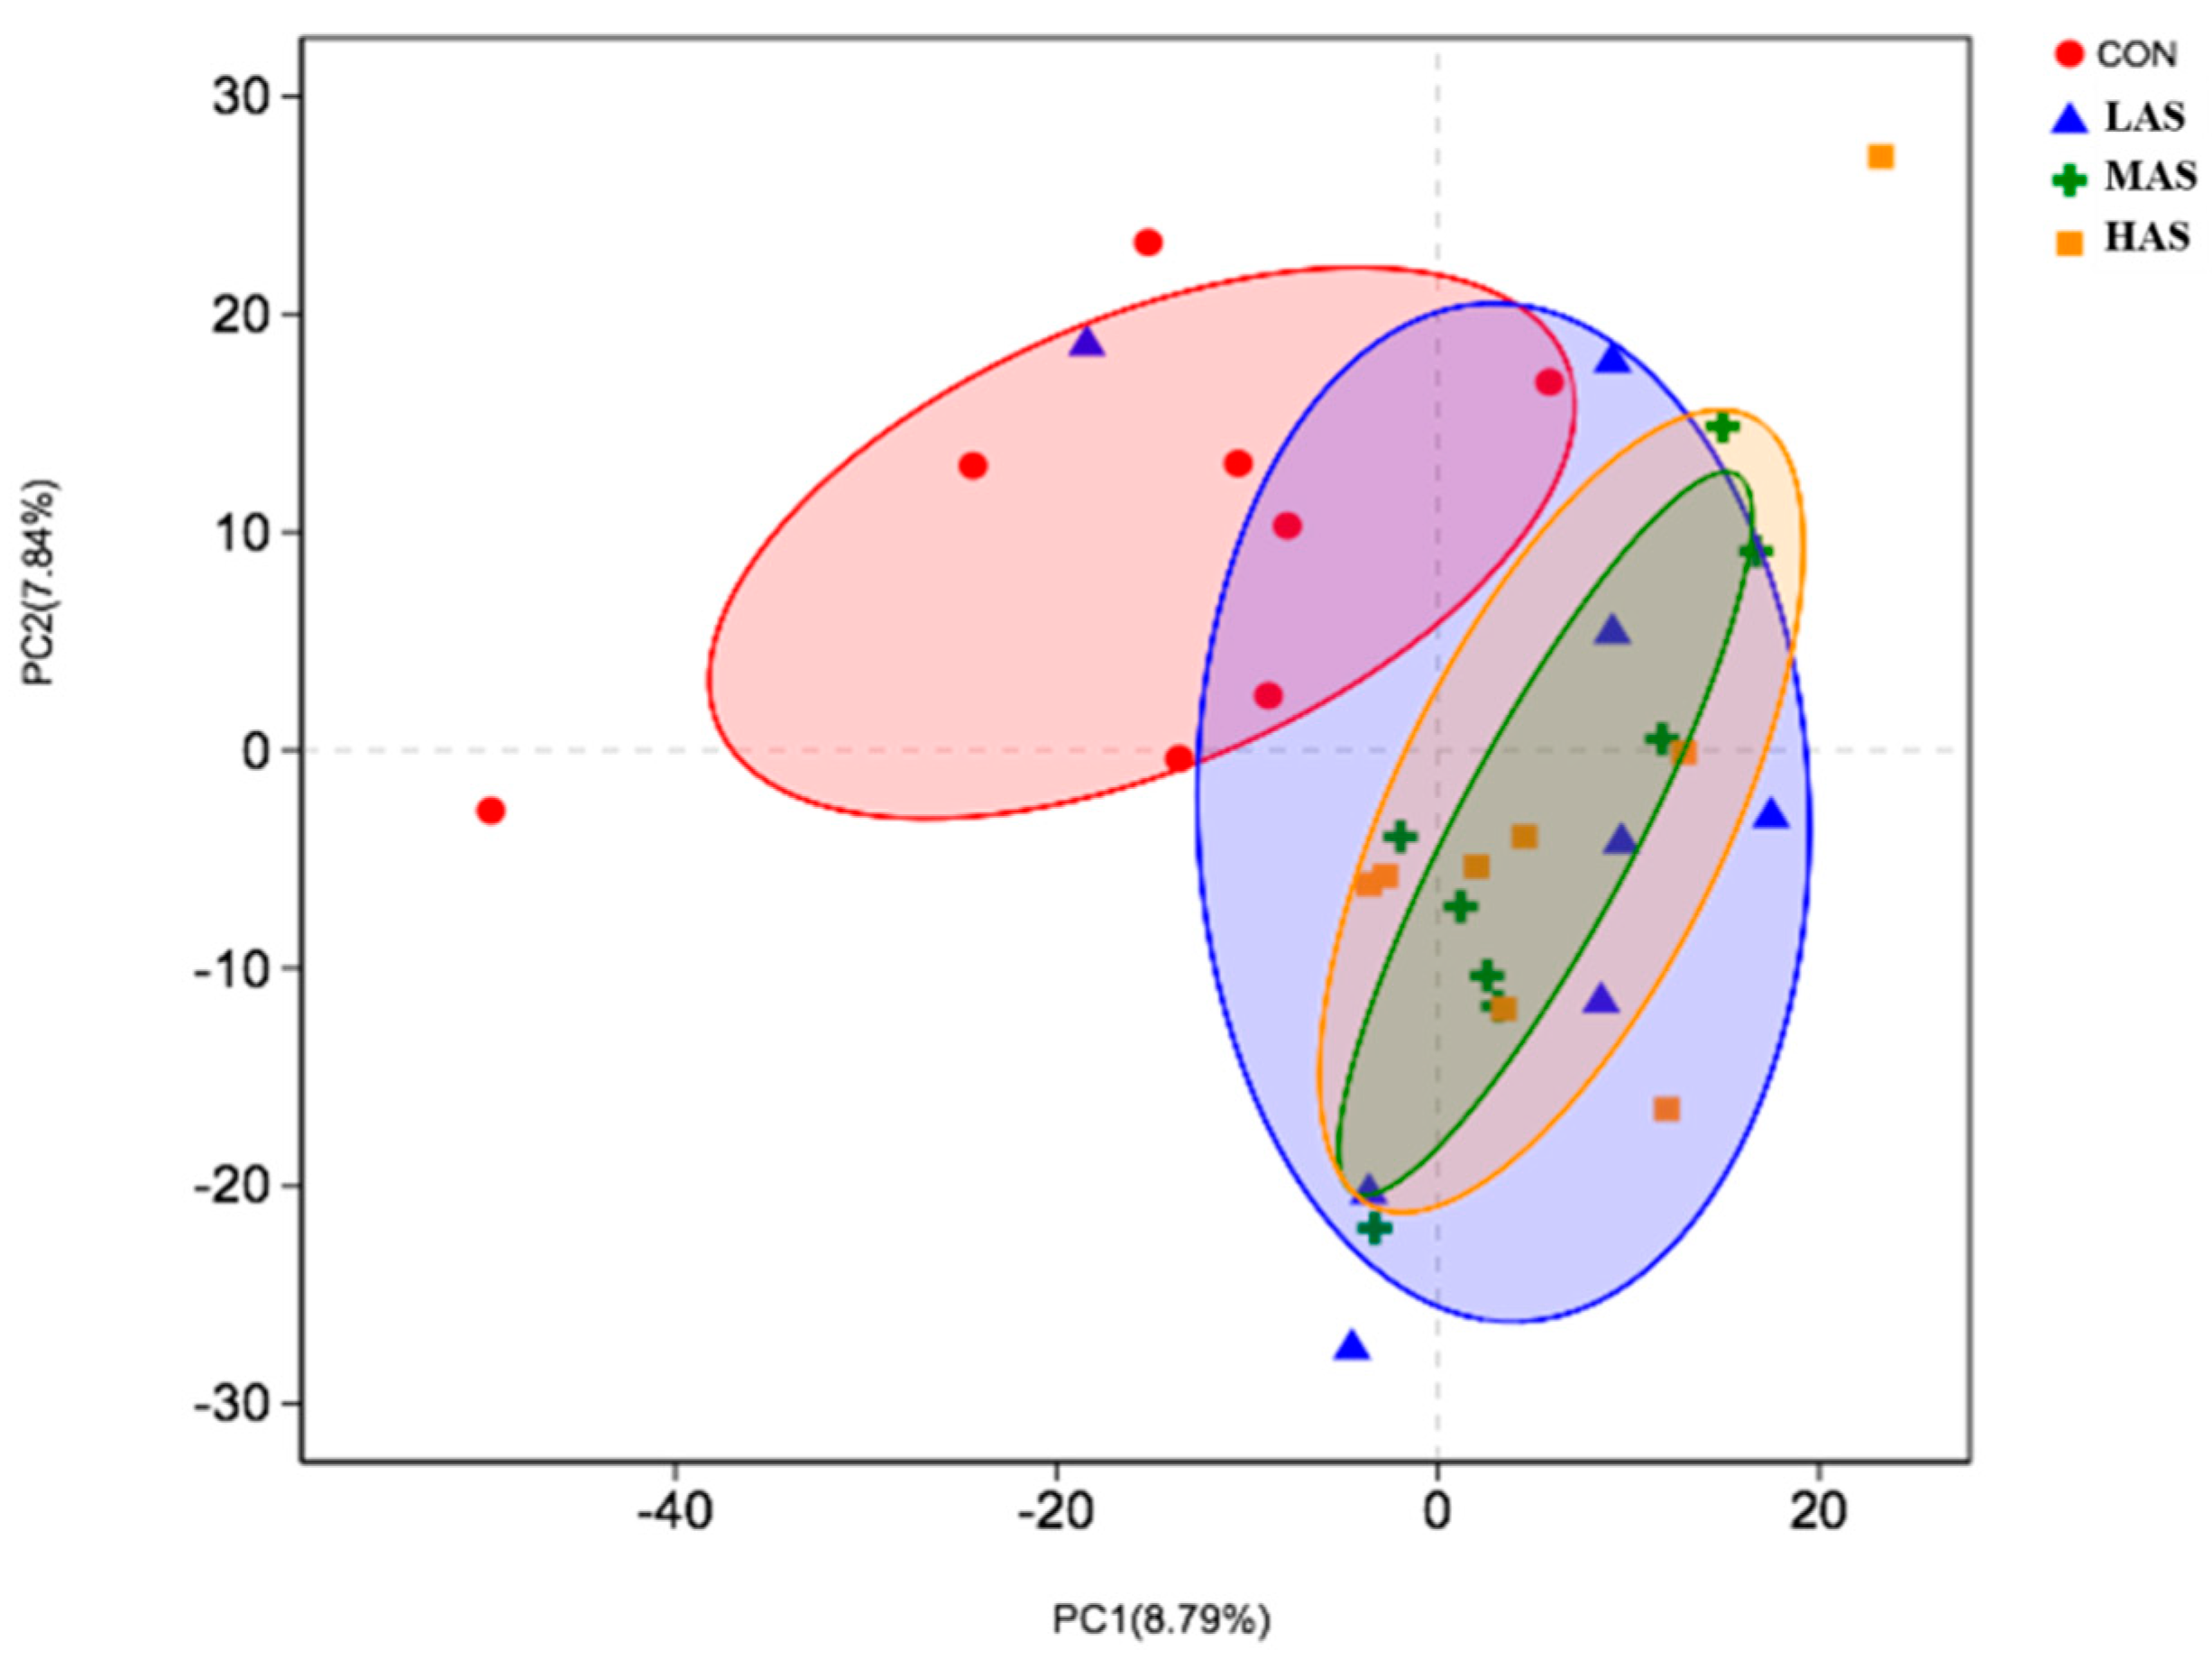
Figure 3.
Principal component analysis of bacterial communities in different groups. CON-S (%DM) 0.4%; LAS-S (%DM) 0.6%; MAS-S (%DM) 0.8%; HAS-S (%DM) 1.0%.
Figure 3.
Principal component analysis of bacterial communities in different groups. CON-S (%DM) 0.4%; LAS-S (%DM) 0.6%; MAS-S (%DM) 0.8%; HAS-S (%DM) 1.0%.
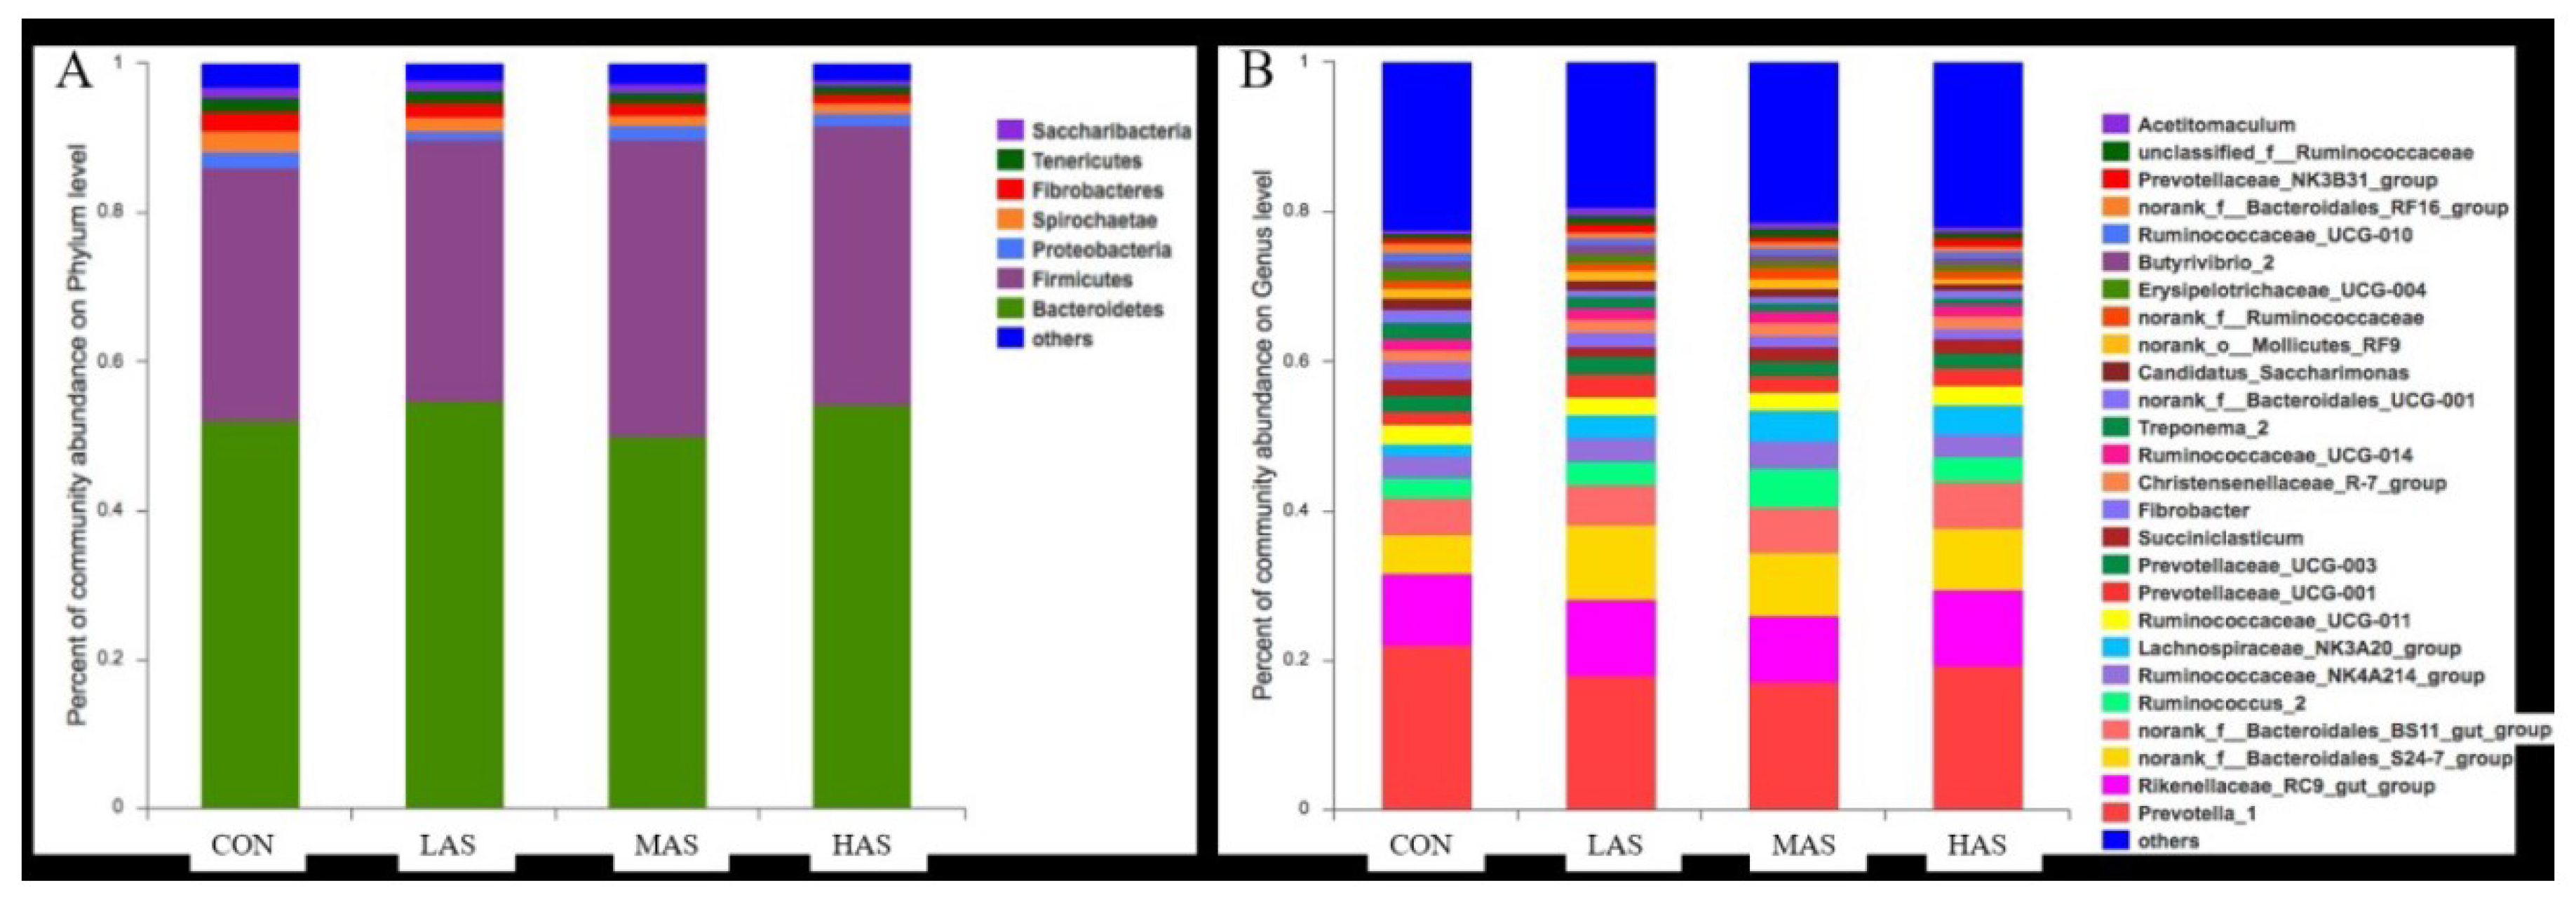
Figure 4.
Comparison of the relative abundance of bacterial communities in the phylum (A) and genus (B) level.
Figure 4.
Comparison of the relative abundance of bacterial communities in the phylum (A) and genus (B) level.
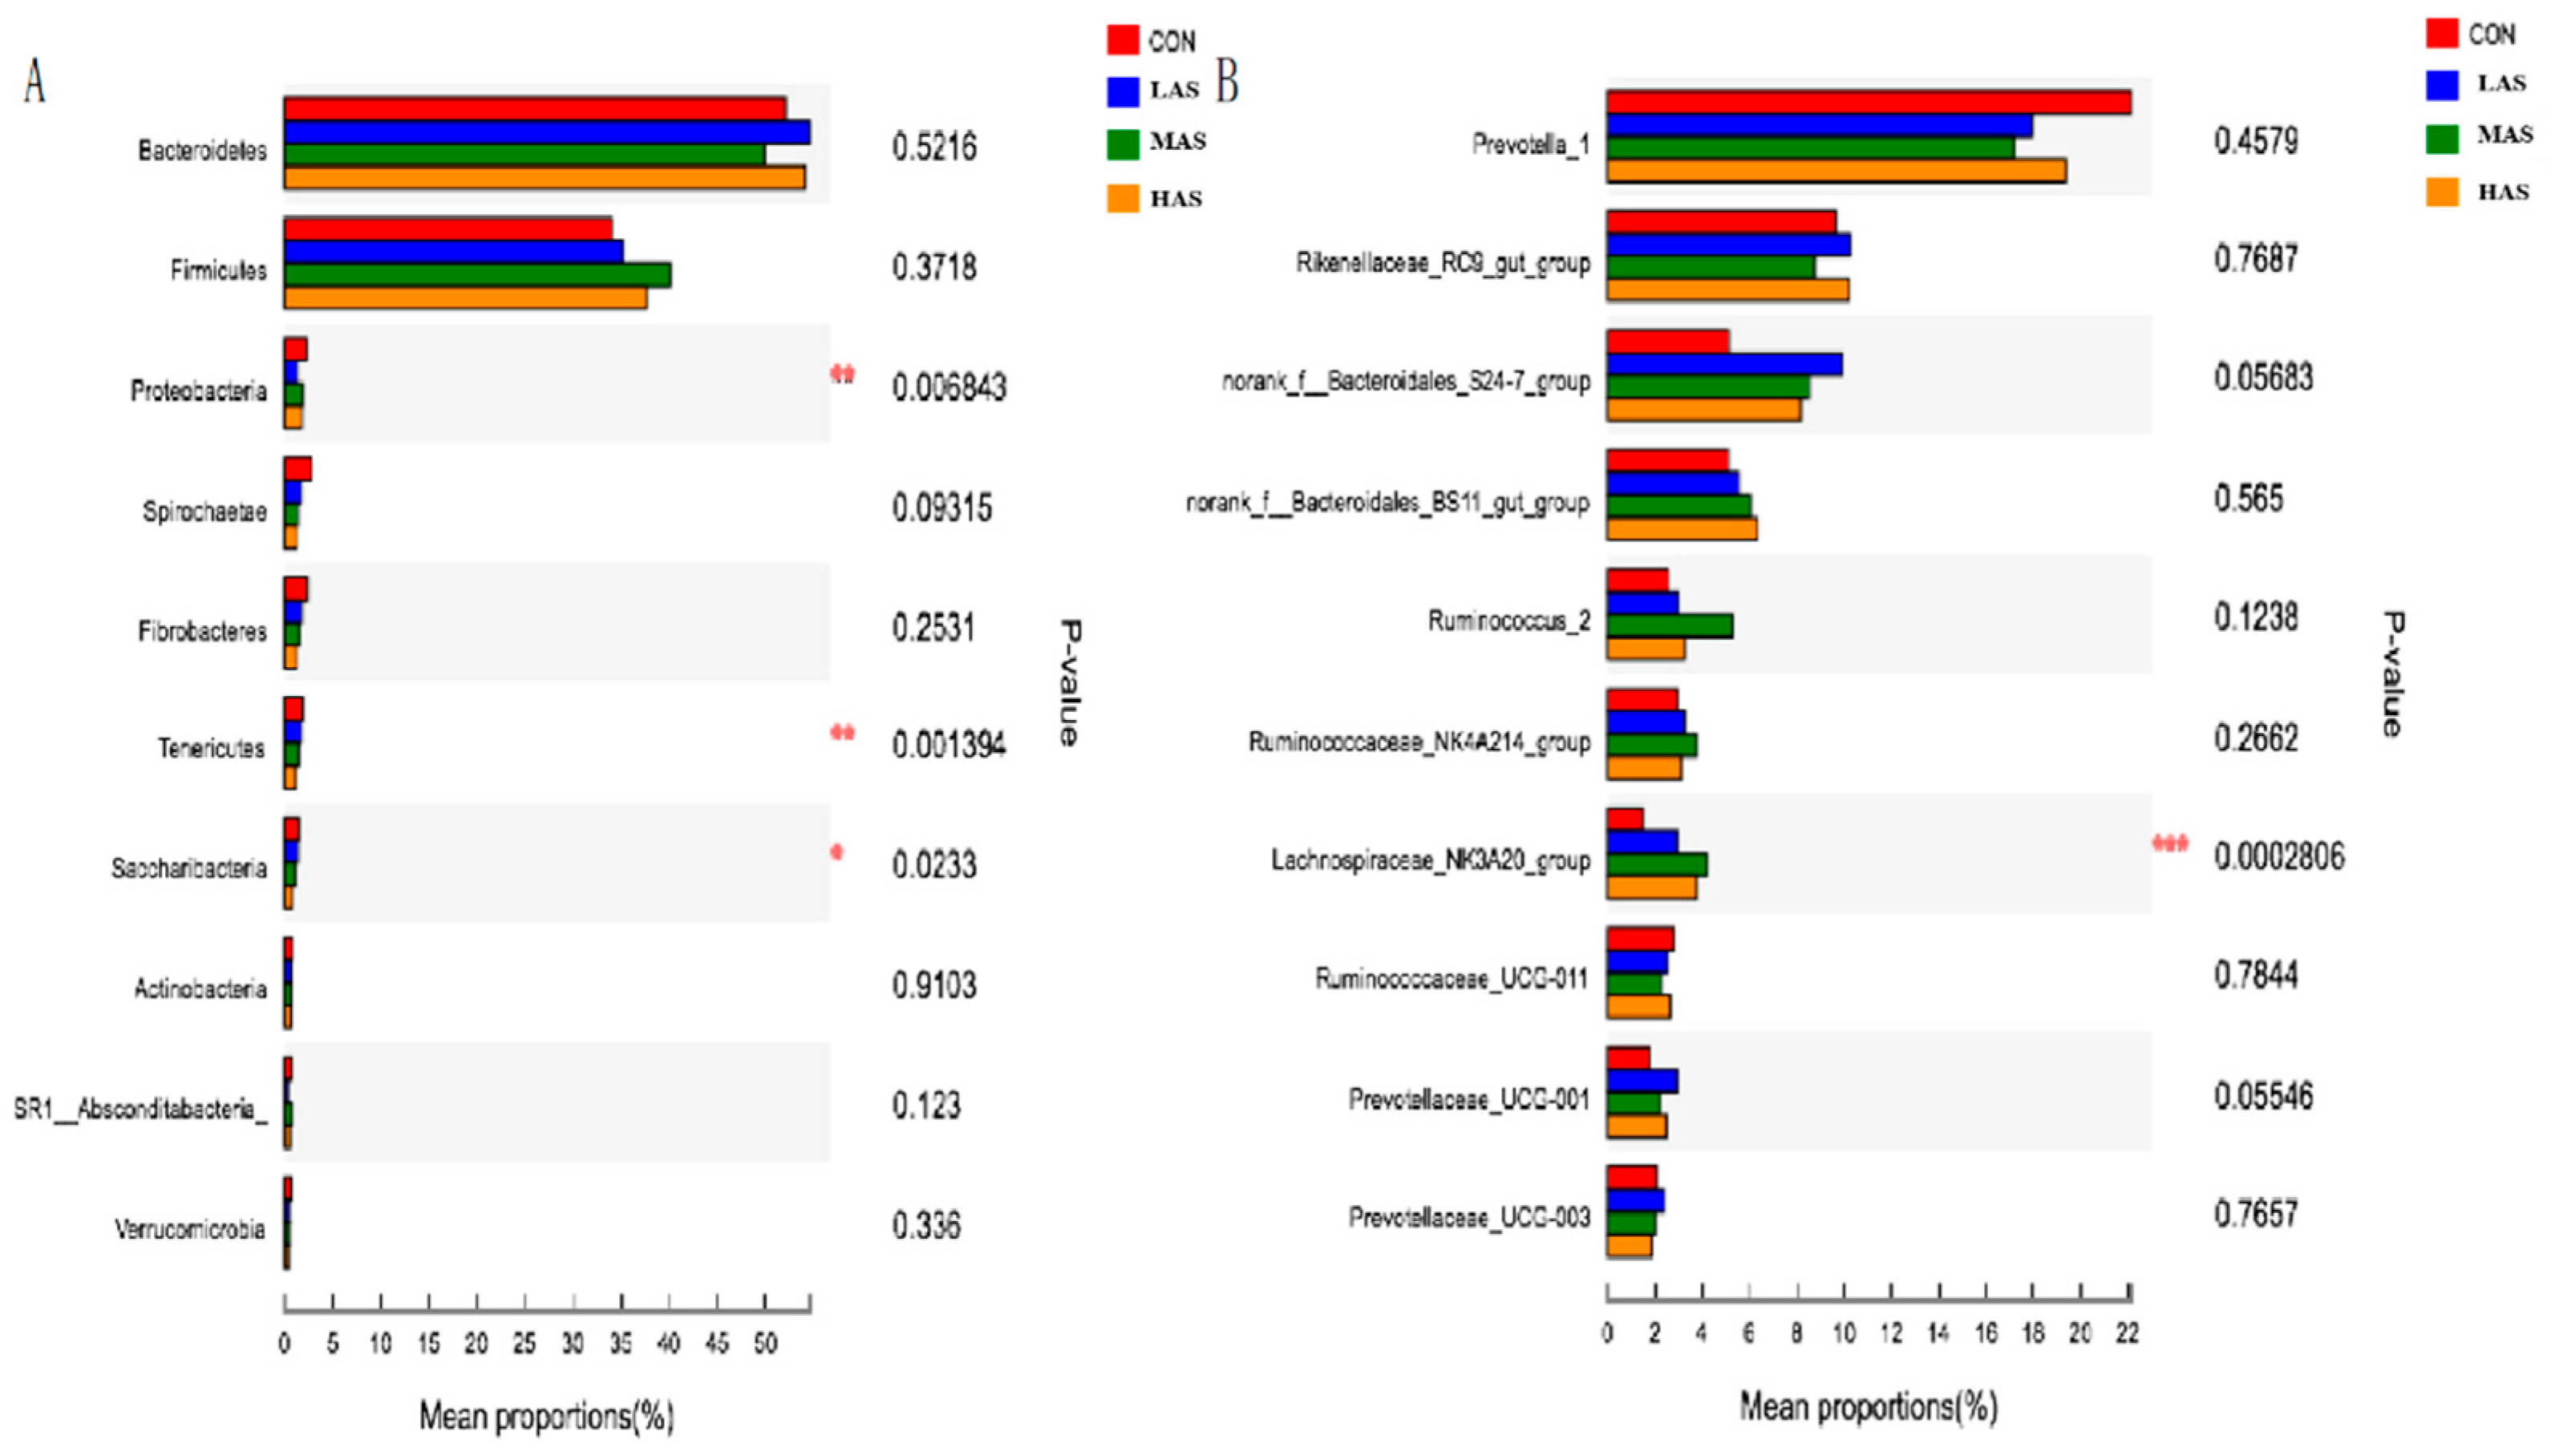
Figure 5.
Difference test of bacterial communities in the phylum (A) and genus (B) level in different groups. CON-S (%DM) 0.4%; LAS-S (%DM) 0.6%; MAS-S (%DM) 0.8%; HAS-S (%DM) 1.0%. Asterisk means significant difference between treatments.
Figure 5.
Difference test of bacterial communities in the phylum (A) and genus (B) level in different groups. CON-S (%DM) 0.4%; LAS-S (%DM) 0.6%; MAS-S (%DM) 0.8%; HAS-S (%DM) 1.0%. Asterisk means significant difference between treatments.
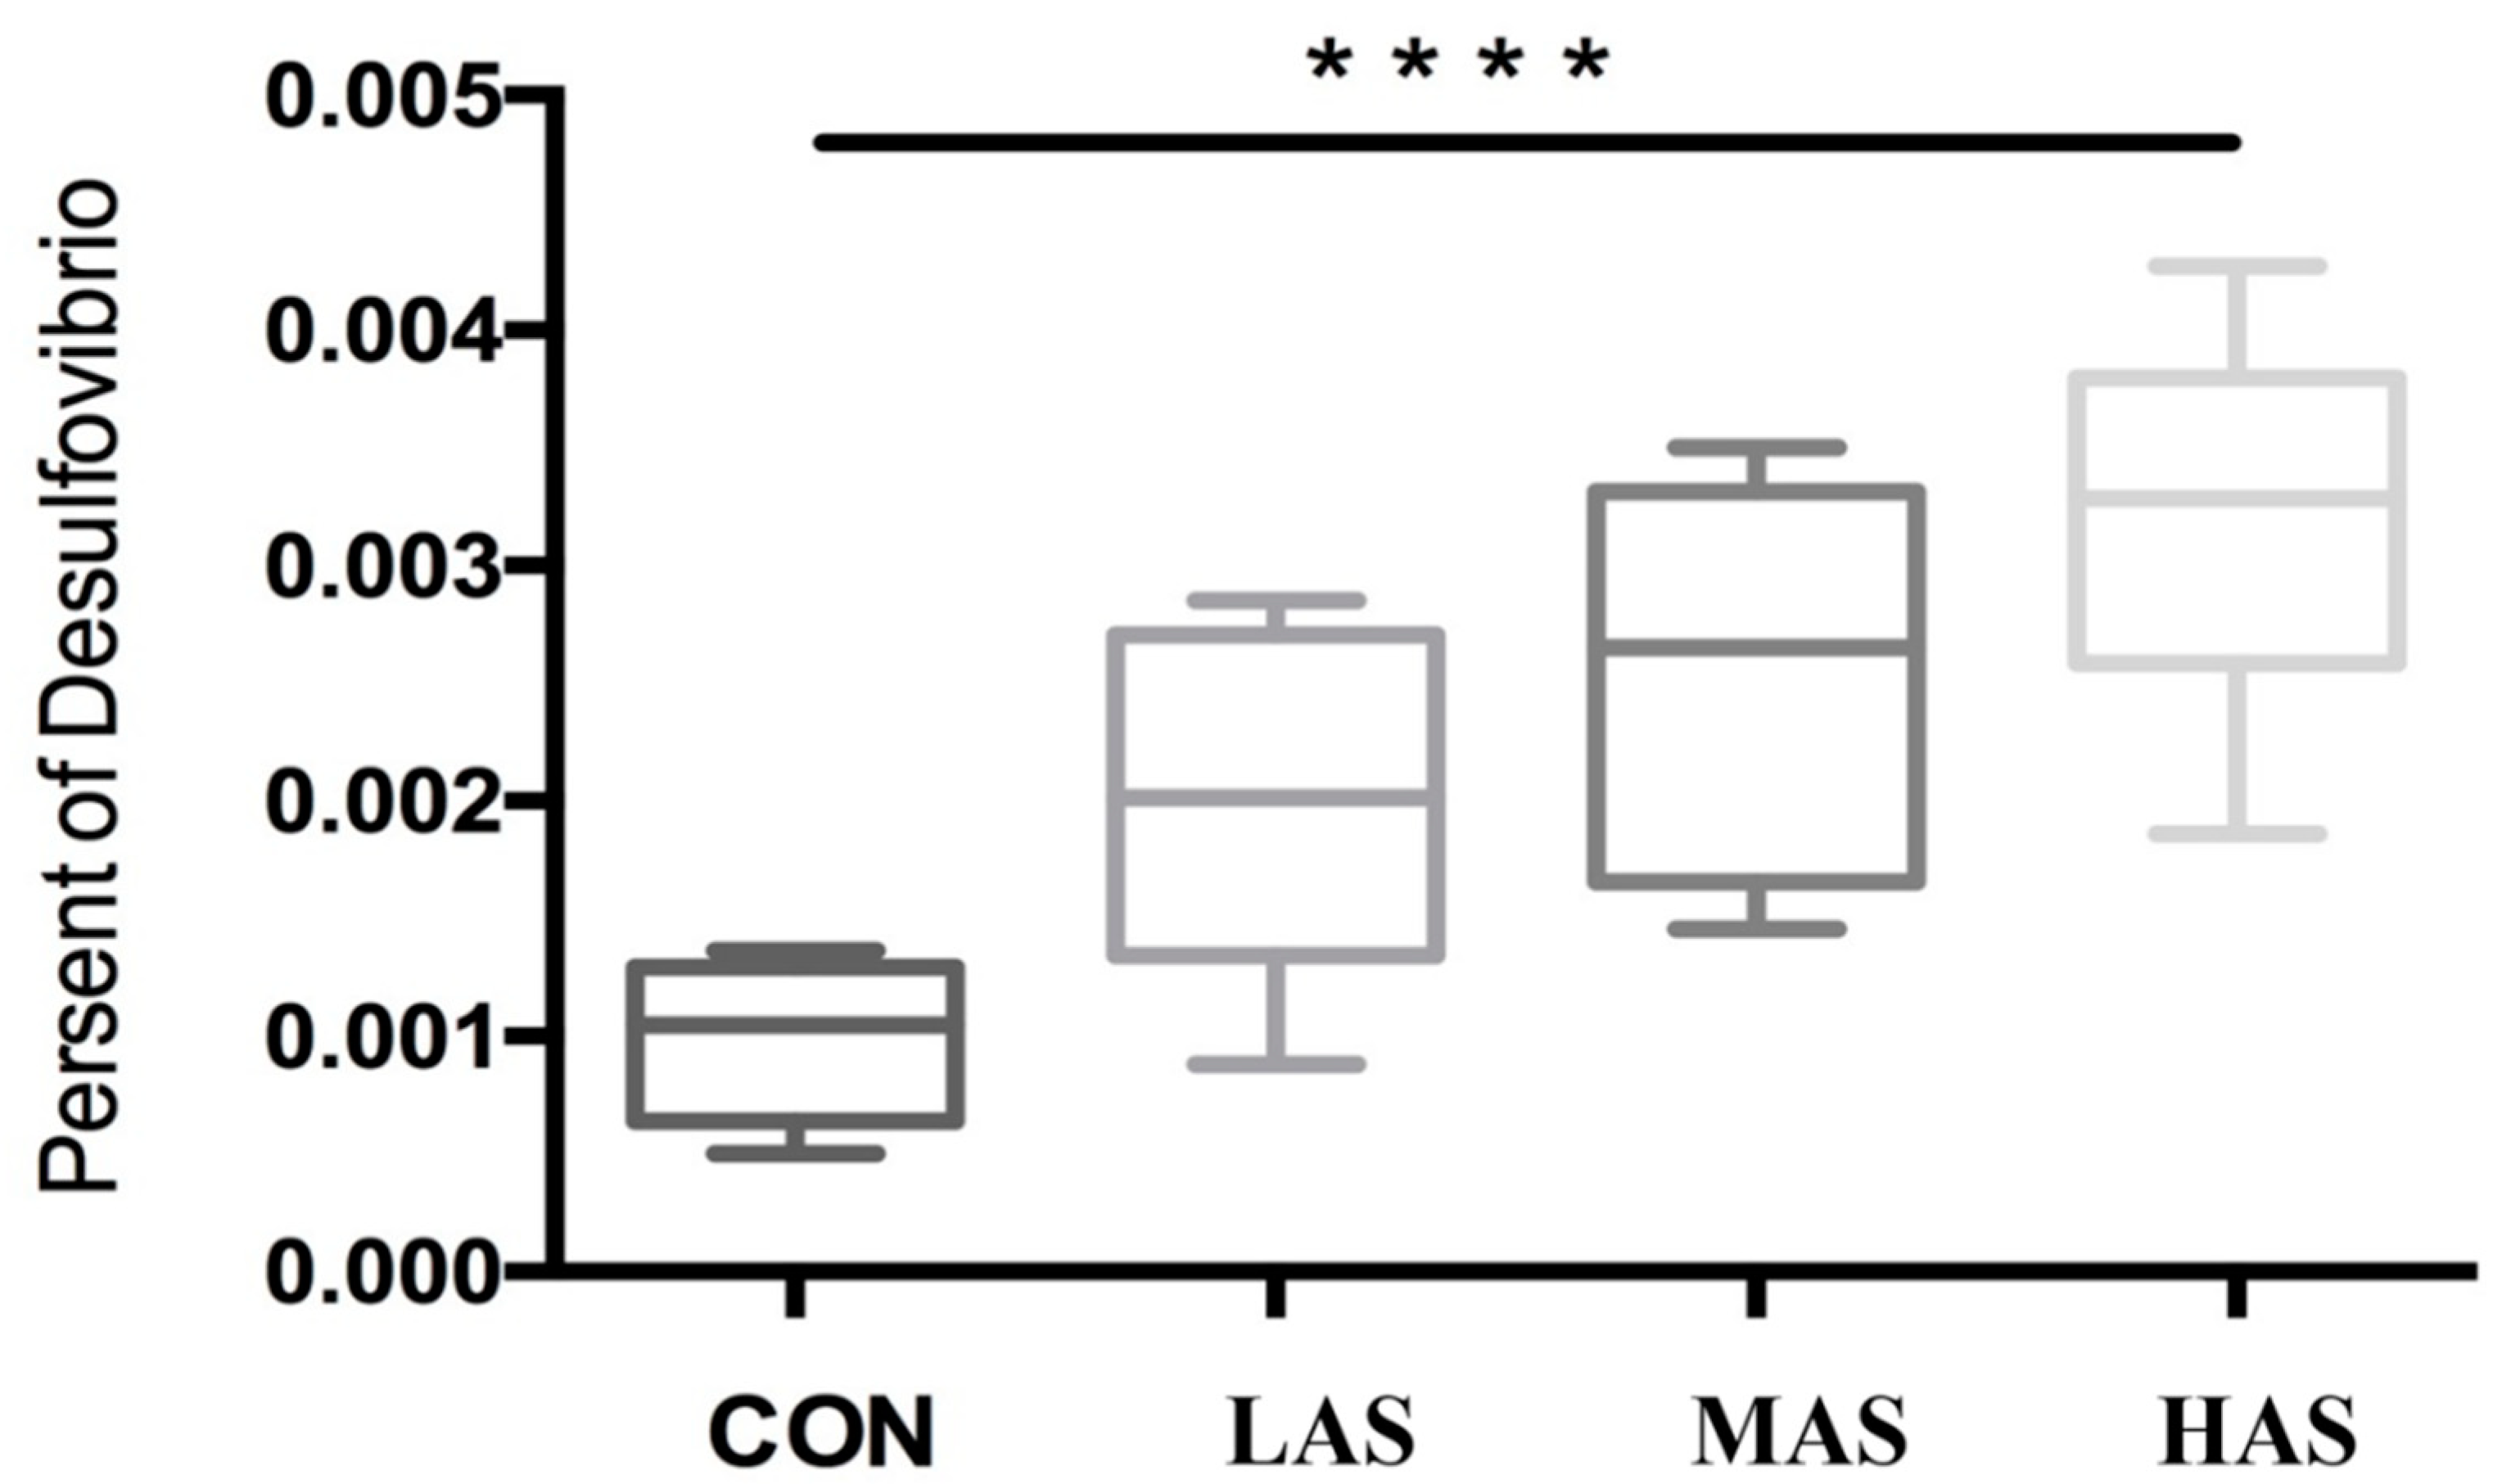
Figure 6.
Present of Desulfovibrio in rumen samples. CON-S (%DM) 0.4%; LAS-S (%DM) 0.6%; MAS-S (%DM) 0.8%; HAS-S (%DM) 1.0%. Asterisks mean significant difference between CON and HAS groups.
Figure 6.
Present of Desulfovibrio in rumen samples. CON-S (%DM) 0.4%; LAS-S (%DM) 0.6%; MAS-S (%DM) 0.8%; HAS-S (%DM) 1.0%. Asterisks mean significant difference between CON and HAS groups.
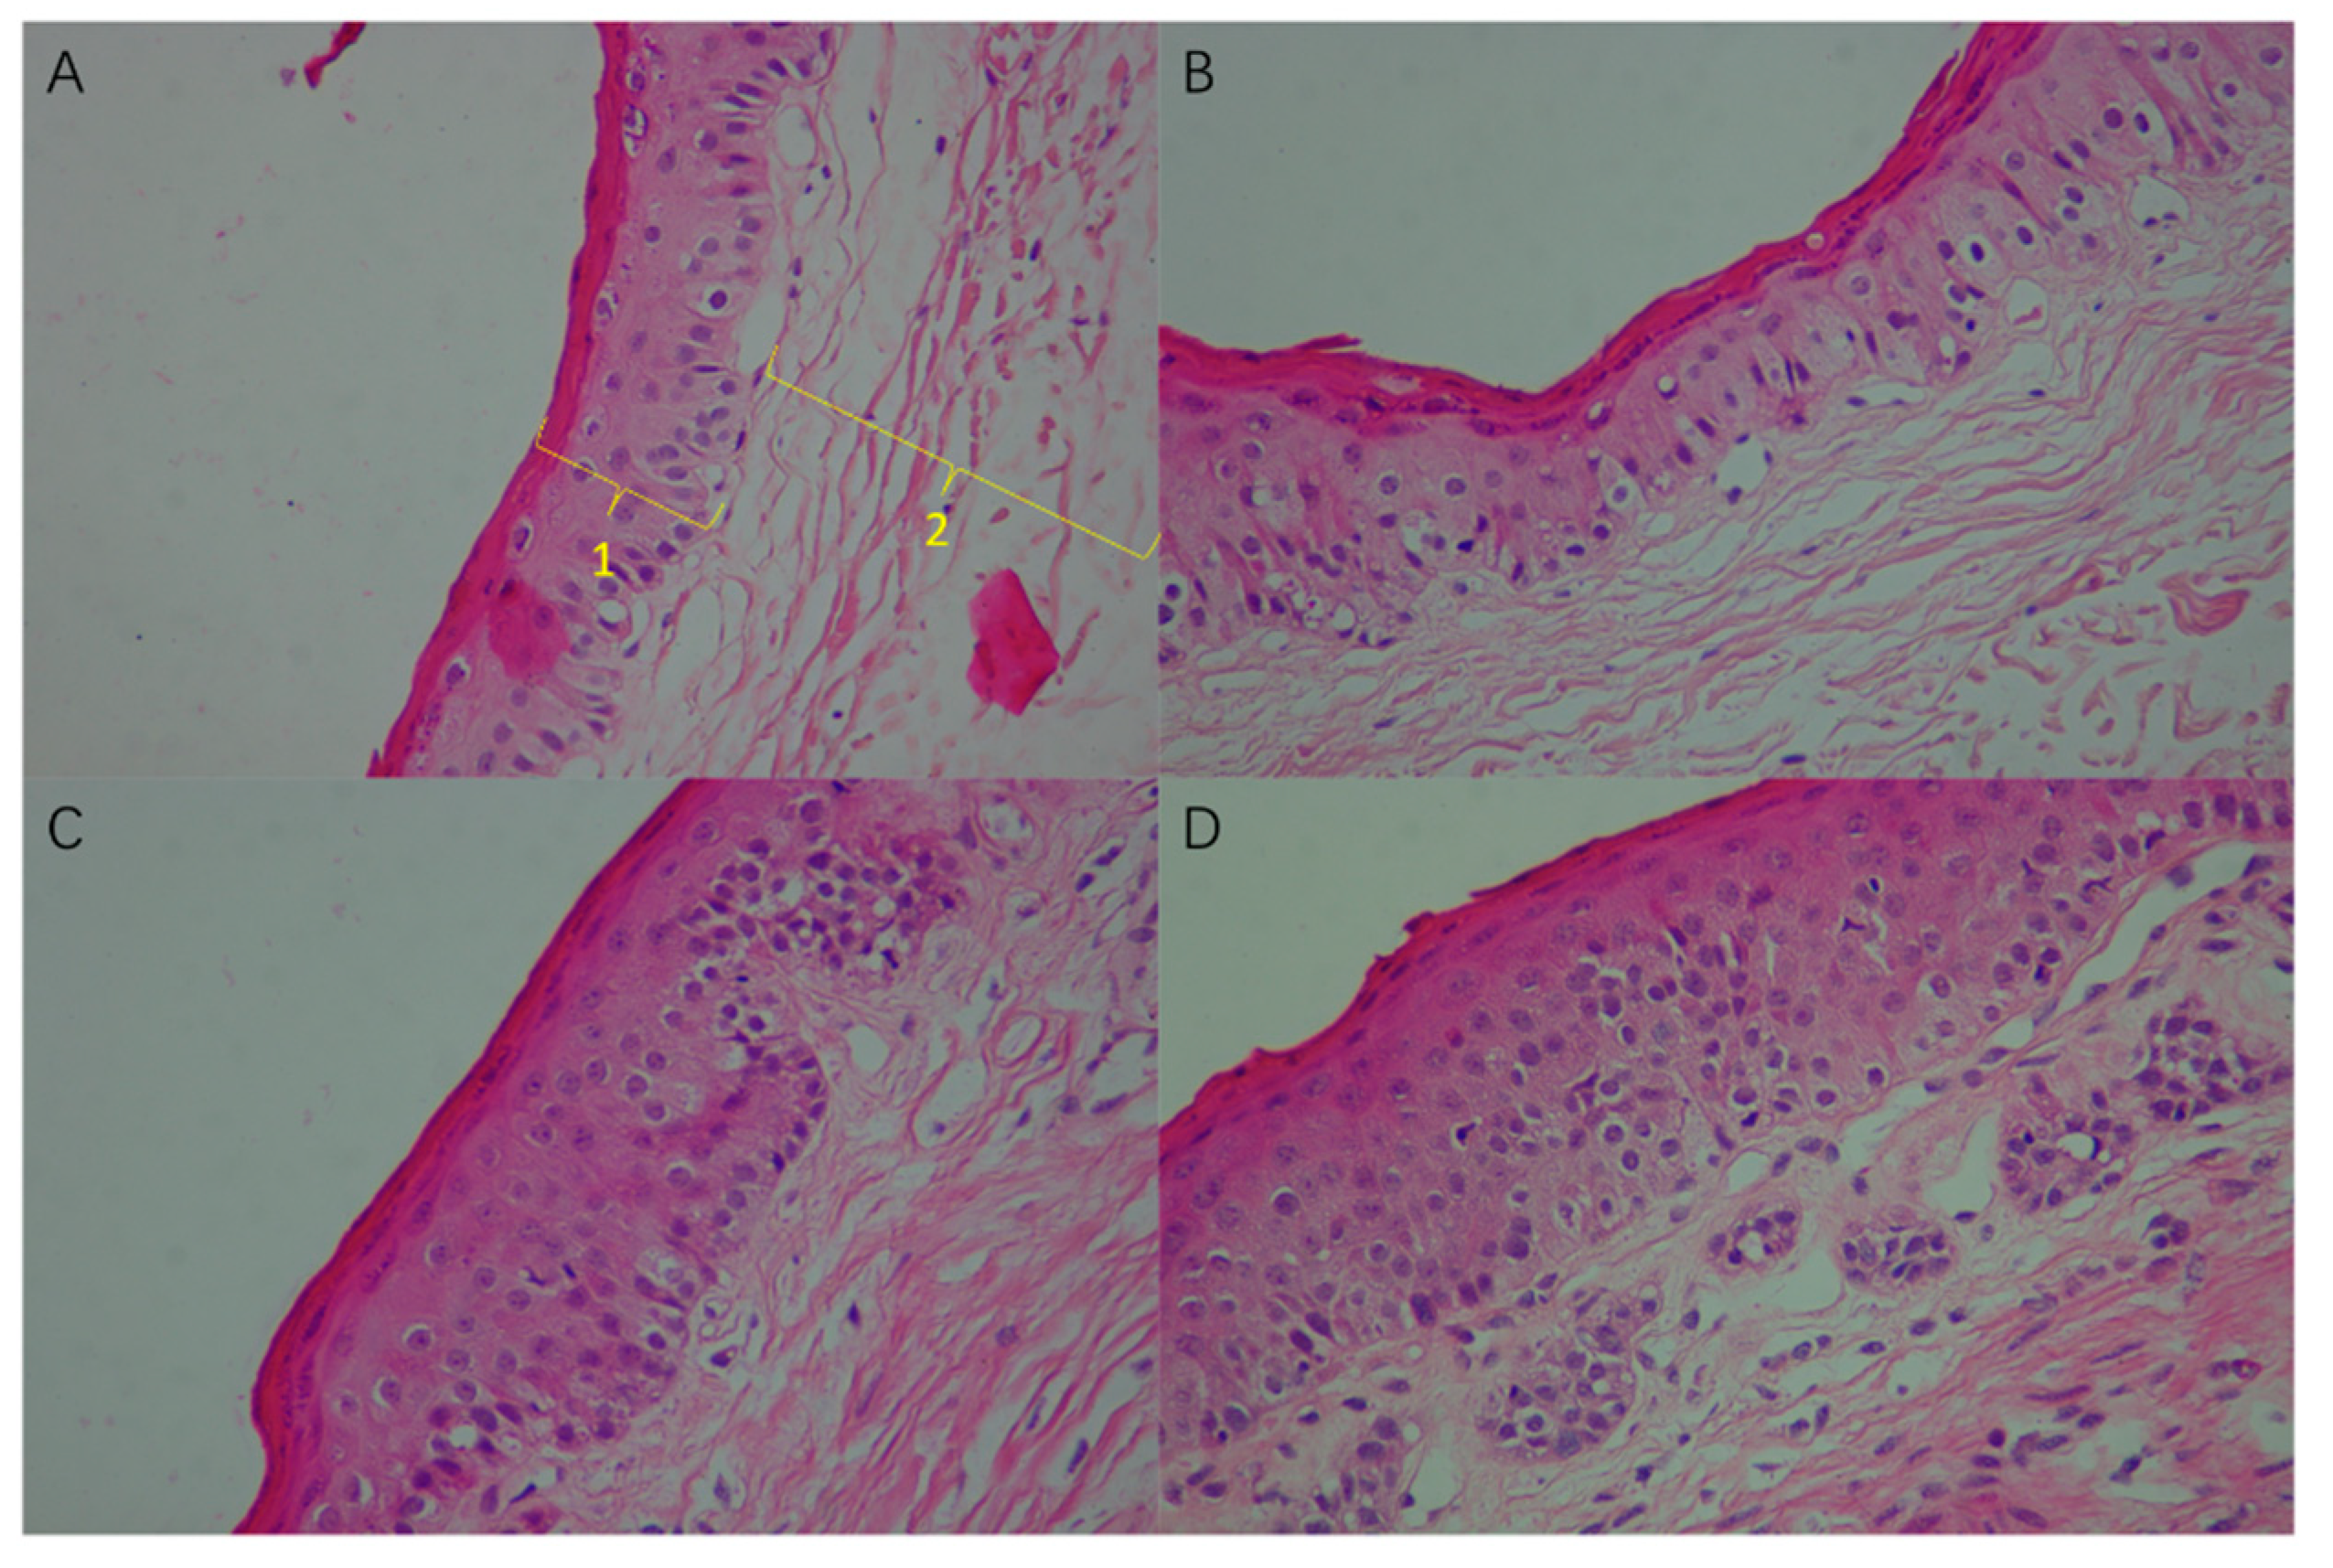
Figure 7.
Effect of high sulfur diet on the morphology of rumen papilla (4 × 10 multiple microscope). (A), CON group; (B), LAS group; (C), MAS group; (D), HAS group. Epithelium cells (the black spots and red edge) arranged orderly (A,B) but became messy (C,D) with the increasing sulfur addition levels, which lead to increase the length of the epithelium. 1, cuticle and granular layer; 2, spinous layer and basal layer.
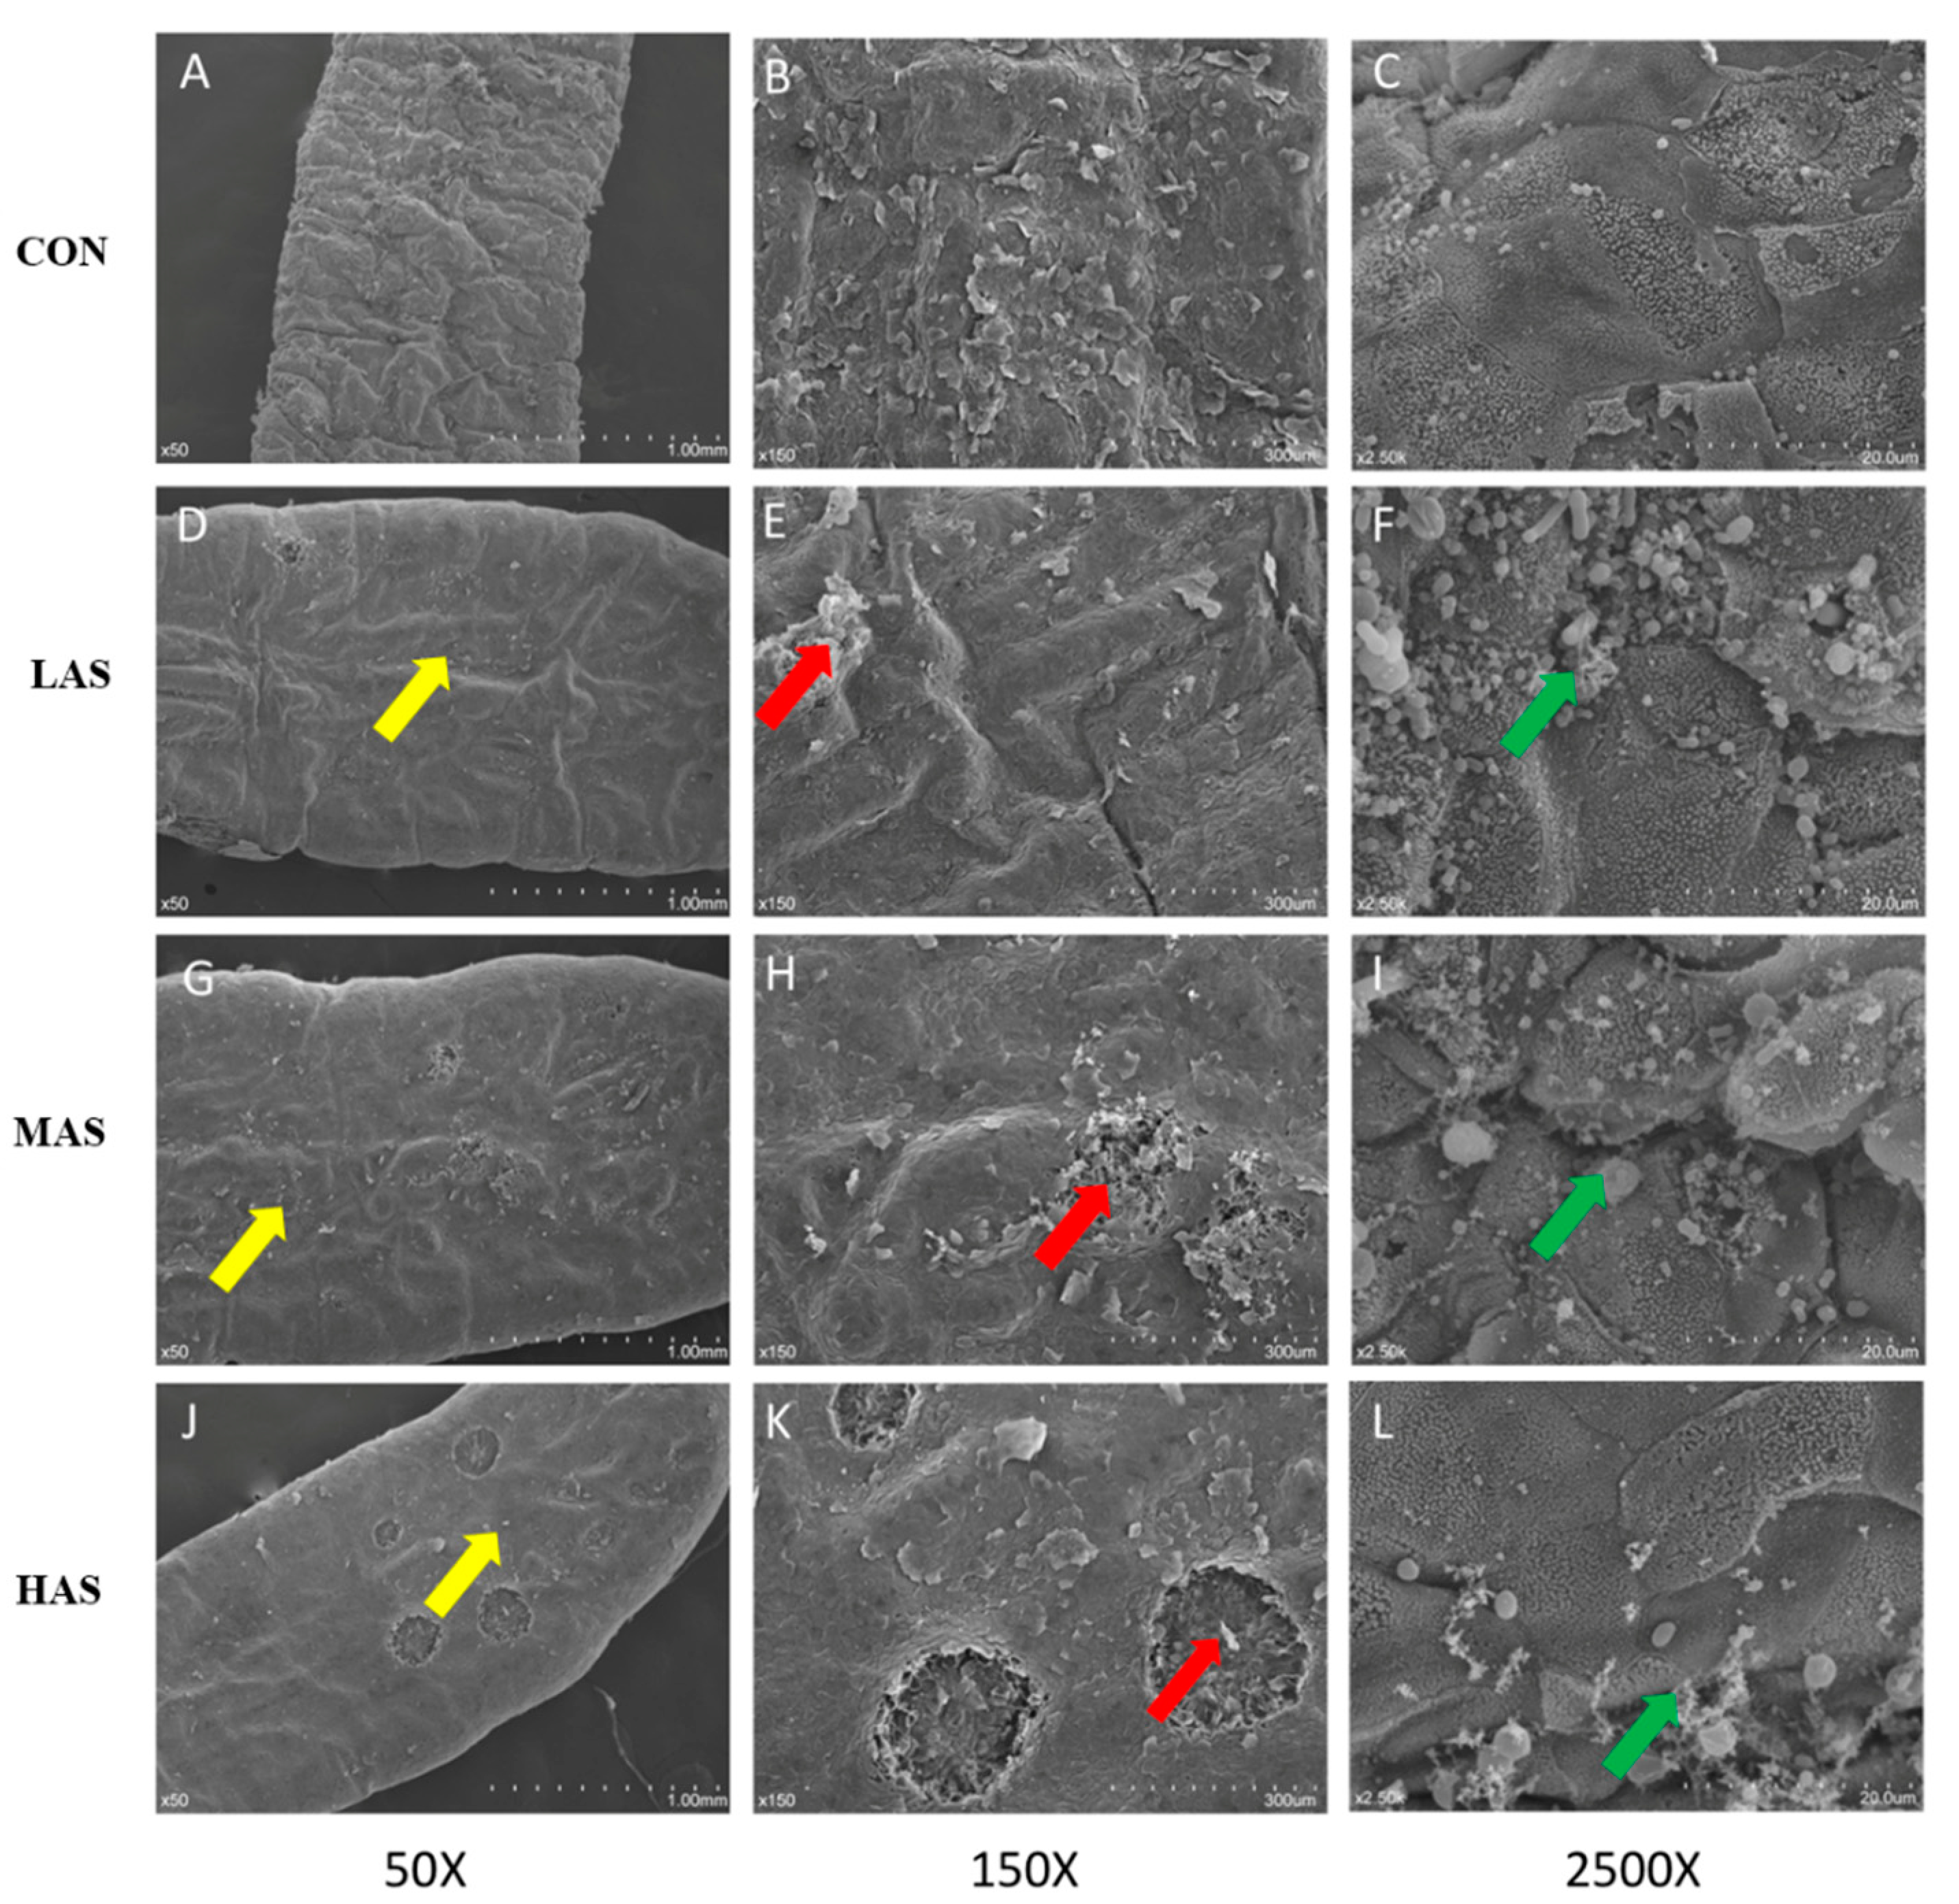
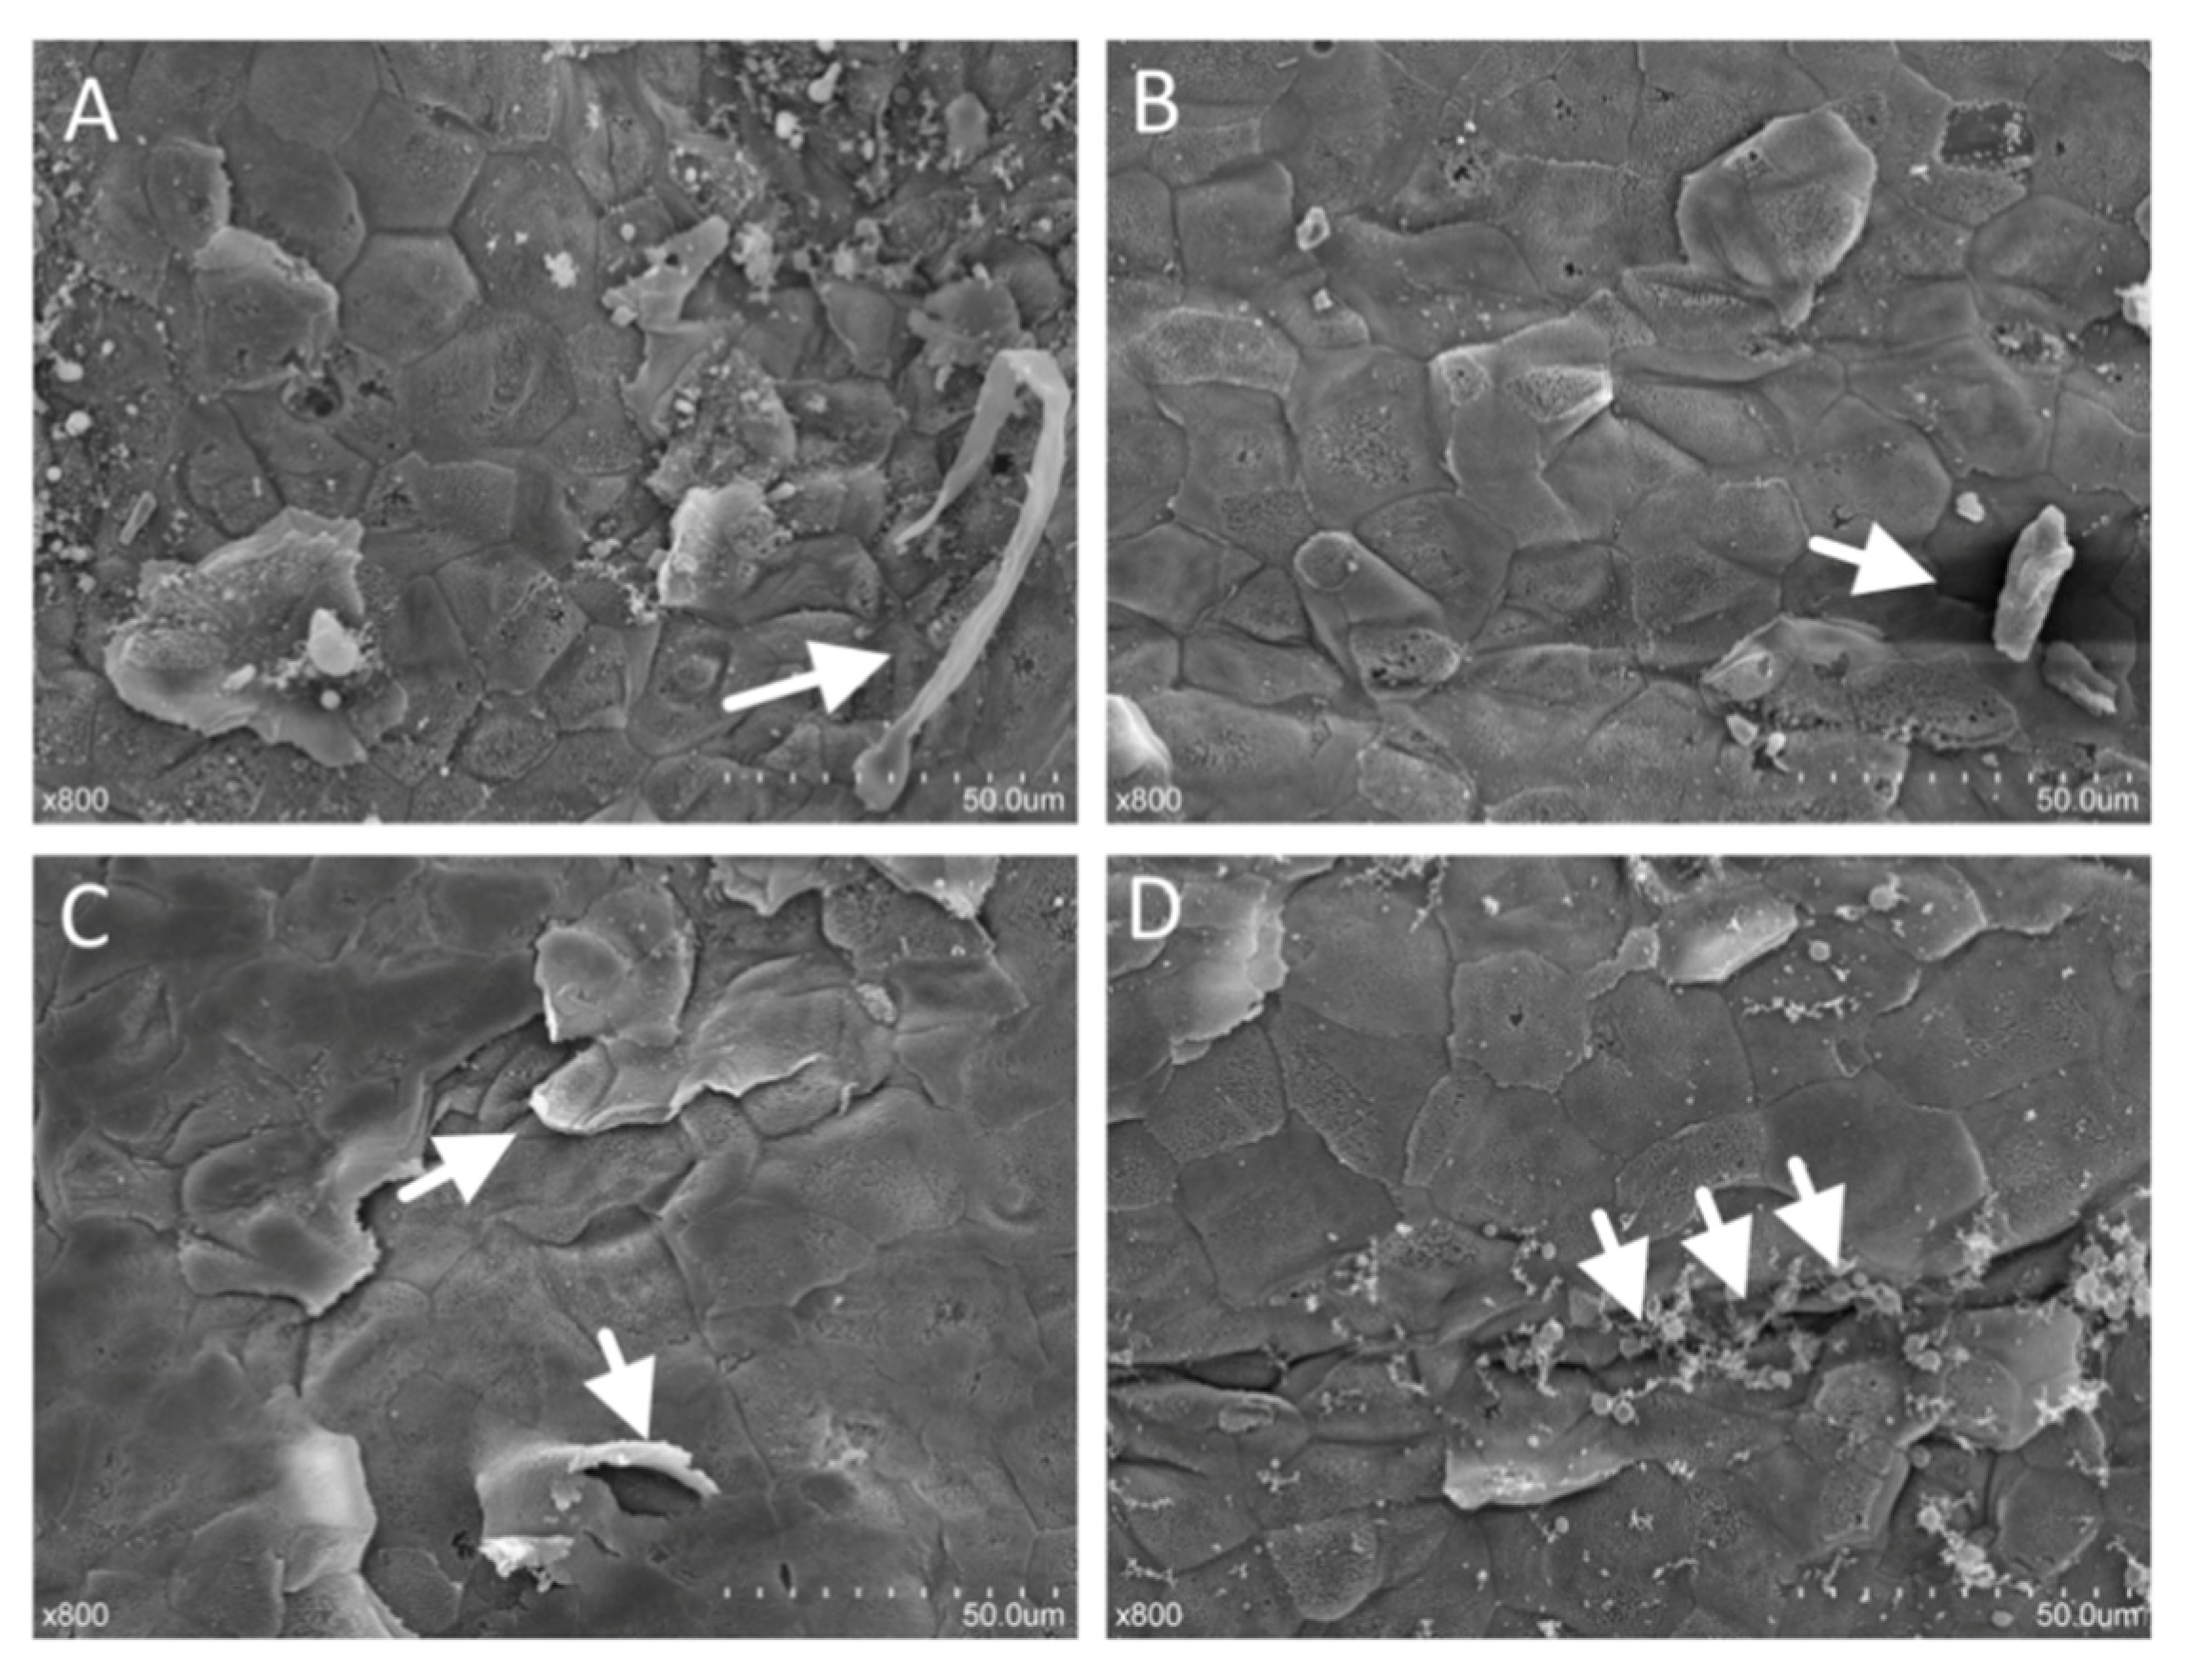
Figure 8.
Scanning electron microscopy of papillae surface of different groups. CON-S (%DM) 0.4%; LAS-S (%DM) 0.6%; MAS-S (%DM) 0.8%; HAS-S (%DM) 1.0%. Cuticle exfoliation was more obviously (A,D,G,J, shown as yellow arrows). Serious damage occurred on the surface of papillae (B,E,H,K, shown as red arrows). More microbials were colonized (C,F,I,L, shown as green arrows).
Figure 9.
Different forms of stratum corneum cells disruption in the HAS group. (sloughing of the corneum, crack and budding). The epithelial keratinocytes of rumen epithelium were exfoliating, necrotic (A,B, shown by arrows), budding (C, shown by arrows) and forming large fissures (D, shown by arrows).
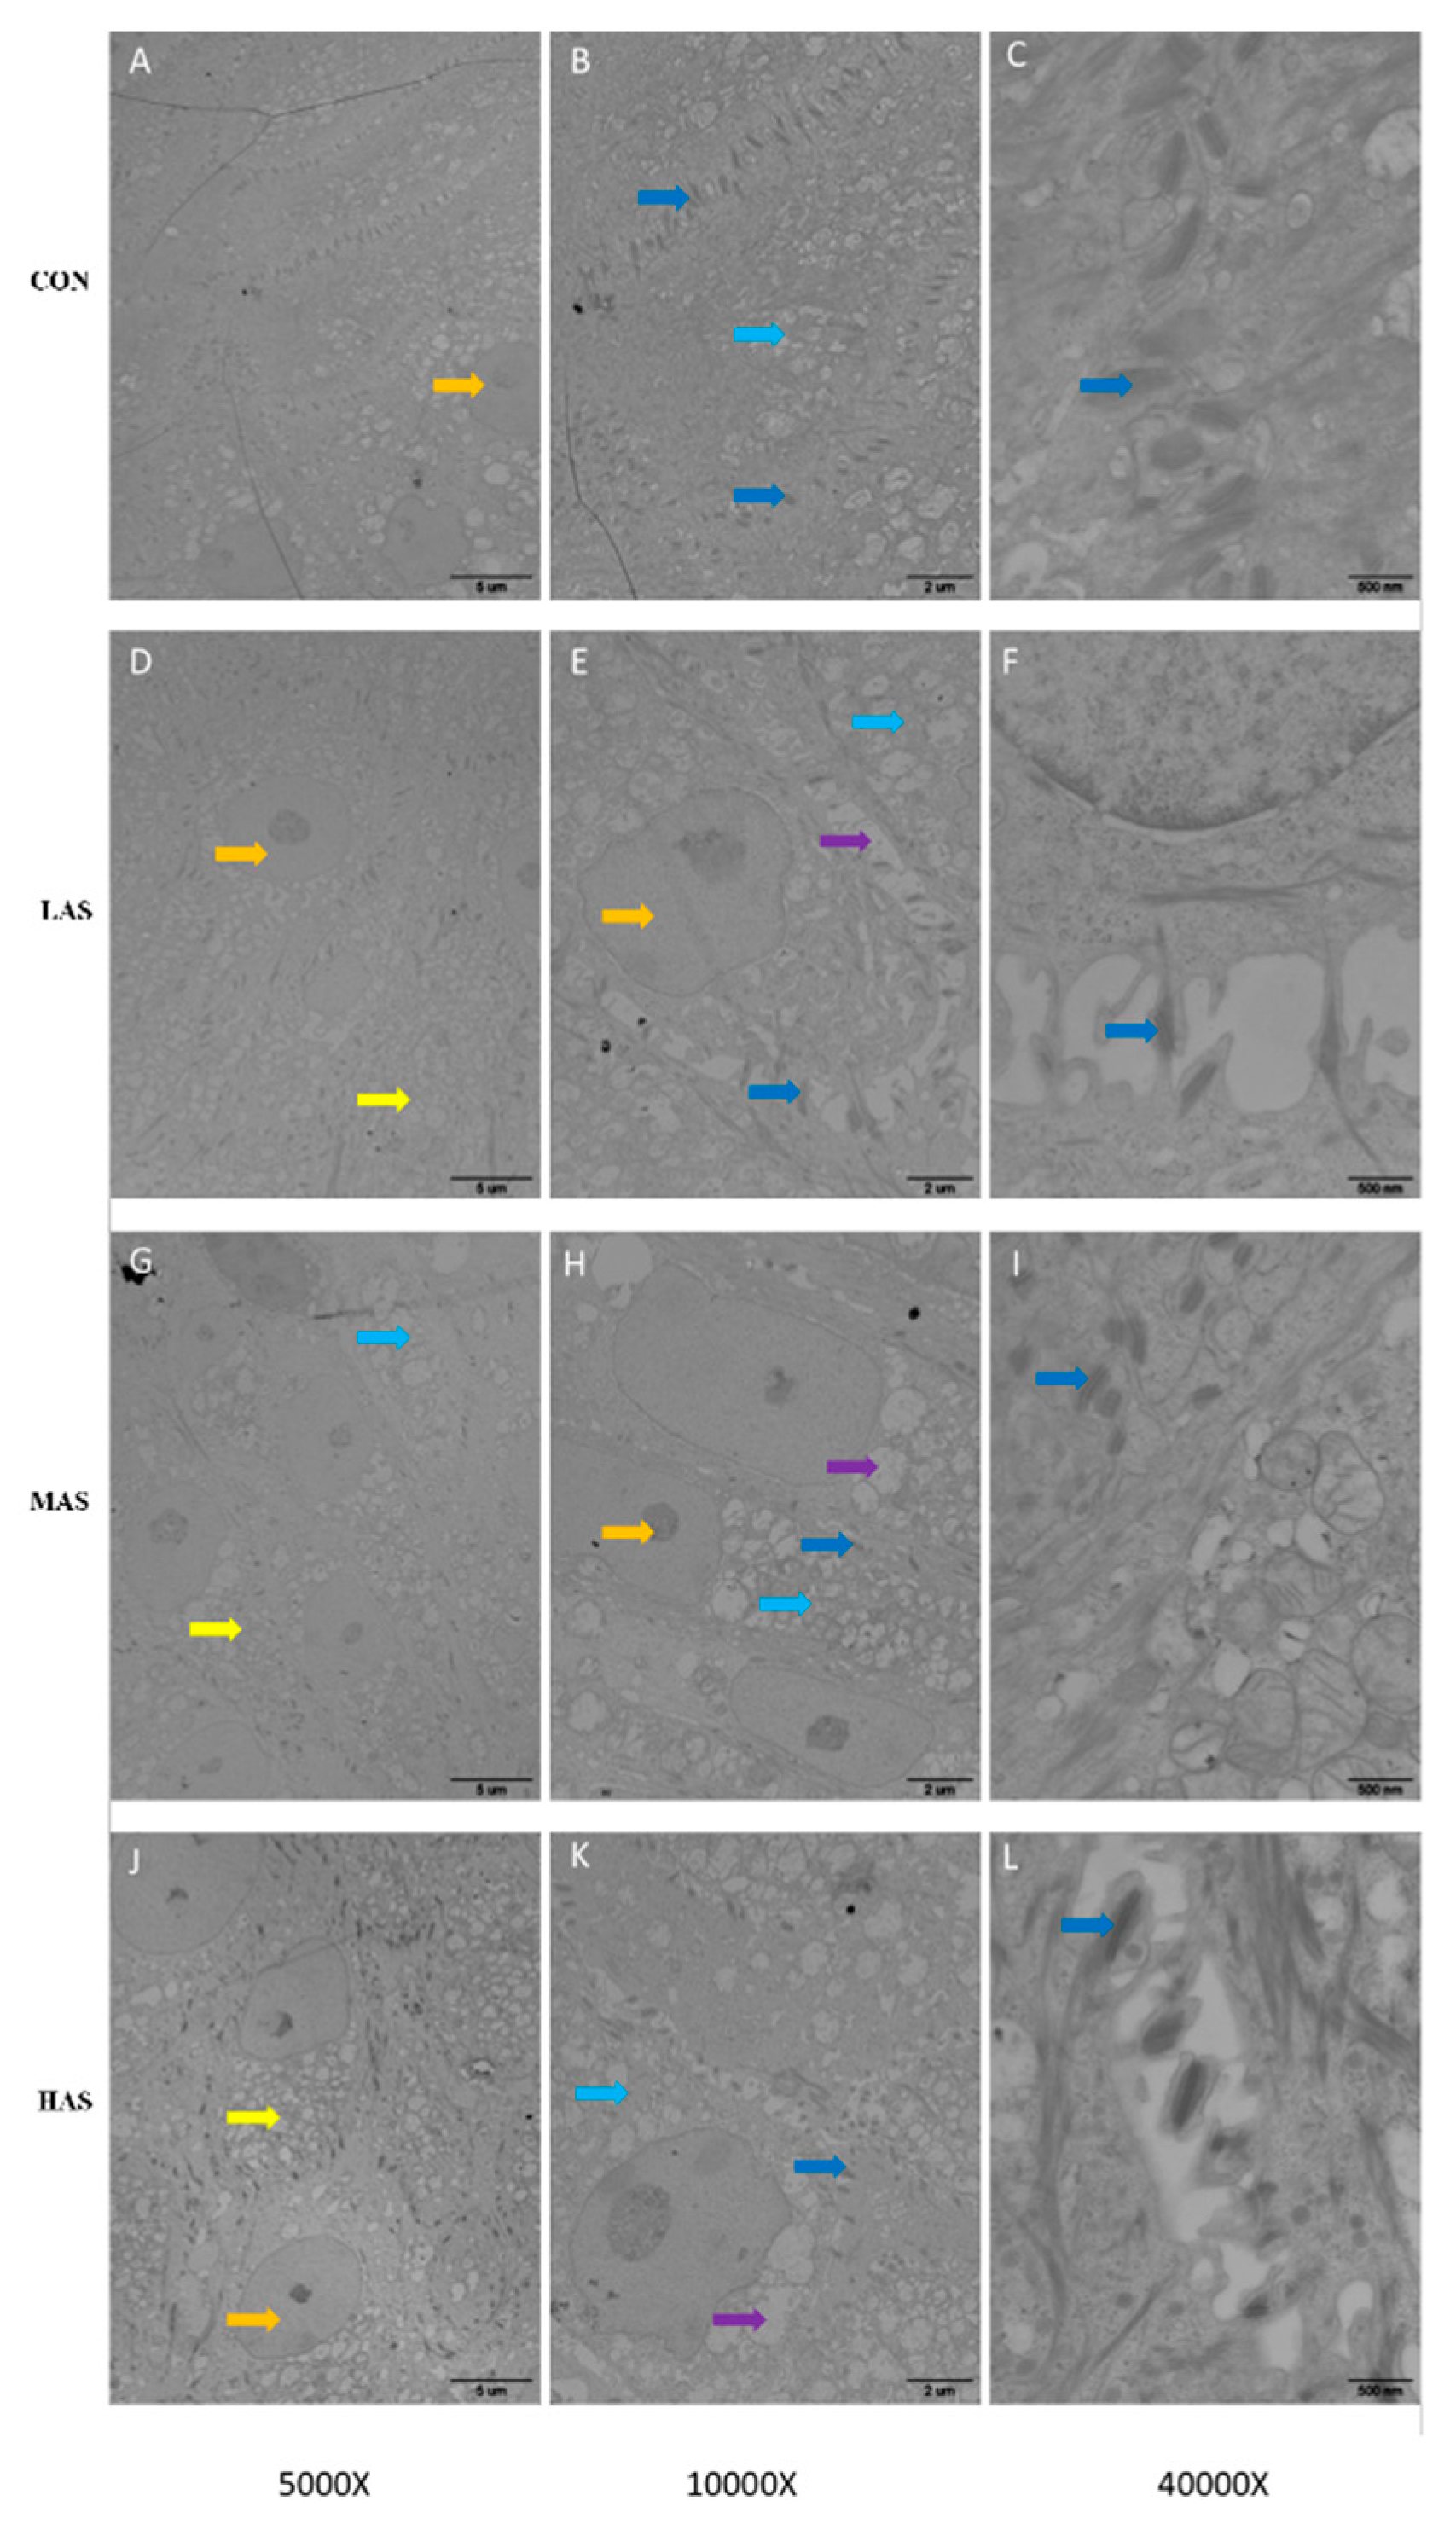
Figure 10.
Effect of high sulfur diet on the ultrastructure of rumen epithelium under 5000, 10,000 and 40,000 times of TEM (A, B, C for CON; D, E, F for LAS; G, H, I for MAS; J, K, L for HAS, respectively). CON-S (%DM) 0.4%; LAS-S (%DM) 0.6%; MAS-S (%DM) 0.8%; HAS-S (%DM) 1.0%. Epithelium cells (orange arrows), tight junctions with welding lines (blue arrows) and other cell junctions (light blue arrows).
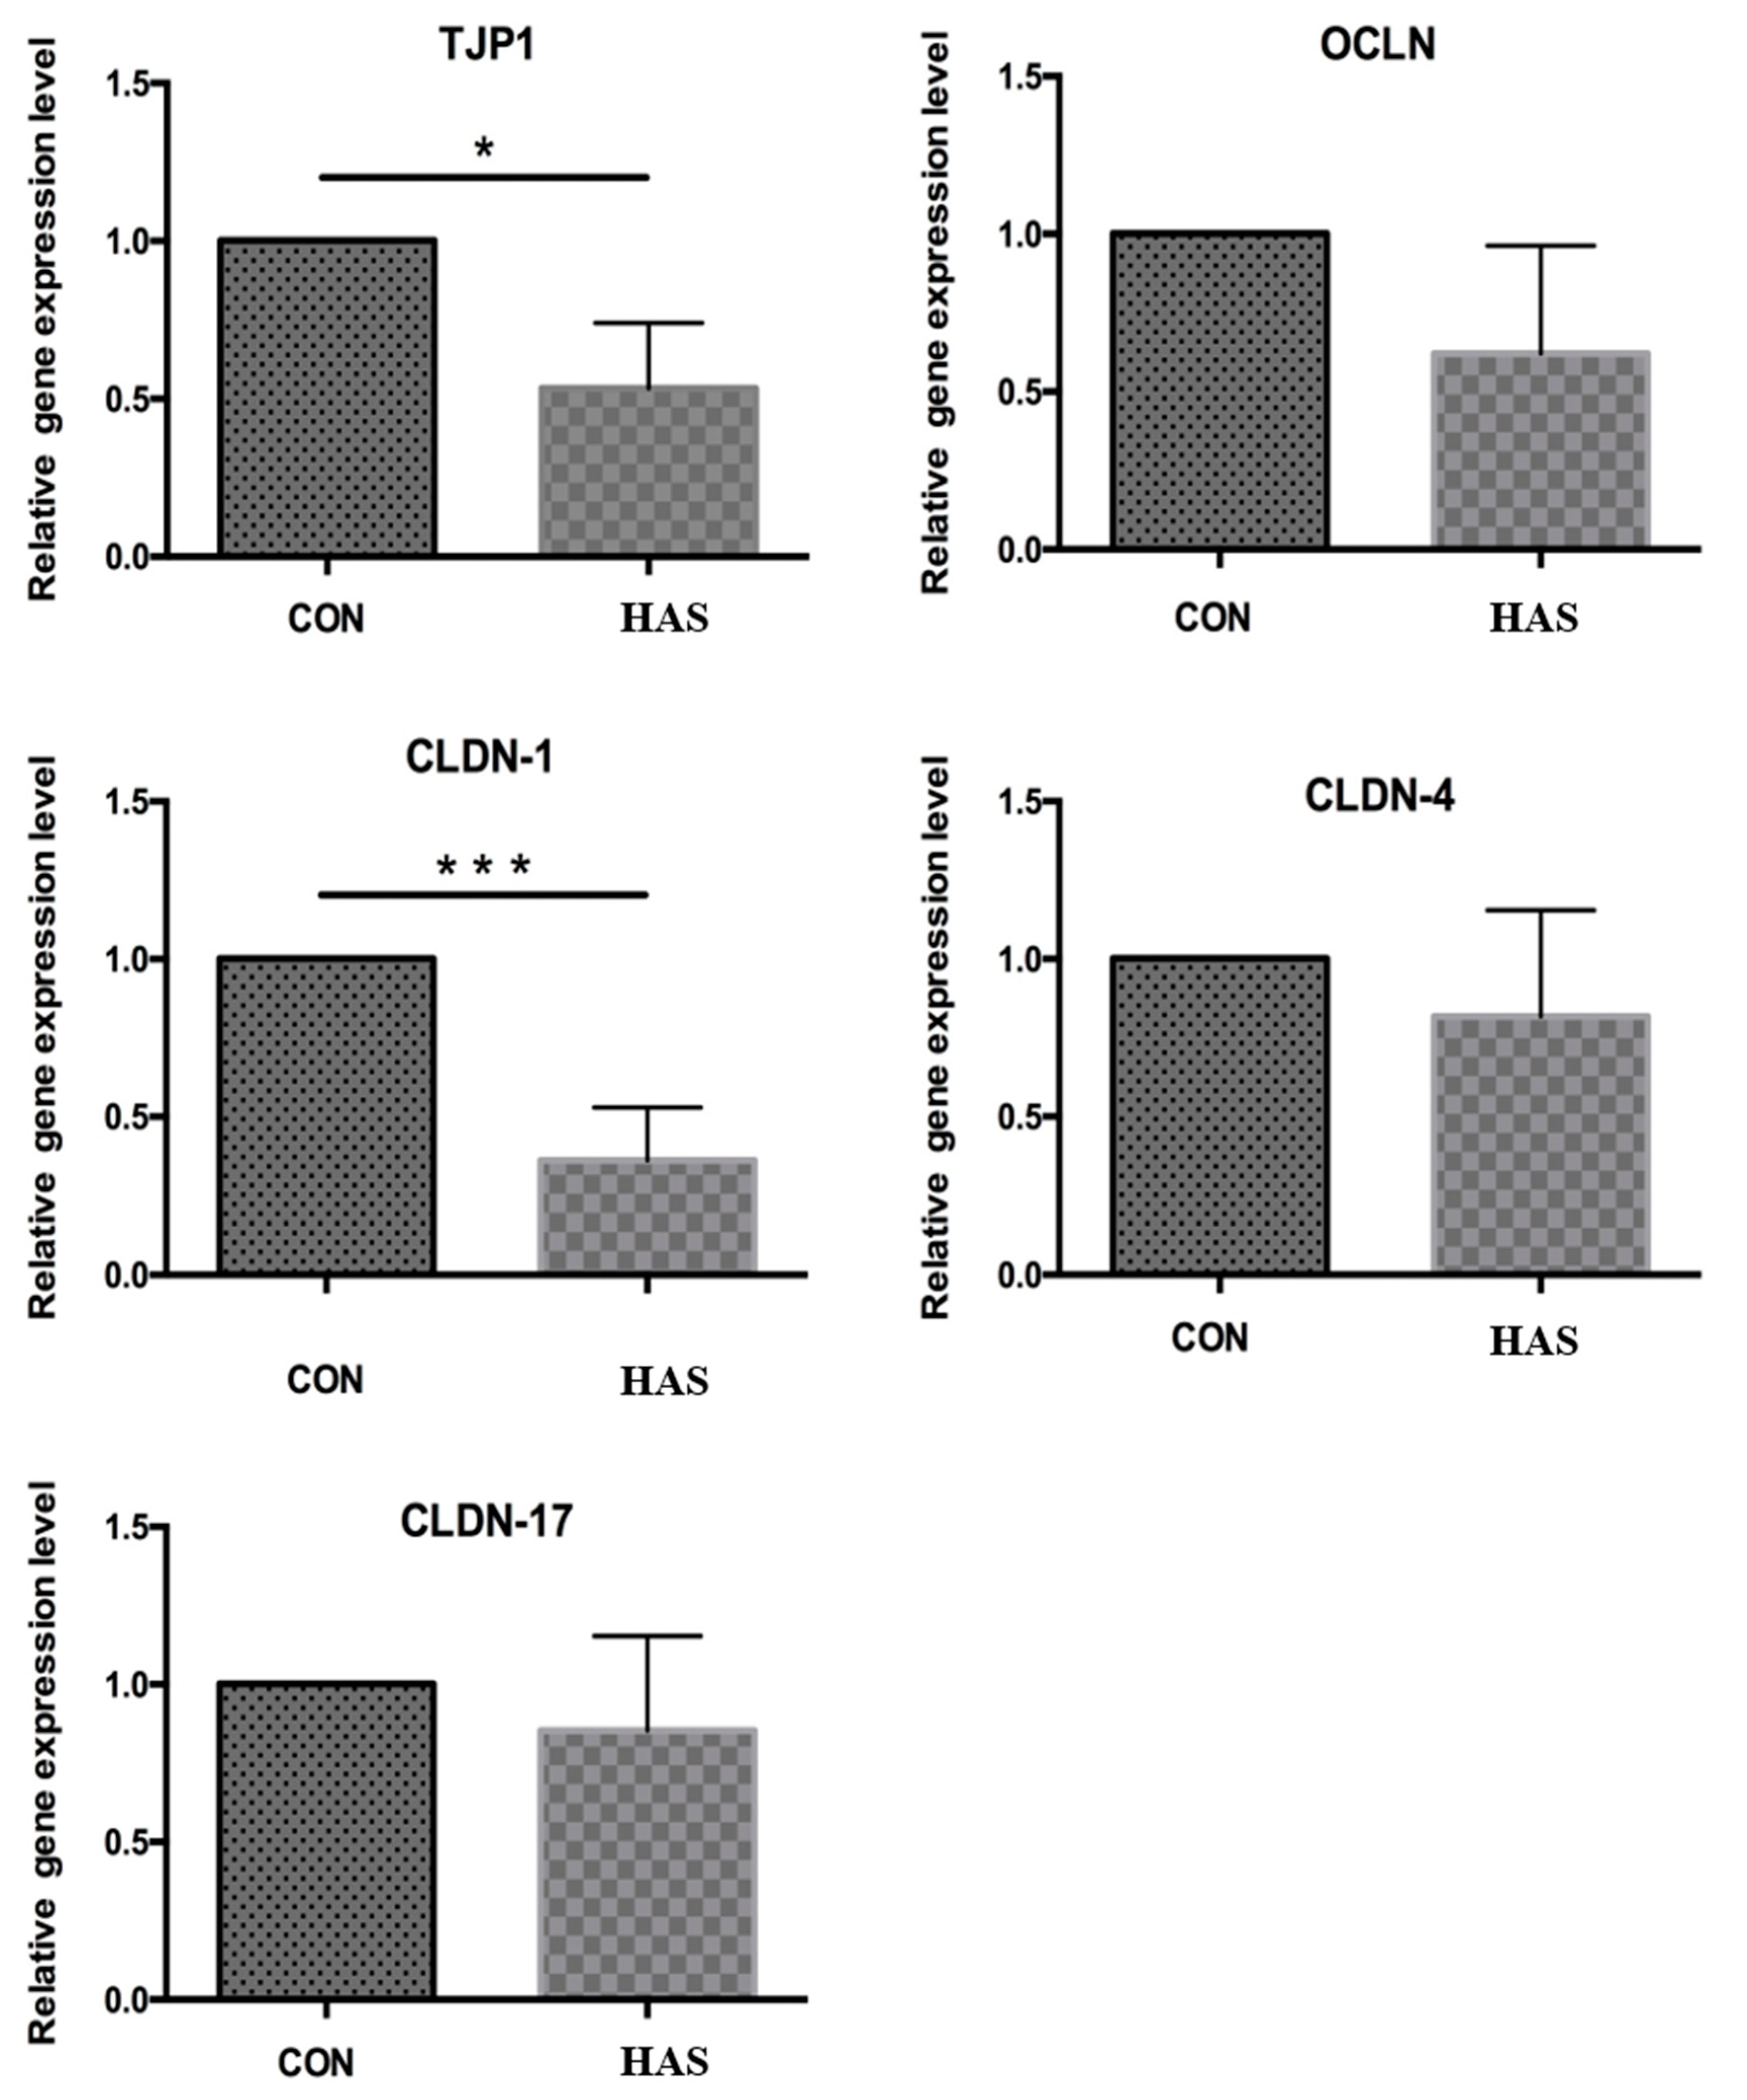
Figure 11.
Effect of high sulfur diet on the relative expression of tight junction genes in the rumen epithelium. CON-S (%DM) 0.4%; HAS-S (%DM). TJP1 = tight junction protein 1; OCLN = Occludin; CLDN-1 = Claudin-1; CLDN-4 = Claudin-4; CLDN-17 = Claudin-17. Asterisks mean significant difference between treatments.
Table 1.
Basic diet composition and nutrition levels.
Table 1.
Basic diet composition and nutrition levels.
| Item | Treatment 1 |
|---|
| CON | LAS | MAS | HAS |
|---|
| Ingredient (%DM) |
| Steam-flake corn | 40.00 | 40.00 | 40.00 | 40.00 |
| Whole corn silage | 40.00 | 40.00 | 40.00 | 40.00 |
| Cottonseed meal | 4.50 | 4.50 | 4.50 | 4.50 |
| Brewer’s grain | 13.40 | 13.40 | 13.40 | 13.40 |
| Sodium sulfate | - | 0.89 | 1.78 | 2.66 |
| Salt | 0.50 | 0.50 | 0.50 | 0.50 |
| Premix 2 | 0.50 | 0.50 | 0.50 | 0.50 |
| Calcium hydrogen phosphate | 0.60 | 0.60 | 0.60 | 0.60 |
| Limestone | 0.50 | 0.50 | 0.50 | 0.50 |
| Nutritional composition 3 |
| ME (MJ/kg) | 7.34 | 7.34 | 7.34 | 7.34 |
| CP (%DM) | 13.61 | 13.61 | 13.61 | 13.61 |
| NDF (%DM) | 43.20 | 43.20 | 43.20 | 43.20 |
| ADF (%DM) | 22.89 | 22.89 | 22.89 | 22.89 |
| Ca (%DM) | 0.47 | 0.47 | 0.47 | 0.47 |
| P (%DM) | 0.22 | 0.22 | 0.22 | 0.22 |
| S (%DM) | 0.40 | 0.60 | 0.80 | 1.00 |
Table 2.
Sequences of primer used to analyze gene expression in rumen epithelial tissue by quantitative PCR.
Table 2.
Sequences of primer used to analyze gene expression in rumen epithelial tissue by quantitative PCR.
| Target | Accession Number | Primer Sequences 1 | PCR Product Size (bp) |
|---|
| Claudin-1 | NM_001001854.2 | F: 5′CCGTGCCTTGATGGTGATTGG3′ | 107 |
| R: 5′TCTTCTGTGCCTCGTCGTCTTC3′ |
| Claudin-4 | NM_001014391.2 | F: 5′ATCGGCAGCAACATCGTCAC3′ | 107 |
| R: 5′AGCAGCGAGTCGTACACCTT3′ |
| Claudin-17 | XM_010800919.3 | F: 5′GCGTCCGACAAGCCAAGG3′ | 133 |
| R: 5′CCAACAAGCAGAGCAATCACAGA 3′ |
| Occludin | NM_001082433.2 | F: 5′GCTACGGCTATGGCTACGGTTA3′ | 194 |
| R: 5′CAGGACGGCGGTCACTATTATCA 3′ |
| TJP1 | - | F: 5′ CGGATGGTGCTACAAGTGATGAC3′ | 194 |
| R: 5′CGCCTTCTGTGTCTGTGTCTTC3′ |
| β-actin | NM_173979.3 | F: 5′CATCGGCAATGAGCGGTTCC3′ | 145 |
| R: 5′CGTGTTGGCGTAGAGGTCCTT3′ |
Table 3.
The in vitro rumen fermentation of substrate with different levels of sulfur.
Table 3.
The in vitro rumen fermentation of substrate with different levels of sulfur.
| Item 1 | Treatment | SEM 2 | p-Value | Contrast 3 |
|---|
| 0.40% | 0.50% | 0.60% | 0.70% | 0.80% | 0.90% | 1.00% | 1.10% | 1.20% | PL | PQ |
|---|
| Gas production dynamic (mL/0.2 g DM) |
| GP24 | 55.04 ab | 55.72 a | 54.22 abc | 55.59 a | 55.25 ab | 52.96c | 53.29 c | 53.97 abc | 53.70 bc | 0.21 | <0.01 | <0.01 | 0.94 |
| GP48 | 62.93 abc | 64.18 a | 61.88 abcd | 63.53 ab | 63.42 ab | 59.85 d | 60.73 cd | 62.27 abcd | 61.47 bcd | 0.31 | <0.01 | <0.01 | 0.61 |
| B | 63.88 abc | 65.36 a | 64.97 ab | 65.47 a | 62.05 bcd | 59.48 d | 61.90 cd | 63.14 abc | 60.98 cd | 0.48 | <0.01 | <0.01 | 0.75 |
| c (h−1) | 0.094 c | 0.096 bc | 0.096 bc | 0.099 abc | 0.101 ab | 0.101 ab | 0.101 ab | 0.104 a | 0.106 a | 0.001 | 0.01 | <0.01 | 0.79 |
| 24 h fermentation parameter |
| NH3-N (mg/100 mL) | 17.41 | 25.69 | 18.44 | 18.87 | 22.39 | 19.02 | 18.86 | 15.69 | 19.81 | 0.83 | 0.19 | 0.29 | 0.63 |
| TVFA (mmol/L) | 47.37 a | 53.62 a | 46.02 ab | 47.77 a | 38.8 b | 51.89 a | 53.57 a | 49.99 a | 49.66 a | 1.12 | 0.02 | 0.40 | 0.22 |
| Acetate (%) | 64.01 | 64.06 | 63.18 | 64.51 | 62.04 | 63.45 | 64.10 | 63.70 | 62.98 | 0.24 | 0.13 | 0.31 | 0.59 |
| Propionate (%) | 19.06 | 18.70 | 19.01 | 18.52 | 19.16 | 19.10 | 18.54 | 18.50 | 19.10 | 0.17 | 0.37 | 0.70 | 0.67 |
| Isobutyrate (%) | 1.36 | 1.57 | 1.55 | 1.61 | 1.68 | 1.45 | 1.69 | 1.77 | 1.60 | 0.11 | 0.46 | 0.09 | 0.45 |
| Butyrate (%) | 12.11 | 12.21 | 12.67 | 12.02 | 13.37 | 12.53 | 12.23 | 12.49 | 12.76 | 0.20 | 0.18 | 0.24 | 0.41 |
| Isovalerate (%) | 2.67 | 2.59 | 2.75 | 2.50 | 2.90 | 2.61 | 2.49 | 2.63 | 2.65 | 0.09 | 0.39 | 0.68 | 0.82 |
| Valerate (%) | 0.79 | 0.87 | 0.83 | 0.85 | 0.85 | 0.86 | 0.95 | 0.91 | 0.90 | 0.02 | 0.81 | 0.12 | 0.82 |
| A/P | 3.36 | 3.43 | 3.32 | 3.49 | 3.24 | 3.32 | 3.46 | 3.45 | 3.30 | 0.05 | 0.19 | 0.91 | 0.94 |
| 48 h fermentation parameter |
| NH3-N (mg/100 mL) | 26.62 | 27.99 | 27.8 | 29.67 | 27.16 | 25.53 | 28.49 | 31.56 | 28.18 | 0.79 | 0.86 | 0.48 | 0.89 |
| TVFA (mmol/L) | 54.67 | 46.69 | 50.39 | 49.15 | 59.54 | 49.17 | 57.50 | 62.16 | 62.26 | 1.82 | 0.29 | 0.04 | 0.27 |
| Acetate (%) | 63.11 | 63.12 | 62.40 | 62.53 | 62.81 | 63.28 | 62.55 | 62.93 | 62.69 | 0.18 | 0.97 | 0.79 | 0.75 |
| Propionate (%) | 18.50 | 18.44 | 18.45 | 18.43 | 18.41 | 18.49 | 18.31 | 18.06 | 18.18 | 0.06 | 0.81 | 0.11 | 0.51 |
| Isobutyrate (%) | 2.11 | 2.22 | 2.12 | 2.12 | 2.33 | 2.08 | 2.40 | 2.32 | 2.51 | 0.07 | 0.86 | 0.17 | 0.57 |
| Butyrate (%) | 11.88 | 11.85 | 12.32 | 12.25 | 12.03 | 11.98 | 12.19 | 11.98 | 12.13 | 0.08 | 0.92 | 0.67 | 0.51 |
| Isovalerate (%) | 3.48 | 3.50 | 3.65 | 3.63 | 3.33 | 3.27 | 3.43 | 3.45 | 3.40 | 0.05 | 0.77 | 0.33 | 0.90 |
| Valerate (%) | 0.92 | 0.87 | 1.07 | 1.03 | 1.09 | 0.91 | 1.12 | 1.25 | 1.10 | 0.04 | 0.26 | 0.03 | 0.83 |
| A/P | 3.41 | 3.42 | 3.38 | 3.39 | 3.41 | 3.42 | 3.42 | 3.48 | 3.45 | 0.02 | 0.93 | 0.27 | 0.48 |
Table 4.
Effect of additional sulfur in the diet on in vitro rumen fermentation parameters.
Table 4.
Effect of additional sulfur in the diet on in vitro rumen fermentation parameters.
| Item | Treatment | SEM | p-Value |
|---|
| CON | LAS | MAS | HAS |
|---|
| NH3-N (mg/100 mL) | 18.63 a | 5.98 c | 6.88 bc | 14.91 ab | 1.66 | <0.01 |
| TVFA (mmol/L) | 41.72 b | 38.51 b | 39.15 b | 52.87 a | 1.35 | <0.01 |
| Acetate (%) | 67.66 ab | 67.81 a | 66.42 b | 66.41 b | 0.23 | 0.03 |
| Propionate (%) | 20.18 a | 16.09 c | 20.03 a | 18.14 b | 0.38 | <0.01 |
| Isobutyrate (%) | 0.63 b | 1.03 a | 0.71 b | 0.57 b | 0.05 | <0.01 |
| Butyrate (%) | 9.19 c | 13.56 a | 11.13 b | 13.24 a | 0.35 | <0.01 |
| Isovalerate (%) | 1.70 a | 1.30 b | 1.33 b | 1.18 b | 0.06 | 0.01 |
| Valerate (%) | 0.63 a | 0.20 c | 0.37 b | 0.46 b | 0.03 | <0.01 |
| A/P | 3.37 bc | 4.24 a | 3.33 c | 3.69 b | 0.08 | <0.01 |
Table 5.
Influence of different sulfur content on the alpha diversity of bacterial communities in the rumen.
Table 5.
Influence of different sulfur content on the alpha diversity of bacterial communities in the rumen.
| Item 1 | Observed Species | Shannon | Simpson | Ace | Chao | Good’s Coverage |
|---|
| CON | 1580.50 | 6.08 | 0.0074 | 1857.33 | 1882.86 | 0.9826 |
| LAS | 1467.25 | 5.91 | 0.0089 | 1757.12 | 1770.60 | 0.9830 |
| MAS | 1522.00 | 5.95 | 0.0095 | 1813.51 | 1836.60 | 0.9824 |
| HAS | 1518.13 | 6.01 | 0.0083 | 1797.46 | 1821.01 | 0.9830 |
| SEM | 16.36 | 0.03 | 0.0006 | 17.54 | 18.68 | 0.0002 |
| p-Value | 0.10 | 0.33 | 0.67 | 0.25 | 0.21 | 0.65 |
Table 6.
Effect of high sulfur diet on the thickness of different cellular stratum of rumen epithelium.
Table 6.
Effect of high sulfur diet on the thickness of different cellular stratum of rumen epithelium.
| Item 1 | Treatment 2 | SEM | p-Value |
|---|
| CON | LAS | MAS | HAS |
|---|
| Epithelial papilla length/mm | 5.24 c | 7.33 bc | 8.67 ab | 10.94 a | 0.58 | <0.01 |
| spinous layer + basal layer/µm | 66.16 b | 67.23 b | 73.42 ab | 80.10 a | 1.86 | 0.02 |
| cuticle + granular layer/µm | 16.88 | 15.01 | 18.25 | 18.57 | 0.62 | 0.17 |
| Total epithelium/µm | 83.04 b | 82.24 b | 91.67 ab | 98.67 a | 2.07 | 0.01 |


