Article

Growth Modeling of the Giant Electric Ray Narcine entemedor in the Southern Gulf of California: Analyzing the Uncertainty of Three Data Sets

by
Pablo Mora-Zamacona
1,
Felipe N. Melo-Barrera
1,
Víctor H. Cruz-Escalona
1,*,
Andrés F. Navia
2,
Enrique Morales-Bojórquez
3,
Xchel A. Pérez-Palafox
1 and
Paola A. Mejía-Falla
2
1
Centro Interdisciplinario de Ciencias Marinas, Instituto Politécnico Nacional, Baja California Sur, La Paz 23096, Mexico
2
Fundación Colombiana para la Investigación Y Conservación de Tiburones Y Rayas, SQUALUS, Calle 10A No 72-35, Apto. 310 E, Cali 760001, Colombia
3
Centro de Investigaciones Biológicas del Noroeste, Av. Instituto Politécnico Nacional 195, Col. Playa Palo de Santa Rita Sur, La Paz 23096, Mexico
*
Author to whom correspondence should be addressed.
Animals 2022, 12(1), 19; https://doi.org/10.3390/ani12010019
Submission received: 5 November 2021 / Revised: 8 December 2021 / Accepted: 10 December 2021 / Published: 23 December 2021
(This article belongs to the Special Issue Sharks and Skates: Ecology, Distribution and Conservation)

Abstract

:

Simple Summary

The study of age and growth patterns in skates and rays can be conducted by analyzing mineral deposition patterns inside the vertebrae as biological features may influence age estimation. For the giant electric ray (Narcine entemedor), age was estimated by analyzing the vertebrae and an annual deposition pattern was found. After considering additional biological features such as birth date and date of capture, a more precise description of growth pattern was made. We concluded that this species is a moderate body size elasmobranch with moderate longevity and fast growth. Our results provide useful information for the future management of this exploited species.

Abstract

The age and growth rate of the giant electric ray, Narcine entemedor, was estimated using growth bands deposited in the vertebral centra of 245 specimens. Differences in size and age distribution were found between the sexes, a pattern that suggests the annual deposition of band pairs, possibly occurring in April. Multimodel inference and back-calculation were performed to three age data sets of females considering their reproductive cycle and time of capture, among which the von Bertalanffy growth function was found to be the most appropriate (L = 81.87 cm TL, k = 0.17 year−1). Our research supports the idea that age can be determined via biological features such as birth date and growth band periodicity. We concluded that N. entemedor is of a moderate body size, moderate longevity and is a fast-growing elasmobranch species.

1. Introduction

Traditionally, it has been recognized that elasmobranchs, due to their biological characteristics (late maturation, low fecundity, slow growth), are especially vulnerable to overfishing [1,2,3,4]. Nevertheless, evidence has proven that life-history traits of this group may vary between K and r strategies, allowing some species to respond differently to fishing pressure [5,6,7]. In this sense, it is important to understand the life-history parameters of the species, particularly those that are related to the degree of vulnerability and risk to fishing pressure, providing basic information for demographic models [8,9,10]. Among the most important parameters for this purpose are the ones related to the age and growth of the species [11].
The number of age and growth studies in elasmobranchs has increased significantly in recent years [12]; however, the techniques and structures used for these purposes have remained constant, based mainly on the identification and count of opaque and translucent banding patterns present in hard anatomical structures such as vertebral centra, denticles and dorsal spines [13,14].
Many studies on the age and growth of elasmobranchs have been encouraged by the increasing exploitation of this group, which has been documented by numerous researchers, reporting the important effects of fishing mortality on batoid populations [15,16,17,18]. In Mexican elasmobranch fisheries, the main species of batoids captured are benthic, such as Pseudobatos productus, Zapteryx exasperate and Hypanus dipterurus [19,20,21,22], although some pelagic species such as Pteroplatytrygon violacea and Myliobatis californica have been found frequently in the catch [22,23]. In all these study cases, Narcine entemedor (Jordan and Starks, 1895) have been reported with low abundances; nevertheless, Villavicencio-Garayzar [24] and Márquez-Farías [25] reported that they are commonly captured in artisanal fisheries of Mexico, especially during spring and summer. In Bahía de La Paz, an artisanal fishery on batoids captures around 14 species, among which N. entemedor ranks third in captures [26].
The giant electric ray N. entemedor is an endemic batoid of the eastern tropical Pacific Ocean distributed from southern Baja California and the Gulf of California to Peru. While the diet and feeding ecology [27] and reproductive biology [24,28] of the giant electric ray have been investigated, there is little information on the age and growth of this species. Moreover, information on the species is limited to the Pacific coast of Mexico, while life-history traits could vary in Central and South America. The objective of this study was to estimate age and growth parameters for N. entemedor in the southern Gulf of California using a multimodel inference approach, and to consider the influence of biological features in the estimates. We conclude that using data such as birth date may result in a more precise description of individual growth.

2. Materials and Methods

2.1. Collection of Samples

The specimens were captured in collaboration with a fisherman who has a commercial fishing permit under Mexican fishing regulations and laws (CONAPESCA-103053993316-1); therefore, the data in this study are fishery-dependent. Monthly samplings were made from October 2013 through December 2015 in the south of Bahía de La Paz, located in the southern portion of the Gulf of California (24°25′ N, 110°18′ W). The organisms were captured using monofilament gill nets (200–300 m long, 1.5 m high, 20–25 cm stretch mesh) set in the afternoon at depths between 10 and 30 m over sandy bottoms and recovered the next morning. Individuals were measured for total length (TL in cm), and the sex was determined by the presence of copulatory organs in males (claspers; [28]). Vertebrae were collected from the abdominal region of each specimen and placed in a freezer.

2.2. Vertebral Preparation

Vertebrae were thawed, excess tissue manually removed and individual centra were separated using a scalpel. Cleaned vertebrae centra were dried at room temperature. A qualitative analysis to test the effectiveness of diverse treatments to enhance the visibility of growth bands was evaluated. Three cutting thicknesses (0.3, 0.4 and 0.5 mm) and two dyes, Alizarin Red S (0.01 g/250 mL water) and Bismarck Brown Y (0.01 g/250 mL alcohol 95%), were tested to enhance the visibility of the centra growth bands. Staining was performed at different times of exposure, from 1 min to saturation. However, none of the dyes tested presented an improvement in the clarity of growth bands; thus, vertebrae were instead prepared as follows. Centra were fixed on wooden structures using a cyanoacrylate-based adhesive. Sagittal sections of 0.4 mm thick were made using double saws fitted with diamond-impregnated blades, ensuring that the focus of the centrum was included. Subsequently, sections were cleaned with scalpel and water and then dried at room temperature.

2.3. Reading of Growth Bands

Thin sections were observed under a stereo microscope (Olympus SZX9) and digitized using a video camera (Sony CCD-IRIS-RGB). The sections were illuminated using reflected light on a dark background and submerged in a thin layer of water to improve the observation. The birth band was defined as the angle change on the centrum side [29]. Additionally, a centrum of a 12.4 cm TL near-term embryo [28] was polished and compared with a thin section of an adult. The size of the embryo’s centra and the birth band coincided; furthermore, no pre-birth bands were observed. The radius of each vertebra was measured on the corpus calcareum long a straight line through the focus of each vertebra with SigmaScan Pro 5.0.0 Software (Systat Software, Palo Alto, CA, US). The vertebral radius (VR) was plotted against TL and tested for a linear relationship to determine if these vertebrae provided a suitable structure for age determination and for back-calculated estimation of length at previous ages. The influence of sex in the VR-TL relationship was evaluated with a test of slopes and elevations [30].
A training exercise counting the bands of a subsample (n = 50) was performed by two readers to refine the identification and growth band counts criteria. The following criteria were established: (1) identification of the presence of pairs of growth bands (one translucent and one opaque; [31]), (2) identification of a birth band through a change in the angle of the corpus calcareum in the place closest to the focus of the vertebra [29] and (3) counting of translucent bands (Figure 1). The two readers (reader 1 was most experienced) then did a simultaneous and independent band count without knowing the sex or size of the specimens. Readings of bands were performed on the corpus calcareum due to the poor visibility in the intermedialia zone. This procedure was repeated twice. Any vertebra yielding an age estimate that differed between counts was re-examined by both readers jointly; if no consensus was reached, the sample was discarded.

2.4. Precision and Accuracy

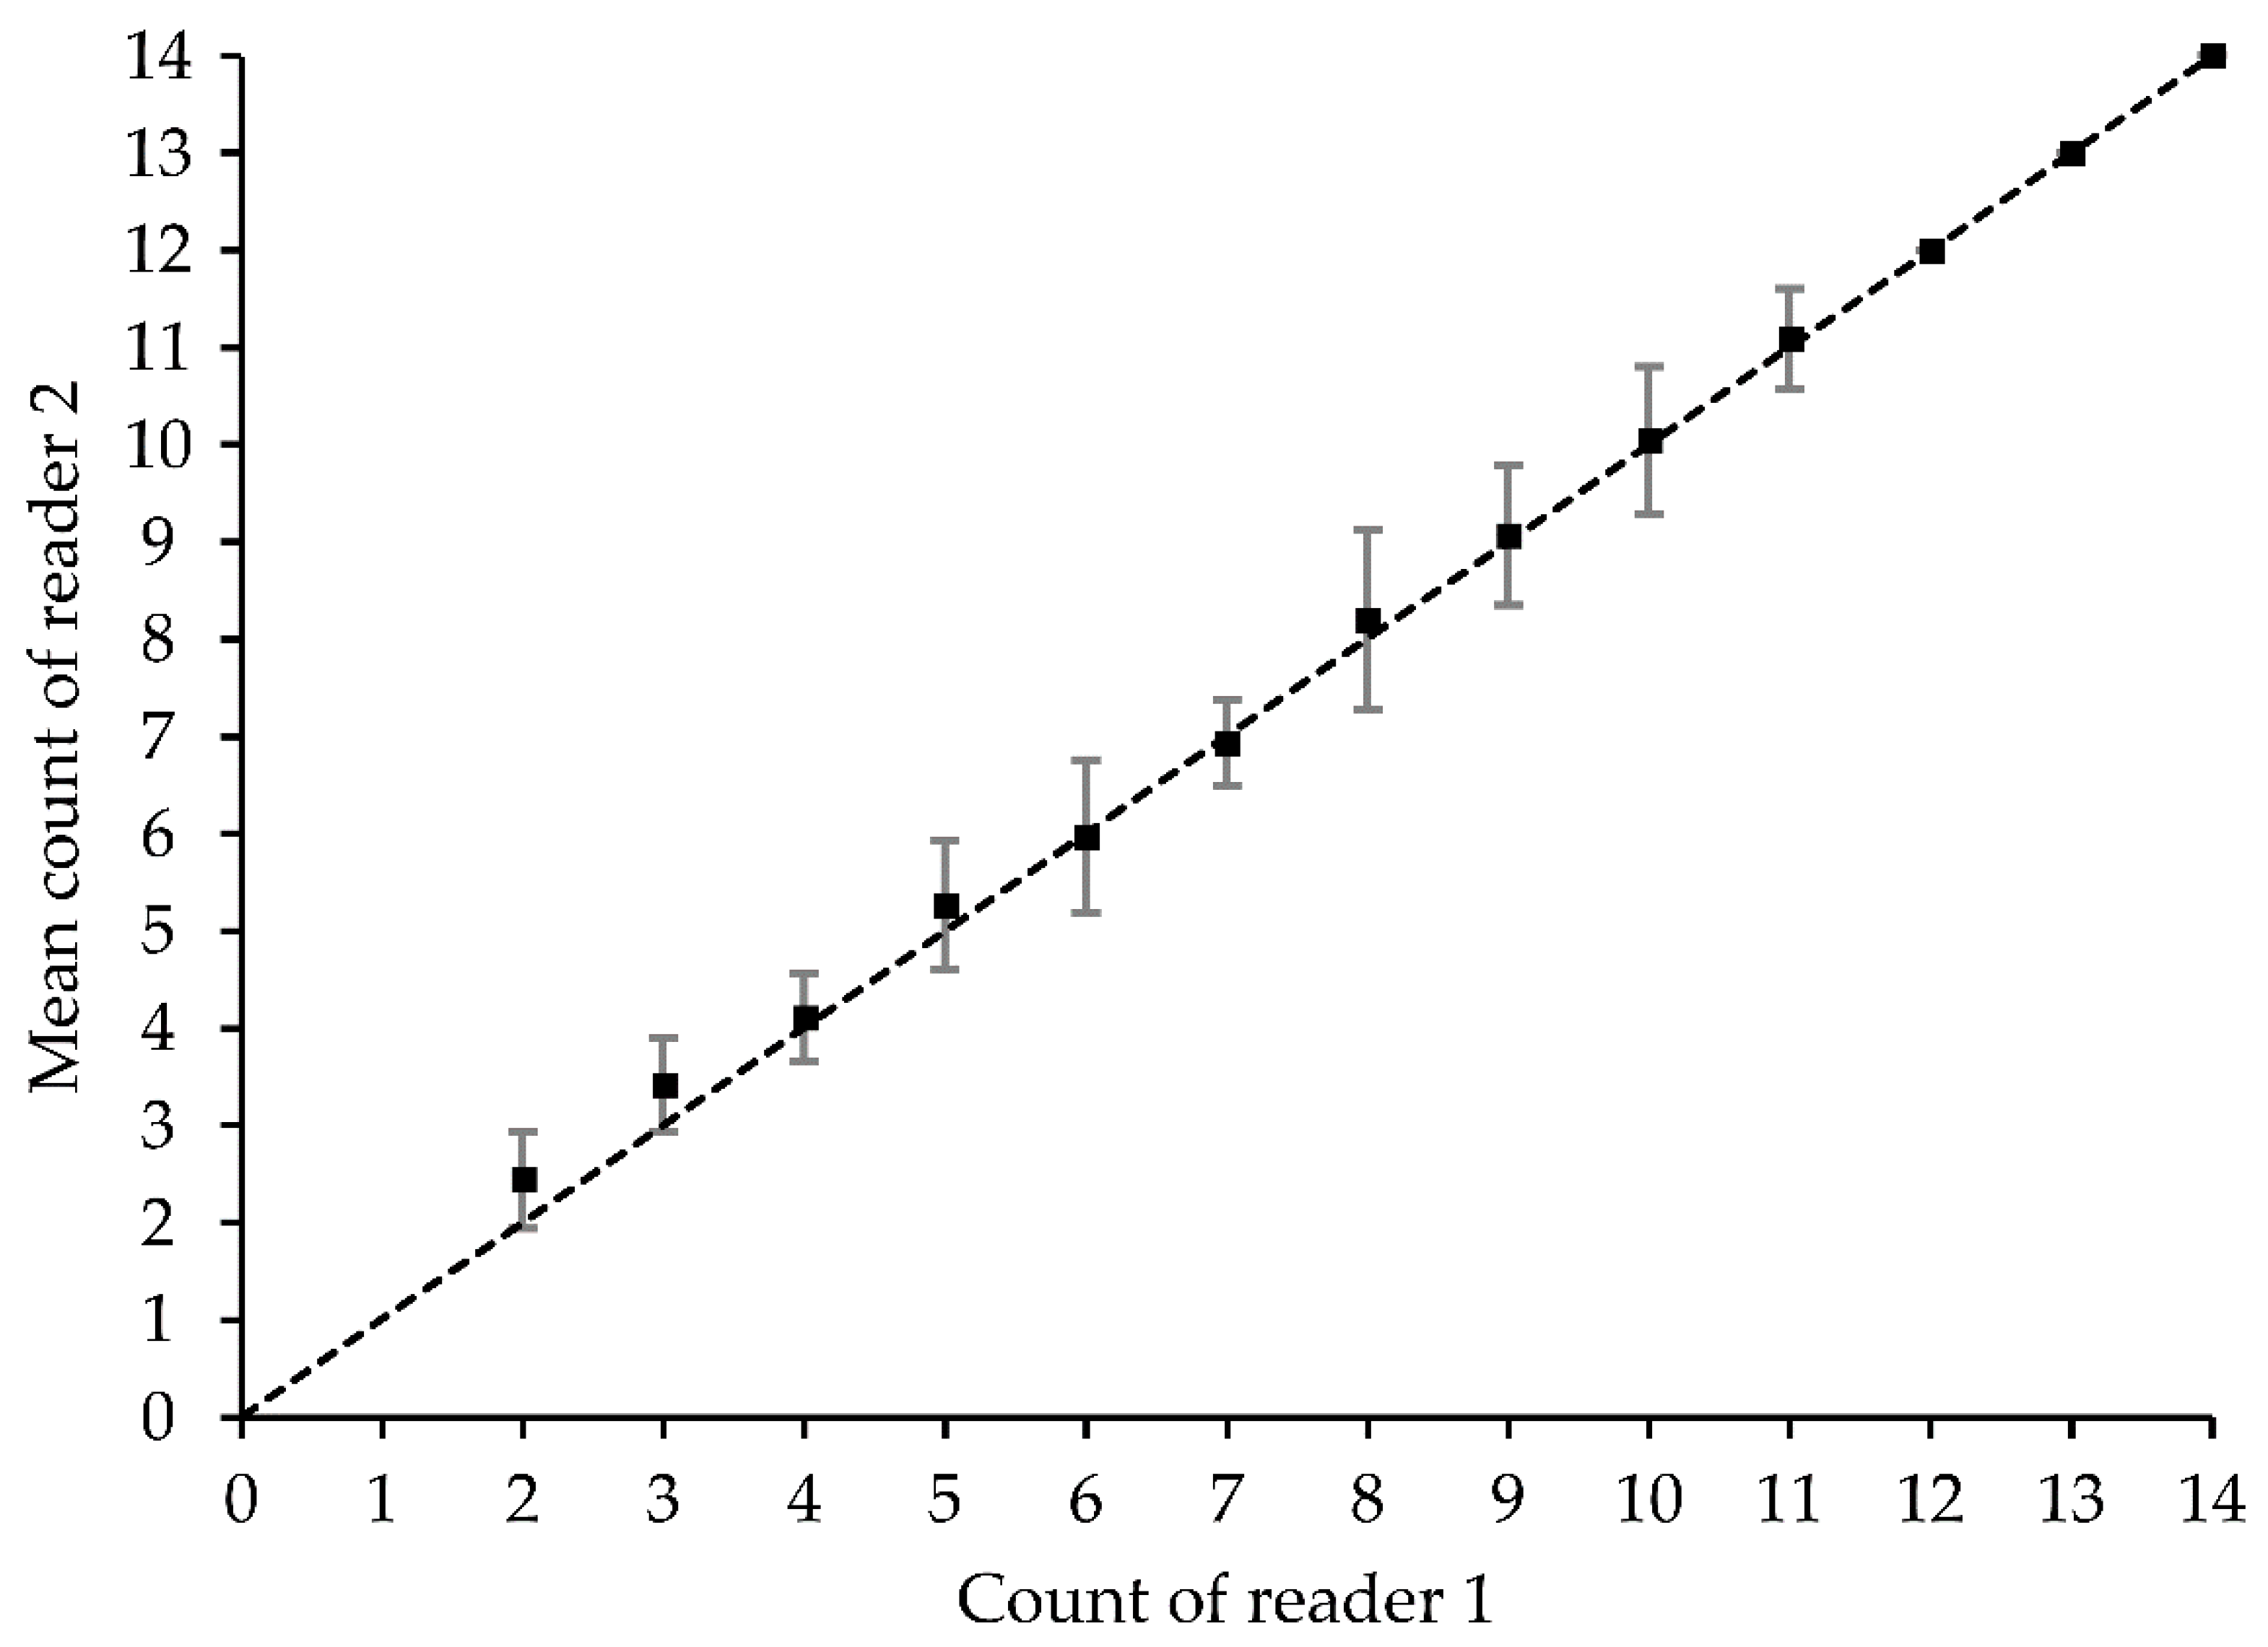
According to Campana [31], aging errors can be expressed as follows: (a) discrepancies in the reproducibility of repeated measurements on a given structure (precision), and (b) differences between the closeness of the age estimate to the true value (accuracy). Thus, count reproducibility, as indicated by reader variability, was determined by calculating the percent of agreement (PA) by ±1 mark [32], average percent error (APE; [33]) and coefficient of variation, which is an alternative precision analysis that uses the standard deviation rather than the absolute deviation (CV; [34]). Each method was applied to the total of the sample. Additionally, to assess whether there are systematic differences between the readings made by the readers, age-bias plots of band counts [35] and Bowker’s test of symmetry were performed [36].

2.5. Periodicity of Band Formation

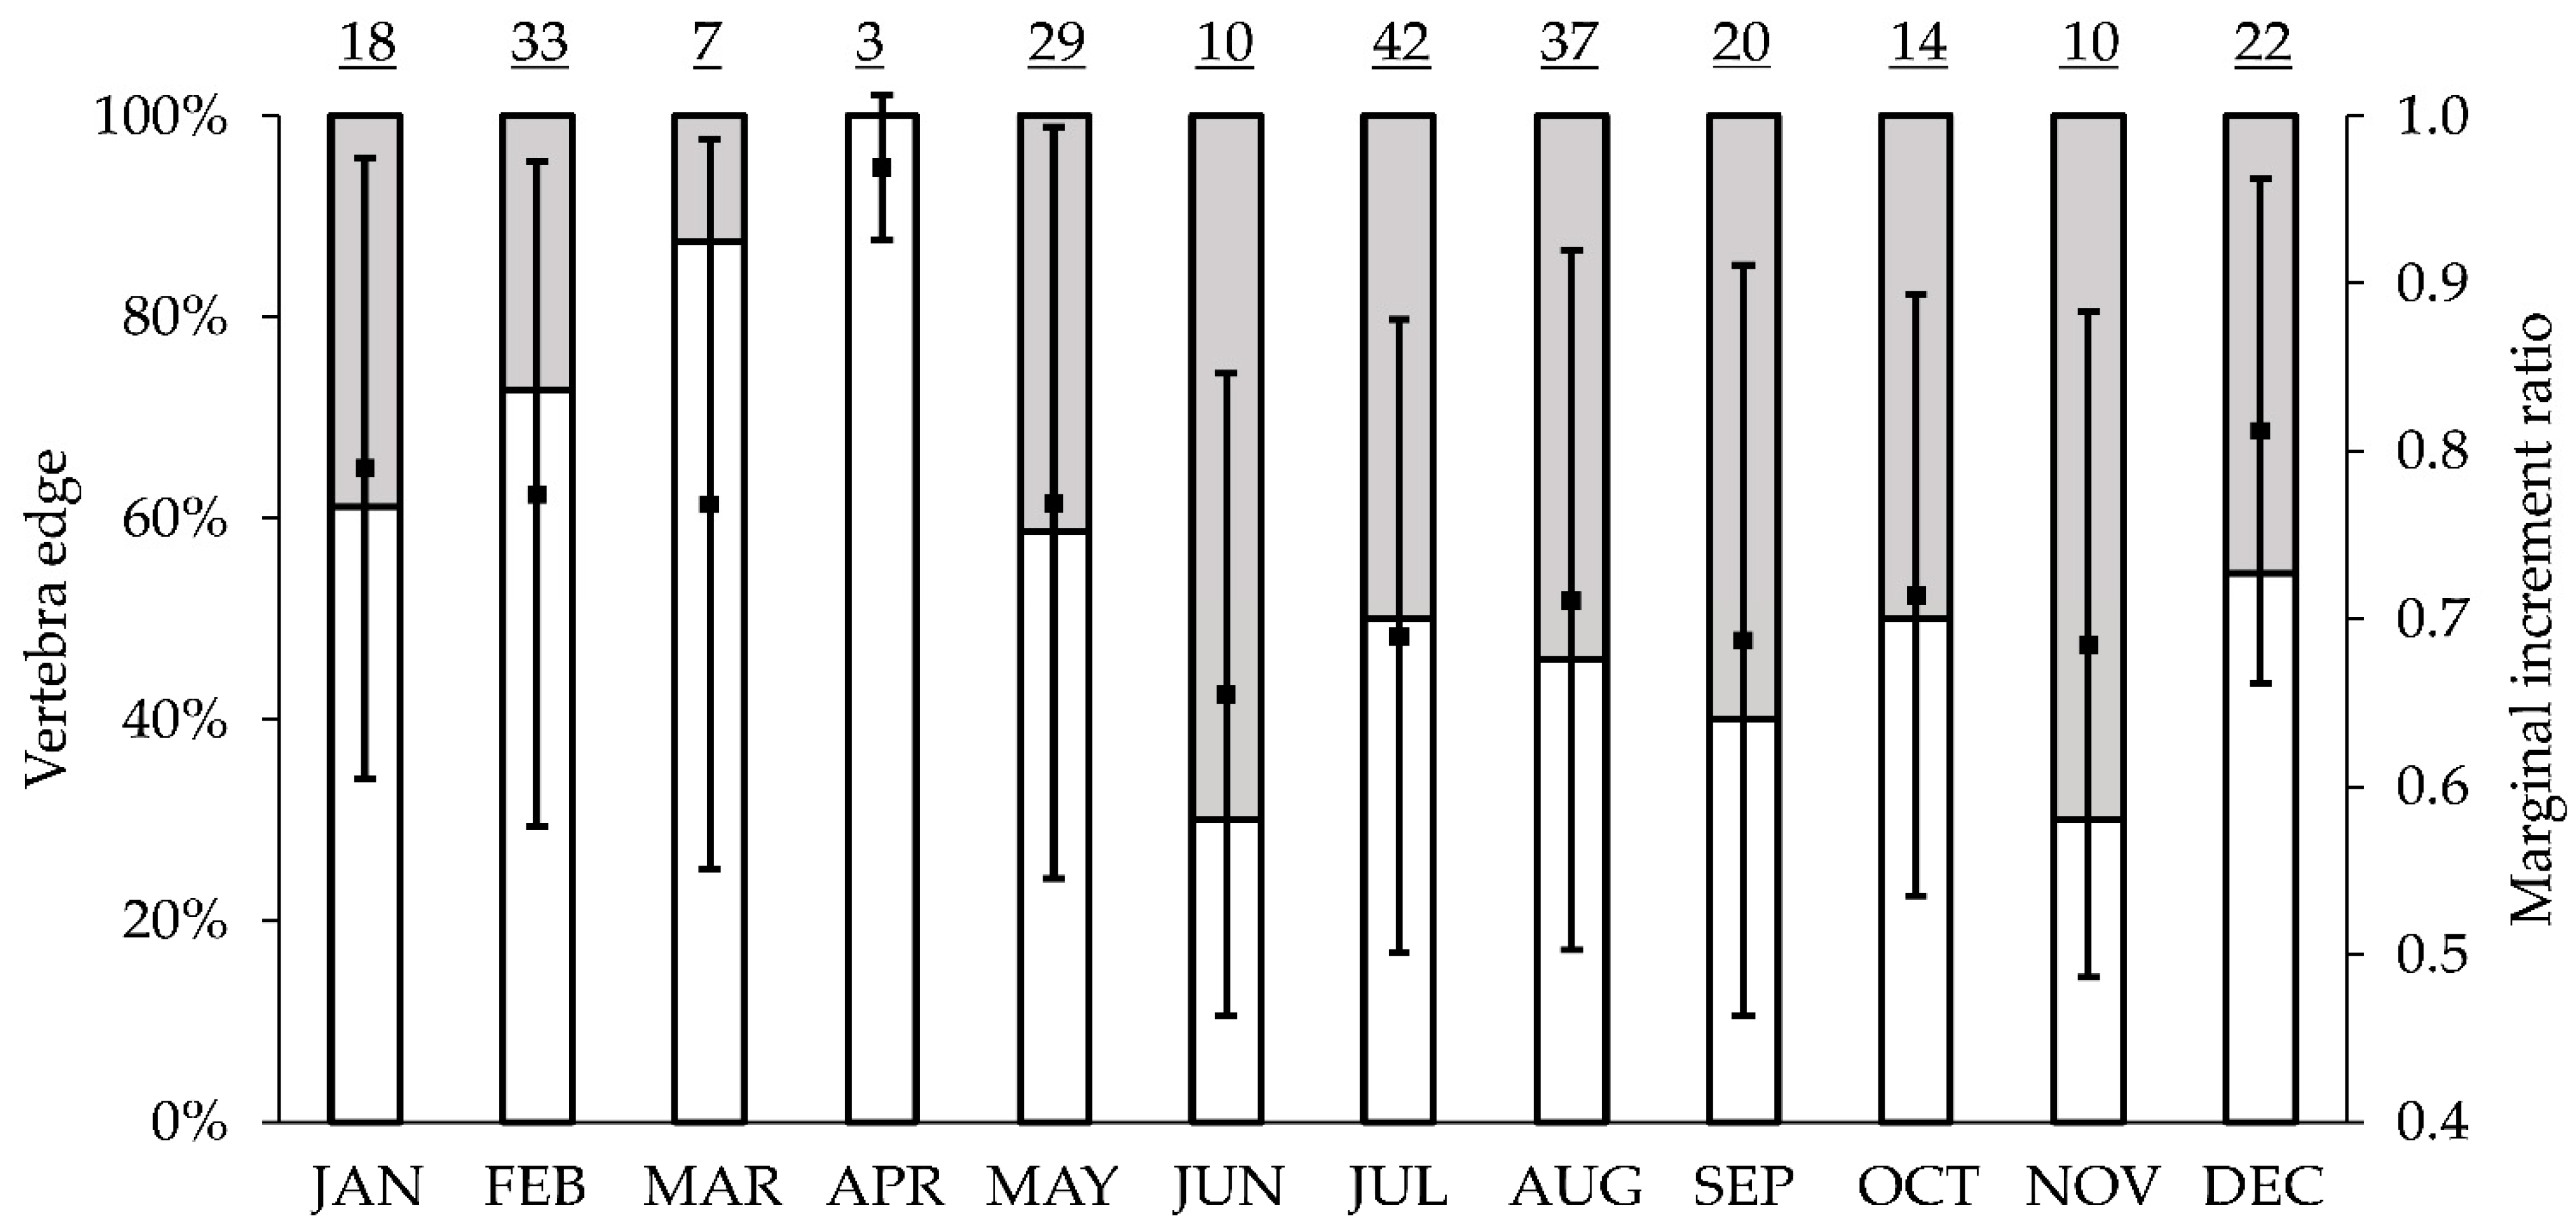
The periodicity of band pair formation was evaluated using two methods. The “centrum edge analysis” considers whether the last deposited band was translucent or opaque and relates it to the month of capture [37]. The “marginal increment analysis” was undertaken by measuring the distance from the last band to the edge of the centrum (marginal width) as a proportion of the distance between the last and the penultimate band pair (previous band pair width; [38]).
M I R = M W P = V R R n R n R n 1
where MIR = the marginal increment ratio, MW = marginal width, P = previous band pair width, VR = the vertebral radius, Rn = the distance from the focus to the last complete growth mark band and Rn−1 = the distance from the centrum origin to the penultimate complete growth mark(Figure 1). Those distances were measured using SigmaScan Pro 5.0.0 Software (SPSS Inc., Chicago, IL, USA). Individuals that presented only one translucent band (referred to as the birth band) were not considered for MIR analysis. Mean MIRs were plotted against months to examine trends in band formation. A Kruskal–Wallis test was used to examine for differences among months, followed by a nonparametric multiple comparison test to find the months among these differences were presented [30]. In addition, a Kolmogorov–Smirnov distribution test was used to examine for differences in age structures between sexes [39].

2.6. Age Adjustment

For the individual age estimation, three data sets were analyzed, one using the growth band counts information (unadjusted) and two more performing an adjustment to age, considering reproductive cycle (Adjustment 1) and time of capture (Adjustment 2). For the unadjusted analysis, it was considered that the birth band formed shortly after parturition, irrespective of reproductive seasonality. Adjustment 1 was adjusted to the period between birth and first band formation. In the study area, N. entemedor has two birth peaks per year, a major one during August and a minor one during January [28]; the month of band formation is April (see Section 3). We considered the birth month to be August; thus, the time between birth and formation of the first band was assumed to be seven months (0.58 years). Adjustment 2, the second age adjustment integrated the capture date; therefore, age was adjusted with the time between the month of band formation and capture month.

2.7. Back-Calculation

Due to the small sample size of juvenile giant electric rays, back-calculated estimates of length at previous ages were calculated for each of the three data sets. Back-calculated lengths were calculated using the proportion-based back-calculation equation proposed by Francis [40], modified from Hile [41]. The equation used to back-calculate the lengths at presumed ages was:
L i = ( a b ) + ( L c + a b ) ( V R i V R c )
where Li is the TL at time i, a and b are parameters obtained from the linear relation between total length and vertebral radius, Lc is the TL at capture; VRc is the VR at capture and VRi is the VR at age i.

2.8. Growth Estimation

A multimodel inference approach was used to determine the most appropriate candidate growth model [42]. The candidate set of models consisted of the traditional 3-parameter von Bertalanffy growth model (VBG-3; [43]); a 2-parameter modified form of the VBG forced through the length-at-birth (L0) (VBG–2; [44]), where L0 was estimated using the largest near-term embryo (i.e., 14.5 cm TL) reported by Burgos-Vázquez et al. [28]; the 3-parameter Gompertz growth model (GG-3) and the logistic model with three parameters (LG-3; [45]).
The four growth models were fitted to a combination of back-calculated lengths and sample data for the three data sets previously described (unadjusted and adjusted ages), and the resulting parameters were estimated and compared. The parameters in the candidate growth models were estimated when the negative log-likelihood was maximized with a nonlinear fit using the generalized reduced gradient method, assuming a multiplicative error in the residuals [46,47]. The objective function is expressed as follows:
l o g L ( θ i | d a t a ) = n [ 1 2 l n ( 2 π ) ] [ 1 2 ( σ 2 ) ( l n T L O l n T L E ) 2 2 σ 2 ]
where n is number of data, i indicates the number of parameters for each candidate growth model selected (VBG-3, VBG-2, GG-3, and LG-3), TLO is the total length observed, and TLE is the total length estimated. For σ, the following analytical solution [48] is proposed:
σ = 1 n t = 1 n ( l n T L O l n T L E ) 2

2.9. Confidence Intervals

To estimate the confidence intervals (CI) of the θi parameters in the candidate growth models, two approaches were used: (1) the likelihood profile method [48] for the parameter t0 because there is no correlation between parameters and (2) the likelihood contour method when there is a correlation between parameters [49,50,51], which is observed in the parameters L and k. For the likelihood profile method, a chi-square distribution with 1 degree of freedom (df) was used, and therefore, values equal to or less than 3.84 were accepted within the CI. For the likelihood contour method, a chi-square distribution with 2 df was used, and values equal to or less than 5.99 were accepted within the CI [30]. The CIs were estimated based on Haddon [49].

2.10. Model Selection

Model performance was evaluated using Akaike’s Information Criterion (AIC), where the best model was the one with the lowest AICc value. For model comparisons, the delta AICAIC) and Akaike weights (wi) were calculated [42]. The ΔAIC is a measure of each model relative to the best model and is calculated as ΔAIC = AICi − minAIC, where AICi is the AIC value for model i and minAIC is the AIC value of the best model. Models with ΔAIC of 0–2 had substantial support, while models with ΔAIC of 4–7 had considerably less support, and models with ΔAIC > 10 had essentially no support. Akaike weights (wi) represent the probability of choosing the correct model from the set of R-candidate models and was calculated as:
w i = e 0.5 Δ A I C i = 1 R e 0.5 Δ A I C

3. Results

3.1. Collection of Samples

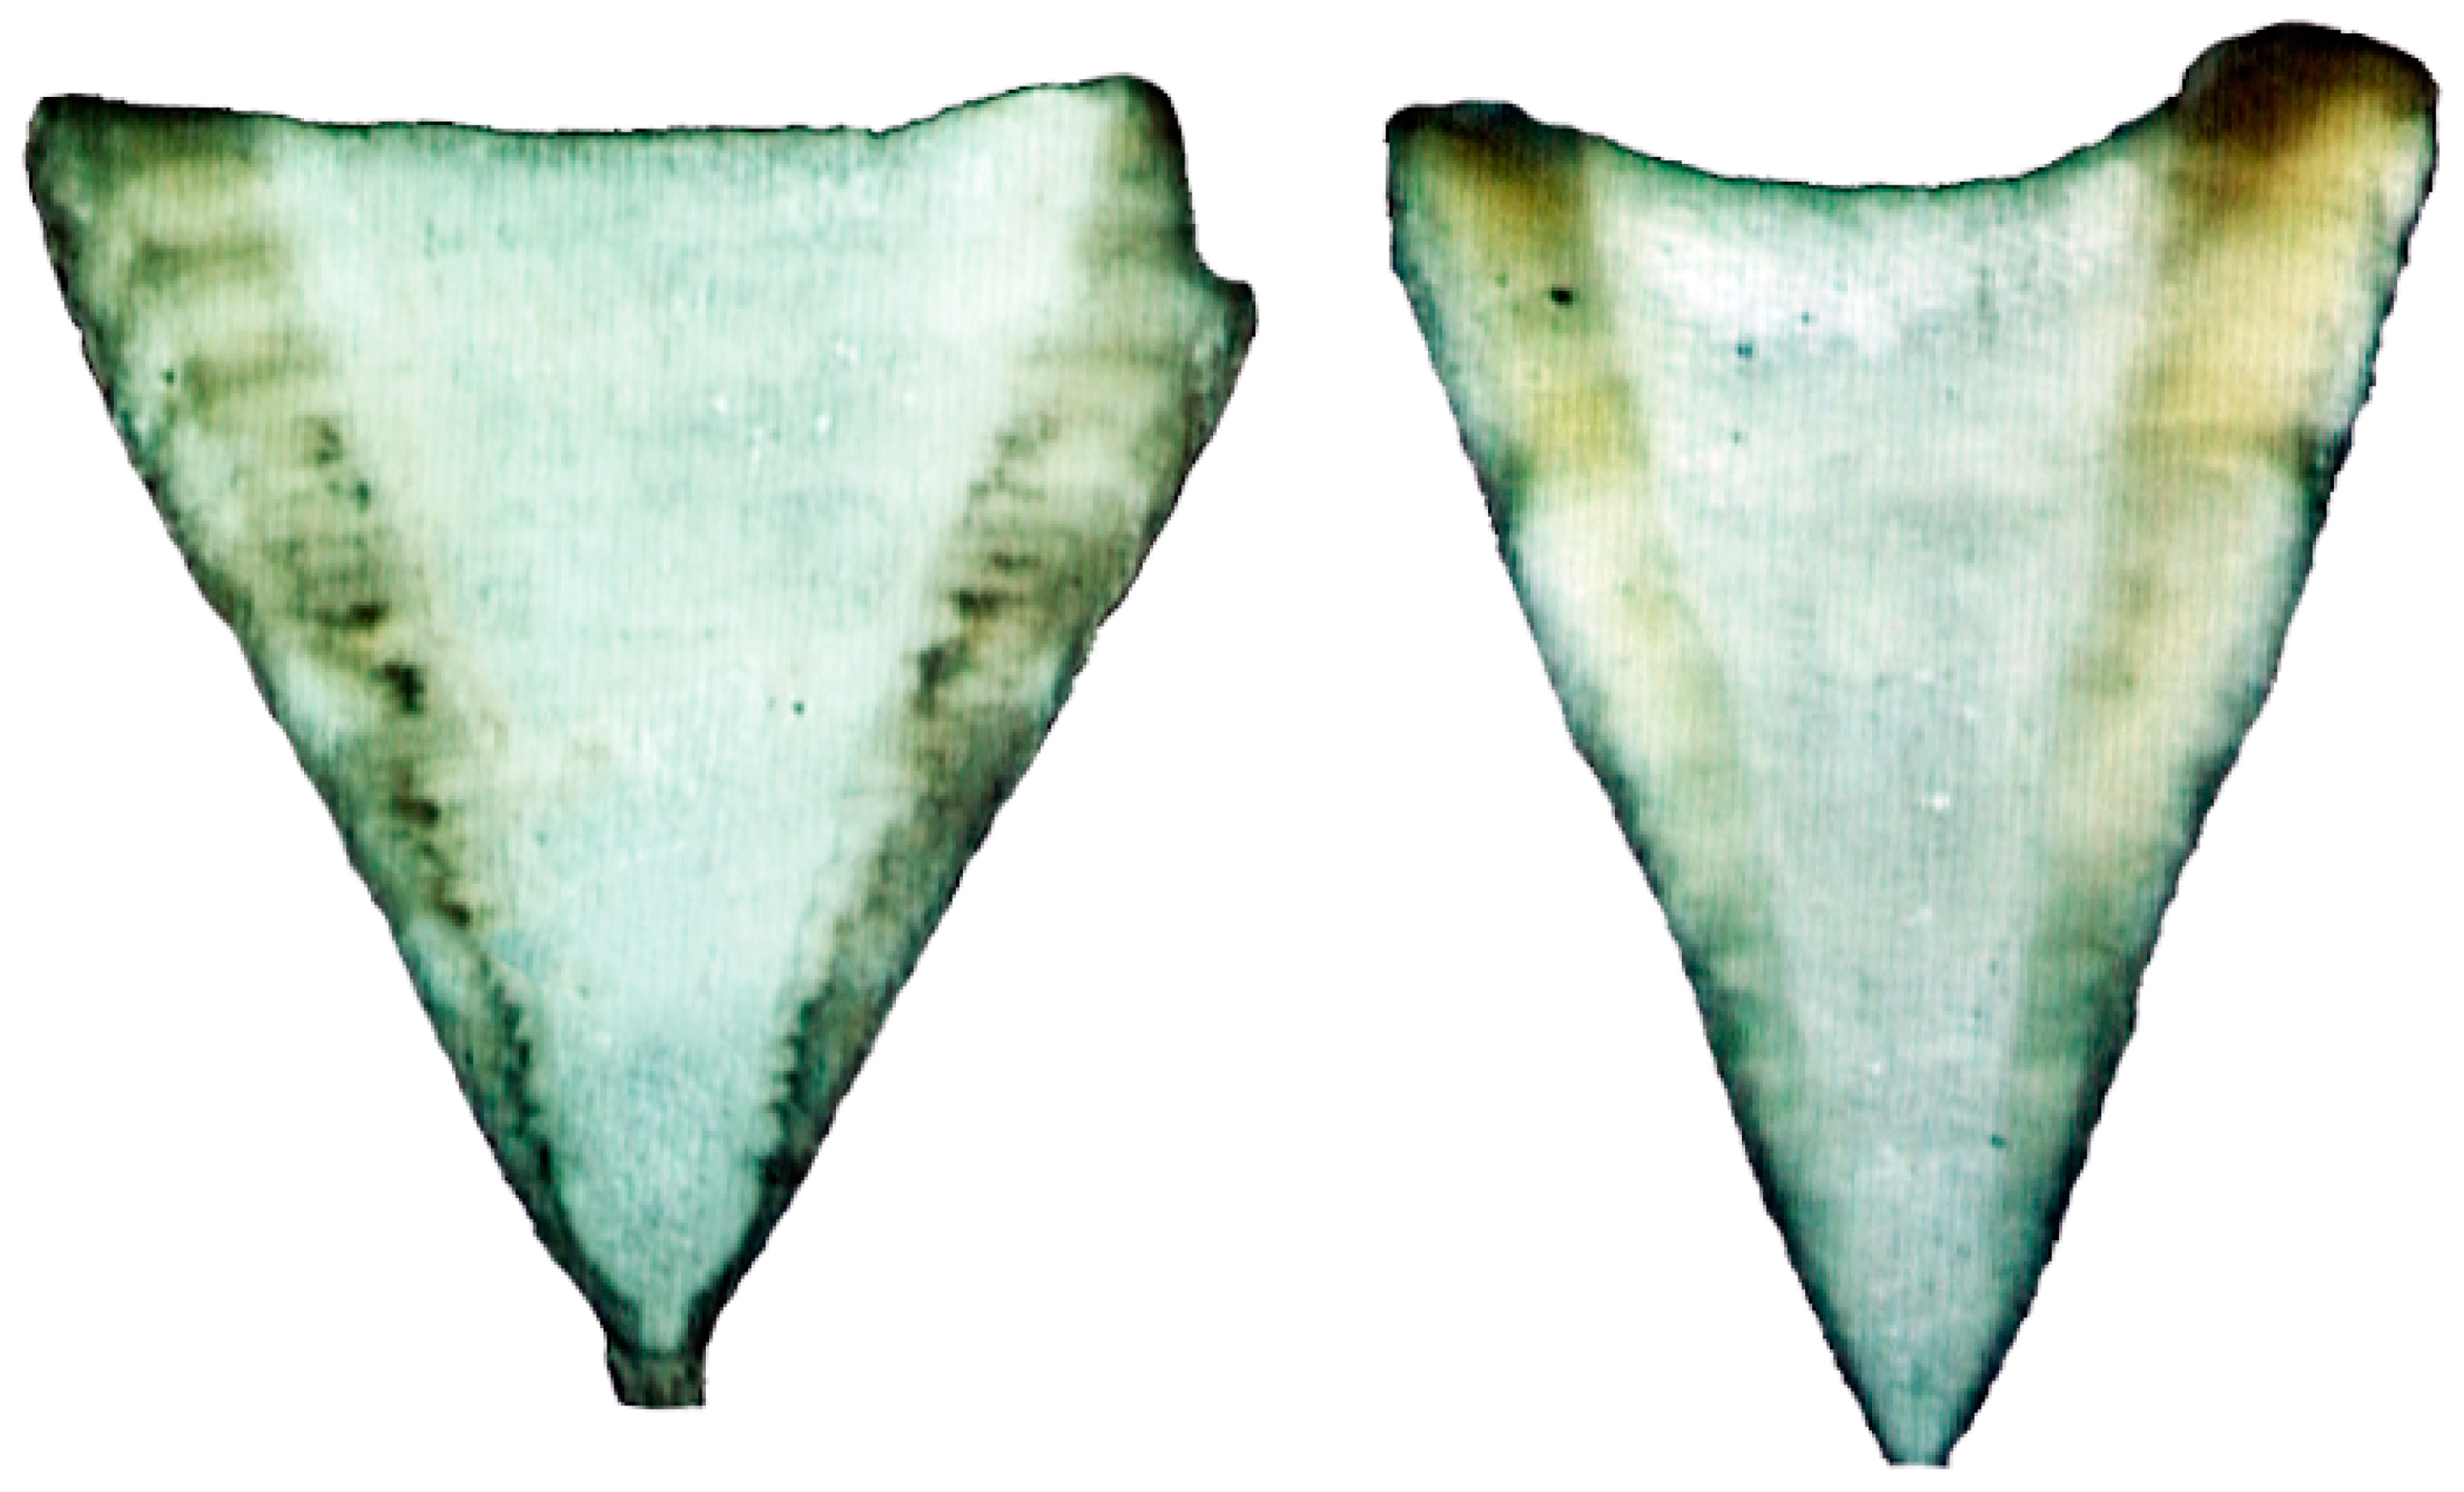
A total of 305 specimens (260 females and 45 males) were initially used for the aging study. Of the processed vertebrae, 245 (80%) were readable from 209 females ranging in size from 49 to 84 cm TL and 36 males ranging from 41.5 to 58.8 cm TL, with females being significantly larger than males (D = 0.84, p < 0.001) and having a well-represented sample for each month of the year (Table 1). Growth bands were poorly visible in the intermedialia zone (Figure 2); therefore, reading was performed on the corpus calcareum. Significant linear relationships between VR and TL (p = 0.001) were found for both sexes (females: TL = 0.08VR−0.65, r2 = 0.81; males: TL = 0.07VR−0.2, r2 = 0.67), verifying that these vertebrae were suitable structures for age determination. The mean radius of the observed birth band was 0.79 ± 0.08 mm (mean and S.E.). Similarly, the mean VR of the near-term embryo was 0.69 ± 0.02 mm TL, indicating that the birth band was identified correctly.

3.2. Precision and Accuracy

Age estimates agreed closely between readers. Age band counts resulted in an APE between readers of 3.3% and CV of 4.7%, with a PA of 69%, PA ± by one band of 95% and PA ± by two bands of 100%. Both age-bias plots (Figure 3) and Bowker’s test of symmetry (X2 = 14.5, df = 9, p = 0.89) indicated no systematic differences between readers. These precision and accuracy values indicate a high level of reproducibility.

3.3. Periodicity of Band Formation

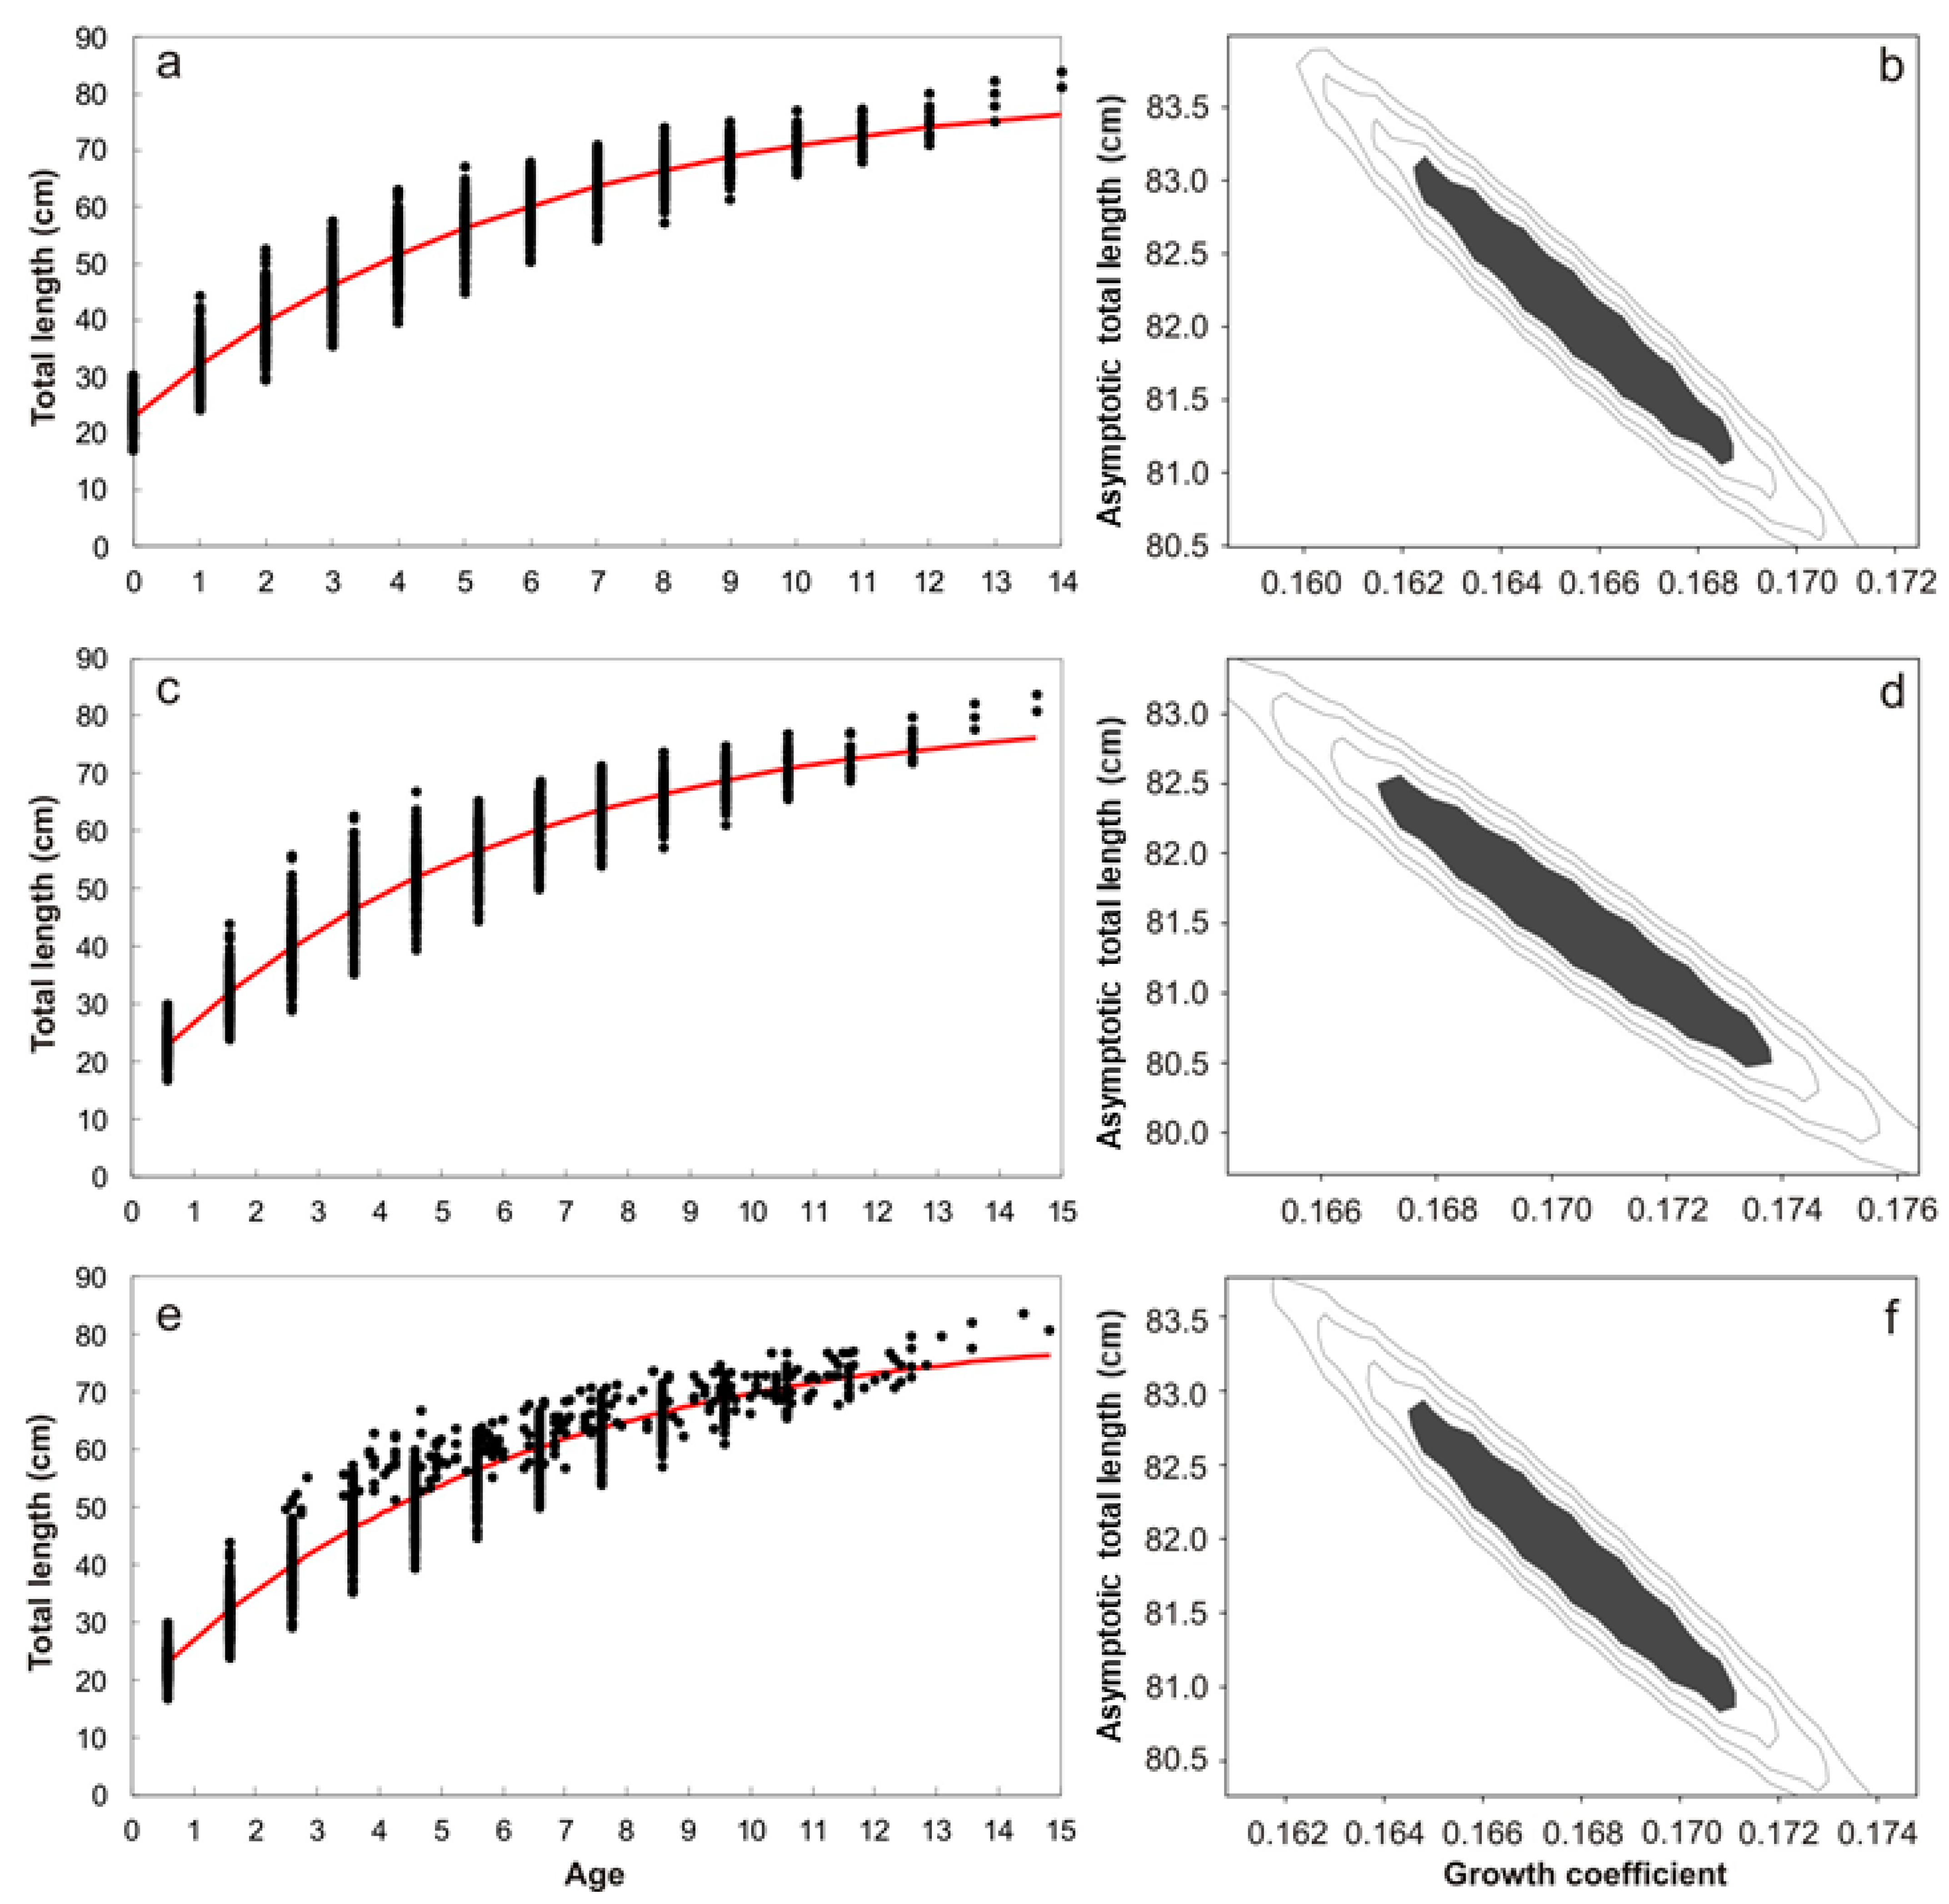
The categorization of growth bands at the edges of the vertebrae as opaque or translucent was possible. There were no differences in monthly marginal increments (Kruskal–Wallis: H11, 246 = 16.7, p = 0.11), although a pattern was observed in both marginal increment analysis and edge analysis (Figure 4). The mean MIR and the translucent edge percentage were highest during April and lowest during June, suggesting that a single band pair is formed annually on the vertebral centra of N. entemedor during April. Assuming the formation of a pair of bands each year, 14 age groups were identified for N. entemedor (Table 2 and Table 3), as well as the formation of a birth band right after birth. The fourth and fifth age groups were predominant, whereas the 14–15 year groups were poorly represented (Figure 5a,c,e). The one-year age group was represented only by males (n = 2), and in the 2-year age group, males were more frequent than females. For the 3–6 year age groups, females were increasingly more frequently than males, which were absent in the remaining age groups. The age structure was different between sexes (D = 0.66, p < 0.001).

3.4. Growth Estimation and Model Selection

Due to a low sample size of males, growth models were only adjusted to the observed and back calculated age-length data of females. Growth models fitted to the data are shown in Table 4, with CIs for growth parameters L and k for each one of the data sets analyzed. Their likelihood contours are shown in Figure 5b,d,f. Based on AIC values, the VBG-3 presented the best fit to the data to describe the growth of N. entemedor females for every data set analyzed (unadjusted and adjusted ages; Table 4 and Figure 5a,c,e). Furthermore, the VBG-3 was the only fitted model with empirical support (Δi = 0) for every data set analyzed, while the rest of the models had no support (Δi > 10). In each dataset, VBG-3 obtained the maximum −log-likelihood values. The VBG-3 unadjusted-age data set showed the maximum −log-likelihood value among the three, while the rest of the parameters varied slightly between data sets, L ranged from 81.5 to 82.1 cm TL, and the estimates were close to the observed maximum length (TL = 84.0 cm); k remained constant at 0.17 cm year−1.

4. Discussion

We found sexual dimorphism by size between sexes, with females (TLmax = 84 cm) being larger than males (TLmax = 58 cm). Similar differences in sizes between sexes were described for N. entemedor by Villavicencio-Garayzar [24] off the west coast of Baja California Sur (Bahía Magdalena) and for other closely-related species, such as N. brasiliensis [52], Torpedo californica [53], T. marmorata [54] and T. nobiliana [55]. This suggests a selective advantage for larger-sized females; as has been mentioned, the larger size in female elasmobranchs facilitates the accommodation and nourishment of embryos [56]. Similarly, the differences in estimated maximum ages between sexes (6 years for males, 14 years for females) suggests both sexes are not equally long-lived. Furthermore, elasmobranch sexual segregation has been documented related to sex differences in body size, which possibly confers differences in attributes such as predation risk and nutritional requirements [57]. Therefore, the absence of males TL > 59 cm (and >6 years old) in our sample could be explained by differential mortality (or differential longevity) or by sexual segregation. In addition, gear selectivity can be ruled out as a factor for the observed differences because the same gear was used during the full study; thus, differences in size and age by sex seem to be characteristic of the species.
In recent decades, the need to perform age validation has been stressed [31,58]. Villavicencio-Garayzar [24] verified the annual deposition through marginal increments for N. entemedor off the west coast of Baja California, concluding that annual band formation occurs during June. Moreover, annual deposition has been verified through marginal increment analysis for another Torpediniformes species, Torpedo marmorata [54], as well as for other batoid species such as Dipturus trachyderma [59], Bathyraja parmifera [60] and Urotrygon rogersi [7]. Accounting for this, annual deposition of a pair of bands was assumed in our study; however, we suggest being cautious since MIR did not show monthly significant differences. A pattern was observed both in MIR and edge analyses which suggests that annual band deposition concludes in April.
Although the VBG-3 model in the unadjusted age data set showed the maximum −log-likelihood value among the three data sets, the length at birth described by this model, as estimated from the intersection of the growth curve with the length axis (L0 = 23.0 cm TL), was the farthest from the length of birth described for the species in the southern Gulf of California (14.5 cm LT; [28]). Considering that the rest of the parameters varied slightly between data sets, according to statistical results (–log-likelihood, AIC and Wi) and biological interpretation (L, k and L0 values), we considered the VBG-3 based on the adjusted age to date of capture (age Adjustment 2) to be the growth model that best describes individual growth of N. entemedor. The multimodel inference approach allows the analysis of an alternative growth hypothesis for N. entemedor and avoids the risk of using an inappropriate model a priori [61].
The estimated ages for females in our study, 2–14 years, were similar to ages, 1–15 years, estimated for females by Villavicencio-Garayzar [24] off the west coast of Peninsula Baja California, Mexico. Nonetheless, the ages found for males in our study were 1–6 years (LT = 41–59 cm), which differed from males aged 1–11 years (LT = 24–67 cm) obtained by Villavicencio-Garayzar [24]. This could be due to differences in longevity between study areas related to differences in environmental conditions (e.g., temperature; [62]) or differences in the spatial distribution of older males since sexual segregation among elasmobranchs have been documented related to sex differences in body size [57].
The L estimated for females in our study (TL = 81.87 cm) was similar to L = 82.6 cm TL estimated for females by Villavicencio-Garayzar [24] and close to the maximum observed length (TL = 84 cm). On the other hand, the growth coefficient estimated for females in our study, k = 0.17 year−1, was lower than k = 0.30 year−1 obtained for females by Villavicencio-Garayzar [24]. In this regard, it has been documented that a limited representation of the sizes in the sample, particularly of small and/or large individuals, can bias parameter estimates using the VBG [63]. However, in our case, the back-calculated lengths at previous ages provided a good representation of younger organisms, and this was observed in the closeness of our L0 estimation to the observed birth length for N. entemedor. Compared with closely-related ray species, our estimation was similar to k = 0.18 year−1 found for combined sexes of T. marmorata [54] but proved higher than k = 0.07 year−1 obtained for T. californica females [53].

5. Conclusions

Acknowledging the difficulty of sampling young individuals, we suggest the use of back-calculation estimations where information associated with early stages is limited. Furthermore, we conclude that age adjustment is a useful practice. Although age has traditionally been analyzed on a yearly basis (as a discrete variable), our study indicated that adjusting age to biological features, such as birth date, catch date and the periodicity of growth band deposition, may result in a more precise description of individual growth. Finally, we conclude that N. entemedor is a moderate body size elasmobranch species with moderate longevity and fast growth, which is a life history pattern typical of species that grow quickly to overcome mortality in the early life stages.

Author Contributions

Conceptualization, P.M.-Z., P.A.M.-F., A.F.N. and V.H.C.-E.; methodology, P.M.-Z., P.A.M.-F., A.F.N., F.N.M.-B., E.M.-B. and X.A.P.-P.; validation, P.M.-Z., P.A.M.-F. and A.F.N.; formal analysis, P.M.-Z., P.A.M.-F., A.F.N., F.N.M.-B., E.M.-B. and X.A.P.-P.; investigation, P.M.-Z., P.A.M.-F., V.H.C.-E., A.F.N., F.N.M.-B., E.M.-B. and X.A.P.-P.; resources, V.H.C.-E.; data curation, P.M.-Z., P.A.M.-F., A.F.N. and F.N.M.-B.; writing—original draft preparation, P.M.-Z., P.A.M.-F., A.F.N., F.N.M.-B., V.H.C.-E., E.M.-B. and X.A.P.-P. writing—review and editing, P.M.-Z., P.A.M.-F., A.F.N., F.N.M.-B., V.H.C.-E., E.M.-B. and X.A.P.-P.; visualization, P.M.-Z., P.A.M.-F., A.F.N., F.N.M.-B., V.H.C.-E., E.M.-B. and X.A.P.-P.; supervision, P.A.M.-F., A.F.N., F.N.M.-B., E.M.-B. and V.H.C.-E.; project administration, V.H.C.-E.; funding acquisition, V.H.C.-E. All authors have read and agreed to the published version of the manuscript.

Funding

This research was funded by the Consejo Nacional de Ciencia y Tecnología de México (SEP-CONACyT/CB-2012/180894) and Instituto Politécnico Nacional, Centro Interdisciplinario de Ciencias Marinas (IPN-SIP/20210127). P.M.-Z. was funded by a scholarship from CONACyT (contract number 422410). A.F.N. and P.A.M.-F. were funded by a postdoctoral fellowship from SEP-CONACyT project (SEP-CONACyT/CB-2012/180894). VHCE and FNMB were supported by programs at the Instituto Politécnico Nacional: Estímulo al Desempeño de los Investigadores (EDI) and Comisión de Operación y Fomento de Actividades Académicas (COFAA). E.M.B. and VHCE are fellowships from Sistema Nacional de Investigadores (CONACyT-SNI).

Institutional Review Board Statement

Ethical review and approval was not required for the animal study because the specimens used within this analysis came from coastal artisanal fishermen from La Paz Bay, Mexico, who have official permits for the activity (CONAPESCA-103053993316-1). We used the animals captured by the fishermen once they are brought to their fishing grounds, at that time the specimens are dead, and we then took advantage for the collection of biological samples. We did not participate in fishing operations, therefore, at no time did we handle live specimens, and thus, the study complies with the ethical guidelines supported by our institution.

Data Availability Statement

Not applicable.

Acknowledgments

The authors thank Juan Higuera and the students of the “Demografía de los batoideos costeros más abundantes en el Pacífico mexicano centro-norte” project for their collaboration in fieldwork and specimen processing. Thanks to Armando Hernández for the final edition of the likelihood contours graphs.

Conflicts of Interest

The authors declare no conflict of interest.

References

  1. Holden, M.J. Elasmobranchs. In Fish Population Dynamics; Gulland, J.A., Ed.; John Wiley & Sons: London, UK, 1977; pp. 187–215. [Google Scholar]
  2. Stevens, J.D. Variable Resilience to Fishing Pressure in Two Sharks: The Significance of Different Ecological and Life History Parameters. In Life in the Slow Lane: Ecology and Conservation of Long-Lived Marine Animals; Musick, J.A., Ed.; American Fisheries Society symposium: Bethesda, MD, USA, 1999; pp. 11–15. Available online: http://hdl.handle.net/102.100.100/214311?index=1 (accessed on 4 November 2021).
  3. Cortés, E.; Arocha, F.; Beerkircher, L.; Carvalho, F.; Domingo, A.; Heupel, M.; Holtzhausen, H.; Santos, M.N.; Ribera, M.; Simpfendorfer, C. Ecological Risk Assessment of Pelagic Sharks Caught in Atlantic Pelagic Longline Fisheries. Aquat. Living Resour. 2010, 23, 25–34. [Google Scholar] [CrossRef]
  4. Coelho, R.; Alpizar-Jara, R.; Erzini, K. Demography of a Deep-Sea Lantern Shark (Etmopterus spinax) Caught in Trawl Fisheries of the Northeastern Atlantic: Application of Leslie Matrices with Incorporated Uncertainties. Deep Sea Res. Part II Top. Stud. Oceanogr. 2015, 115, 64–72. [Google Scholar] [CrossRef] [Green Version]
  5. Walker, P. Sensitive Skates or Resilient Rays? Spatial and Temporal Shifts in Ray Species Composition in the Central and North-Western North Sea between 1930 and the Present Day. ICES J. Mar. Sci. 1998, 55, 392–402. [Google Scholar] [CrossRef]
  6. Simpfendorfer, C.A. Mortality Estimates and Demographic Analysis for the Australian Sharpnose Shark, Rhizoprionodon Taylori, from Northern Australia. Fish. Bull. 1999, 97, 978–986. [Google Scholar] [CrossRef]
  7. Mejía-Falla, P.A.; Cortés, E.; Navia, A.F.; Zapata, F.A. Age and Growth of the Round Stingray Urotrygon rogersi, a Particularly Fast-Growing and Short-Lived Elasmobranch. PLoS ONE 2014, 9, e96077. [Google Scholar] [CrossRef] [PubMed]
  8. Cailliet, G.; Mollet, H.; Pittenger, G.; Bedford, D.; Natanson, L. Growth and Demography of the Pacific Angle Shark (Squatina californica), Based upon Tag Returns off California. Mar. Freshw. Res. 1992, 43, 1313–1330. [Google Scholar] [CrossRef]
  9. Mollet, H.F.; Cailliet, G.M. Comparative Population Demography of Elasmobranchs Using Life History Tables, Leslie Matrices and Stage-Based Matrix Models. Mar. Freshw. Res. 2002, 53, 503–515. [Google Scholar] [CrossRef]
  10. Cortés, E. Chondrichthyan Demographic Modelling: An Essay on Its Use, Abuse and Future. Mar. Freshw. Res. 2007, 58, 4–6. [Google Scholar] [CrossRef]
  11. Cortés, E.; Brooks, E.N.; Gedamke, T. Population dynamics, demography, and stock assessment. In Biology of Sharks and Their Relatives; Carrier, J.C., Musick, J.A., Heithaus, M.R., Eds.; CRC Press, Taylor & Francis Group: Boca Raton, FL, USA, 2012; pp. 453–485. ISBN 084931514X. [Google Scholar]
  12. Pollerspöck, J.; Straube, N. Bibliography database of living/fossil sharks, rays and chimaeras (Chondrichthyes: Elasmobranchii, Holocephali) Papers of the Year 2018. Available online: https://shark-references.com/ (accessed on 9 December 2021).
  13. Cailliet, G.M.; Goldman, K.J. Age determination and validation in chondrichthyan fishes. In Biology of Sharks and Their Relatives; Carrier, J., Musick, J.A., Heithaus, M.R., Eds.; CRC Press: Boca Raton, FL, USA, 2004; pp. 399–439. ISBN 9780203491317. [Google Scholar]
  14. Goldman, K.; Cailliet, G.; Andrews, A.; Natanson, L. Assessing the age and growth of chondrichthyan fishes. In Biology of Sharks and Their Relatives; Carrier, J.C., Musick, J.A., Heithaus, M.R., Eds.; CRC Press: Boca Raton, FL, USA, 2012; pp. 423–451. [Google Scholar]
  15. Cortés, E. Incorporating Uncertainty into Demographic Modeling: Application to Shark Populations and Their Conservation. Conserv. Biol. 2002, 16, 1048–1062. [Google Scholar] [CrossRef]
  16. Dulvy, N.K.; Reynolds, J.D. Predicting Extinction Vulnerability in Skates. Conserv. Biol. 2002, 16, 440–450. [Google Scholar] [CrossRef] [Green Version]
  17. Dulvy, N.K.; Reynolds, J.D. Life history, population dynamics and extinction risks in chondrichthyans. In Biology of Sharks and Their Relatives II: Biodiversity, Adaptive Physiology, and Conservation; Carrier, J., Musick, J.A., Heithaus, M.R., Eds.; CRC Press, Taylor & Francis Group: Boca Raton, FL, USA, 2010; pp. 639–679. [Google Scholar]
  18. Cortés, E. Perspectives on the Intrinsic Rate of Population Growth. Methods Ecol. Evol. 2016, 7, 1136–1145. [Google Scholar] [CrossRef]
  19. Bizzarro, J.J.; Smith, W.D.; Hueter, R.E.; Tyminski, J.; Márquez-farias, J.F.; Castillo-Géniz, J.L.; Cailliet, G.M.; Villavicencio Garayzar, C.J. El Estado Actual de Los Tiburones y Rayas Sujetos a Explotación Comercial En El Golfo de California: Una Investigación Aplicada al Mejoramiento de Su Manejo Pesquero y Conservación; Moss Landing Marine Laboratories Tech. Pub. 2009–02; 2007; Available online: https://aquadocs.org/bitstream/handle/1834/20226/MLML_Tech_Pub_09_02.pdf?sequence=1&isAllowed=y (accessed on 9 December 2021).
  20. Bizzarro, J.J.; Smith, W.D.; Márquez-Farías, J.F.; Tyminski, J.; Hueter, R.E. Temporal Variation in the Artisanal Elasmobranch Fishery of Sonora, Mexico. Fish. Res. 2009, 97, 103–117. [Google Scholar] [CrossRef]
  21. Smith, W.D.; Bizzarro, J.J.J.; Cailliet, G.M. The Artisanal Elasmobranch Fishery on the East Coast of Baja California, Mexico: Characteristics and Management Considerations. Ciencias Marinas. 2009, 35, 209–236. [Google Scholar] [CrossRef] [Green Version]
  22. Ramírez-Amaro, S.R.; Cartamil, D.; Galvan-Magaña, F.; Gonzalez-Barba, G.; Graham, J.B.; Carrera-Fernandez, M.; Escobar-Sanchez, O.; Sosa-Nishizaki, O.; Rochin-Alamillo, A. The artisanal elasmobranch fishery of the Pacific coast of Baja California Sur, Mexico, management implications. Sci. Mar. 2013, 77, 473–487. [Google Scholar] [CrossRef] [Green Version]
  23. Cartamil, D.; Santana-Morales, O.; Escobedo-Olvera, M.; Kacev, D.; Castillo-Geniz, L.; Graham, J.B.; Rubin, R.D.; Sosa-Nishizaki, O. The Artisanal Elasmobranch Fishery of the Pacific Coast of Baja California, Mexico. Fish. Res. 2011, 108, 393–403. [Google Scholar] [CrossRef]
  24. Villavicencio-Garayzar, C.J. Taxonomia, Abundancia Estacional, Edad y Crecimiento y Biologia Reproductiva de Narcine entemedor Jordan y Starks (Chondrichthyes; Narcinidae), En Bahia Almejas, B.C.S, Mexico. Ph.D. Dissertation, Universidad Autónoma de Nuevo León, Nuevo Leon 64460, Mexico, 2000; 138p. [Google Scholar]
  25. Márquez-Farías, J.F. The Artisanal Ray Fishery in the Gulf of California: Development, Fisheries Research and Management Issues. The IUCN/SSC Shark Specialist Group. Shark News 2002, 14, 12–13. [Google Scholar]
  26. González-González, L.; Mejía-Falla, P.A.; Navia, A.F.; de la Cruz-Agüero, G.; Ehemann, N.R.; Peterson, M.S.; Cruz-Escalona, V.H. The Espiritu Santo Island as a Critical Area for Conserving Batoid Assemblage Species within the Gulf of California. Environ. Biol. Fishes 2021, 104, 1359–1379. [Google Scholar] [CrossRef]
  27. Valadez-González, C. Distribución, Abundancia y Alimentación de Las Rayas Bentónicas de La Costa de Jalisco y Colima, México. Ph.D. Dissertation, Centro Interdisciplinario de Ciencias Marinas, La Paz, Mexico, 2007; p. 119. [Google Scholar]
  28. Burgos-Vázquez, M.I.; Mejía-Falla, P.A.; Cruz-Escalona, V.H.; Brown-Peterson, N.J. Reproductive Strategy of the Giant Electric Ray in the Southern Gulf of California. Mar. Coast. Fish. 2017, 9, 577–596. [Google Scholar] [CrossRef] [Green Version]
  29. Goldman, K.K. Age and growth of elasmobranch fishes. In Management Techniques for Elasmobranch Fisheries, FAO Fisheries Tech. Pap., 474; Musick, J.A., Bonfil, R., Eds.; Food and Agriculture Organization of the United Nations: Rome, Italy, 2005; pp. 76–102. ISBN 92-5-105403-7. [Google Scholar]
  30. Zar, J. Biostatistical Analysis; Pearson Prentice-Hall: Hoboken, NJ, USA, 2010; ISBN 9788578110796. [Google Scholar]
  31. Campana, S.E. Accuracy, Precision and Quality Control in Age Determination, Including a Review of the Use and Abuse of Age Validation Methods. J. Fish Biol. 2001, 59, 197–242. [Google Scholar] [CrossRef]
  32. Cailliet, G.M. Elasmobranch age determination and verification: An updated review. In Elasmobranchs as Living Resources: Advances in the Biology, Ecology, Systematics and the Status of the Fisheries; NOAA Technical Report NMFS; Pratt, H.L., Gruber, S.H., Taniuchi, T., Eds.; National Marine Fisheries Service, NOAA: Washington, DC, USA, 1990; pp. 157–165. [Google Scholar]
  33. Beamish, R.J.; Fournier, D.A. A Method for Comparing the Precision of a Set of Age Determinations. Can. J. Fish. Aquat. Sci. 1981, 38, 982–983. [Google Scholar] [CrossRef]
  34. Chang, W.Y.B. A Statistical Method for Evaluating the Reproducibility of Age Determination. Can. J. Fish. Aquat. Sci. 1982, 39, 1208–1210. [Google Scholar] [CrossRef]
  35. Campana, S.E.; Annand, M.C.; McMillan, J.I. Graphical and Statistical Methods for Determining the Consistency of Age Determinations. Trans. Am. Fish. Soc. 1995, 124, 131–138. [Google Scholar] [CrossRef]
  36. Bowker, A.H. A Test for Symmetry in Contingency Tables. J. Am. Stat. Assoc. 1948, 43, 572–574. [Google Scholar] [CrossRef]
  37. Kusher, D.I.; Smith, S.E.; Cailliet, G.M. Validated Age and Growth of the Leopard Shark, Triakis semifasciata, with Comments on Reproduction. Environ. Biol. Fishes 1992, 35, 187–203. [Google Scholar] [CrossRef]
  38. Branstetter, S. Age, Growth and Reproductive Biology of the Silky Shark, Carcharhinus falciformis, and the Scalloped Hammerhead, Sphyrna lewini, from the Northwestern Gulf of Mexico. Environ. Biol. Fishes 1987, 19, 161–173. [Google Scholar] [CrossRef]
  39. Metochis, C.P.; Carmona-Antoñanzas, G.; Kousteni, V.; Damalas, D.; Megalofonou, P. Population Structure and Aspects of the Reproductive Biology of the Blackmouth Catshark, Galeus Melastomus Rafinesque, 1810 (Chondrichthyes: Scyliorhinidae) Caught Accidentally off the Greek Coasts. J. Mar. Biol. Assoc. UK 2018, 98, 909–925. [Google Scholar] [CrossRef]
  40. Francis, R.I.C.C. Back-Calculation of Fish Length: A Critical Review. J. Fish Biol. 1990, 36, 883–902. [Google Scholar] [CrossRef]
  41. Hile, R. Age and Growth of the Rock Bass, Ambloplites rupestris (Rafinesque), in Nebish Lake, Wisconsin. Trans. Wis. Acad. Sci. Arts Lett. 1941, 33, 189–337. [Google Scholar]
  42. Burnham, K.P.; Anderson, D.R. Model Selection and Multimodel Inference: A Practical Information Theoretic Approach, 2nd ed.; Springer: New York, NY, USA, 2002; ISBN 0387953647. [Google Scholar]
  43. von Bertalanffy, L. A Quantitative Theory of Organic Growth (Inquiries on Growth Laws II). Hum. Biol. 1938, 10, 181–213. [Google Scholar]
  44. Fabens, A.J. Properties and Fitting of the Von Bertalanffy Growth Curve. Growth 1965, 29, 265–289. [Google Scholar]
  45. Ricker, W.E. Computation and Interpretation of Biological Statistics of Fish Populations. Bull. Fish. Res. Board Can. 1975, 191, 1–382. [Google Scholar] [CrossRef]
  46. Wang, Y.; Liu, Q. Comparison of Akaike Information Criterion (AIC) and Bayesian Information Criterion (BIC) in Selection of Stock-Recruitment Relationships. Fish. Res. 2006, 77, 220–225. [Google Scholar] [CrossRef]
  47. García-Borbón, J.A.; Morales-Bojórquez, E.; Aguirre-Villaseñor, H. Long-Term Changes in the Fraction of Mature Brown Shrimp Farfantepenaeus californiensis (Holmes, 1900) Females and Their Impact on Length at First Maturity. J. Shellfish. Res. 2018, 37, 1103–1111. [Google Scholar] [CrossRef]
  48. Hilborn, R.; Mangel, M. The Ecological Detective. Confronting Models with Data, 1st ed.; Princeton University Press: Princeton, NJ, USA, 1997. [Google Scholar]
  49. Haddon, M. Modelling and Quantitative Methods in Fisheries; Statistics/Biology; Chapman and Hall: Boca Raton, FL, USA, 2001; ISBN 9781584881773. [Google Scholar]
  50. Cerdenares-Ladrón de Guevara, G.; Morales-Bojórquez, E.; Rodriguez-Sánchez, R. Age and Growth of the Sailfish Istiophorus Platypterus (Istiophoridae) in the Gulf of Tehuantepec, Mexico. Mar. Biol. Res. 2011, 7, 488–499. [Google Scholar] [CrossRef]
  51. Luquin-Covarrubias, M.A.; Morales-Bojórquez, E.; González-Peláez, S.S.; Hidalgo-De-La-Toba, J.Á.; Lluch-Cota, D.B. Modeling of Growth Depensation of Geoduck Clam Panopea Globosa Based on a Multimodel Inference Approach. J. Shellfish. Res. 2016, 35, 379–387. [Google Scholar] [CrossRef]
  52. Rolim, F.; Caltabellotta, F.; Rotundo, M.; Vaske-Júnior, T. Sexual Dimorphism Based on Body Proportions and Ontogenetic Changes in the Brazilian Electric Ray Narcine Brasiliensis (von Olfers, 1831) (Chondrichthyes: Narcinidae). Afr. J. Mar. Sci. 2015, 37, 167–176. [Google Scholar] [CrossRef] [Green Version]
  53. Neer, J.A.; Cailliet, G.M. Aspects of the Life History of the Pacific Electric Ray, Torpedo californica (Ayres). Copeia 2001, 2001, 842–847. [Google Scholar] [CrossRef]
  54. Omer, V.D.; Basusta, N. Age and Growth Characteristics of Marbled Electric Ray Torpedo marmorata (Risso, 1810) Inhabiting Iskenderun Bay, North-Eastern Mediterranean Sea. Turk. J. Fish. Aquat. Sci. 2013, 13, 541–549. [Google Scholar] [CrossRef]
  55. Kaya, G.; Basusta, N. A Study on Age and Growth of Juvenile and Semi Adult Torpedo nobiliana Bonaparte, 1835 Inhabiting Iskenderun Bay, Northeastern Mediterranean Sea. Acta Biol. Turc. 2016, 29, 143–149. [Google Scholar]
  56. Hamlett, W.C. Reproductive Biology and Phylogeny of Chondrichthyes: Sharks, Batoids and Chimaeras. In Reproductive Biology and Phylogeny; Hamlett, W.C., Ed.; Science Publishers, Inc.: Enfield, NH, USA, 2005; ISBN 9781578082711. [Google Scholar]
  57. Wearmouth, V.J.; Sims, D.W. Sexual Segregation in Marine Fish, Reptiles, Birds and Mammals Behaviour Patterns, Mechanisms and Conservation Implications. Adv. Mar. Biol. 2008, 54, 107–170. [Google Scholar] [CrossRef] [PubMed]
  58. Cailliet, G.; Martin, D.; Kusher, P.; Wolf, B.; Welde, A. Techniques for Enhancing Vertebral Bands in Age Estimation of California Elasmobranchs. In Proceedings of an International Workshop on Age Determination of Oceanic Pelagic Fishes: Tunas, Billfishes, and Sharks, NOAA Tech. Rep. NMFS 8; Prince, E.D., Pulos, L.M., Eds.; National Marine Fisheries Service, NOAA: Miami, FL, USA, 1983; pp. 157–165. [Google Scholar]
  59. Licandeo, R.; Cerna, F.; Céspedes, R. Age, Growth, and Reproduction of the Roughskin Skate, Dipturus trachyderma, from the Southeastern Pacific. ICES J. Mar. Sci. 2007, 64, 141–148. [Google Scholar] [CrossRef]
  60. Matta, M.E.; Gunderson, D.R. Age, Growth, Maturity, and Mortality of the Alaska Skate, Bathyraja parmifera, in the Eastern Bering Sea. Environ. Biol. Fishes 2007, 80, 309–323. [Google Scholar] [CrossRef]
  61. Smart, J.J.; Chin, A.; Tobin, A.J.; Simpfendorfer, C.A. Multimodel Approaches in Shark and Ray Growth Studies: Strengths, Weaknesses and the Future. Fish Fish. 2016, 17, 955–971. [Google Scholar] [CrossRef]
  62. Keil, G.; Cummings, E.; de Magalhães, J.P. Being Cool: How Body Temperature Influences Ageing and Longevity. Biogerontology 2015, 16, 383–397. [Google Scholar] [CrossRef] [PubMed] [Green Version]
  63. Cailliet, G.; Tanaka, S. Recommendations for research needed to better understand the age and growth of elasmobranchs. In Elasmobranchs as Living Resources: Advances in the Biology, Ecology, Systematics, and the Status of the Fisheries; Pratt, W.S., Jr., Gruber, S.H., Taniuchi, T., Eds.; National Marine Fisheries Service, NOAA: Washington, DC, USA, 1990; pp. 505–507. [Google Scholar]
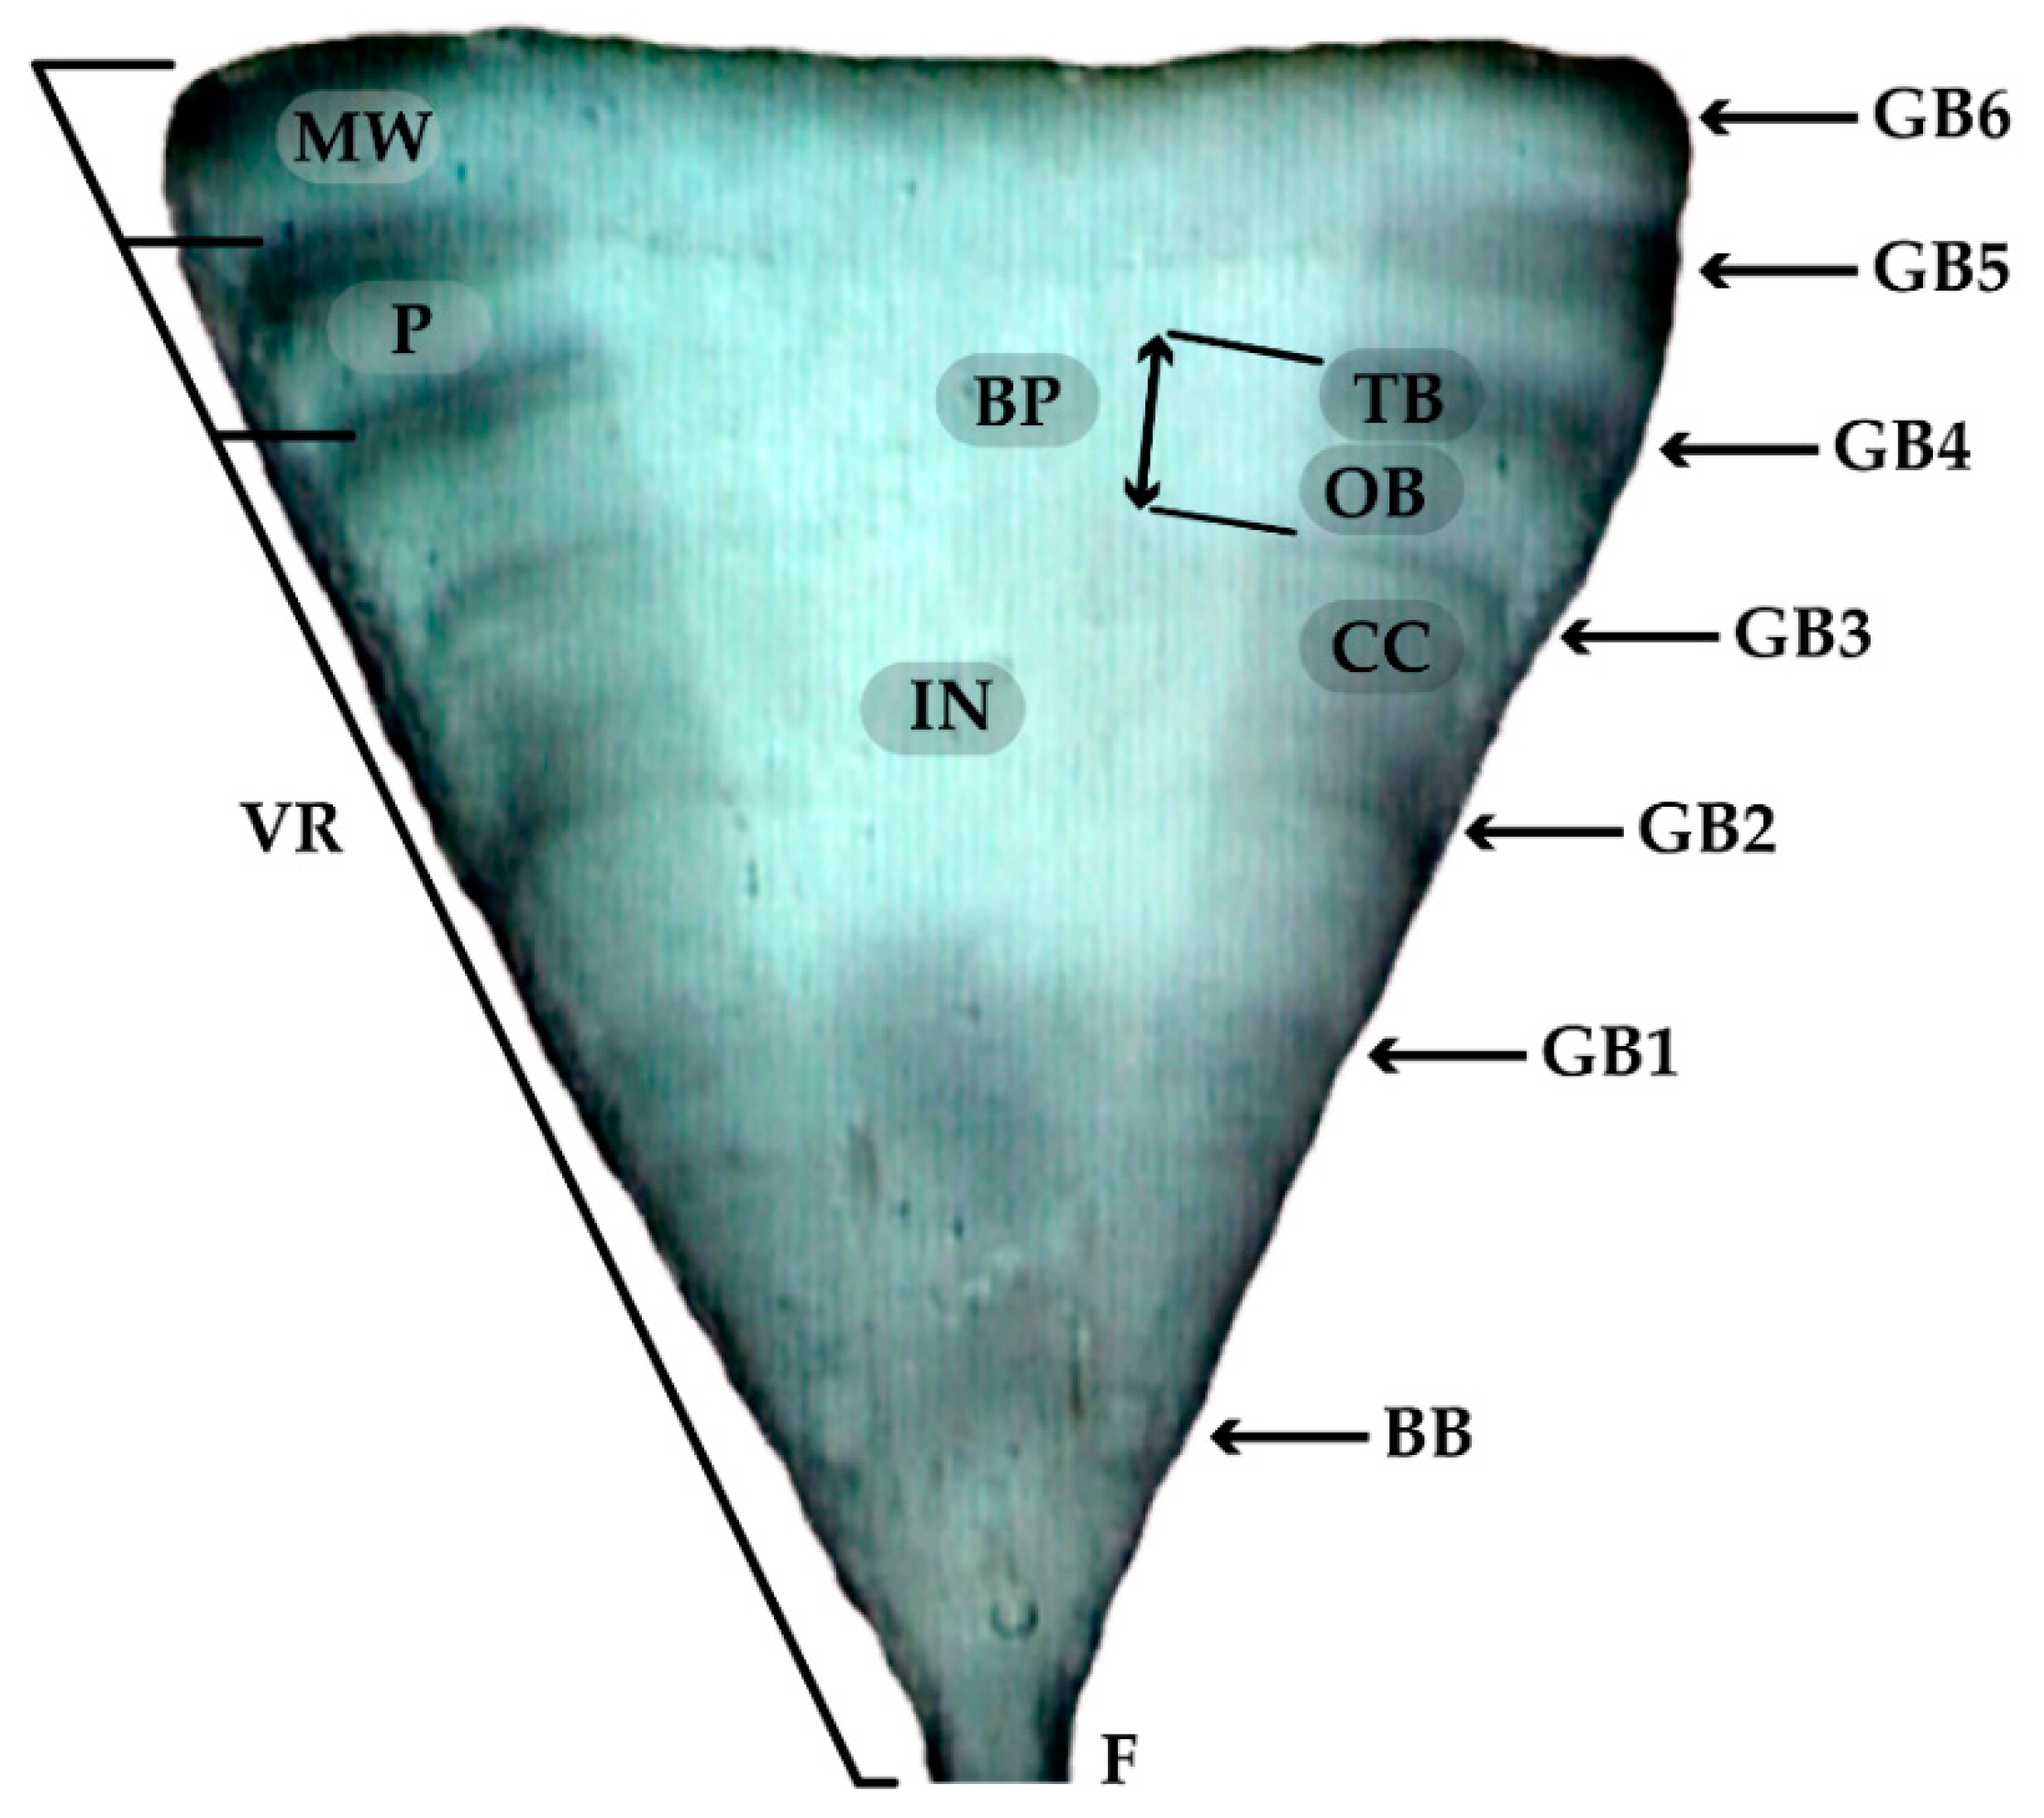
Figure 1. Sagittal section of a centrum of a six-year-old Narcine entemedor specimen, showing MW, marginal width; P, previous band pair width; VR, the vertebral radius; F, focus; CC, corpus calcareum; IN, intermedialia zone; BP, band pair; OB, opaque band; TB, translucent band; BB, birth band; GB, growth bands.
Animals 12 00019 g001
Figure 2. Sagittal sections of centra where growth bands were not evident and could not be read.
Animals 12 00019 g002
Figure 3. Age-bias plot of reader band-pair counts. Dots with standard deviation bars are the mean counts of reader 2 relative to reader 1. The diagonal line indicates a one-to-one relationship.
Animals 12 00019 g003
Figure 4. Monthly variations in vertebra edge and marginal increment ratios (MIR). Monthly frequency of translucent (□) and opaque bands ( Animals 12 00019 i001) determined from thin sections and monthly variation of mean MIR. Sample size is indicated on top of the graph; (▪) mean monthly MIR; bars show the standard error for monthly values.
Animals 12 00019 g004
Figure 5. Growth curves and likelihood contours for L (asymptotic total length) and k (growth coefficient), estimated for VBG-3 for three different data sets: unadjusted (a,b), adjusted to reproductive cycle (c,d) and adjusted to reproductive cycle and date of capture (e,f). For growth curves, black dots represent the observed and back-calculated data, and the red lines represent estimated growth. For likelihood contours, shaded areas denote the confidence region for L and k, assuming a chi-square distribution with n = 2 df.
Animals 12 00019 g005
Table 1. Monthly sample size of Narcine entemedor specimens analyzed in the present study.
MonthJanuaryFebruaryMarchAprilMayJuneJulyAugustSeptemberOctoberNovemberDecember
Sample size1833732910423720141022
Table 2. Age–length distribution for Narcine entemedor obtained from growth band counts of vertebrae sections. Age estimation follows the age adjustment 2 (adjusted to reproductive cycle and date of capture).
Total Length (cm)Age Group (Down-Rounded)Total
1234567891011121314
42 1 1
44 2 2
46 0
48211 4
50 13 1 5
52 5 5 10
54 145 1 11
56 11103 15
58 46331 17
60 3793 22
62 13126 22
64 137221 16
66 35731 19
68 1 35131 14
70 352561 22
72 416821 22
74 34853 23
76 22122 9
78 242 8
80 0
82 112
84 11
Total212184038262413212614812245
Table 3. Age–length distribution for Narcine entemedor obtained from growth band counts of vertebrae sections and back-calculated. Age estimation follows the age adjustment 2 (adjusted to reproductive cycle and date of capture).
Total Length (cm)Age Group (Down-Rounded)
01234567891011121314Total
16 1 1
183 3
2010 10
2259 59
2478 78
26674 71
281419 33
309372 48
325483 56
34 6310 73
36 31252 58
38 27345 66
40 64871 62
42 749162 74
44 225315 63
46 1234182 75
48 21644194 85
50 338327 80
52 82245114 90
54 11333248 79
56 19403183 92
58 621322571 92
60 3133419122 83
62 1423261961 80
64 13142221181 80
66 3162315121 70
68 1 71221155 61
70 3111417143 62
72 55161251 44
74 381274 34
76 22443 15
78 2531 11
80 0
82 1113
84 112
Total2452472482392271851381138773502412321893
Table 4. Growth model parameter estimates of female N. entemedor using three different data sets (unadjusted, adjusted to reproductive cycle (RC) and adjusted to the reproductive cycle and date of capture (DC); see text for details). L is the theoretical asymptotic size, k is the growth coefficient, L0 is the birth size estimated at age 0, t0 is the hypothetical age at length zero, −LL is negative log-likelihood, AIC is Akaike’s Information Criterion, Δi is the Akaike difference, and Wi is the AIC weight estimates. CIs estimated from log-likelihood contours are shown in parentheses.
DatasetModelLkt0L0−LLAICΔiWi
UnadjustedVBG-382.09
(80.59–83.69)
0.165
(0.170–0.173)
−1.988
(−2.008–−1.968)
23.013507.23−7008.450.001.00
VBG-269.35
(67.25–71.65)
0.314
(0.294–0.334)
-14.502158.51−4313.032695.430.00
GG-373.49
(72.89–74.14)
0.301
(0.292–0.310)
0.46
(0.437–0.477)
23.323486.66−6967.3141.140.00
LG-369.79
(69.44–70.14)
0.444
(0.435–0.453)
1.500
(1.475–1.525)
23.693439.89−6873.77134.680.00
Adjusted-RCVBG-381.50
(80.0–83.10)
0.170
(0.165–0.175)
−1.363
(−1.383–−1.343)
16.893413.10−6820.200.001.00
VBG-275.52
(74.02–77.12)
0.215
(0.206–0.224)
-14.503352.04−6700.08120.110.00
GG-373.16
(72.51–73.81)
0.308
(0.299–0.317)
1.020
(0.999–1.039)
18.603395.95−6785.9034.300.00
LG-369.53
(69.39–70.19)
0.454
(0.434–0.455)
2.040
(2.017–2.067)
19.713354.06−6702.12118.080.00
Adjusted-DCVBG-381.87
(80.37–83.47)
0.168
(0.163–0.173)
−1.384
(−1.404–−1.364)
16.963454.00−6902.000.001.00
VBG-275.59
(74.09–77.19)
0.213
(0.204–0.222)
-14.503386.07−6768.15133.850.00
GG-373.36
(72.71–74.01)
0.305
(0.296–0.314)
1.030
(1.011–1.051)
18.653436.19−6866.3935.610.00
LG-369.70
(69.35–70.05)
0.449
(0.439–0.460)
2.063
(2.040–2.090)
19.773392.80−6779.60122.400.00
Publisher’s Note: MDPI stays neutral with regard to jurisdictional claims in published maps and institutional affiliations.