
Modeling of Chilled/Supercooled Pork Storage Quality Based on the Entropy Weight Method


Abstract
:Simple Summary
Abstract
1. Introduction
2. Materials and Methods
2.1. Meat Preparation and Treatment
2.2. Analyses of Pork Quality Indices
2.2.1. Determination of Drip Loss
2.2.2. Determination of Color
2.2.3. Determination of Shear Force
2.2.4. Determination of Total Aerobic Count (TAC)
2.2.5. Determination of Lipid Oxidation
2.2.6. Determination of Total Volatile Basic Nitrogen (TVB-N)
2.3. Modelling
2.3.1. The Entropy Weight of Each Index
2.3.2. The Calculation of Comprehensive Quality
2.3.3. Chemical Reaction Kinetics
2.3.4. Arrhenius Equation
2.4. Statistical Analysis
3. Results
3.1. Analyses of Pork Quality Indices
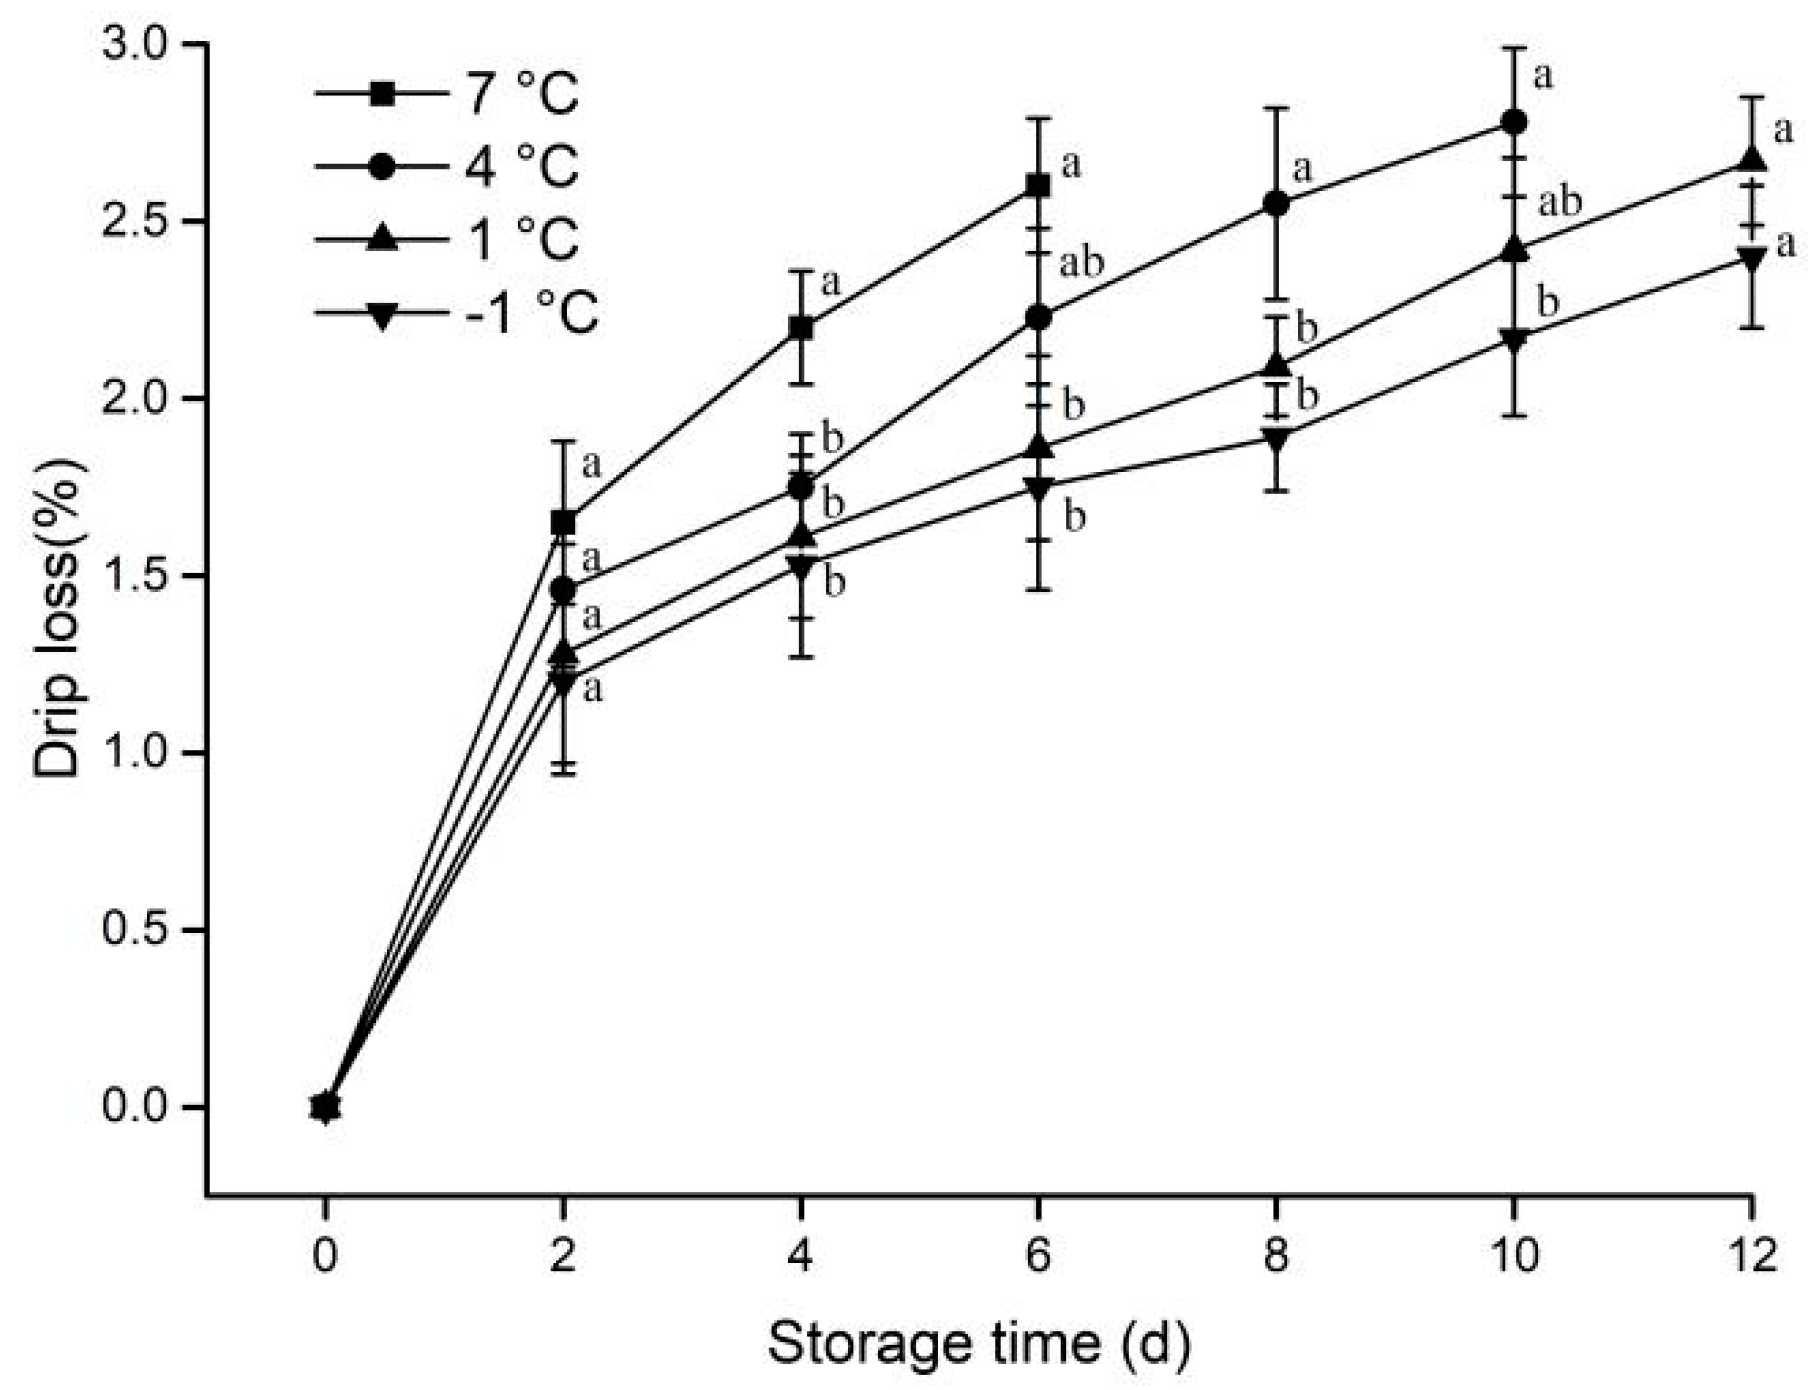
3.1.1. Drip Loss
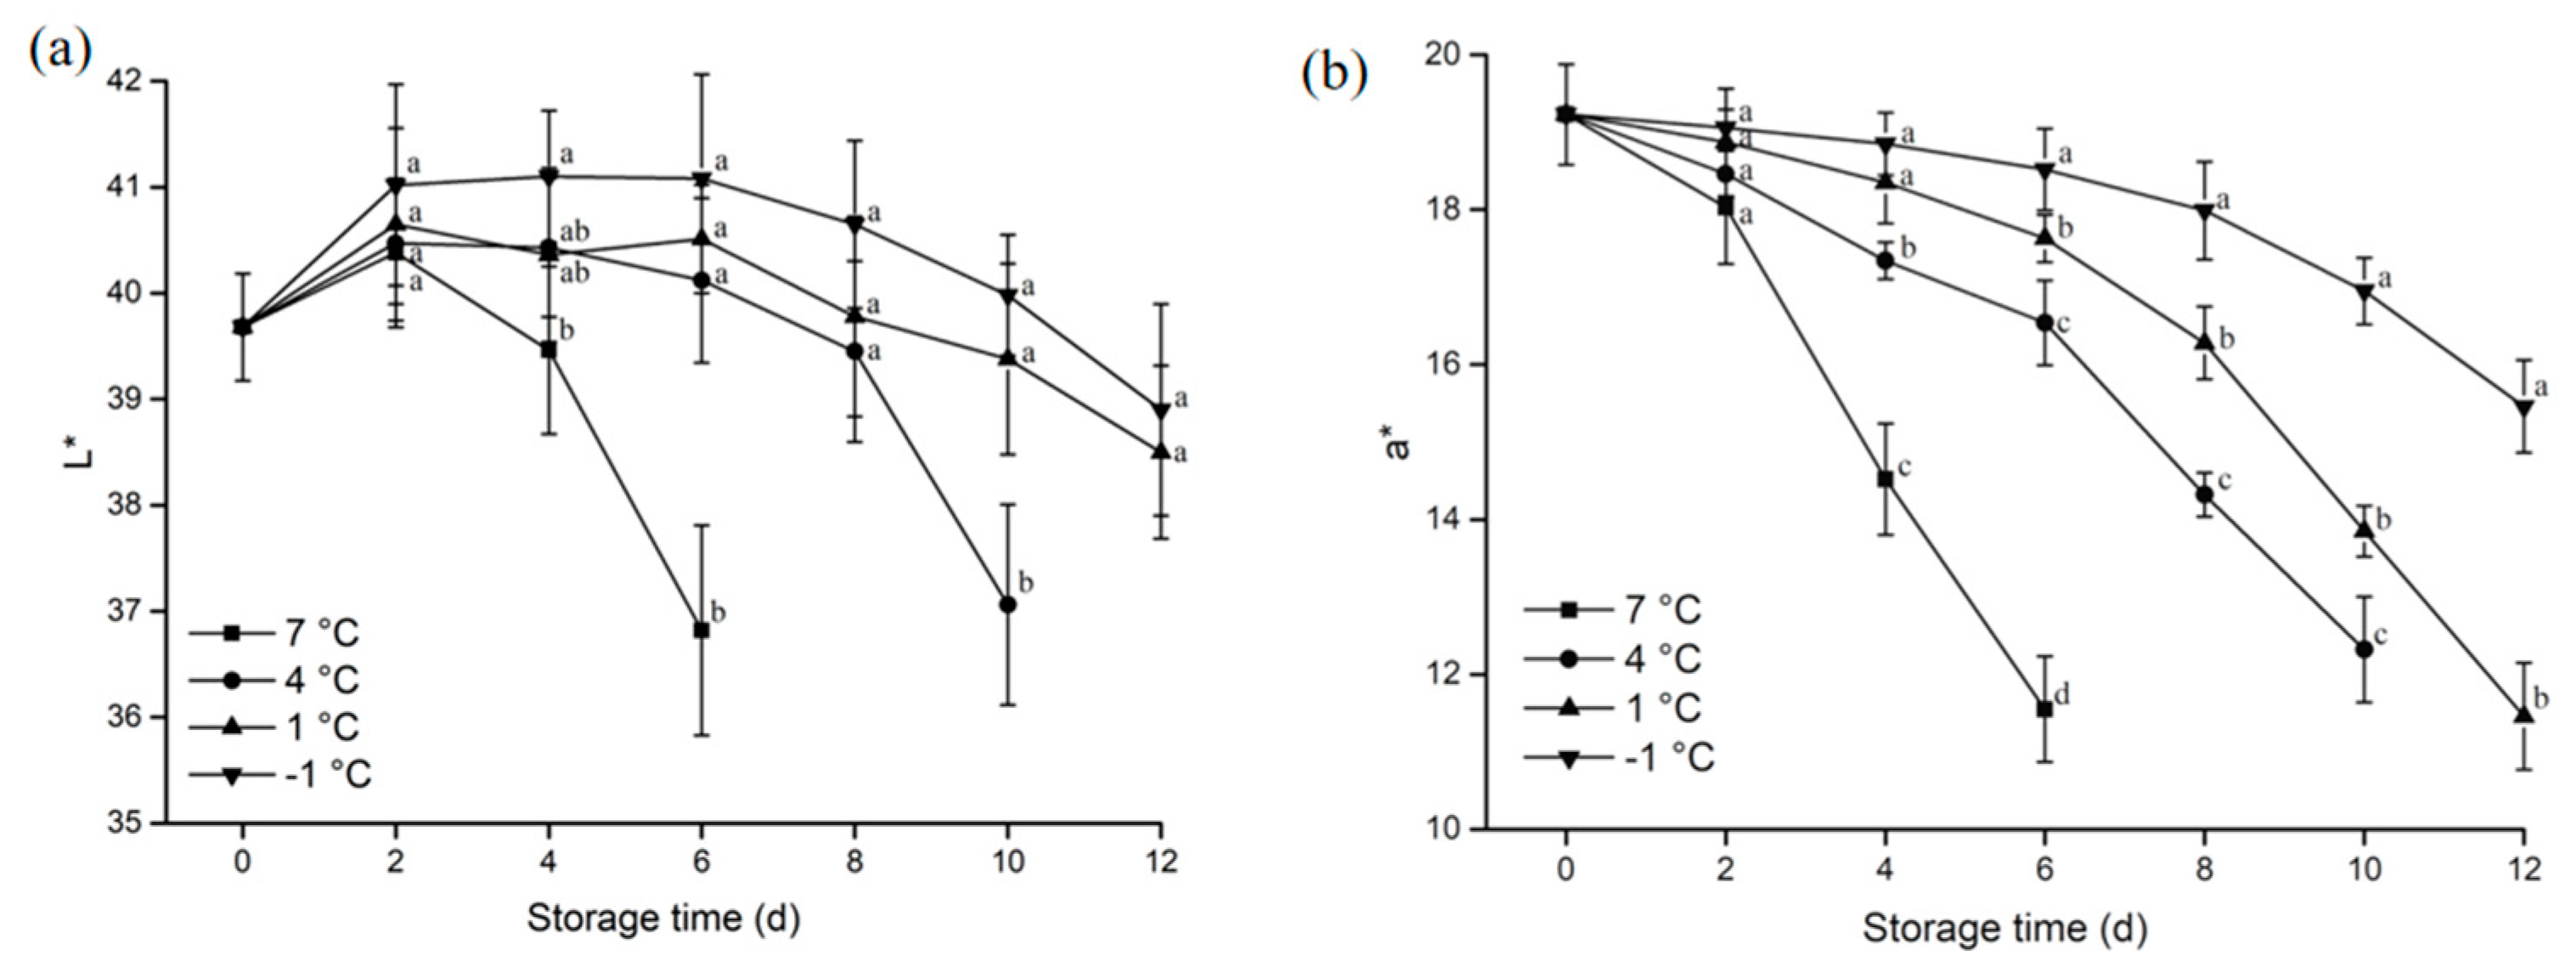
3.1.2. Color
3.1.3. Shear Force
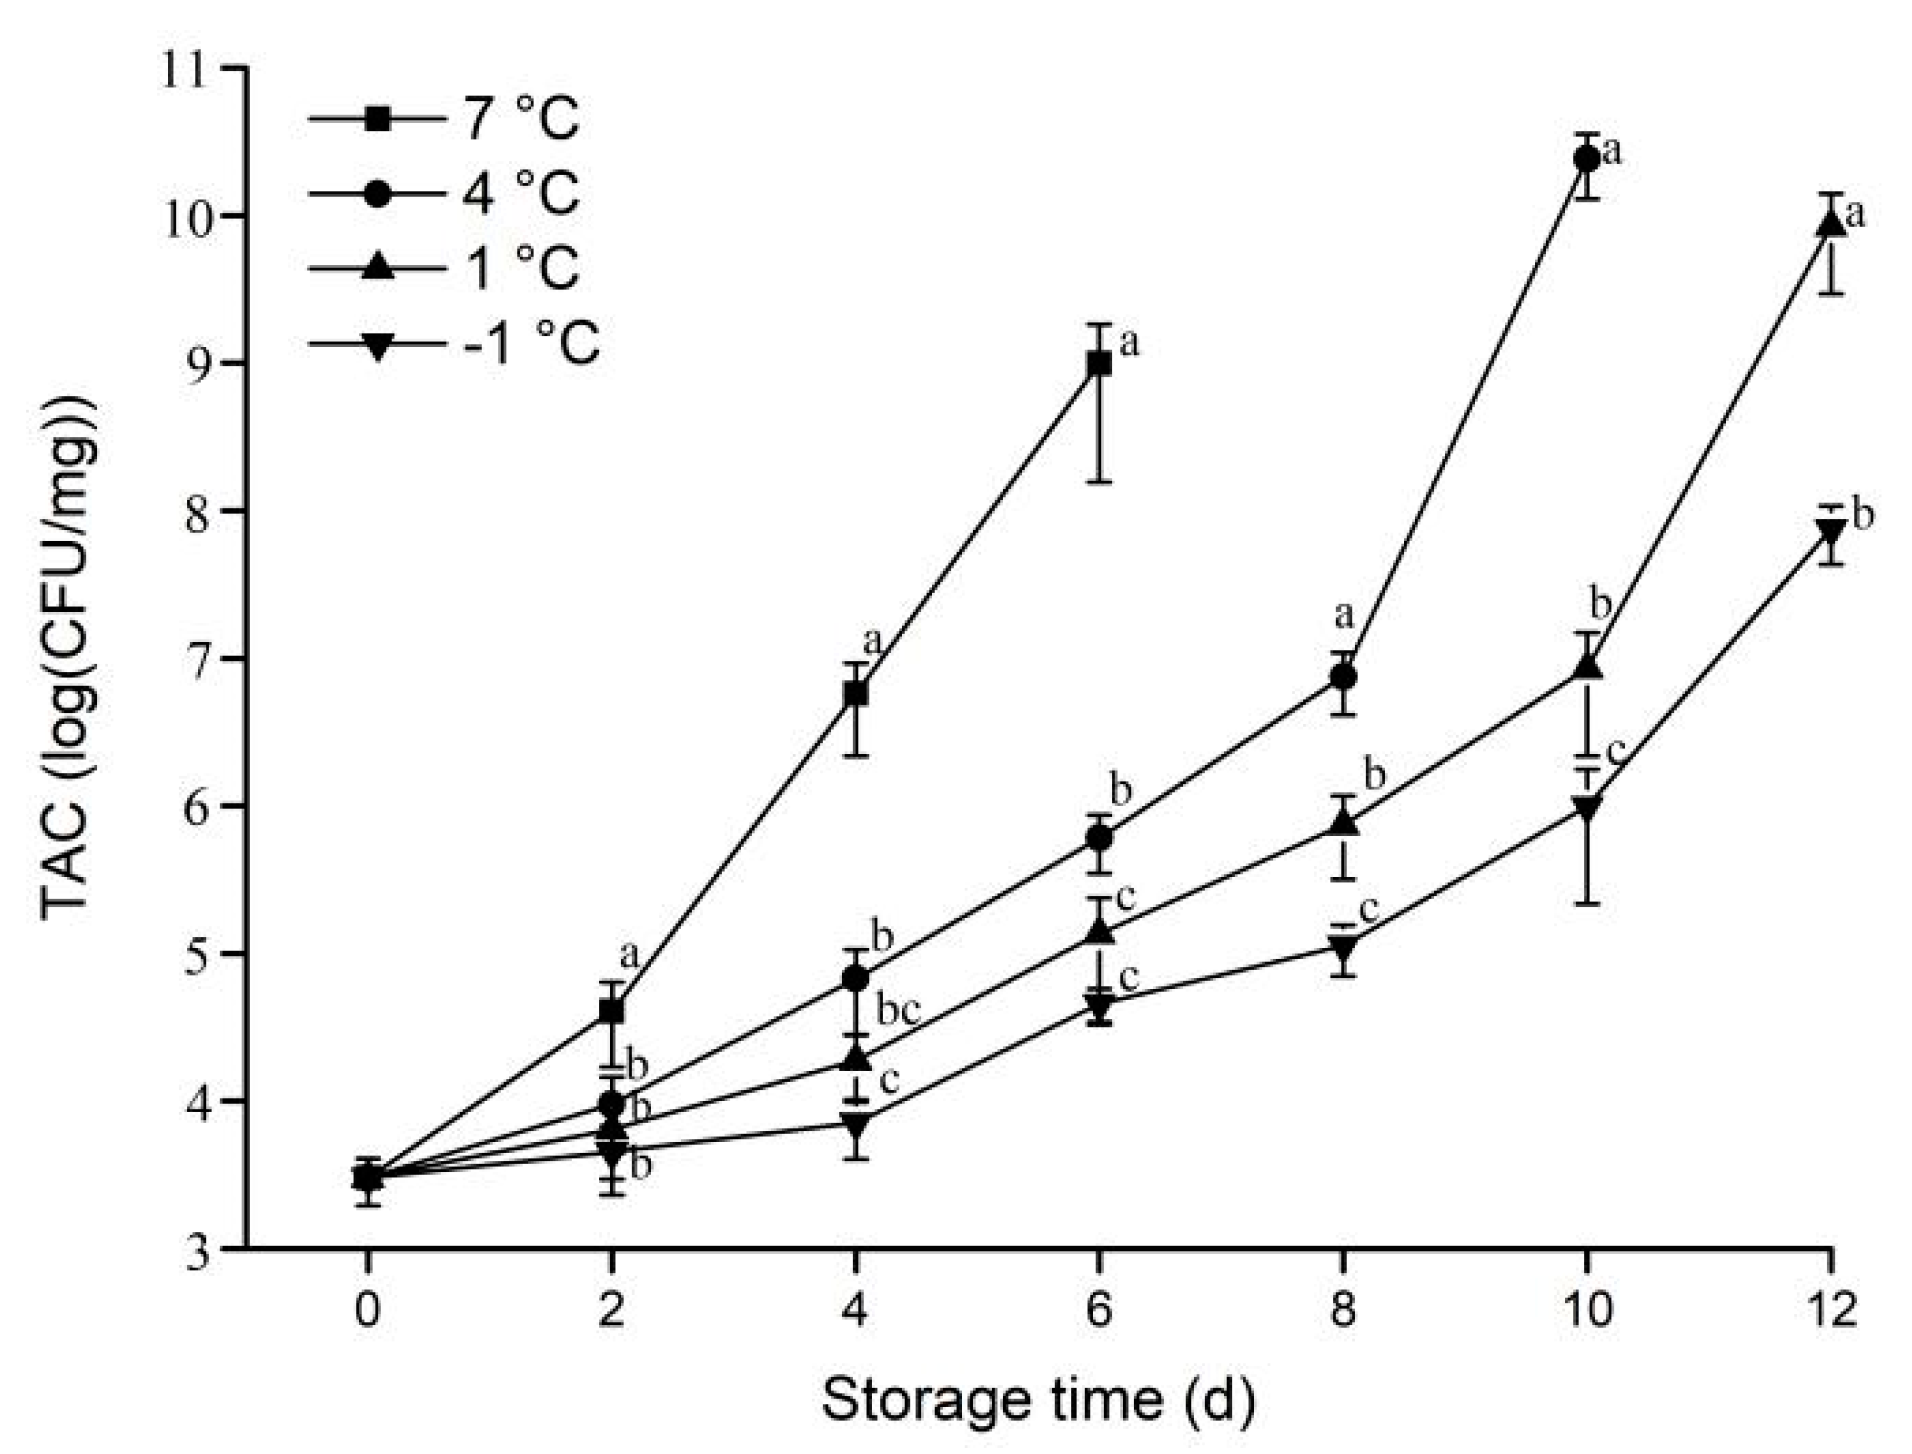
3.1.4. TAC
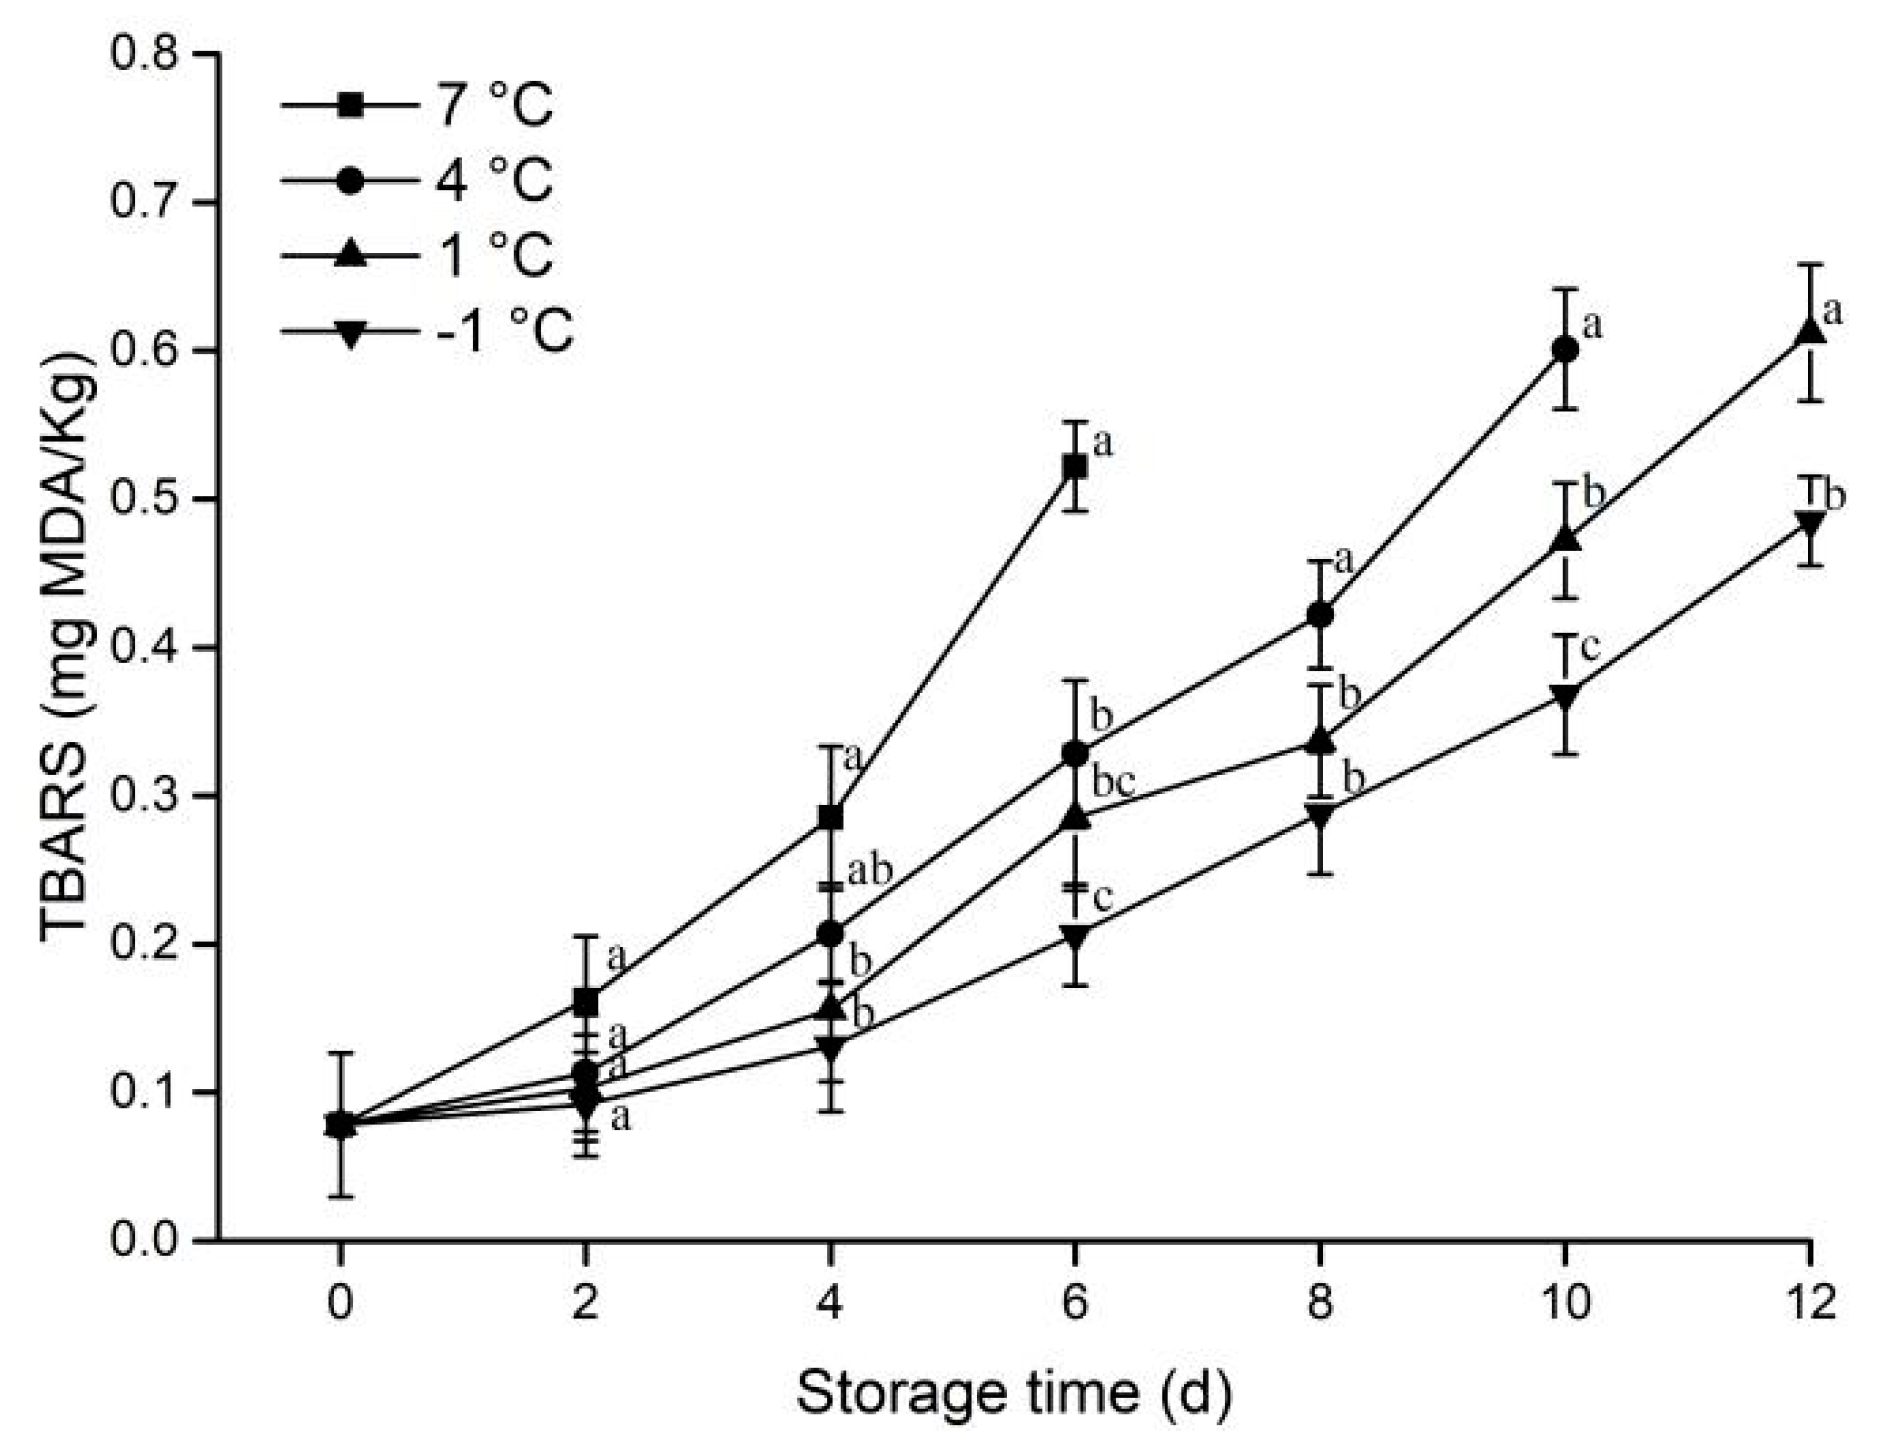
3.1.5. Lipid Oxidation
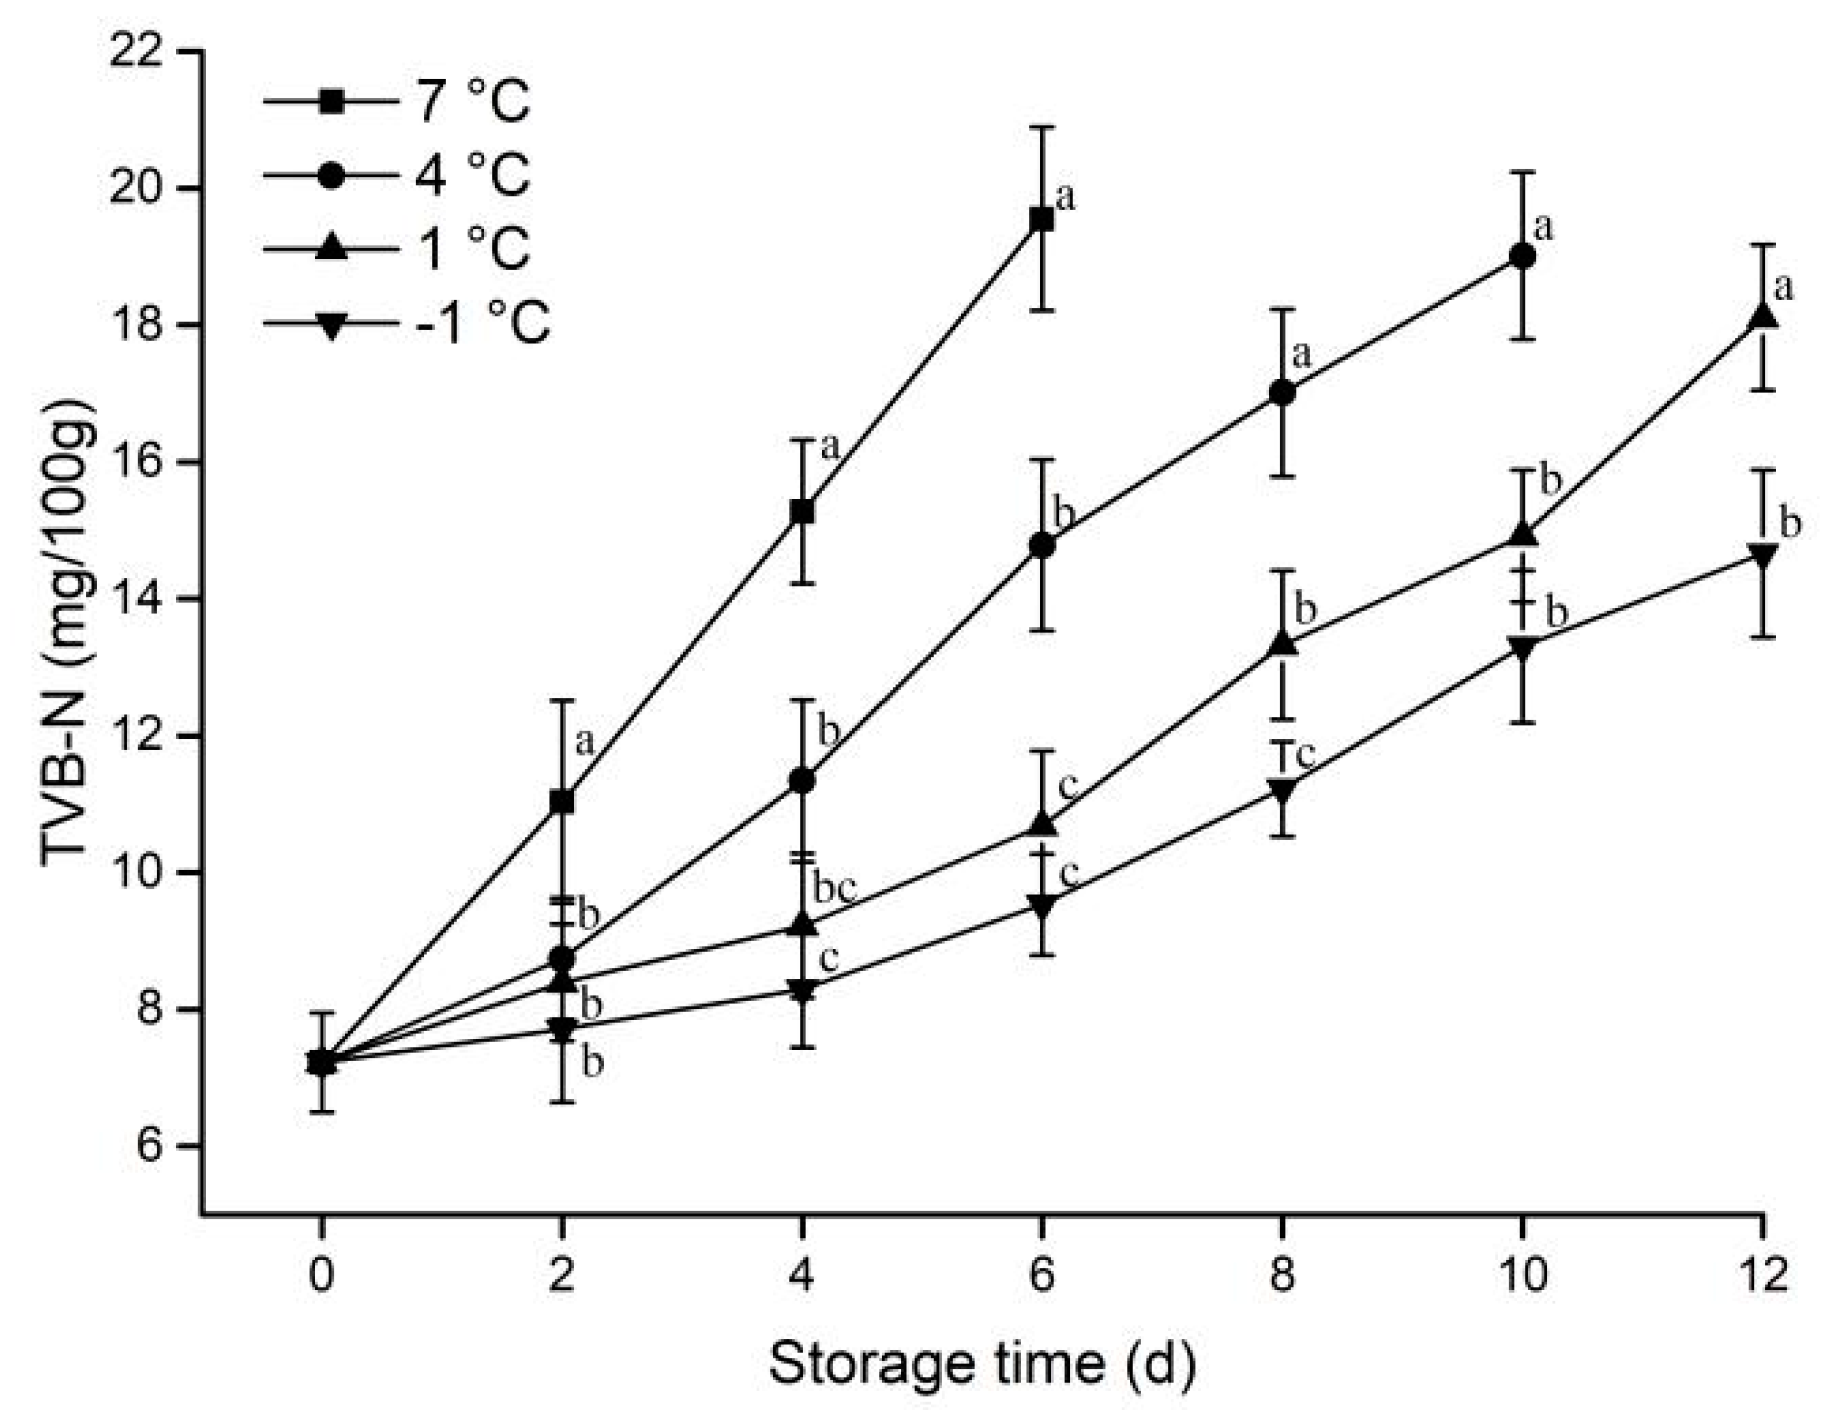
3.1.6. TVB-N
3.2. Performance of Model
3.2.1. Evaluation Matrix of Chilled/Supercooled Pork
3.2.2. The Entropy Weight of Each Index and the Comprehensive Quality of Pork
3.2.3. Kinetic Analysis
3.2.4. Establish of Model
3.2.5. Validation of Model
4. Discussion
5. Conclusions
Author Contributions
Funding
Institutional Review Board Statement
Informed Consent Statement
Data Availability Statement
Conflicts of Interest
References
- Zhou, G.H.; Zhang, W.G.; Xu, X.L. China’s meat industry revolution: Challenges and opportunities for the future. Meat Sci. 2021, 92, 188–196. [Google Scholar] [CrossRef] [PubMed]
- Tan, W.; Shelef, L.A. Effects of sodium chloride and lactates on chemical and microbiological changes in refrigerated and frozen fresh ground pork. Meat Sci. 2002, 62, 27–32. [Google Scholar] [CrossRef]
- Duun, A.S.; Rustad, T. Quality of superchilled vacuum packed Atlantic salmon (Salmo salar) fillets stored at −1.4 and −3.6 °C. Food Chem. 2008, 106, 122–131. [Google Scholar] [CrossRef]
- Pomponio, L.; Bukh, C.; Ruiz-Carrascal, J. Proteolysis in pork loins during superchilling and regular chilling storage. Meat Sci. 2018, 141, 57–65. [Google Scholar] [CrossRef]
- Liu, Q.; Chen, Q.; Kong, B.H.; Han, J.C.; He, X.Y. The influence of superchilling and cryoprotectants on protein oxidation and structural changes in the myofibrillar proteins of common carp (Cyprinus carpio) surimi. LWT-Food Sci. Technol. 2014, 57, 603–611. [Google Scholar] [CrossRef]
- Zhang, Y.M.; Magro, A.; Puolanne, E.; Zotte, A.D.; Zotte, D. Myofibrillar protein characteristics of fast or slow frozen pork during subsequent storage at −3 °C. Meat Sci. 2021, 176, 108468. [Google Scholar] [CrossRef]
- Qian, S.; Hu, F.; Mehmood, W.; Li, X.; Wei, X.; Zhang, C.; Blecker, C. The rise of thawing drip: Freezing rate effects on ice crystallization and myowater dynamics changes. Food Chem. 2022, 373, 131461. [Google Scholar] [CrossRef]
- Qian, S.; Li, X.; Wang, H.; Sun, Z.; Zhang, C.; Guan, W.; Blecker, C. Effect of subfreezing storage (−6, −9 and −12 °C) on quality and shelf life of beef. Int. J. Food Sci. Technol. 2018, 53, 2129–2140. [Google Scholar] [CrossRef]
- Qian, S.Y.; Li, X.; Wang, H.; Wei, X.L.; Mehmood, W.; Zhang, C.H.; Blecker, C. Contribution of calpain to protein degradation, variation in myowater properties and the water-holding capacity of pork during postmortem ageing. Food Chem. 2020, 324, 126892. [Google Scholar] [CrossRef]
- Salueña, B.H.; Gamasa, C.S.; Rubial, J.M.D.; Odriozola, C.A. CIELAB color paths during meat shelf life. Meat Sci. 2019, 157, 107889. [Google Scholar] [CrossRef] [Green Version]
- Ren, S.Q.; Fang, K.; Han, W.J. Ensuring the quality of meat in cold chain logistics: A comprehensive review. Trends Food Sci. Technol. 2022, 119, 133–151. [Google Scholar] [CrossRef]
- Boekel, M. Kinetic Modeling of Food Quality: A Critical Review. Compr. Rev. Food Sci. Food 2008, 7, 144–158. [Google Scholar] [CrossRef]
- Freitas, M.A.; Costa, J.C. Shelf life determination using sensory evaluation scores: A general Weibull modeling approach. Comput. Ind. Eng. 2006, 51, 652–670. [Google Scholar] [CrossRef]
- Fonseca, S.; Oliveira, F.; Brecht, J. Modelling respiration rate of fresh fruits and vegetables for modified atmosphere packages: A review. J. Food Eng. 2002, 52, 99–119. [Google Scholar] [CrossRef]
- Wang, Z.F.; He, Z.F.; Zhang, D.; Li, H.J.; Wang, Z.M. Using oxidation kinetic models to predict the quality indices of rabbit meat under different storage temperatures. Meat Sci. 2020, 162, 108042. [Google Scholar] [CrossRef]
- Chen, A.Q.; Yang, Z.; Zhang, N.; Zhao, S.S.; Chen, M.F. Quantitative evaluation and prediction for preservation quality of cold shocked cucumber based on entropy. Innov. Food Sci. Emerg. Technol. 2016, 35, 58–66. [Google Scholar] [CrossRef]
- Jiang, J.; Mao, G.C.; Wang, R.J. Study on overall performance evaluation of chilled food logistics system. In Proceedings of the International Conference on Machine Learning Cybernetics, Baoding, China, 12–15 July 2009; p. 10845513. [Google Scholar] [CrossRef]
- Zou, J.Q.; Li, P.F. Modelling of litchi shelf life based on the entropy weight method. Food Packag. Shelf Life 2020, 25, 100509. [Google Scholar] [CrossRef]
- GB 4789.2-2016; The Chinese National Food Safety Standard of Food Microbiology Test—Determination of Total Number of Colonies. National Health and Family Planning Commission of the P.R.C.: Beijing, China, 2016.
- Liu, Y.Y.; Zhang, L.T.; Gao, S.; Bao, Y.L.; Tan, Y.Q.; Luo, Y.K.; Li, X.G.; Hong, H. Effect of protein oxidation in meat and exudates on the water holding capacity in bighead carp (Hypophthalmichthys nobilis) subjected to frozen storage. Food Chem. 2022, 370, 131079. [Google Scholar] [CrossRef]
- GB 2707-2016; The Chinese National Food Safety Standard of Determination of Volatile Base Nitrogen in Food. National Health and Family Planning Commission of the P.R.C.: Beijing, China, 2016.
- Pang, B.; Bowker, B.; Zhuang, H.; Yang, Y.; Zhang, J. Research Note: Comparison of 3 methods used for estimating cook loss in broiler breast meat. Poult. Sci. 2020, 99, 6287–6290. [Google Scholar] [CrossRef]
- Lin, H.X.; Zhao, S.S.; Han, X.Y.; Guan, W.Q.; Liu, B.; Chen, A.Q.; Sun, Y.S.; Wang, J.Y. Effect of static magnetic field extended supercooling preservation on beef quality. Food Chem. 2022, 370, 131264. [Google Scholar] [CrossRef]
- Wu, W.; Gao, X.; Dai, Y.; Fu, Y.; Li, X.; Dai, R. Post-mortem changes in sarcoplasmic proteome and its relationship to meat color traits in M. semitendinosus of Chinese Luxi yellow cattle. Food Res. Int. 2015, 72, 98–105. [Google Scholar] [CrossRef]
- Li, X.; Zhang, Y.; Li, Z.; Li, M.; Lin, Y.; Zhang, D. The effect of temperature in the range of −0.8 °C to 4 °C on lamb meat color stability. Meat Sci. 2017, 134, 28–33. [Google Scholar] [CrossRef] [PubMed]
- Wang, L.L.; Yu, Q.L.; Han, L.; Ma, X.L.; Song, R.D.; Zhao, S.N.; Zhang, W.H. Study on the effect of reactive oxygen species-mediated oxidative stress on the activation of mitochondrial apoptosis and the tenderness of yak meat. Food Chem. 2018, 244, 394–402. [Google Scholar] [CrossRef] [PubMed]
- You, Y.; Her, J.; Shafel, T.; Kang, T.; Jun, S. Supercooling preservation on quality of beef steak. J. Food Eng. 2020, 274, 109840. [Google Scholar] [CrossRef]
- Liu, H.; Saito, Y.; Riza, D.F.A.; Kondo, A.; Yang, X.; Han, D. Rapid evaluation of quality deterioration and freshness of beef during low temperature storage using three-dimensional fluorescence spectroscopy. Food Chem. 2019, 287, 369–374. [Google Scholar] [CrossRef]
- Mok, J.H.; Her, J.; Kang, T.Y.; Hoptowit, R.; Jun, S. Effects of pulsed electric field (PEF) and oscillating magnetic field (OMF) combination technology on the extension of supercooling for chicken breasts. J. Food Eng. 2017, 196, 27–35. [Google Scholar] [CrossRef] [Green Version]
- Osuga, R.; Koide, S.; Sakurai, M.; Orikasa, T.; Usmura, M. Quality and microbial evaluation of fresh-cut apples during 10 days of supercooled storage. Food Control 2021, 126, 108014. [Google Scholar] [CrossRef]
- Kang, T.Y.; Lee, D.Y.; Youngbok Ko, Y.; Jun, S. Effects of pulsed electric field (PEF) and oscillating magnetic field (OMF) on supercooling preservation of beef at different fat levelsEffets du champ électrique pulsé (PEF) et du champ magnétique oscillant (OMF) sur la conservation par surfusion de la viande de bœuf avec des teneurs en graisse différentes. Int. J. Refrig. 2022, 136, 36–45. [Google Scholar] [CrossRef]
- Stonehouse, G.G.; Evans, J.A. The use of supercooling for fresh foods. J. Food Eng. 2015, 148, 74–79. [Google Scholar] [CrossRef] [Green Version]
- Leygonie, C.; Britz, T.J.; Hoffman, L.C. Impact of freezing and thawing on the quality of meat: Review. Meat Sci. 2012, 91, 93–98. [Google Scholar] [CrossRef]
- Li, Y.; Tang, X.; Shen, Z.; Dong, J. Prediction of total volatile basic nitrogen (TVB-N) content of chilled beef for freshness evaluation by using viscoelasticity based on airflow and laser technique. Food Chem. 2019, 287, 126–132. [Google Scholar] [CrossRef] [PubMed]
- Zheng, Q.; Yao, G.A. Evaluation on Stability of Supply Chain with Information Entropy. Kongzhi yu Juece Control Decis. 2006, 21, 693–696. [Google Scholar]
- Zhong, W.; Luo, W.; Wang, A.C.; Gu, X.; Lv, Z.Z. Kinetic models applied to quality change and shelf life prediction of kiwifruits. LWT 2021, 138, 110610. [Google Scholar] [CrossRef]
- Olivera, D.F.; Bambicha, R.; Laporte, G.; Cárdenas, F.C.; Mestorino, N. Kinetics of colour and texture changes of beef during storage. J. Food Sci. Technol. 2013, 50, 821–825. [Google Scholar] [CrossRef] [PubMed] [Green Version]


| Storage Time (d) | 7 °C | 4 °C | 1 °C | −1 °C |
|---|---|---|---|---|
| 0 | 0.9652 | 0.9652 | 0.9653 | 0.9653 |
| 2 | 0.7445 | 0.8263 | 0.8690 | 0.9107 |
| 4 | 0.4265 | 0.6829 | 0.7712 | 0.8588 |
| 6 | 0.0608 | 0.5178 | 0.6517 | 0.7801 |
| 8 | 0.3406 | 0.5188 | 0.6684 | |
| 10 | 0.0644 | 0.3413 | 0.5294 | |
| 12 | 0.0894 | 0.3452 |
| Quality Index | Reaction Order | Storage Temperature (°C) | Reaction Rate k | Determination R2 | The Average Values of R2 |
|---|---|---|---|---|---|
| TVB-N | Zero-order | 7 °C | 1.99083 ± 0.0631 | 0.9411 | 0.8391 |
| 4 °C | 1.09055 ± 0.1828 | 0.6366 | |||
| 1 °C | 0.68361 ± 0.14064 | 0.8189 | |||
| −1 °C | 0.43758 ± 0.14999 | 0.9597 | |||
| First-order | 7 °C | 0.18838 ± 0.01874 | 0.9982 | 0.4452 | |
| 4 °C | 0.10872 ± 0.00877 | 0.2342 | |||
| 1 °C | 0.0695 ± 0.0065 | 0.0305 | |||
| −1 °C | 0.04421 ± 0.01008 | 0.5178 | |||
| TBARS | Zero-order | 7 °C | 0.05591 ± 0.01339 | 0.9516 | 0.9428 |
| 4 °C | 0.03734 ± 0.0178 | 0.9302 | |||
| 1 °C | 0.03046 ± 0.01110 | 0.9142 | |||
| −1 °C | 0.02179 ± 0.009227 | 0.9753 | |||
| First-order | 7 °C | 0.33541 ± 0.02144 | 0.8571 | 0.3472 | |
| 4 °C | 0.21994 ± 0.02363 | 0.2322 | |||
| 1 °C | 0.17779 ± 0.02742 | 0.0378 | |||
| −1 °C | 0.13395 ± 0.02895 | 0.2618 | |||
| TAC | Zero-order | 7 °C | 0.71860 ± 0.2384 | 0.914 | 0.8902 |
| 4 °C | 0.42991 ± 0.1386 | 0.7602 | |||
| 1 °C | 0.31190 ± 0.1082 | 0.9033 | |||
| −1 °C | 0.19892 ± 0.0888 | 0.9834 | |||
| First-order | 7 °C | 0.14841 ± 0.0300 | 0.6874 | 0.5329 | |
| 4 °C | 0.08713 ± 0.0037 | 0.4289 | |||
| 1 °C | 0.0629 ± 0.0095 | 0.3325 | |||
| −1 °C | 0.0435 ± 0.01486 | 0.6827 | |||
| Comprehensive scores | Zero-order | 7 °C | −0.13193 ± 0.0166 | 0.9861 | 0.9176 |
| 4 °C | −0.07656 ± 0.0074 | 0.8631 | |||
| 1 °C | −0.05669 ± 0.0087 | 0.8942 | |||
| −1 °C | −0.03619 ± 0.0091 | 0.9268 | |||
| First-order | 7 °C | −0.26490 ± 0.1418 | 0.9200 | 0.6118 | |
| 4 °C | −0.09956 ± 0.0200 | 0.3456 | |||
| 1 °C | −0.06294 ± 0.0097 | 0.5032 | |||
| −1 °C | −0.04273 ± 0.0201 | 0.6784 |
| Quality Index | The Initial Value | The Final Value | Kinetic Order | Pre-Exponential Factor K0 | Activation Energy Ea | R2 |
|---|---|---|---|---|---|---|
| TVB-N | 7.22 | 15.0 | Zero-order | 1.42470 × 10²² | 1.1718 × 10⁵ | 0.9944 |
| TBARS | 0.078 | 0.5 | Zero-order | 7.74768 × 10⁸ | 7.0484 × 10⁴ | 0.9221 |
| TAC | 3.3 | 6.0 | Zero-order | 9.57795 × 10¹⁷ | 9.7175 × 10⁴ | 0.9779 |
| Comprehensive scores | 0.9652 | 0.4 | Zero-order | 1.87700 × 10¹⁷ | 9.7354 × 10⁴ | 0.9734 |
| Quality Index | Storage Temperature (°C) | Predict Shelf Life (d) | Measured Shelf Life (d) | Relative Error (%) | Average Relative Error (%) |
|---|---|---|---|---|---|
| TVB-N | 7 °C | 3.95 | 3.93 | 5.09 | 8.65 |
| 4 °C | 6.85 | 6.33 | 7.35 | ||
| 1 °C | 11.87 | 10.93 | 8.53 | ||
| −1 °C | 17.32 | 14.76 | 17.41 | ||
| TBARS | 7 °C | 7.66 | 3.93 | 94.90 | 56.28 |
| 4 °C | 10.63 | 6.33 | 67.84 | ||
| 1 °C | 14.86 | 10.93 | 35.91 | ||
| −1 °C | 18.66 | 14.76 | 26.45 | ||
| TAC | 7 °C | 3.78 | 3.93 | 3.89 | 9.17 |
| 4 °C | 5.95 | 6.33 | 6.29 | ||
| 1 °C | 9.42 | 10.93 | 13.86 | ||
| −1 °C | 12.89 | 14.76 | 12.64 | ||
| Comprehensive quality | 7 °C | 4.35 | 3.93 | 10.79 | 5.09 |
| 4 °C | 6.85 | 6.33 | 8.11 | ||
| 1 °C | 10.88 | 10.93 | 0.53 | ||
| −1 °C | 14.90 | 14.76 | 0.93 |
Publisher’s Note: MDPI stays neutral with regard to jurisdictional claims in published maps and institutional affiliations. |
© 2022 by the authors. Licensee MDPI, Basel, Switzerland. This article is an open access article distributed under the terms and conditions of the Creative Commons Attribution (CC BY) license (https://creativecommons.org/licenses/by/4.0/).
Share and Cite
Zhao, S.; Lin, H.; Li, S.; Liu, C.; Meng, J.; Guan, W.; Liu, B. Modeling of Chilled/Supercooled Pork Storage Quality Based on the Entropy Weight Method. Animals 2022, 12, 1415. https://doi.org/10.3390/ani12111415
Zhao S, Lin H, Li S, Liu C, Meng J, Guan W, Liu B. Modeling of Chilled/Supercooled Pork Storage Quality Based on the Entropy Weight Method. Animals. 2022; 12(11):1415. https://doi.org/10.3390/ani12111415
Chicago/Turabian StyleZhao, Songsong, Hengxun Lin, Shuangqing Li, Chenghao Liu, Junhong Meng, Wenqiang Guan, and Bin Liu. 2022. "Modeling of Chilled/Supercooled Pork Storage Quality Based on the Entropy Weight Method" Animals 12, no. 11: 1415. https://doi.org/10.3390/ani12111415