Article

In Silico Screening and Development of Microsatellite Markers for Genetic Analysis in Perca fluviatilis

1
National and Local Joint Engineering Laboratory for Freshwater Fish Breeding, Heilongjiang River Fisheries Research Institute, Chinese Academy of Fishery Sciences, Harbin 150070, China
2
Key Laboratory of Freshwater Aquatic Germplasm Resources, Ministry of Agriculture and Rural Areas, College of Fish and Life Science, Shanghai Ocean University, Shanghai 201306, China
*
Author to whom correspondence should be addressed.
Animals 2022, 12(14), 1809; https://doi.org/10.3390/ani12141809
Submission received: 16 June 2022 / Revised: 8 July 2022 / Accepted: 11 July 2022 / Published: 15 July 2022
(This article belongs to the Section Ecology and Conservation)

Abstract

:

Simple Summary

Perca fluviatilis is an economically important species of freshwater fish that has flavorsome meat with a high nutritional value. Microsatellite markers are widely used in the genetic structure analysis of aquatic animals due to their abundance, high polymorphism, and codominance. In this study, we screened, tested, and developed polymorphic markers and evaluated the genetic diversity of the main wild P. fluviatilis populations in China. From the P. fluviatilis genomic data, 98,425 pairs of microsatellites were identified. A total of 200 primer pairs for tetranucleotide microsatellites were synthesized and tested in randomly selected wild individuals. Among them, 152 microsatellite markers were found to be polymorphic. A total of 29 markers with clear amplified bands and high polymorphism were selected for the genetic analysis of the four populations. The results indicated a high level of genetic diversity in P. fluviatilis populations in Wulungu Lake, Jili Lake, and the Wulungu River and a medium level of genetic diversity in the Kalaeerqisi River. There was moderate genetic differentiation among the populations in Xinjiang. The results of this study provide important information on the genetic diversity and genetic population structuring of P. fluviatilis in China as well as a scientific basis for the protection and molecular marker-assisted breeding of P. fluviatilis.

Abstract

Perca fluviatilis is an economically important species of freshwater fish. To understand the genetic structure of P. fluviatilis in China, 268 samples were collected from Wulungu Lake (WL), Jili Lake (JL), the Wulungu River (WR), and the Kalaeerqisi River (KR). These samples were then analyzed using microsatellite markers. A total of 98,425 microsatellite markers were developed based on the genomic data, and 29 polymorphic microsatellite markers were selected to analyze genetic diversity in this study. The number of alleles (Na) and observed heterozygosity (Ho) per population ranged from 4.621 (KR) to 11.172 (WL) and from 0.510 (KR) to 0.716 (JL), respectively. The results of the polymorphic information content (PIC) showed that the WL, JL, and WR populations were highly polymorphic (PIC 0.5) and that the KR population was moderately polymorphic (0.25 ≤ PIC < 0.5). The genetic differentiation coefficient (Fst) among the four P. fluviatilis populations was 0.074, indicating moderate genetic differentiation among the populations in Xinjiang. The reason for the significant difference between the rivers and lakes could be the presence of a dam blocking the flow of P. fluviatilis. The development of microsatellite markers provides support for population genetics in the future. The evaluation of the genetic structure of P. fluviatilis in Xinjiang provides a reference for the reproduction and conservation of P. fluviatilis.

1. Introduction

Perca fluviatilis belongs to the Percidae family, part of the Perciformes order. It is commonly known as Eurasian perch and is widely distributed in Europe and North Asia [1]. It is an important species of freshwater fish, favored by farmers because of fast growth and strong disease resistance [2], and it is favored by consumers due to its flavorsome meat and high nutritional value. To date, research on P. fluviatilis has focused on biological characteristics [3,4], artificial reproduction [5,6], embryonic development [7], parasites [8,9], and feeding [10,11].
Some studies concerning the genetic diversity of the species have been also conducted [12,13,14]. As higher diversity implies greater adaptability to environmental changes [15], it may be a prerequisite for the survival and development of organisms. The genetic diversity of P. fluviatilis has previously been demonstrated to be low, based on mitochondrial control region sequencing of wild populations in Xinjiang and other breeding populations in China [16,17]. Nesbø et al. [14] also used mitochondrial control region sequences and random amplified polymorphic DNA (RAPD) markers to evaluate genetic variation in Europe and Siberian P. fluviatilis populations and demonstrated a high level of genetic diversity. Microsatellite markers, also known as simple sequence repeats (SSRs), are widely used in the genetic structure analysis of aquatic animals due to their abundance, high polymorphism, and codominance [18,19]. Khadher et al. [20] used twelve microsatellite markers to analyze P. fluviatilis in seven locations in Lake Geneva; the results showed that the number of alleles (Na) ranged from 3.33 to 4.75, reflecting low genetic diversity. Recently, Sipos et al. [21] developed twelve new polymorphic microsatellites and found that the P. fluviatilis genetic diversity of two Hungarian populations (Na = 8.667 and 9.500) was lower than that of a Polish population (Na = 10.667). Information regarding genetic diversity is limited; it is, therefore, necessary to use a greater number of markers to evaluate the current genetic diversity of P. fluviatilis. It is of significance to evaluate the genetic resources for the reproduction and protection of P. fluviatilis.
Nowadays, the development of sequencing technology has led to a rapid increase in high-throughput sequencing data in public databases [22]. Genome sequencing data are frequently used for the development of SSR markers for a wide range of species [23,24,25], and several whole-genome assemblies of P. fluviatilis have been published recently [26]. Therefore, we used the P. fluviatilis genome data for the screening, characterization, and testing of microsatellite markers. In China, P. fluviatilis is mainly distributed in the Altay Region, Xinjiang [27]. After successful artificial propagation, many provinces have introduced wild parents from this region for cultivation. However, these wild P. fluviatilis populations lack data regarding their genetic diversity. We also used the new markers to evaluate the genetic diversity of four wild populations in Xinjiang, providing a scientific basis for the reasonable protection and molecular marker-assisted breeding of P. fluviatilis.

2. Materials and Methods

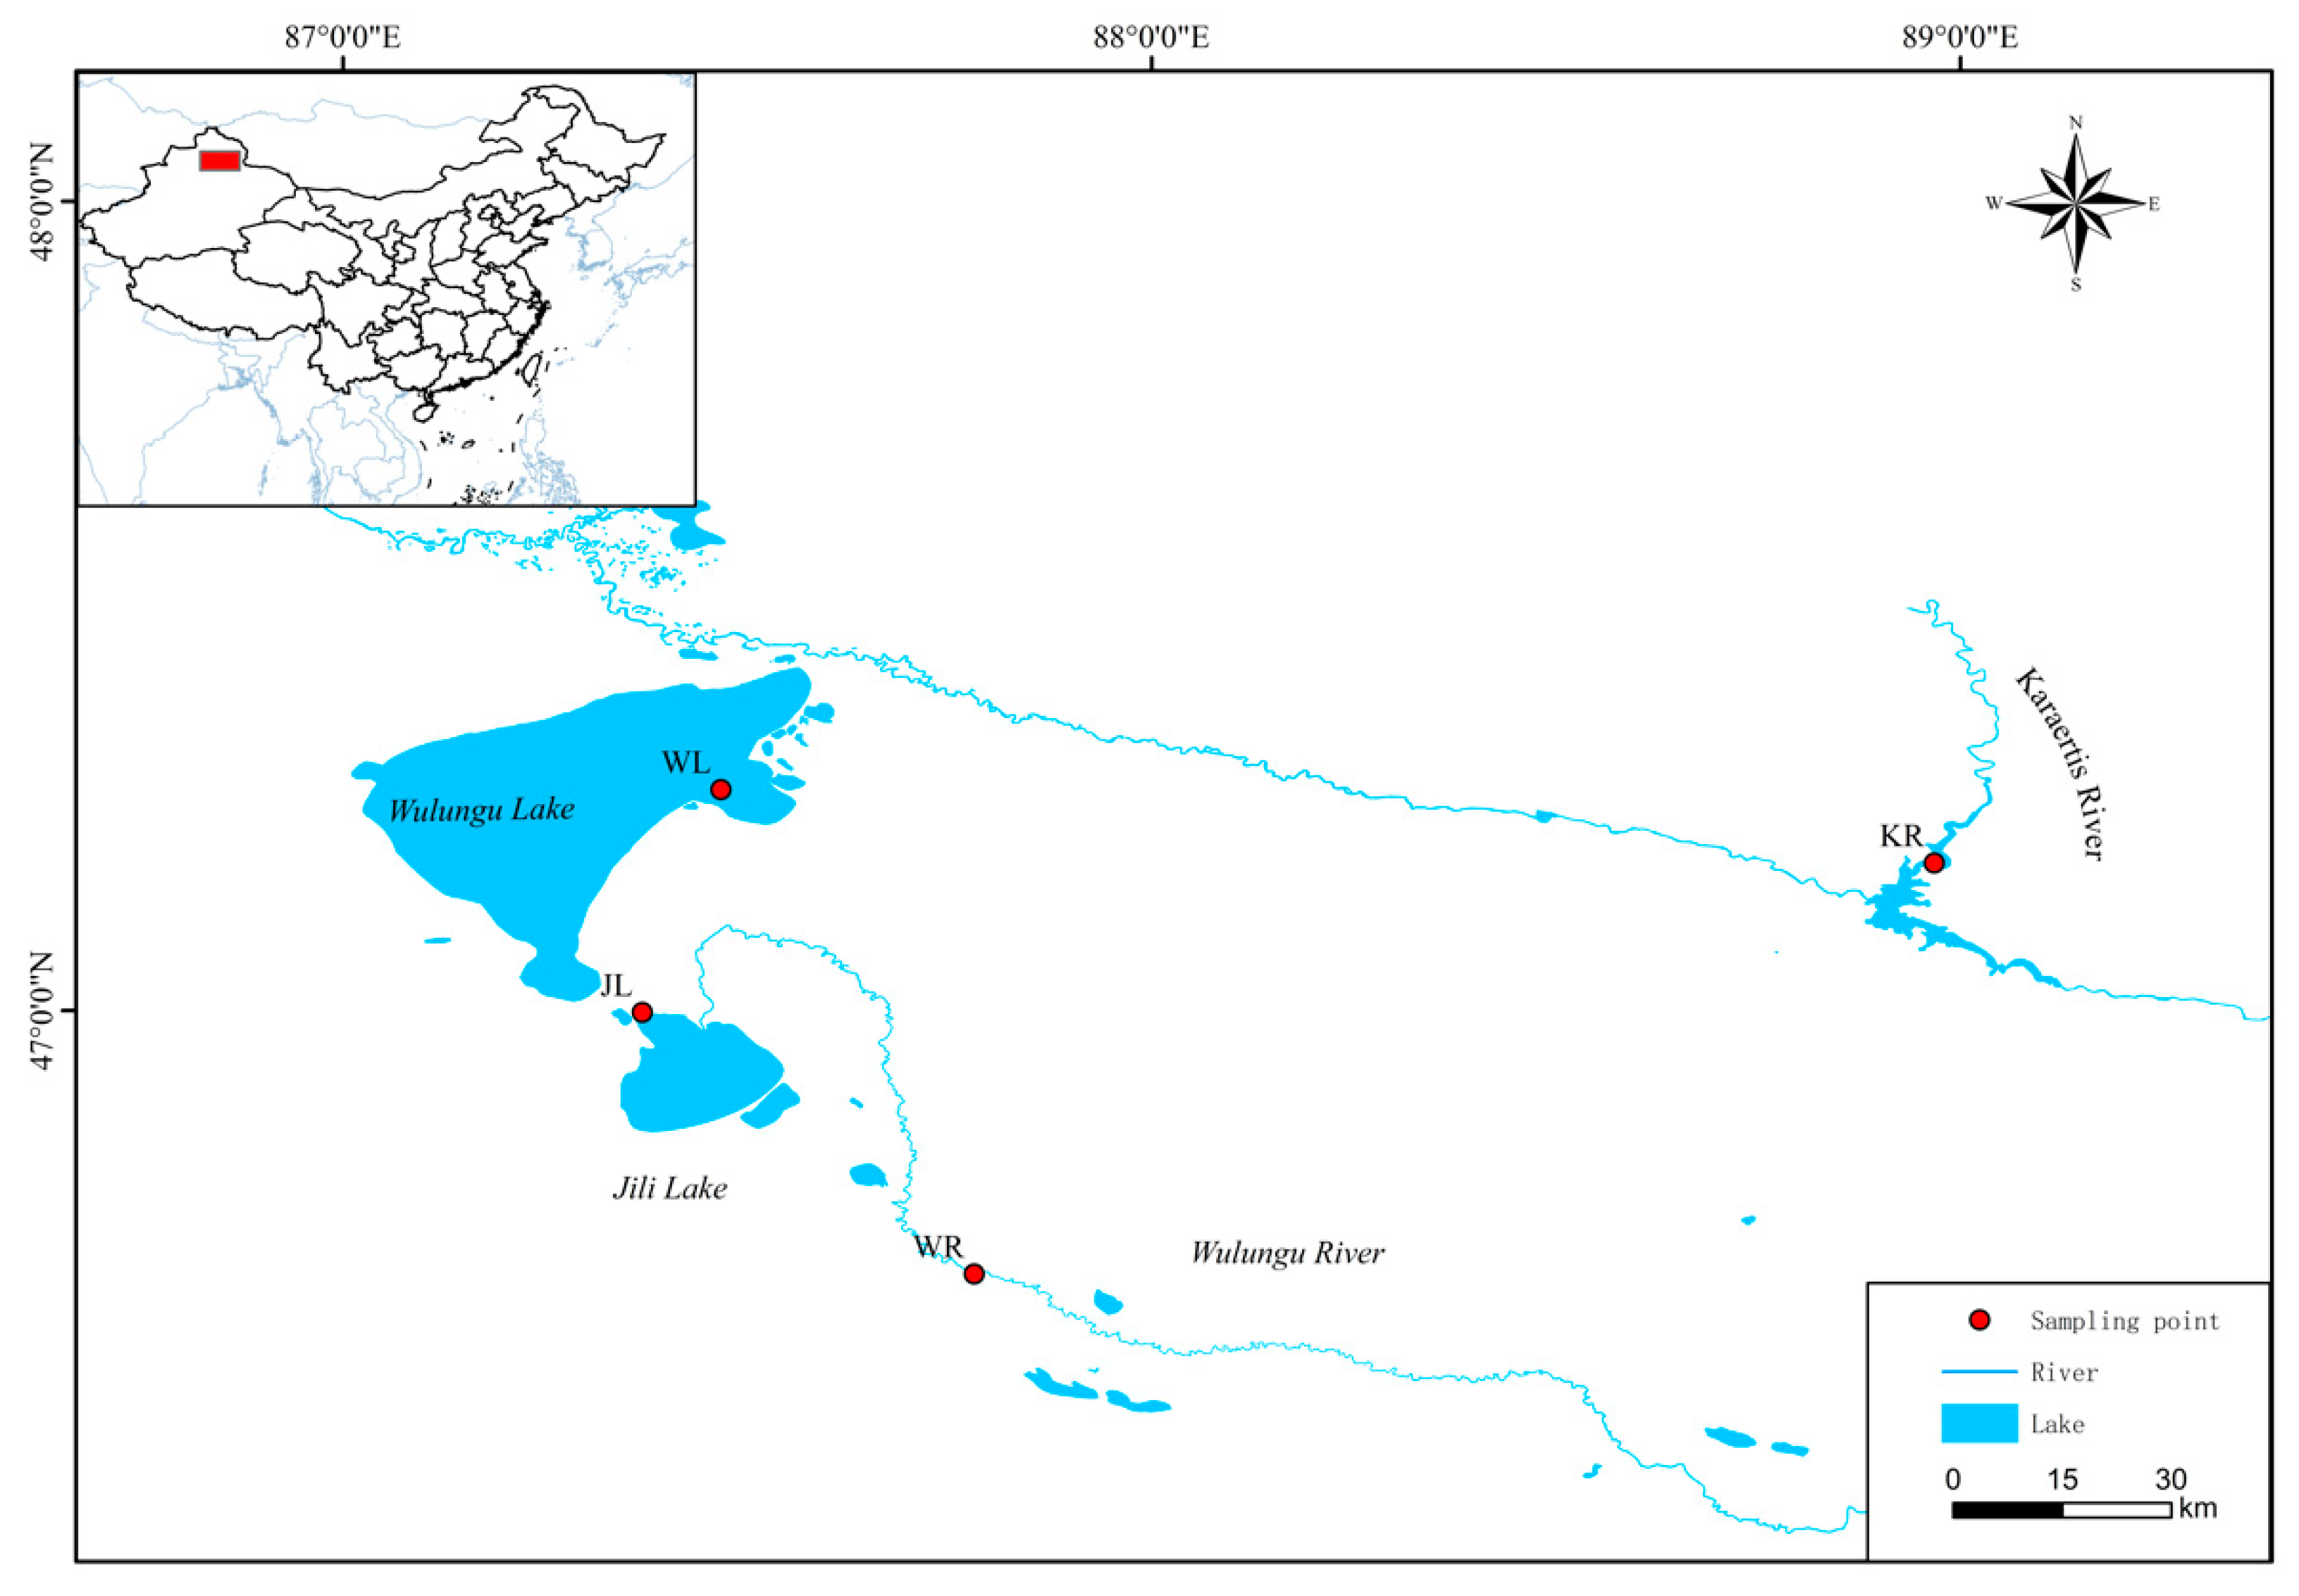
2.1. Sample Collection

A total of 268 samples were collected from the Altay region of Xinjiang, China, including 34 samples from Kalaeerqisi River (KR), 77 samples from Wulungu River (WR), 68 samples from Jili Lake (JL), and 89 samples from Wulungu Lake (WL) (Figure 1). Approximately 1 cm2 of the caudal fin of each sample was collected and pasted onto filter paper and another absorbent paper, covered with another filter paper, and kept at room temperature after drying naturally [28] for later use. The fish were released back into the capture sites after sampling.

2.2. Primer Design and Screening

The genome data of P. fluviatilis were downloaded from the GenBank database (accession number: GCA_010015445.1), and the microsatellites were isolated and screened using MISA software (https://webblast.ipk-gatersleben.de/misa/) (accessed on 1 May 2021). According to standards such as those reported by Becker and Heun [29], the search criteria used to detect the primers were: more than five dinucleotide repeats, more than four trinucleotide repeats, more than three tetranucleotide repeats, and more than two pentanucleotide repeats. Primer software (version 3.0) [30] was used to design the microsatellite primers based on product size in the range of 50–500, primer size in the range of 18–30, and melting temperature in the range of 52–65 °C. A total of 200 pairs of microsatellite primers were synthesized by Jinweizhi Biotechnology Co., Ltd., Suzhou, China.

2.3. DNA Extraction and PCR Amplification

Genomic DNA was extracted from the caudal fin using a standard proteinase K-phenol-chloroform extraction protocol [31]. A NanoDropTM 8000 spectrophotometer (Thermo Fisher Scientific, lnc., Wilmington, DE, USA) was used to detect the DNA concentration and optical density value; 1.5% agarose gel electrophoresis was used to detect the integrity. Finally, the samples were diluted to 50 ng/μL and stored in the refrigerator at −20 °C for later use.
Four samples from different populations were randomly selected to preliminarily detect the polymorphism and specificity of the 200 pairs of primers [32]. Finally, 29 pairs of polymorphic primers were selected to analyze all samples (Table 1). The DNA samples were amplified by PCR in a total reaction volume of 15 μL, which contained 1 μL of genomic DNA (50 ng/μL), 7.5 μL of 2 × PCR MIX (Shanghai Yisheng Biotechnology Co., Ltd., Shanghai, China), 0.3 μL of forward and reverse primers (10 μM), and 5.9 μL of ddH2O. Each primer pair was amplified separately. The PCR parameters were as follows: initial denaturation at 95 °C for 3 min followed by 35 cycles of denaturation at 94 °C for 20 s; annealing at 58 °C for 30 s; extension at 72 °C for 40 s; and a final extension at 72 °C for 5 min. An amount of 1 μL of the product was then obtained and mixed with 9 μL of loaded HIDI, denatured at 95 °C for 3 min, immediately bathed in ice water, and placed in an ABI 3730XL (Applied Biosystems, Foster City, CA, USA) sequencer for electrophoresis detection. GeneMarker software was used for the data analysis.

2.4. Data Analysis

PopGene version 3.2 [33] was used to calculate the number of alleles (Na) and the number of effective alleles (Ne) per locus as well as the observed heterozygosity (Ho) and expected heterozygosity (He). Using the formula of Bostein et al. [34], we calculated the polymorphic information content (PIC) per locus. We also used PopGene version 3.2 to evaluate the Hardy–Weinberg equilibrium test (PHWE) and genetic distance (D) between the populations [33]. To construct an unweighted pair-group method with an arithmetic mean (UPGMA) dendrogram, PHYLIP version 3.6 software (https://evolution.genetics.washington.edu/phylip.html) (accessed on 12 October 2021) was used. Arlequin version 3.5 software [35] was used to evaluate the source of variation (AMOVA) and genetic differentiation coefficient (Fst) based on the premise that the number of permutations was 1000. The genetic composition within the populations and differences among them were analyzed using Structure software version 2.3.4 [36]; the range of clusters (K) was predefined from 1 to 7 with 15 independent runs for each K. For each run, an MCMC chain length of 50,000 burn-in iterations and 100,000 sampling iterations was used. The most probable K value was selected using Structure Harvester (http://taylor0.biology.ucla.edu/structureHarvester/) (accessed on 15 October 2021).

3. Results

3.1. Analysis of the Sequence Characteristics of Microsatellites in the P. fluviatilis Genome

From the P. fluviatilis genomic data, 98,425 microsatellite markers were developed. The detailed primer information is presented in Supplementary Table S1. Dinucleotide repetitive microsatellites (76,943; 78.17%) appeared most frequently (Figure 2), including the (AC)n, (AG)n, (AT)n, and (GC)n repeat motif. The (AC)n core repeat type had the highest number and the (CG)n had the lowest number. The trinucleotide-repeat microsatellite loci (10,494; 10.66%) included (ATT)n, (AGG)n, (AGC)n, (AAG)n, (ATC)n, (AAC)n, and (ACT)n, with a total of 10 types of repeat motif; among them, the number of (ATT)n was the highest. The tetranucleotide-repeat microsatellite sequence included 32 repeat motifs (Table 2), of which the (AGAT)n and (ACAG)n repeat motif appeared most frequently, accounting for approximately 17.78% and 15.3%, respectively. The pentanucleotide repeat (2237; 2.27%) was the least frequent, including 94 core repeat motifs of (AGAGG)n, (AATTC)n, (AAAAT)n, and (AAAAG)n.

3.2. Polymorphisms of the Microsatellite Markers

A total of 200 primer pairs for tetranucleotide microsatellites with a repeat motif of (AGAT)n or (ACAG)n were tested in four wild individuals. The information on all 200 tested primers is presented in Supplementary Table S2. The results showed that 191 microsatellite markers had clear bands, accounting for 95.5%. Among them, 152 microsatellite markers were found to be polymorphic, accounting for 76%.
A total of 29 markers with clear amplified bands and high polymorphism were selected for the genetic analysis of the four populations. A total of 364 alleles were amplified in 268 samples from four P. fluviatilis populations, with fragment sizes ranging from 86 to 265 bp. The Na per locus ranged from 4 (HLJHL052 and HLJHL007) to 29 (HLJHL186), with an average of 12.552. The Ne per locus ranged from 1.313 (HLJHL084) to 10.913 (HLJHL186), with an average of 4.809. The Ho per locus ranged from 0.896 to 0.234 (an average of 0.648) and the He ranged from 0.910 to 0.237 (an average of 0.712). The PIC ranged from 0.225 to 0.901, with an average of 0.680. Of these markers, 23 were highly polymorphic markers (PIC ≥ 0.5); HLJHL186 had the highest PIC (Table 3).

3.3. Genetic Diversity of P. fluviatilis Populations

The results on the genetic diversity of the four P. fluviatilis populations are shown in Supplementary Table S3. The WL population had the highest Na (11.172) and Ne (5.018). The KR population had the lowest Na (4.621) and Ne (2.563). The JL population had the largest Ho (0.716) and He (0.749), and the KR population had the lowest Ho (0.510) and He (0.518). The PIC ranged from 0.467 to 0.716. Based on the PIC results, the levels of genetic diversity among the populations were ranked: JL > WL > WR > KR. The JL, WL, and WR populations were highly polymorphic (PIC > 0.5), whereas the KR population was moderately polymorphic (0.25 < PIC < 0.5). The WR, JL, WL, and KR populations had 8, 7, 8, and 4 loci, respectively, showing a departure from the Hardy–Weinberg equilibrium, with a significant or an extremely significant lack of heterozygotes.

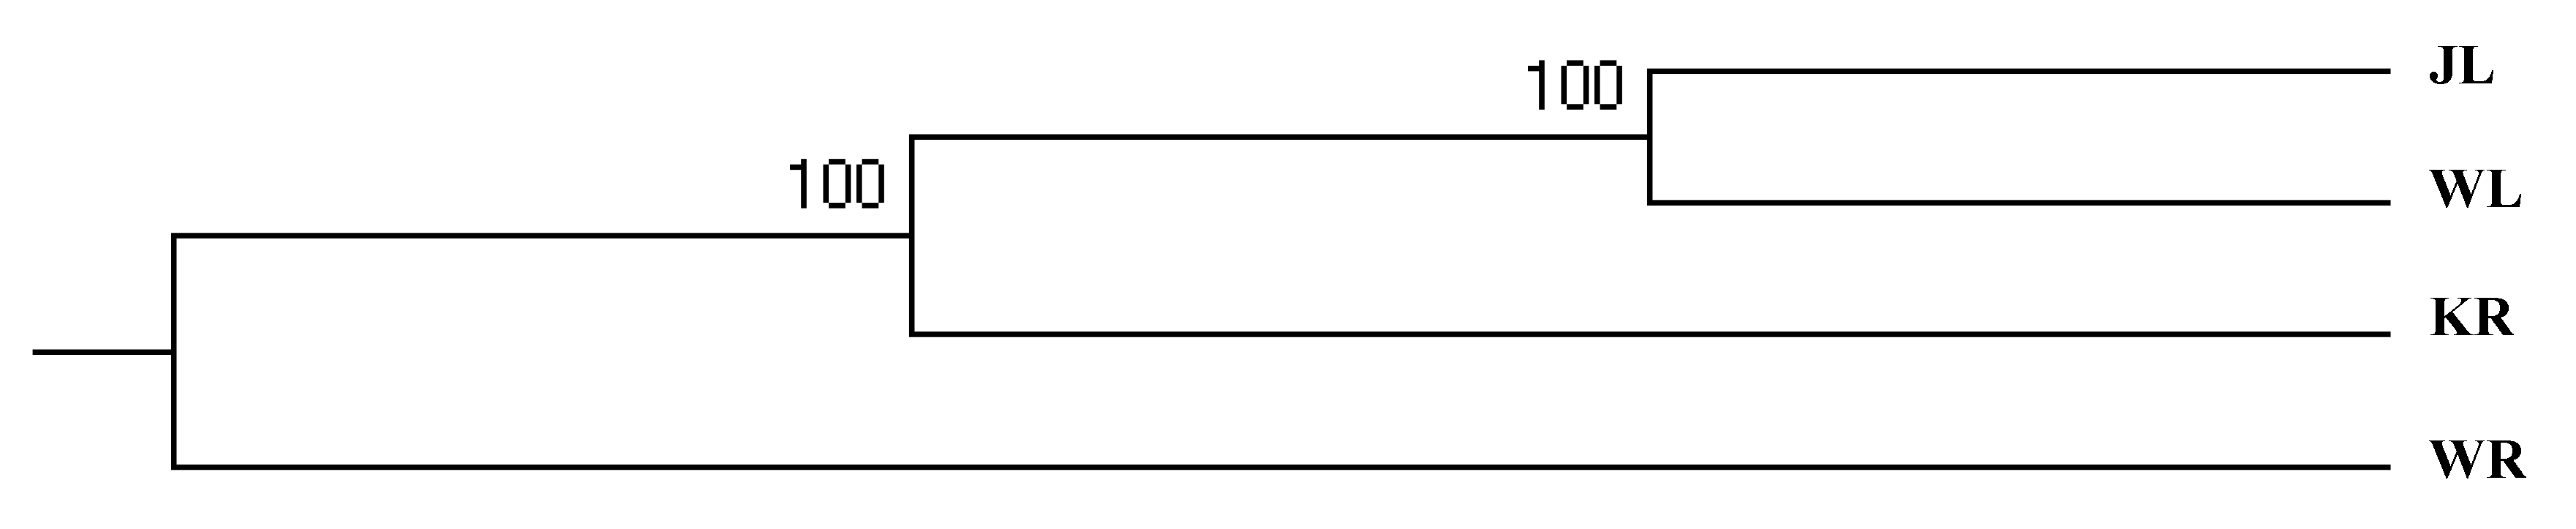
3.4. Genetic Differentiation of P. fluviatilis Populations

The AMOVA results showed that 7.44% of the genetic variation was among the populations (Table 4). The Fst value for the four P. fluviatilis populations was 0.074, representing a moderate level (0.05 < Fst < 0.15). The pairwise Fst was significant for the lake vs. the river samples in the JL–WL–WR basin (0.05 < Fst < 0.15), representing a moderate level (Table 5). The Fst between the rivers (KR and WR) (Fst = 0.158) was the highest, representing high-level genetic differentiation (Fst > 0.15). The Fst (Fst < 0.05) was lower between the two lakes, despite the significant differences. Correspondingly, the genetic distance between the two rivers was the largest (D = 0.288). The genetic distance between the two lakes (JL and WL) was the closest (D = 0.027) (Table 5). Based on the cluster tree (Figure 3), it was clear that the four populations of P. fluviatilis were clustered into three groups: the JL and WL populations belonged to one branch, the KR population belonged to another branch, and the WR population belonged to a third branch.

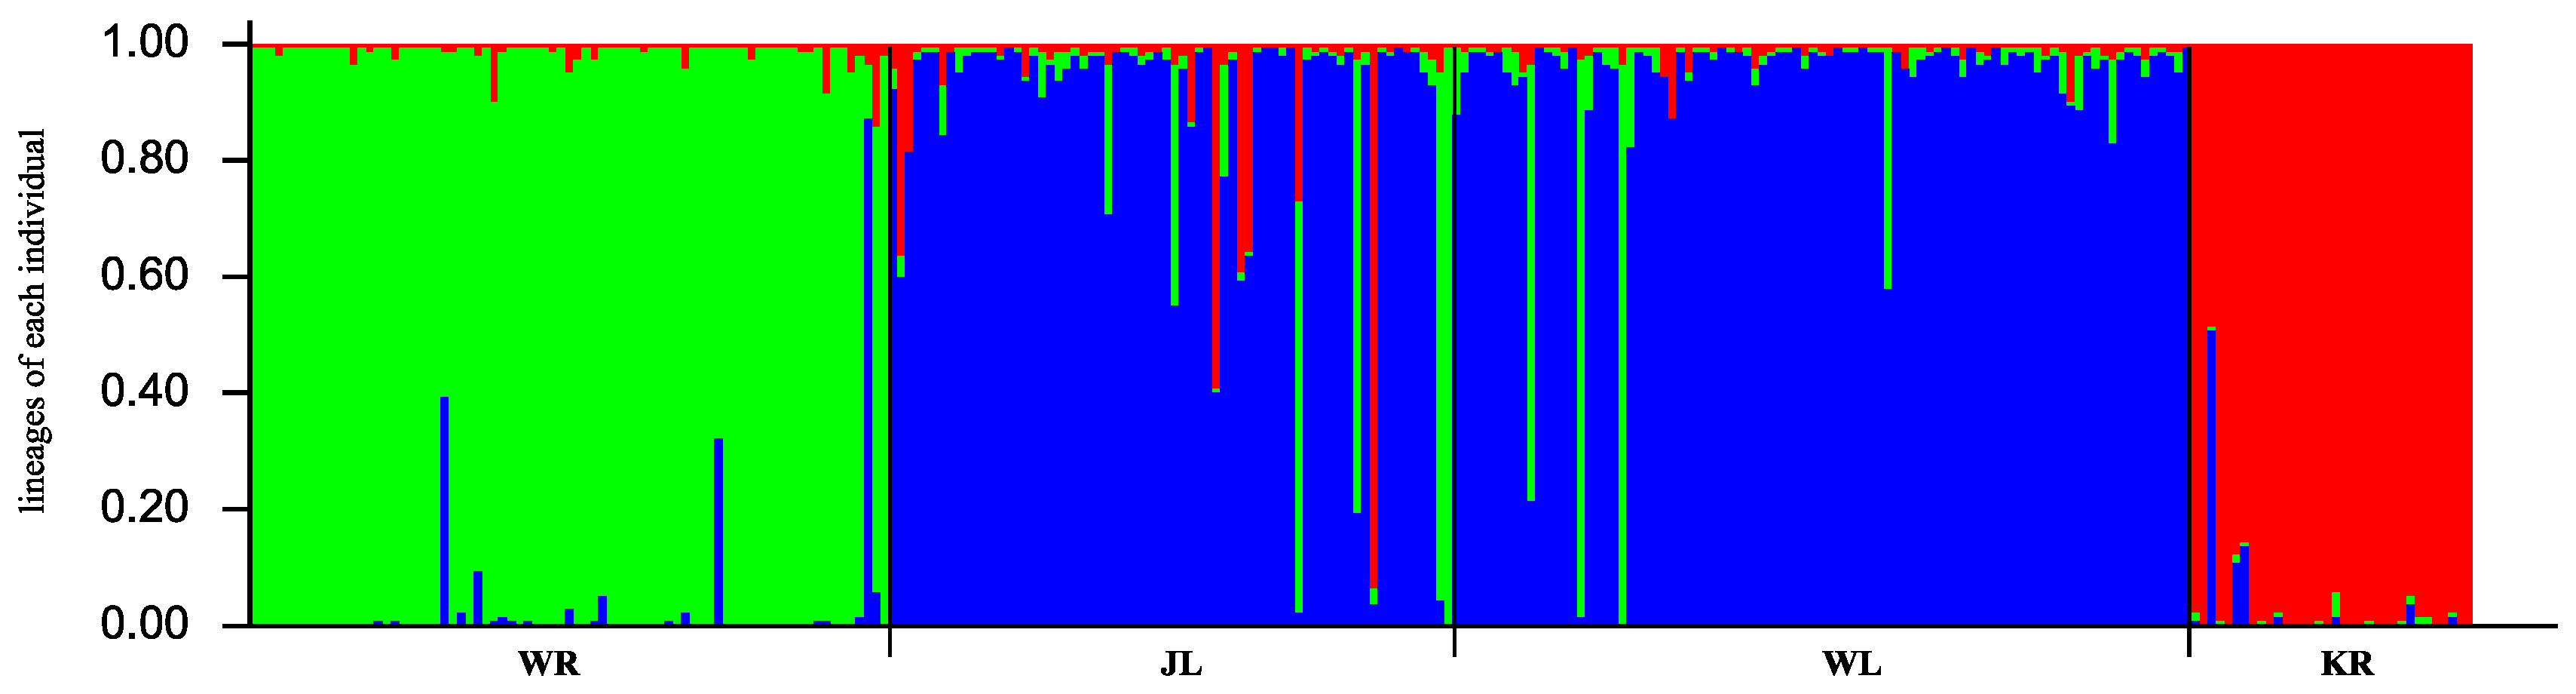
3.5. Analysis of the Population Genetic Components

According to the results from Structure Harvester, K = 3 was the best value to cluster the four populations because the delta K value was the largest. The four populations could then be classified into three genetic components (Figure 4): the WR population constituted one group, the KR population constituted another group, and the WL and JL populations were clustered into one group.

4. Discussion

4.1. Characteristics and Screening of P. fluviatilis Microsatellite Sequences

Among the 98,425 microsatellite loci in the P. fluviatilis genome, the dinucleotide repeats were the most abundant, which is consistent with most vertebrates [37,38], such as Sander lucioperca [39], Megalobrama amblycephala [40], and Lateolabrax maculatus [41]. Among the dinucleotide repeat sequences, the (AC)n core repetitive types accounted for the highest proportion, which is similar to the findings for Tetraodontidae [42]. The low content of the (CG)n core repeats is also consistent with that of most species. Schorderet and Gartler [43] believed that this phenomenon was caused by the methylation and deamination of cytidine C into thymine T through CpG.
The tetranucleotide-repeat microsatellite markers showed a higher level of polymorphism and greater stability than the dinucleotide repeats and trinucleotide repeats and are more suitable for analyzing the genetic differences between the populations [44]. In this study, among the tetranucleotide-repeat microsatellite loci, (AGAT)n was the most abundant (17.78%). This may have been due to the specificity of the species, as it is contrary to the research findings of Zheng et al. [45]. There were also differences in the repeat types of the tetranucleotide microsatellites among the different species. For example, in the Pinctada martensii EST database, (ATTT)n accounted for 50% of the tetranucleotide-repeat microsatellites [46]. Among the 29 pairs of microsatellite primers of P. fluviatilis used in this study, the core sequence was repeated more than 10 times and the number of alleles at each locus was not less than 4. Barker [47] pointed out that when microsatellite markers are used for genetic analyses, the number of alleles should not be less than four and those with fewer than four bands should be excluded. Therefore, the primers in this study could provide correct genetic information for the study of the population genetics of P. fluviatilis.

4.2. Genetic Diversity and Differentiation of P. fluviatilis Populations

Genetic diversity is not only a prerequisite for biological survival and development but also an important basis for assessing the status of genetic resources [48]. It can be determined based on indicators, such as Na, Ho, and PIC [49]. In this study, the genetic diversity of the two lakes was higher than that of the two rivers. In its early years, P. fluviatilis in the lake probably came from the Eerqisi River basin, which resulted in a greater genetic source in the lakes. Therefore, the genetic diversity of P. fluviatilis in the lakes was higher than that in the rivers of the WL–JL–WR basin. The water in the lake was more stable and, therefore, more suitable for spawning [50]. The KR population was the lowest based on the Na, Ho, and PIC parameters. The Kalaeerqisi River is an upstream tributary of the Eerqisi River; P. fluviatilis migrated upstream from Europe to China via the Eerqisi River, so the P. fluviatilis genetic resources of the KR population could not be better supplemented. Compared with the results of Yang et al. [51], the Ho and He of the Wulungu Lake were lower in this study, showing that the genetic richness of P. fluviatilis decreased and that the germplasm resource has deteriorated over the past years. Compared with P. fluviatilis around Lake Geneva, the Na, Ho, and He of the four populations in this study were higher [20], indicating that the genetic diversity of wild P. fluviatilis in China was higher than in Lake Geneva.
The genetic differentiation index (Fst) is an important parameter to describe population differentiation. The larger the Fst value, the greater the genetic distance and the more distant the genetic relationship between the populations. Wright [52] believed that Fst < 0.05 indicated low genetic differentiation, that 0.05 < Fst < 0.15 indicated moderate genetic differentiation, and that 0.15 < Fst < 0.25 indicated high genetic differentiation. The Fst among the four populations in the four regions of the Wulungu River, Wulungu Lake, Jili Lake, and the Kalaeerqisi River was 0.074, showing moderate genetic differentiation, probably due to the geographical proximity of the four regions. There was significant genetic differentiation among the different river basins. It is noteworthy that the highest degree of genetic differentiation was observed between the KR and WR populations. In 1969, the “Diversion Eji Lake” project introduced the Eerqisi River into the Wulungu Lake to reduce the salinity of the internal lake [53]; at the same time, fish entered the lake along the river [54]. This could have weakened the genetic differentiation. Therefore, the genetic differentiation between the KR and WL or JL populations was less than that between the KR and WR populations. The genetic differentiation among the river and lake populations in the Wulungu River basin reached a moderate level, with a significant river–lake differentiation. Although the water of the Wulungu River flows into Wulungu Lake through Jili Lake, a dam blocks the movement of P. fluviatilis from the river into the lake, causing geographical isolation, leading to the existing genetic differentiation between the rivers and lakes within the basin. There is no geographic barrier between Wulungu Lake and Jili Lake, which are connected by the Kuiga River. It was also seen from the AMOVA results that only 7.44% of the genetic variations occurred between the populations, while approximately 92.56% occurred within the populations. The UPGMA cluster tree was divided into three branches; this result was consistent with the structured genetic components.

5. Conclusions

Perca fluviatilis is an economically important species of freshwater fish. The developed microsatellites can be used for genetic structure analysis; dentification of related, inbred individuals in aquaculture settings; and detection of family structure. Based on the genome data for P. fluviatilis, we identified and designed 98,425 pairs of microsatellite primers. A total of 200 primer pairs for tetranucleotide microsatellites were synthesized and tested in wild individuals. Among them, 152 microsatellite markers were found to be polymorphic. We selected 29 markers with clear amplified bands and high polymorphism for the genetic analysis of the four populations. The results showed that the genetic diversity of the two lakes was higher than that of the two rivers. We conclude that it is essential to protect the germplasm resources of P. fluviatilis in the Kalaeerqisi River so that the genetic diversity will not be reduced or lost. Over the years, P. fluviatilis from Xinjiang has been introduced into many other regions for artificial cultivation. Our study used microsatellite markers to distinguish the genetic differences among the different populations and has laid a foundation for cross-regional introduction.

Supplementary Materials

The following supporting information can be downloaded at: https://www.mdpi.com/article/10.3390/ani12141809/s1, Table S1: A total of 98,425 pairs of microsatellite primers were identified and designed from the P. fluviatilis genomic data; Table S2: The result of 200 microsatellite markers evaluated by four random wild individuals in P.fluviatilis. Table S3: Genetic diversity parameters of 29 microsatellite markers in four Perca fluviatilis populations.

Author Contributions

Conceptualization, X.Z.; methodology, X.Z. and C.L. (Cuiyun Lu); resources, D.C., T.H. and H.J.; investigation, P.X., Z.S. and C.L. (Chao Li); formal analysis, Y.K. and C.L. (Cuiyun Lu); writing—original draft preparation, P.X.; writing—review and editing, C.L. (Cuiyun Lu), X.Z. and P.X. All authors have read and agreed to the published version of the manuscript.

Funding

This research was funded by the Finance Special Fund of the Ministry of Agriculture and Rural Affairs (Fisheries Resources and Environment Survey in the Key Water Areas of Northwest China) and the National Freshwater Aquatic Germplasm Resource Center (FGRC: 18537). We have received funds to cover publication costs.

Institutional Review Board Statement

The study was conducted according to the guidelines of the Declaration of Helsinki and approved by the Institutional Ethics Committee of the Heilongjiang River Fisheries research institute of the Chinese Academy of Fishery Sciences (20181203-001).

Informed Consent Statement

Not applicable.

Data Availability Statement

Not applicable.

Acknowledgments

We thank the Heilongjiang River Fisheries research institute for providing materials and instrument for experiments.

Conflicts of Interest

The authors declare that no conflicting financial interest or personal relationships exist among them that could influence the work reported in this paper.

References

  1. Thorpe, J. Synopsis of biological data on the perch, Perca fluviatilis Linnaeus, 1785 and Perca flavescens Mitchill, 1814. FAO Fish. Synop. 2012, 113, 117–138. [Google Scholar]
  2. Fontaine, P. L’élevage de la perche commune, une voie de diversification pour l’aquaculture continentale. INRA Prod. Anim. 2004, 17, 189–193. [Google Scholar] [CrossRef]
  3. Hjelm, J.; Persson, L.; Christensen, B. Growth, morphological variation and ontogenetic niche shifts in perch (Perca fluviatilis) in relation to resource availability. Oecologia 2000, 122, 190–199. [Google Scholar] [CrossRef]
  4. Mairesse, G.; Thomas, M.; Gardeur, J.-N.; Brun-Bellut, J. Appearance and technological characteristics in wild and reared Eurasian perch, Perca fluviatilis (L.). Aquaculture 2004, 246, 295–311. [Google Scholar] [CrossRef]
  5. Stejskal, V.; Matoušek, J.; Prokešová, M.; Podhorec, P.; Křišťan, J.; Policar, T.; Gebauer, T. Fin damage and growth parameters relative to stocking density and feeding method in intensively cultured European perch (Perca fluviatilis L.). J. Fish Dis. 2020, 43, 253–262. [Google Scholar] [CrossRef]
  6. Sarosiek, B.; Dryl, K.; Kowalski, R.K.; Palińska-Żarska, K.; Żarski, D. Optimalisation of the Activation Medium and Effect of Inhibiting Activities of Acid Phosphatase, Lactate Dehydrogenase and β-N-Acetylglucosaminidase on the Fertilisation Success of Eurasian Perch (Perca fluviatilis L.). Animals 2022, 12, 307. [Google Scholar] [CrossRef]
  7. Qiao, D.; Ling, Q.; Yin, J.; Li, Y.; Cai, X.; He, Z. Development of embryo and yolk-sac stage larva of perch (Perca fluviatilis). J. Biol. 2006, 23, 34–38. [Google Scholar]
  8. Juhásová, Ľ.; Radačovská, A.; Bazsalovicsova, E.; Miklisová, D.; Bindzárová-Gereľová, M.; Králová-Hromadová, I. A study of the endohelminths of the European perch Perca fluviatilis L. from the central region of the Danube river basin in Slovakia. ZooKeys 2019, 899, 47. [Google Scholar] [CrossRef] [Green Version]
  9. Muñoz, J.C.V.; Feld, C.K.; Hilt, S.; Manfrin, A.; Nachev, M.; Köster, D.; Jochmann, M.A.; Schmidt, T.C.; Sures, B.; Ziková, A. Eye fluke infection changes diet composition in juvenile European perch (Perca fluviatilis). Sci. Rep. 2021, 11, 1–14. [Google Scholar]
  10. Zare, M.; Tran, H.Q.; Prokešová, M.; Stejskal, V. Effects of Garlic Allium sativum Powder on Nutrient Digestibility, Haematology, and Immune and Stress Responses in Eurasian Perch Perca fluviatilis Juveniles. Animals 2021, 11, 2735. [Google Scholar] [CrossRef]
  11. Stejskal, V.; Tran, H.Q.; Prokesova, M.; Gebauer, T.; Giang, P.T.; Gai, F.; Gasco, L. Partially Defatted Hermetia illucens Larva Meal in Diet of Eurasian Perch (Perca fluviatilis) Juveniles. Animals 2020, 10, 1876. [Google Scholar] [CrossRef] [PubMed]
  12. Jaramillo, P.; Atkinson, R.; Gentile, G. Evaluating Genetic Diversity for the Conservation of the Threatened Galapagos Endemic Calandrinia galapagosa (Portulacaceae). Biotropica 2011, 43, 386–392. [Google Scholar] [CrossRef]
  13. Lu, C.; Sun, Z.; Xu, P.; Na, R.; Lv, W.; Cao, D.; Liu, T.; Zheng, X. Novel microsatellites reveal wild populations genetic variance in pike-perch (Sander lucioperca) in China. Aquac. Rep. 2022, 23, 101031. [Google Scholar] [CrossRef]
  14. Nesbø, C.L.; Fossheim, T.; Vøllestad, L.; Jakobsen, K. Genetic divergence and phylogeographic relationships among European perch (Perca fluviatilis) populations reflect glacial refugia and postglacial colonization. Mol. Ecol. 1999, 8, 1387–1404. [Google Scholar] [CrossRef] [PubMed]
  15. Schindler, D.E.; Hilborn, R.; Chasco, B.; Boatright, C.P.; Quinn, T.P.; Rogers, L.A.; Webster, M.S. Population diversity and the portfolio effect in an exploited species. Nature 2010, 465, 609–612. [Google Scholar] [CrossRef] [PubMed]
  16. Hai, S.; Meng, W.; Yang, T.; Zhang, F. Genetic diversity analysis of Perca fluviatilis based on mtDNA control region sequences. Chin. J. Fish. 2012, 25, 38–41. [Google Scholar]
  17. Wu, F.; Hu, W.; Wang, C.; Guo, Y.; Mo, C. Genetic diverity of the cultivated and natural Perca fluviatilis. Acta Hydrobiol. Sin. 2016, 40, 181–188. [Google Scholar]
  18. Zhou, Y.; Wu, J.; Wang, Z.; Li, G.; Zhou, L.; Gui, J. Microsatellite polymorphism and genetic differentiation of different populations screened from genome survey sequencing in red-tail catfish (Hemibagrus wyckioides). Aquac. Rep. 2021, 19, 100614. [Google Scholar] [CrossRef]
  19. Fu, C.; Ai, Q.; Cai, L.; Qiu, F.; Yao, L.; Wu, H. Genetic Diversity and Population Dynamics of Leptobrachium leishanense (Anura: Megophryidae) as Determined by Tetranucleotide Microsatellite Markers Developed from Its Genome. Animals 2021, 11, 3560. [Google Scholar] [CrossRef]
  20. Khadher, S.B.; Agnèse, J.-F.; Milla, S.; Teletchea, F.; Fontaine, P. Patterns of genetic structure of Eurasian perch (Perca fluviatilis L.) in Lake Geneva at the end of the spawning season. J. Great Lakes Res. 2015, 41, 846–852. [Google Scholar] [CrossRef]
  21. Kánainé Sipos, D.; Csenki-Bakos, K.; Ősz, Á.; Bokor, Z.; Kotrik, L.; Żarski, D.; Ittzés, I.; Urbányi, B.; Kovács, B. Twelve new microsatellite loci of Eurasian perch Perca fluviatilis Linnaeus, 1758. Biol. Futura 2021, 72, 385–393. [Google Scholar] [CrossRef] [PubMed]
  22. Benson, D.A.; Cavanaugh, M.; Clark, K.; Karsch-Mizrachi, I.; Lipman, D.J.; Ostell, J.; Sayers, E.W. GenBank. Nucl. Acids Res. 2012, 41, D36–D42. [Google Scholar] [CrossRef] [PubMed] [Green Version]
  23. Frank, K.; Bana, N.; Bleier, N.; Sugár, L.; Stéger, V.; Nagy, J.; Wilhelm, J.; Kálmán, Z.; Barta, E.; Orosz, L.; et al. Mining the red deer genome (CerEla1.0) to develop X-and Y-chromosome-linked STR markers. PLoS ONE 2020, 15, e0242506. [Google Scholar] [CrossRef]
  24. Xu, Y.; Hu, Z.; Li, W.; Zeng, T.; Zhang, X.; Li, J.; Zhang, W.; Yue, B. Isolation and strategies of novel tetranucleotide microsatellites with polymorphisms from different chromosomes of the rhesus monkey (Macaca mulatta). Mol. Biol. Rep. 2019, 46, 3955–3966. [Google Scholar] [CrossRef] [PubMed]
  25. Göl, Ş.; Göktay, M.; Allmer, J.; Doğanlar, S.; Frary, A. Newly developed SSR markers reveal genetic diversity and geographical clustering in spinach (Spinacia oleracea). Mol. Genet. Genomics 2017, 292, 847–855. [Google Scholar] [CrossRef]
  26. Li, S. Distribution Regionalization of Freshwater Fishes in China, 1st ed.; Science Press: Beijing, China, 1981; pp. 75–76. [Google Scholar]
  27. Ozerov, M.Y.; Ahmad, F.; Gross, R.; Pukk, L.; Kahar, S.; Kisand, V.; Vasemägi, A. Highly continuous genome assembly of Eurasian perch (Perca fluviatilis) using linked-read sequencing. G3 Genes Genomes Genet. 2018, 8, 3737–3743. [Google Scholar] [CrossRef] [PubMed] [Green Version]
  28. Li, C.; Lu, C.; Zheng, X.; Cheng, L.; Xu, P.; Sun, X. A simple and effecient method for preserving fish fins. Chin. J. Fish. 2014, 27, 22–24. [Google Scholar]
  29. Becker, J.; Heun, M. Barley microsatellites: Allele variation and mapping. Plant Mol. Biol. 1995, 27, 835–845. [Google Scholar] [CrossRef]
  30. Koressaar, T.; Remm, K.M. Enhancements and modifications of primer design program Primer3. Bioinformatics 2007, 23, 1289–1291. [Google Scholar] [CrossRef] [Green Version]
  31. Sambrook, J.; Russell, D.W. Molecular Cloning: A Laboratory Manual, 3rd ed.; Science Press: Beijing, China, 2002; pp. 463–471. [Google Scholar]
  32. Chi, T. Development and Application of Microsatellite Markers Based on Next-Generation Sequencing for Rana Dybowskii. Master’s Thesis, Shenyang Normal University, Shenyang, China, 2020. [Google Scholar]
  33. Yeh, F.; Yang, R.; Boyle, T.; Ye, Z.; Xiyan, J.; Yang, R.; Boyle, T. PopGene32, Microsoft Windows-Based Freeware for Population Genetic Analysis, Version 1.32; University of Alberta and Centre for International Forestry Research: Edmonton, AB, Canada, 1999.
  34. Botstein, D.; White, R.L.; Skolnick, M.; Davis, R.W. Construction of a genetic linkage map in man using restriction fragment length polymorphisms. Am. J. Hum. Genet. 1980, 32, 314–331. [Google Scholar]
  35. Excoffier, L.; Laval, G.; Schneider, S. Arlequin (version 3.0): An integrated software package for population genetics data analysis. Evol. Bioinform. Online 2007, 1, 47–50. [Google Scholar] [CrossRef] [PubMed] [Green Version]
  36. Pritchard, J.K.; Stephens, M.; Donnelly, P. Inference of population structure using multilocus genotype data. Genetics 2000, 155, 945–959. [Google Scholar] [CrossRef] [PubMed]
  37. Ma, Z.Q.; Röder, M.; Sorrells, M.E. Frequencies and sequence characteristics of di-, tri-, and tetra-nucleotide microsatellites in wheat. Genome 1996, 39, 123–130. [Google Scholar] [CrossRef] [PubMed]
  38. Tóth, G.; Gáspári, Z.; Jurka, J. Microsatellites in Different Eukaryotic Genomes: Survey and Analysis. Genome Res. 2000, 10, 967–981. [Google Scholar] [CrossRef] [Green Version]
  39. Han, X.; Ling, Q.; Li, C.; Wang, G.; Xu, Z.; Lu, G. Characterization of pikeperch (Sander lucioperca) transcriptome and development of SSR markers. Biochem. Syst. Ecol. 2016, 66, 188–195. [Google Scholar] [CrossRef]
  40. Gao, Z.; Luo, W.; Liu, H.; Zeng, C.; Liu, X.; Yi, S.; Wang, W. Transcriptome Analysis and SSR/SNP Markers Information of the Blunt Snout Bream (Megalobrama amblycephala). PLoS ONE 2012, 7, e42637. [Google Scholar] [CrossRef] [Green Version]
  41. Fan, S.; Huang, H.; Liu, Y.; Wang, P.; Zhao, C.; Yan, L.; Qiao, X.; Qiu, L. Genome-wide identification of microsatellite and development of polymorphic SSR markers for spotted sea bass (Lateolabrax maculatus). Aquac. Rep. 2021, 20, 100677. [Google Scholar]
  42. Cui, J.; Shen, X.; Yang, G.; Gong, Q.; Gu, Q. The Analysis of Simple Sequence Repeats in Takifugu rubripes Genome. J. Ocean Univ. China 2006, 36, 249–254, 272. [Google Scholar]
  43. Schorderet, D.F.; Gartler, S.M. Analysis of CpG suppression in methylated and nonmethylated species. Proc. Natl. Acad. Sci. USA 1992, 89, 957–961. [Google Scholar] [CrossRef] [Green Version]
  44. Lu, C.; Mao, R.; Li, O.; Geng, L.; Sun, X.; Liang, L. Isolation and characterization of polymorphic tri- and tetra-nucleotide repeat microsatellite loci in common carp (Cyprinus carpio). Chin. J. Agric. Biotechol. 2009, 17, 979–987. [Google Scholar]
  45. Zheng, X.; Lu, C.; Sun, Z.; Dang, H.; Kuang, Y.; Cao, D.; Bai, Q.; Sun, X. Development of microsatellite markers based on transcriptome and population genetic structure analysis of introduced Salvelinus fontinalis. J. Fish. China 2020, 44, 1599–1608. [Google Scholar]
  46. Hong, K.; Guo, X.; Wang, Y.; Hou, Z.; Gu, Z.; Wang, A. Microsatellite markers screening from EST se-quences of Pinctada martensii (Dunker). J. Fish. China 2008, 32, 174–181. [Google Scholar]
  47. Barker, J.S.F. A global protocol for determining genetic distances among domestic livestock breeds. In Proceedings of the 5th World Congress on Genetics applied to Livestock Production, Guelph, ON, Canada, 7 August 1994. [Google Scholar]
  48. Zhou, L.; Xiao, Y.; Xia, W.; Yang, Y. Analysis of genetic diversity and population structure of oil palm (Elaeis guineensis) from China and Malaysia based on species-specific simple sequence repeat markers. Genet. Mol. Res. 2015, 14, 16247–16254. [Google Scholar] [CrossRef] [PubMed]
  49. Waples, R.S. A bias correction for estimates of effective population size based on linkage disequilibrium at unlinked gene loci. Conserv. Genet. 2006, 7, 167. [Google Scholar] [CrossRef] [Green Version]
  50. Wu, L.R.Z. The Research of Breeding Regularity of Perca fluviatilis in Wulungu Lake. Master’s Thesis, Xinjiang Agricultural University, Xinjiang, China, 2015. [Google Scholar]
  51. Yang, X.; Qian, L.; Wu, H.; Fan, Z.; Wang, C. Population differentiation, bottleneck and selection of Eurasian perch (Perca fluviatilis L.) at the Asian edge of its natural range. Biochem. Syst. Ecol. 2012, 40, 6–12. [Google Scholar] [CrossRef]
  52. Wright, S. Evolution and the Genetics of Populations, 1st ed.; University of Chicago Press: Chicago, IL, USA, 1984; p. 257. [Google Scholar]
  53. Xia, Q. “Yin E Ji Hai” outstanding achievement. Arid Environ. Monitor. 1989, 3, 11–12. [Google Scholar]
  54. Zuo, C.; Jiang, Z.; Li, S. Biology Studies of Cyprinus carpio in Lake Brento. Freshw. Fish. 2001, 31, 53–57. [Google Scholar]
Figure 1. Sampling distribution of four P. fluviatilis populations. WL: Wulungu Lake; JL: Jili Lake; WR: Wulungu River; KR: Kalaeerqisi River.
Animals 12 01809 g001
Figure 2. Distribution of microsatellite repeat motif types in the P. fluviatilis genome. Different colors represent the repeat times of different core sequences. (a) Type and number of dinucleotide core repeats. (b) Type and number of trinucleotide core repeats. (c) Type and number of tetranucleotide core repeats. (d) Type and number of pentanucleotide core repeats.
Animals 12 01809 g002
Figure 3. UPGMA dendrogram of four P. fluviatilis populations based on the unbiased genetic distance of Ne.
Animals 12 01809 g003
Figure 4. Estimated population genetic structure in which each vertical line represents an individual, different colors represent different genetic components, and the populations are separated by black lines (K = 3). The populations are labeled below the figure.
Animals 12 01809 g004
Table 1. Microsatellite primer sequences and amplification information for P. fluviatilis.
LocusForward Primer Sequence (5′–3′)Reverse Primer Sequence (5′–3′)Repeat MotifFragment Size/bp
HLJHL007GCTAATGCCTGACCACCACTCAGGTCCCTGGAGAAGAGAGA(ACAG)10109–130
HLJHL022CCCTGAGTGGAGCACATACCGGCCGAATTTTGCCTTTGTA(ACAG)12100–131
HLJHL045GATGGTCTCACGAGGCTAGCTCGGTTTGGATGGTCGGTTT(ACAG)1486–114
HLJHL052ACCTGAAGGCAAGTGGATGGCCTGGCCCTGAATGTACCAA(ACAG)1592–120
HLJHL056CAGCAGCCTGATCAGCATCATGCTTTACTTCCTCATCACAGC(ACAG)15120–148
HLJHL059GGTTTCAAGGGAGAGGGAGGGCAGCTCATGAACAACTCTGC(ACAG)1592–145
HLJHL084AGCTCGACTAGGGTGACTGTCCGAGCACTGCTACGAAACT(ACAG)18143–174
HLJHL089ATTCACACAAACAAGCAGGCGCTATGTGGCTCTTTGTATGCC(ACAG)19100–160
HLJHL090GGCGCTGTCCATGGTACTAAACCACGAAAAGCAAGAAGGC(ACAG)19117–162
HLJHL094ACTCACCATACGCATGTGCTCTCCTCAAAGTCGCCTTCCA(ACAG)19114–186
HLJHL104CCCAAATTTCCTGACAACCCAGGACTGTCCCGTGTTTCTCA(AGAT)10132–223
HLJHL105GCGCGATAAAATAATTGTCGGCTCAGGCTCAGGAATTTCTTTCA(AGAT)10107–148
HLJHL107AGACAGGGTGATAGTTACATCCATGTGCAAAATTTACATGGGATGA(AGAT)10118–188
HLJHL121ATTGGCATCAGAGCAAGCTGATGGGGCTTTGACGTGAGAG(AGAT)11184–265
HLJHL152GCCAACACCCTATAACTGAAGCCGTTGTTGCCAATGGAATGC(AGAT)14140–185
HLJHL153GGCTGATAAACATAGGCCTATGCAGCTACTGGGATCTTGAAGGT(AGAT)14123–151
HLJHL164CCACCTCTGCCACCTCATACCGAAGGGATCTCCATCTGCT(AGAT)15104–175
HLJHL165TCCAGTTGTCACTTCAGCGTAGGACACATTTCCTTCGGGA(AGAT)1588–194
HLJHL167CGTTTTGGATATGTGCCATGTTGGCACATATCTAAAACGTGGT(AGAT)15140–188
HLJHL169GCAGGGGCAAACAGTCATCATCTGTGAGCTACTGGGACCT(AGAT)16100–152
HLJHL172ACAGCCCATAACACAGCAGTTCTGCATGAACTAAAGTGTGACA(AGAT)16126–187
HLJHL174TCAGCTGCGGATTATTACACAGCAGTGATATTGCAACAGGAAA(AGAT)16131–162
HLJHL179GGTGATACATAGATAGGTAGGTCGGTCTGGTAGTCTCAGCTCGCT(AGAT)1696–153
HLJHL183TGTTGTCAGTGTGTTCATCCATGCATGGTGTTTTAAGTCAGGG(AGAT)17125–168
HLJHL186CAACCAGCTTCAACCCGTTGTCCACCTCTCCCTTTCCCTT(AGAT)17123–237
HLJHL189CCTCCTGTGTTTTGTGTCTTGGTCTCCAGTACTCACAATGGCT(AGAT)18124–175
HLJHL192TGGTTCTACAAGCTGCCTAAAAACCAGGCGTTGAGTTTCAA(AGAT)18102–168
HLJHL196TCTGAGACAAAGGGACATGAATCAGGAATTTCCCCAGTGTGG(AGAT)19111–183
HLJHL199TGGACTAAGACTGCCTACTGCCCTTGAGTTCACTTGCGTGT(AGAT)20134–190
Table 2. Repeat motifs and the proportion of tetranucleotide-repeat microsatellite loci in the P. fluviatilis genome.
Repeat Motif TypeCountProportion
(AGAT)n155617.78%
(ACAG)n133915.30%
(ATCC)n7528.59%
(AAAT)n6457.37%
(AAAG)n6106.97%
(ACAT)n5606.40%
(AATC)n4855.54%
(ACGC)n4425.05%
(AGGG)n4304.91%
(AATG)n3023.45%
(AAGG)n2342.67%
(AAAC)n2212.53%
(AAGT)n2012.30%
(ACTC)n1731.98%
(ACTG)n1351.54%
(AACT)n1271.45%
(AGGC)n1071.22%
(AGCT)n1011.15%
(AGCC)n750.86%
(AATT)n690.79%
(AACC)n520.59%
(ACCT)n400.46%
(ACCC)n370.42%
(ATGC)n220.25%
(ACCG)n90.10%
(AAGC)n80.09%
(AGCG)n70.08%
(ATCG)n40.05%
(ACGG)n30.03%
(CCCG)n20.02%
(ACGT)n20.02%
(CCGG)n10.01%
Table 3. Parameters of polymorphism described for the 29 microsatellite loci selected in the populations of P. fluviatilis.
LocusNaNeHoHePIC
HLJHL00742.2010.4030.5470.489
HLJHL02262.1690.4960.5400.450
HLJHL04582.1330.4850.5320.496
HLJHL05241.7840.4250.4400.364
HLJHL05652.8270.6230.6470.578
HLJHL059104.4440.6750.7760.741
HLJHL08491.3100.2390.2370.225
HLJHL089112.2640.4890.5590.528
HLJHL090111.6710.3730.4020.389
HLJHL094183.0570.6230.6740.661
HLJHL104177.5060.8690.8680.853
HLJHL105117.3890.8470.8660.850
HLJHL107189.9680.8960.9010.892
HLJHL1211910.0770.8770.9020.893
HLJHL152135.9490.7910.8330.811
HLJHL15384.1810.7160.7620.725
HLJHL164145.8630.7760.8310.809
HLJHL165203.2690.6080.6950.650
HLJHL167136.4860.5190.8470.827
HLJHL16993.2560.6900.6940.641
HLJHL172154.6770.7500.7880.765
HLJHL17494.7140.7310.7890.760
HLJHL179113.2730.6120.6960.658
HLJHL183123.9730.6980.7500.720
HLJHL1862910.9140.6940.9100.901
HLJHL192145.7830.6940.8290.808
HLJHL196152.3890.5260.5830.512
HLJHL199169.3610.8430.8950.884
HLJHL200156.5640.8130.8490.833
Detected results for 29 microsatellite loci and the genetic structure of P. fluviatilis in Xinjiang. Na: allele number; Ne: effective allele number; Ho: observed heterozygosity; He: expected heterozygosity; PIC: polymorphism index content.
Table 4. Results of the AMOVA based on 29 microsatellite markers.
Source of VariationDegree of Freedom (df)Sum of SquaresVariance ComponentsPercentage of Variation/%
Among populations3334.4620.7847.44
Within populations5325188.2299.75292.56
Total5355522.69010.536
Table 5. The genetic distance (D) (below-diagonal) and genetic differentiation index (Fst) (above-diagonal) of four P. fluviatilis populations.
PopulationWRJLWLKR
WR/0.087 *0.071 *0.158 *
JL0.205/0.0030.116 *
WL0.1570.027/0.100 *
KR0.2880.2440.1987/
* Indicates a significant difference (p < 0.05).
Publisher’s Note: MDPI stays neutral with regard to jurisdictional claims in published maps and institutional affiliations.

