
Towards the Identification of a Suitable Commercial Diet for Carpione (Salmo carpio, Linnaeus 1758): A Multidisciplinary Study on Fish Performances, Animal Welfare and Quality Traits

 , , , , , , , and
Abstract
:Simple Summary
Abstract
1. Introduction
2. Materials and Methods
2.1. Ethics
2.2. Experimental Diets
2.3. Fish Rearing Conditions, Calculation and Sampling
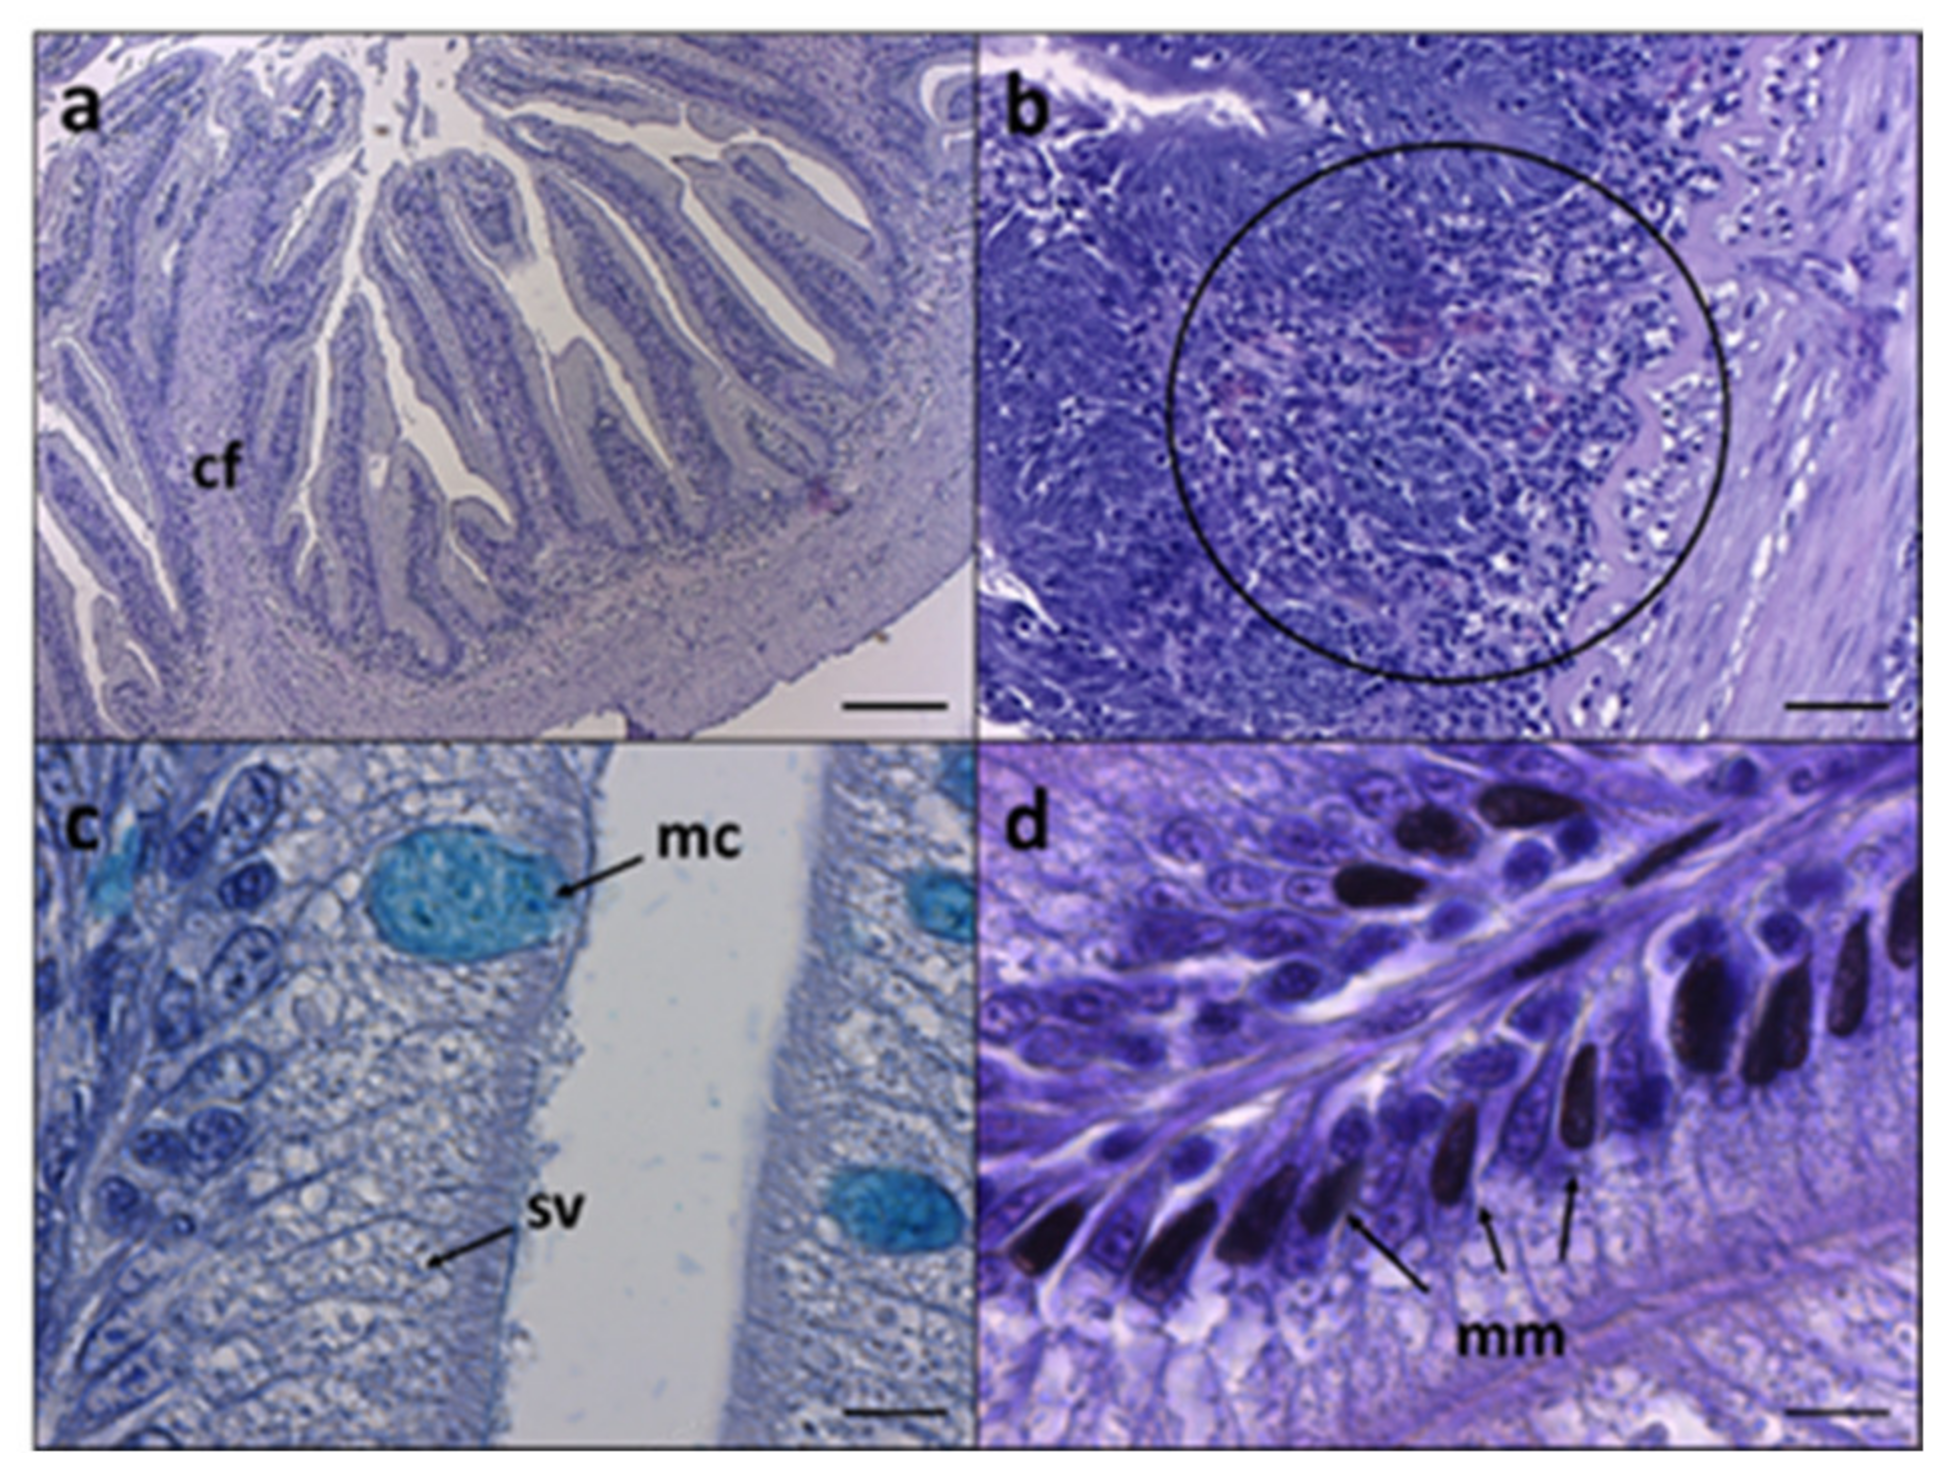
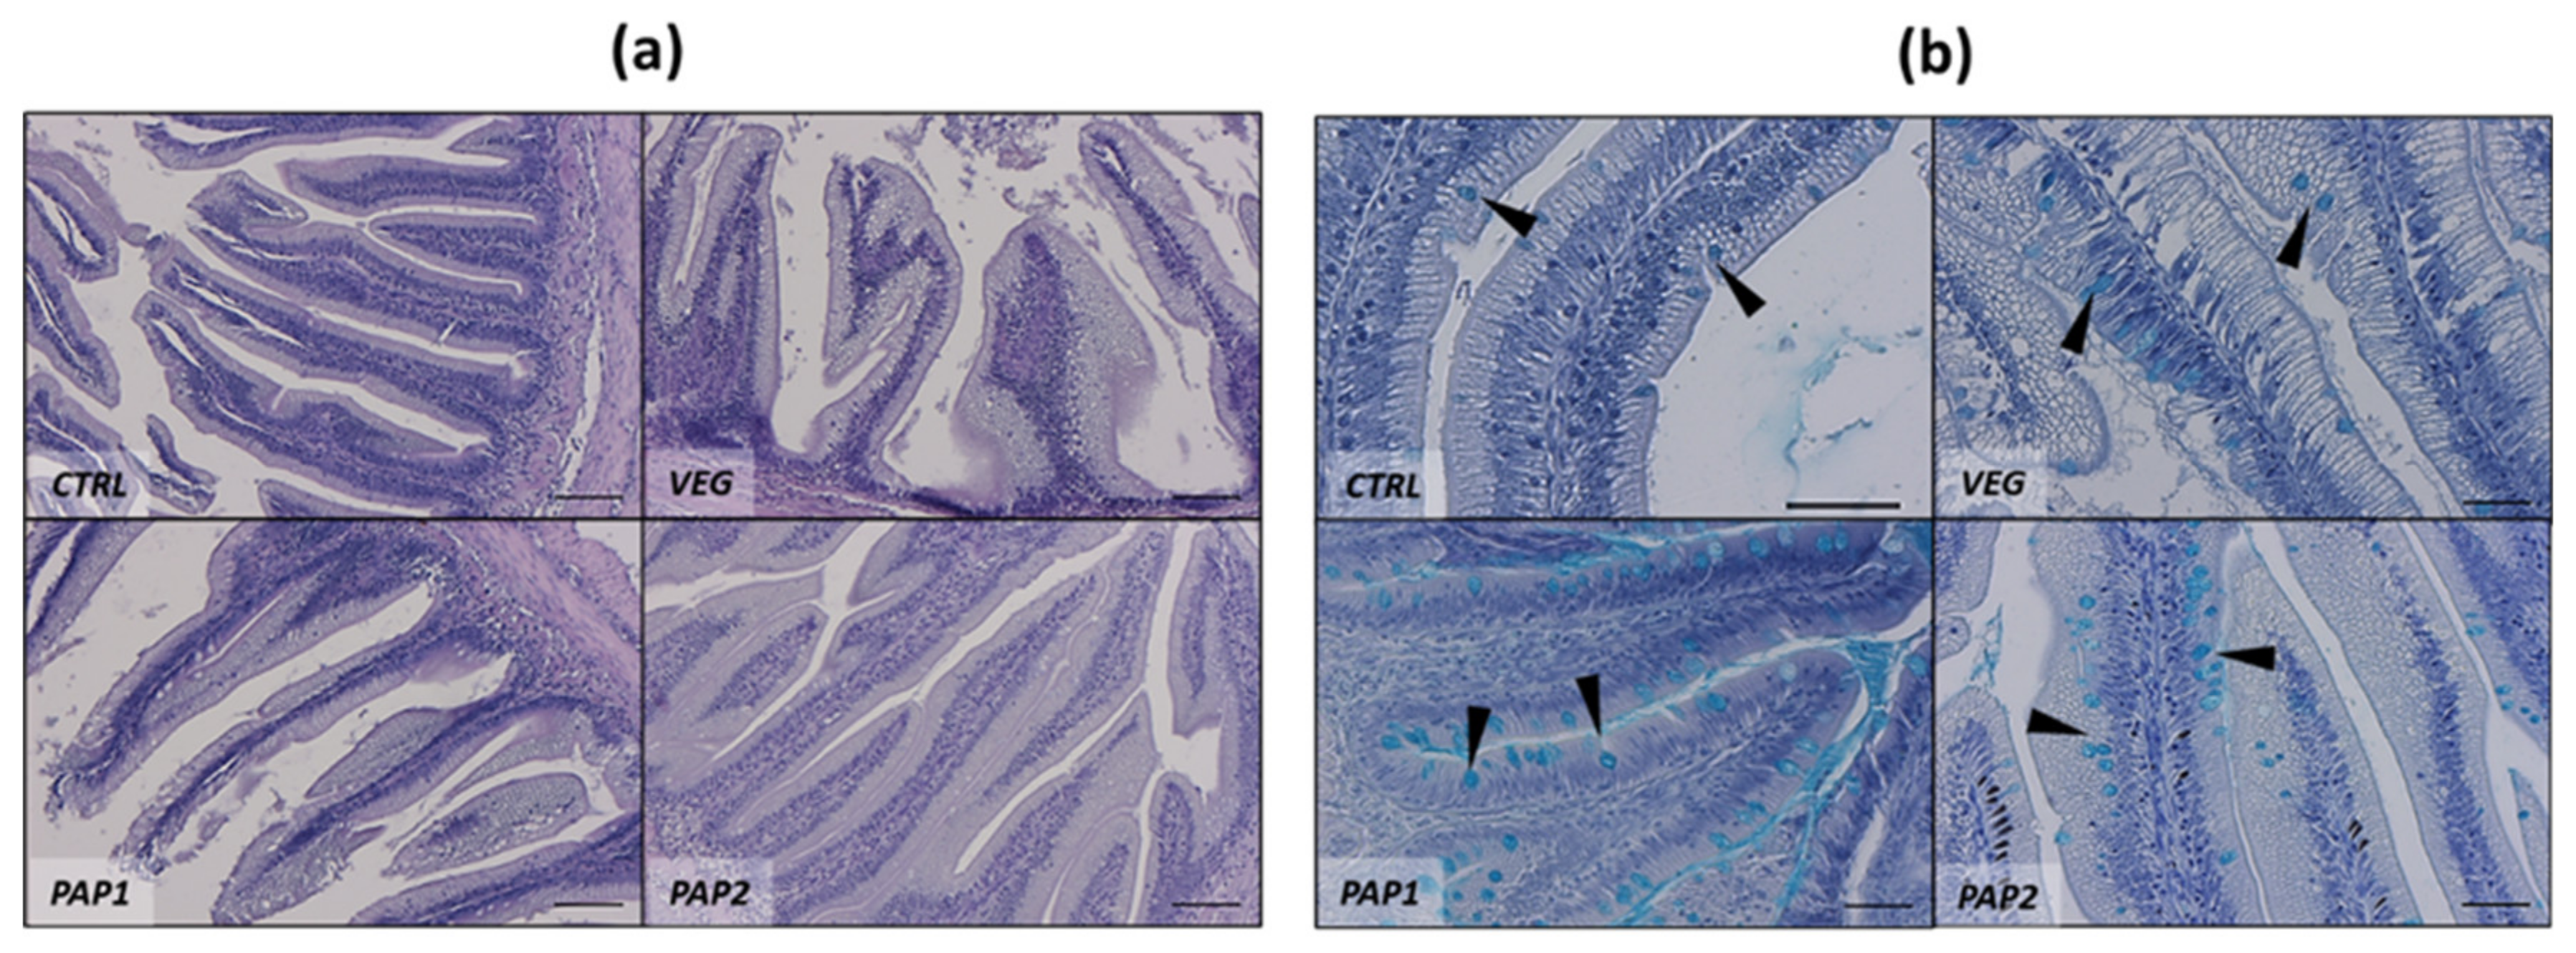
2.4. Intestine and Liver Histology
2.5. Fourier Transform Infrared Imaging (FTIRI) Spectroscopy Measurements and Data Analysis
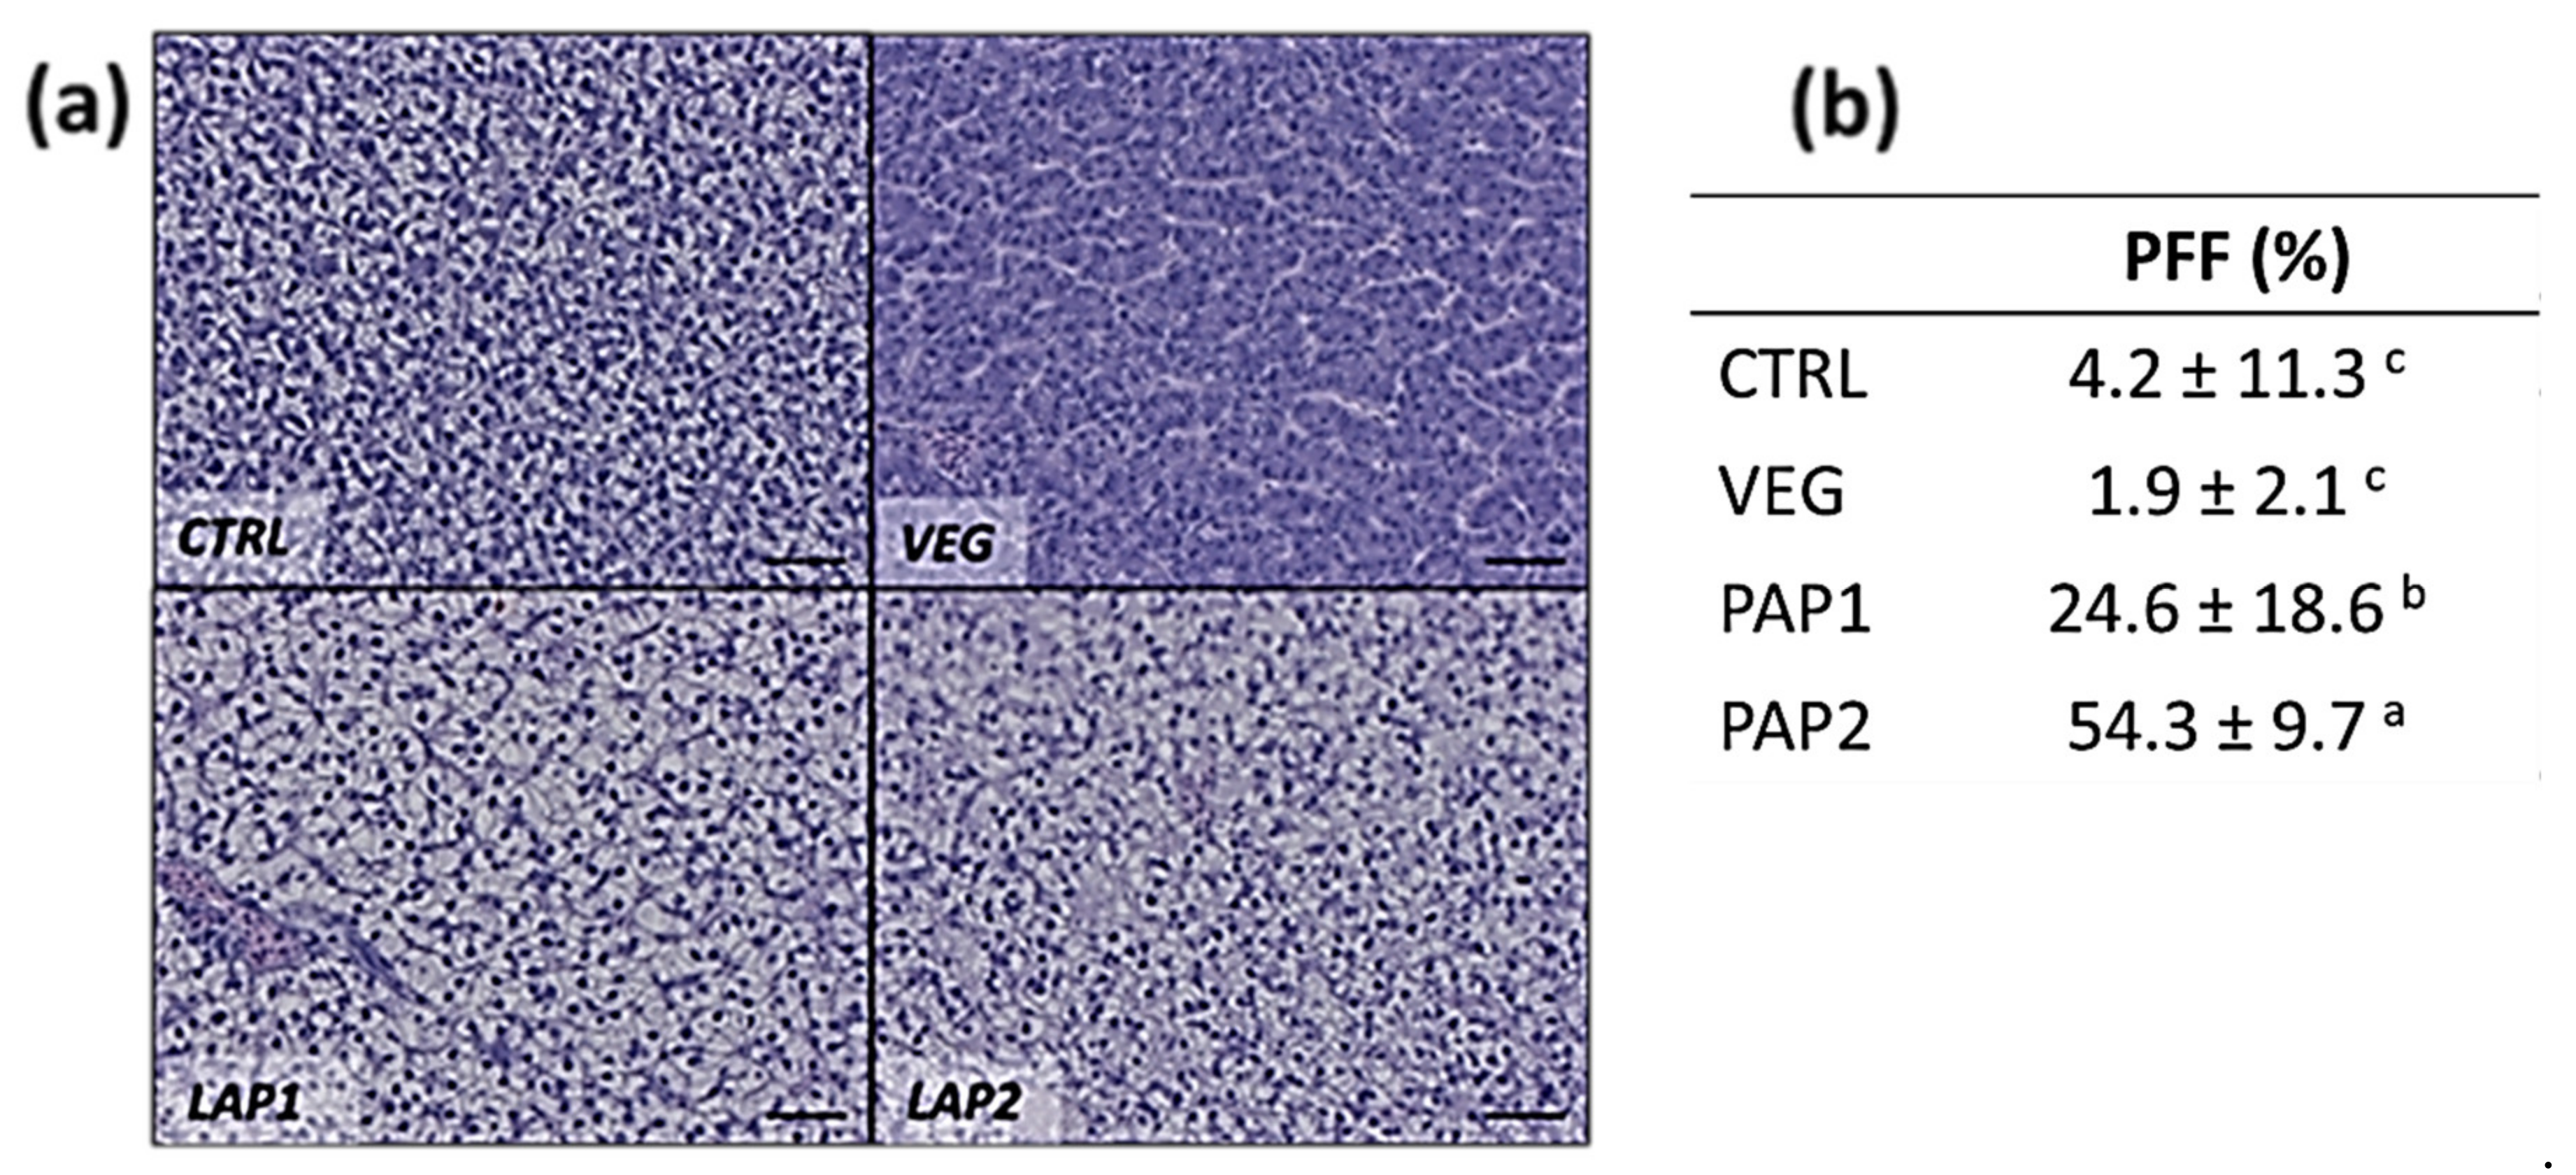
2.5.1. Liver
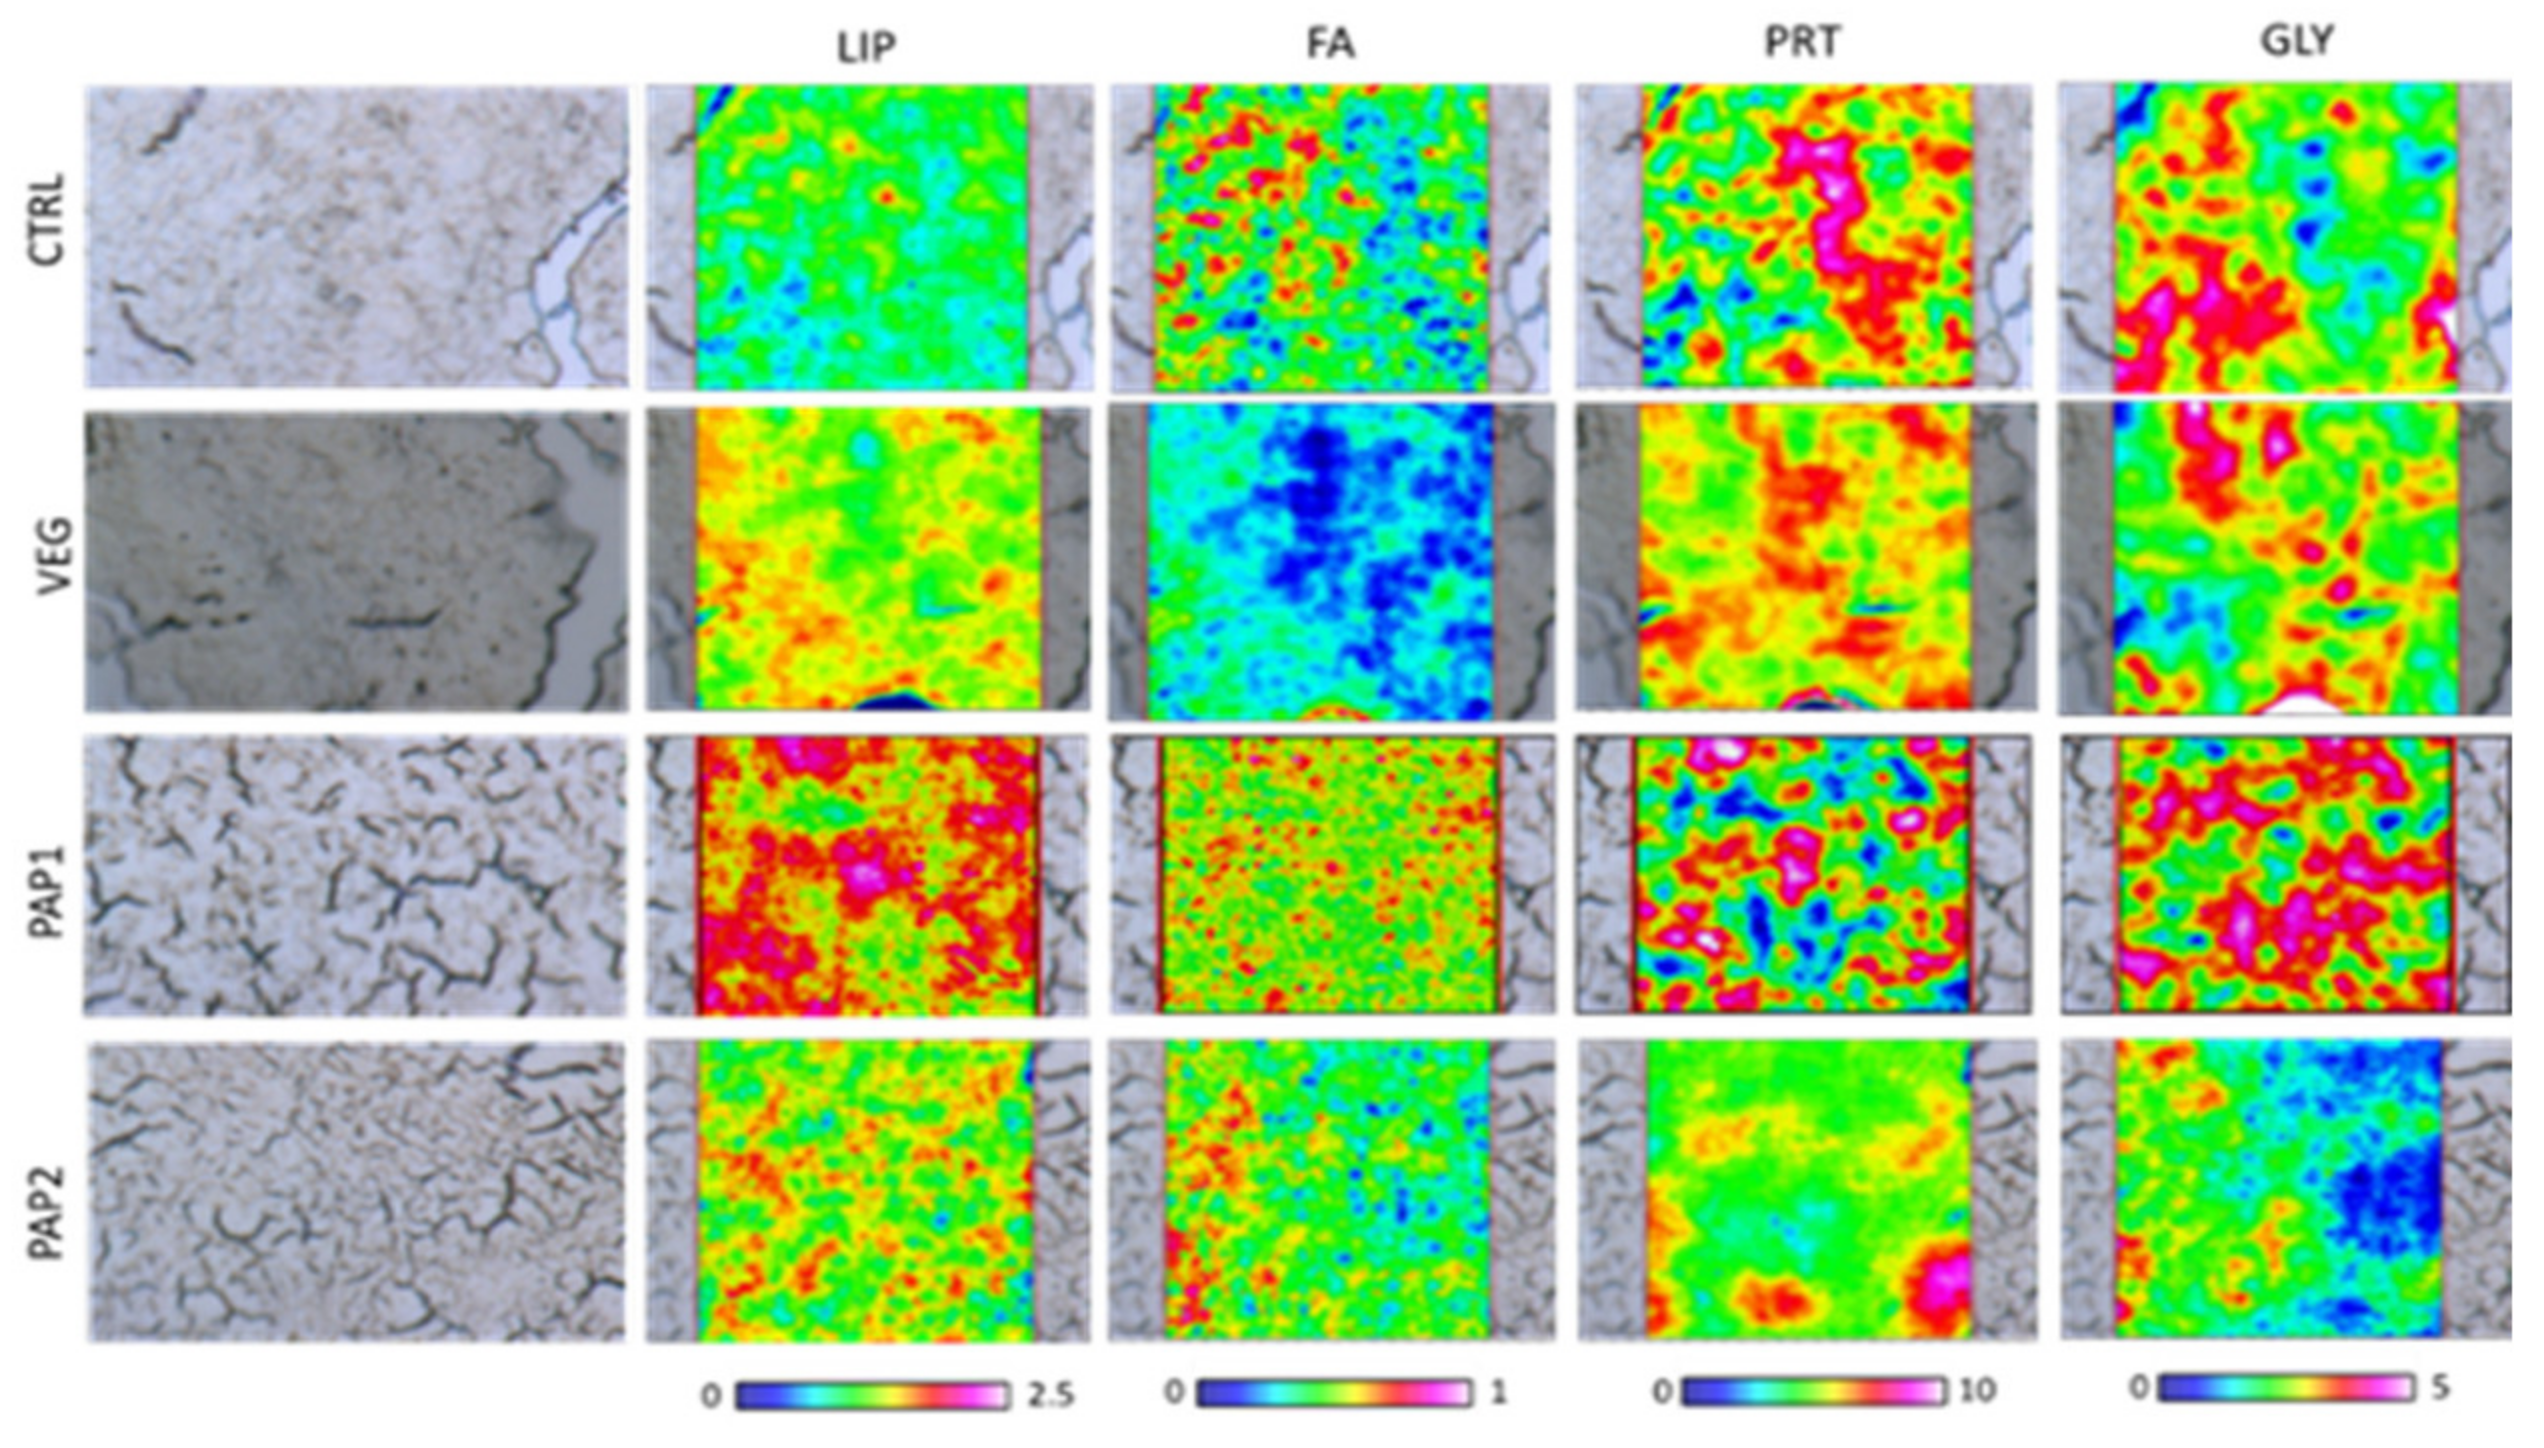
2.5.2. Fillet
2.6. RNA Extraction and cDNA Synthesis
2.7. Real Time PCR
2.8. Physical Characteristics Analyses of Fillets
2.9. Chemical Characteristics: Proximate Composition, Fatty Acid Profile, and Oxidative Status of the Diets and the Fillets
2.10. Statistical Analysis
3. Results
3.1. Fish Growth Performances
3.2. Intestine and Liver Histology
3.3. FTIRI Analysis
3.3.1. Liver
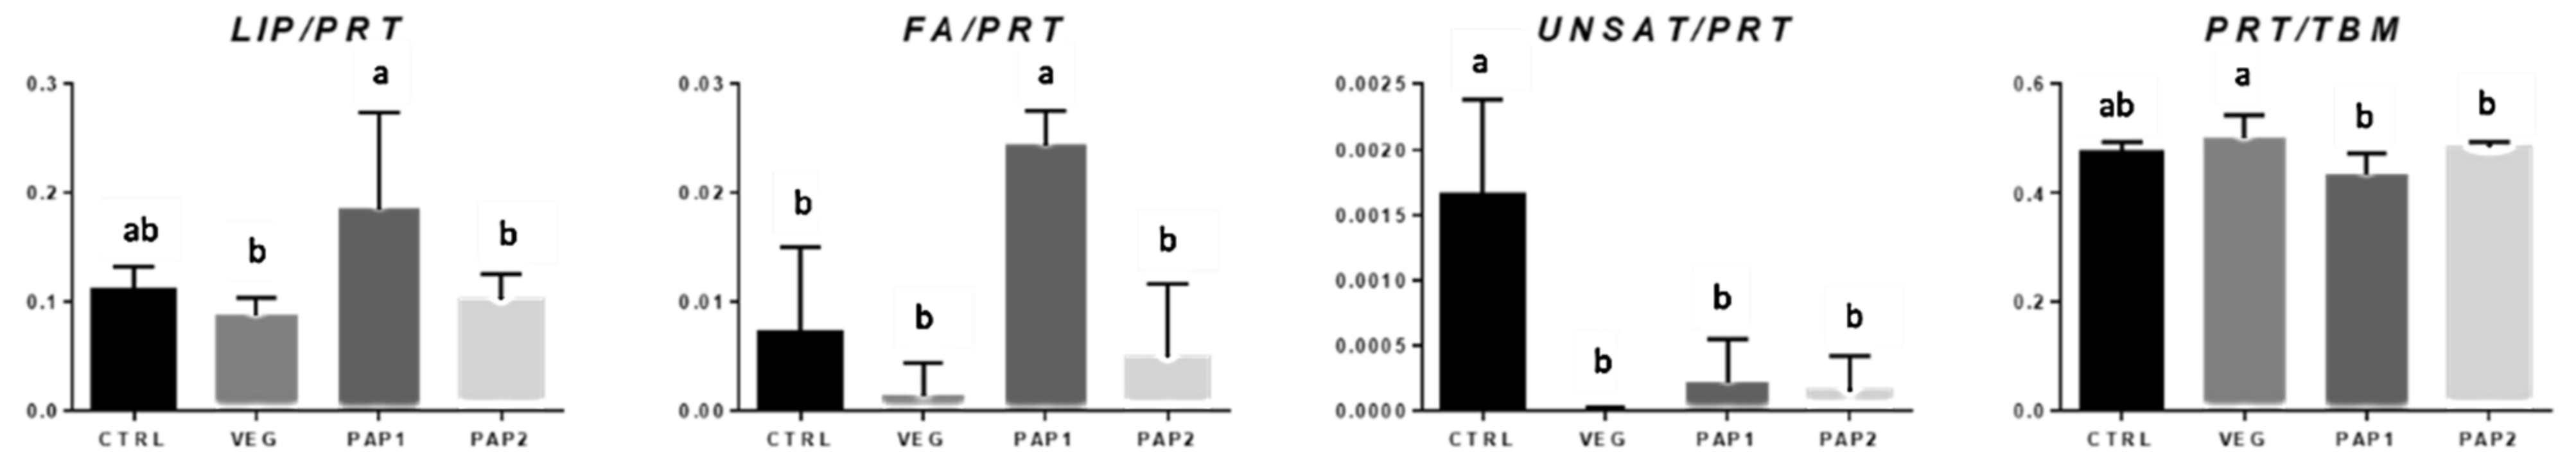
3.3.2. Fillet
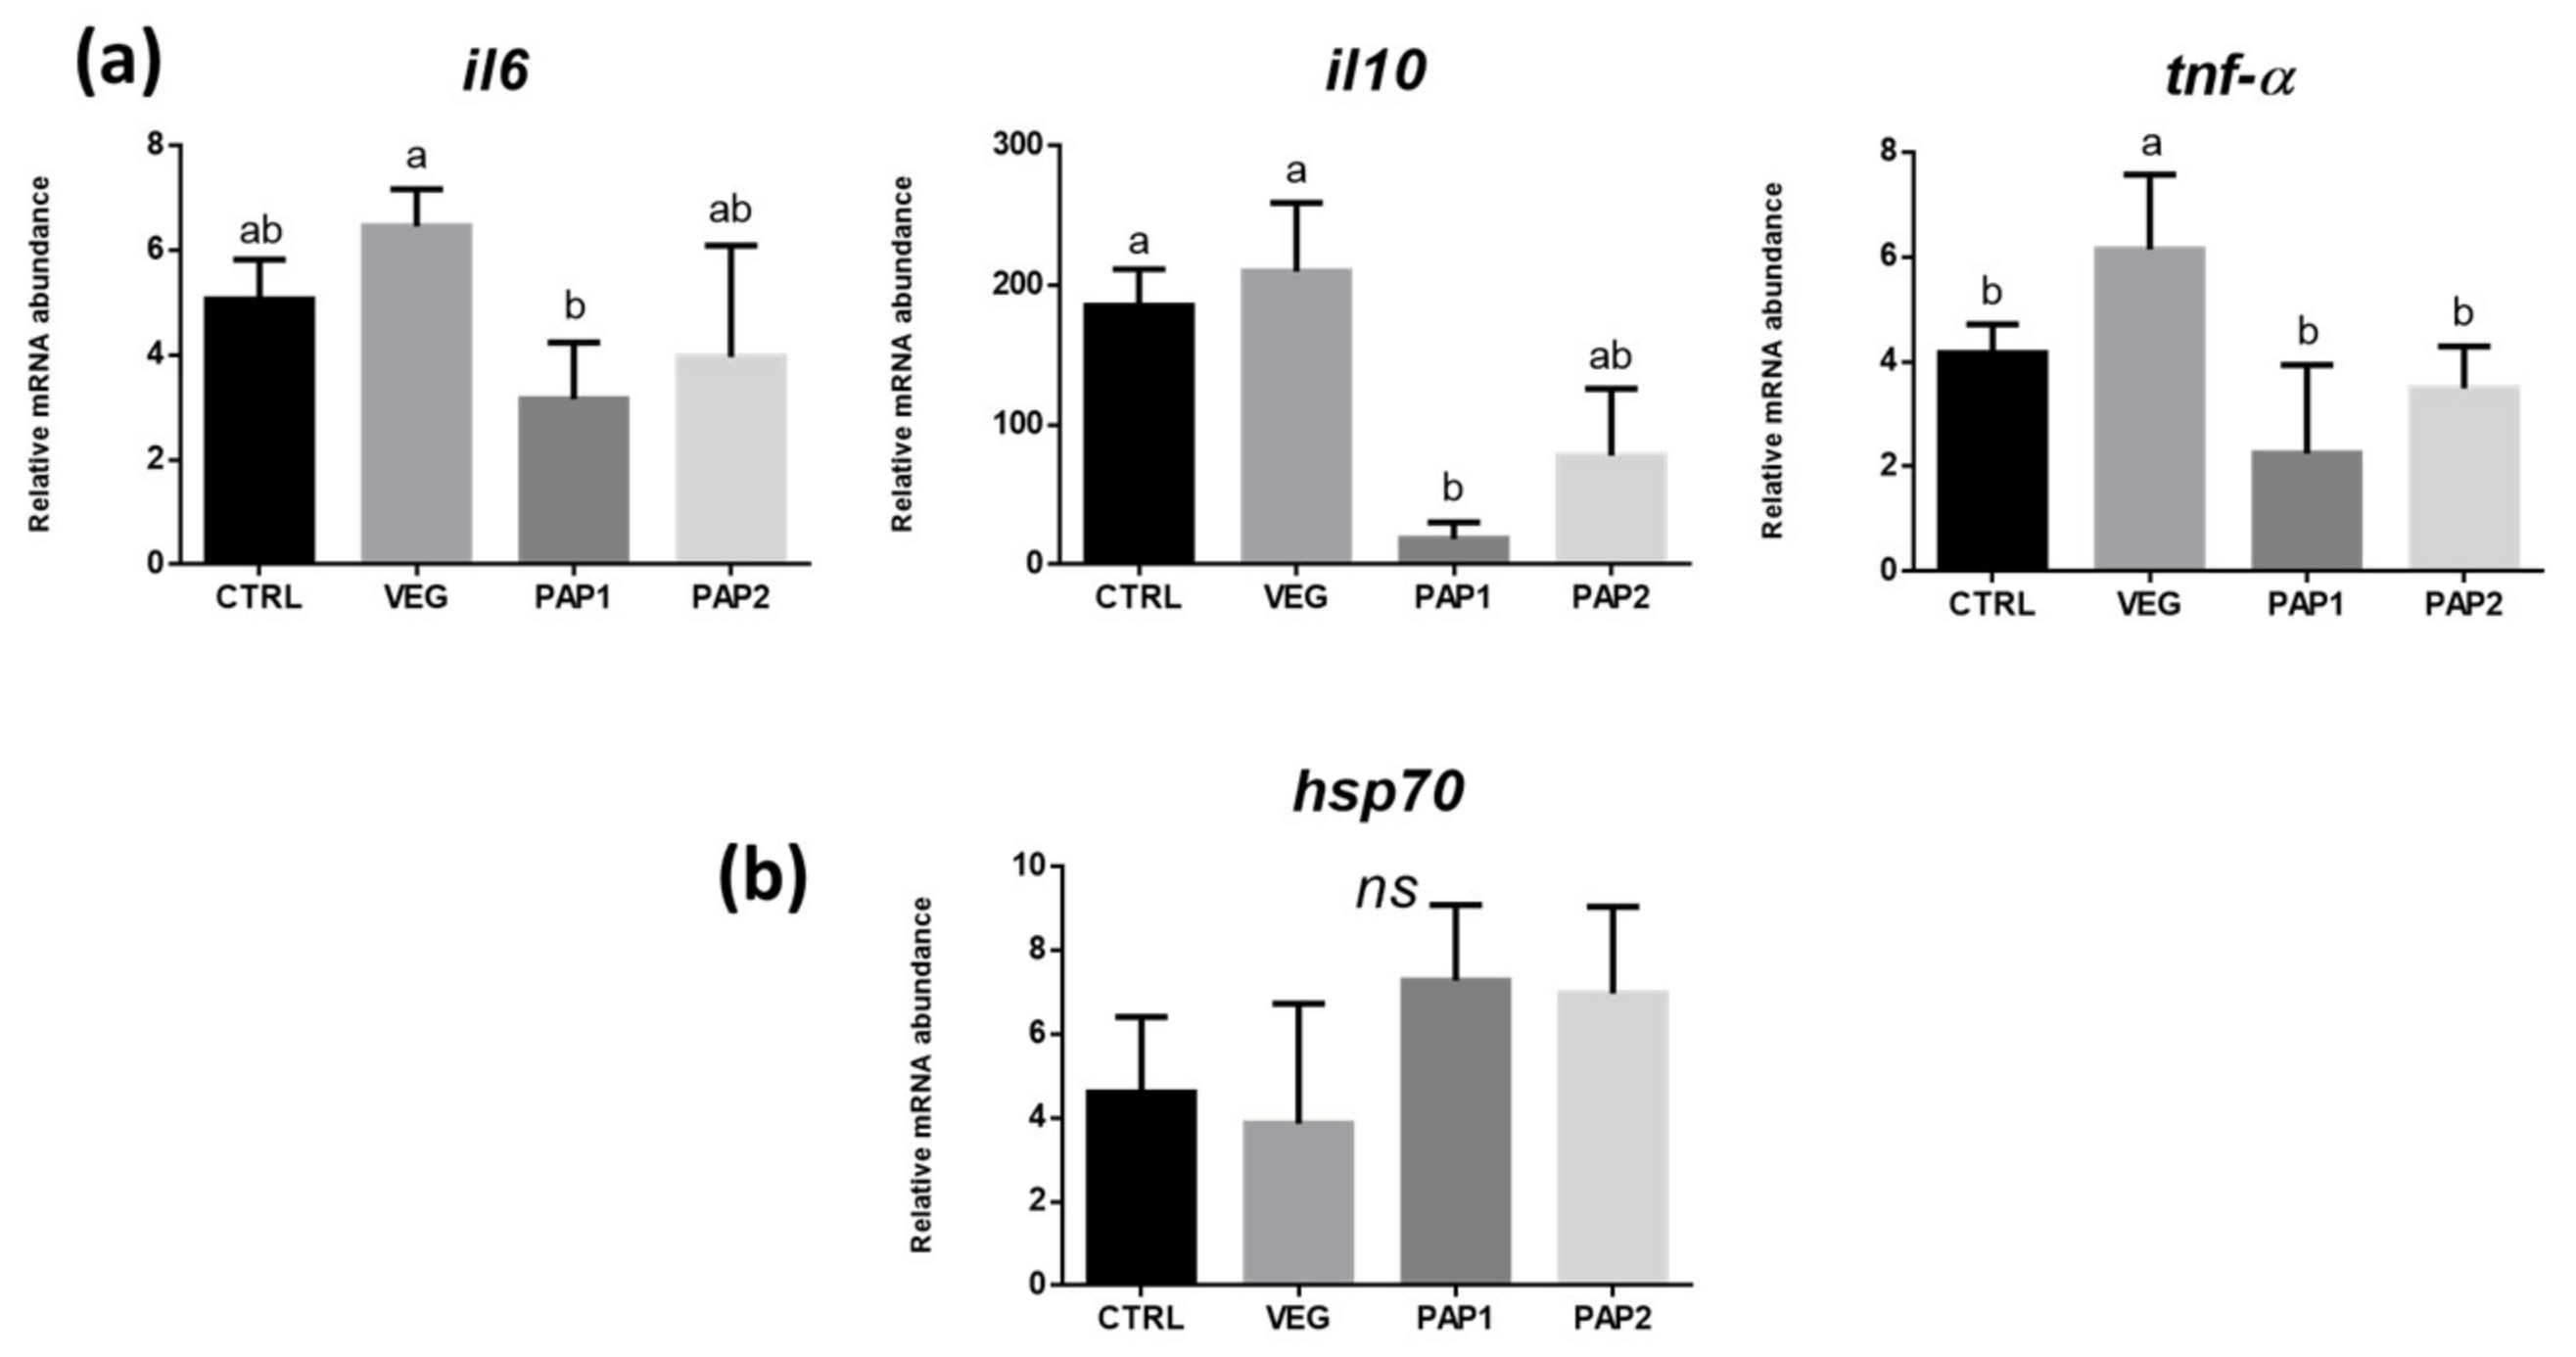
3.4. Gene Expression
3.5. Physical Characteristic Analyses of Fillets
3.6. Fillet Chemical Characteristics: Proximate Composition, Fatty Acid Profile and Oxidative Status of Fillets
4. Discussion
5. Conclusions
Author Contributions
Funding
Institutional Review Board Statement
Informed Consent Statement
Data Availability Statement
Conflicts of Interest
References
- IUCN Red List of Threatened Species. Available online: https://www.iucnredlist.org/ (accessed on 31 May 2022).
- Parati, K.; Gentili, G.; Alborali, G.L.; Viglione, M. Il Carpione Del Garda: Tutela di una specie a rischio di estinzione. Quad. Della Ric. Reg. Lomb. Dir. Gen. Agric. 2013, 149. [Google Scholar]
- Gandolfi, G.; Zerunian, S.; Torricelli, P.; Marconato, A.; Corsetti, L. I pesci delle acque interne italiane. Ist. Poligr. E Zecca Dello Stato Roma 1991, 617–618. [Google Scholar]
- Melotto, S.; Alessio, G. Biology of carpione, Salmo carpio, L., an endemic species of Lake Garda (Italy). J. Fish Biol. 1990, 37, 687–698. [Google Scholar] [CrossRef]
- Lunelli, F.; Faccenda, F.; Confortini, I.; Cappelletti, C.; Ciutti, F. Salmo carpio: An endemic salmonid of Lake Garda, Northern Italy. World Aquac. 2012, 46–49. [Google Scholar]
- Www.Fao.Org. Available online: https://www.fao.org/home/en/ (accessed on 31 May 2022).
- Tacon, A.G.J.; Metian, M. Feed Matters: Satisfying the feed demand of aquaculture. Rev. Fish. Sci. Aquac. 2015, 23, 1–10. [Google Scholar] [CrossRef]
- Tacon, A.G.J. State of Information on Salmon Aquaculture Feed and the environment. Report to the WWF Salmon Aquaculture Dialogue; 2005; pp. 1–80. Available online: https://static1.squarespace.com/static/5b40131f9d5abb8b198ce338/t/5b4464b988251bce1290210d/1531208894296/State+of+Information+on+Salmon+Aquaculture+Feed+and+the+Environment.pdf (accessed on 5 July 2022).
- Lim, S.R.; Choi, S.M.; Wang, X.J.; Kim, K.W.; Shin, I.S.; Min, T.S.; Bai, S.C. Effects of dehulled soybean meal as a fish meal replacer in diets for fingerling and growing Korean rockfish Sebastes schlegeli. J. Exp. Zool. India 2020, 23, 13–21. [Google Scholar] [CrossRef]
- Zhou, Q.C.; Tan, B.P.; Mai, K.S.; Liu, Y.J. Apparent digestibility of selected feed ingredients for juvenile cobia Rachycentron canadum. J. Exp. Zool. India 2020, 23, 13–21. [Google Scholar] [CrossRef]
- Krishnan, H.B.; Jez, J.M. Review: The promise and limits for enhancing sulfur-containing amino acid content of soybean seed. J. Exp. Zool. India 2020, 23, 13–21. [Google Scholar] [CrossRef]
- Oliva-Teles, A.; Enes, P.; Peres, H. Replacing Fishmeal and fish oil in industrial aquafeeds for carnivorous fish. J. Exp. Zool. India 2020, 23, 13–21. [Google Scholar] [CrossRef]
- Hodar, A.; Vasava, R.J.; Mahavadiya, D.R.; Joshi, N.H. Fish meal and fish oil replacement for aqua feed formulation by using alternative sources: A review. J. Exp. Zool. India 2020, 23, 13–21. [Google Scholar]
- Gatlin, D.M.; Barrows, F.T.; Brown, P.; Dabrowski, K.; Gaylord, T.G.; Hardy, R.W.; Herman, E.; Hu, G.; Krogdahl, Å.; Nelson, R.; et al. Expanding the utilization of sustainable plant products in aquafeeds: A review. Aquac. Res. 2007, 38, 551–579. [Google Scholar] [CrossRef]
- Collins, S.A.; Øverland, M.; Skrede, A.; Drew, M.D. Effect of plant protein sources on growth rate in salmonids: Meta-analysis of dietary inclusion of soybean, pea and canola/rapeseed meals and protein concentrates. Aquaculture 2013, 400–401, 85–100. [Google Scholar] [CrossRef]
- Yasothai, R. Antinutritional factors in soybean meal and its deactivation. Int. J. Sci. Environ. Technol. 2016, 5, 3793–3797. [Google Scholar]
- Zhou, Z.; Ringø, E.; Olsen, R.E.; Song, S.K. Dietary Effects of soybean products on gut microbiota and immunity of aquatic animals: A review. Aquac. Nutr. 2018, 24, 644–665. [Google Scholar] [CrossRef]
- Bureau, D.P.; Harris, A.M.; Cho, C.Y. Apparent digestibility of rendered animal protein ingredients for rainbow trout (Oncorhynchus mykiss). Aquaculture 1999, 180, 345–358. [Google Scholar] [CrossRef]
- Allan, G.L.; Parkinson, S.; Booth, M.A.; Stone, D.A.J.; Rowland, S.J.; Frances, J.; Warner-Smith, R. Replacement of fish meal in diets for Australian silver perch, Bidyanus bidyanus: I. Digestibility of alternative ingredients. Aquaculture 2000, 186, 293–310. [Google Scholar] [CrossRef]
- Irm, M.; Taj, S.; Jin, M.; Luo, J.; Andriamialinirina, H.J.T.; Zhou, Q. Effects of replacement of fish meal by poultry by-product meal on growth performance and gene expression involved in protein metabolism for juvenile black sea bream (Acanthoparus schlegelii). Aquaculture 2020, 528, 735544. [Google Scholar] [CrossRef]
- González-Rodríguez, Á.; Celada, J.D.; Carral, J.M.; Sáez-Royuela, M.; García, V.; Fuertes, J.B. Evaluation of poultry by-product meal as partial replacement of fish meal in practical diets for juvenile tench (Tinca tinca L.). Aquac. Res. 2016, 47, 1612–1621. [Google Scholar] [CrossRef]
- Zhou, Q.C.; Zhao, J.; Li, P.; Wang, H.L.; Wang, L.G. Evaluation of poultry by-product meal in commercial diets for juvenile cobia (Rachycentron canadum). Aquaculture 2011, 322–323, 122–127. [Google Scholar] [CrossRef]
- Bureau, D.P.; Harris, A.M.; Bevan, D.J.; Simmons, L.A.; Azevedo, P.A.; Cho, C.Y. Feather meals and meat and bone meals from different origins as protein sources in rainbow trout (Oncorhynchus mykiss) diets. Aquaculture 2000, 181, 281–291. [Google Scholar] [CrossRef]
- Randazzo, B.; Zarantoniello, M.; Gioacchini, G.; Cardinaletti, G.; Belloni, A.; Giorgini, E.; Faccenda, F.; Cerri, R.; Tibaldi, E.; Olivotto, I. Physiological response of rainbow trout (Oncorhynchus mykiss) to graded levels of Hermetia illucens or poultry by-product meals as single or combined substitute ingredients to dietary plant proteins. Aquaculture 2021, 538, 736550. [Google Scholar] [CrossRef]
- Karapanagiotidis, I.T.; Psofakis, P.; Mente, E.; Malandrakis, E.; Golomazou, E. Effect of fishmeal replacement by poultry by-product meal on growth performance, proximate composition, digestive enzyme activity, hematological parameters and gene expression of gilthead seabream (Sparus aurata). Aquac. Nutr. 2019, 25, 3–14. [Google Scholar] [CrossRef] [Green Version]
- Randazzo, B.; Zarantoniello, M.; Cardinaletti, G.; Cerri, R.; Giorgini, E.; Belloni, A.; Contò, M.; Tibaldi, E.; Olivotto, I. Hermetia Illucens and poultry by-product meals as alternatives to plant protein sources in gilthead seabream (Sparus aurata) diet: A multidisciplinary study on fish gut status. Animals 2021, 11, 677. [Google Scholar] [CrossRef]
- Fowler, L.G. Poultry by-product meal as a dietary protein source in fall chinook salmon diets. Aquaculture 1991, 99, 309–321. [Google Scholar] [CrossRef]
- Hill, J.C.; Alam, M.S.; Watanabe, W.O.; Carroll, P.M.; Seaton, P.J.; Bourdelais, A.J. Replacement of menhaden fish meal by poultry by-product meal in the diet of juvenile red porgy. N. Am. J. Aquac. 2019, 81, 81–93. [Google Scholar] [CrossRef] [Green Version]
- Fasakin, E.A.; Serwata, R.D.; Davies, S.J. Comparative utilization of rendered animal derived products with or without composite mixture of soybean meal in hybrid tilapia (Oreochromis niloticus × Oreochromis mossambicus) diets. Aquaculture 2005, 249, 329–338. [Google Scholar] [CrossRef]
- Galkanda-Arachchige, H.S.C.; Wilson, A.E.; Davis, D.A. Success of fishmeal replacement through poultry by-product meal in aquaculture feed formulations: A meta-analysis. Rev. Aquac. 2020, 12, 1624–1636. [Google Scholar] [CrossRef]
- Olsen, Y. Resources for fish feed in future mariculture. Aquac. Environ. Interact. 2011, 1, 187–200. [Google Scholar] [CrossRef] [Green Version]
- Zarantoniello, M.; Randazzo, B.; Secci, G.; Notarstefano, V.; Giorgini, E.; Lock, E.J.; Parisi, G.; Olivotto, I. Application of laboratory methods for understanding fish responses to black soldier fly (Hermetia illucens) based diets. J. Insects Food Feed. 2021, 1–24. [Google Scholar] [CrossRef]
- Giorgini, E.; Randazzo, B.; Gioacchini, G.; Cardinaletti, G.; Vaccari, L.; Tibaldi, E.; Olivotto, I. New insights on the macromolecular building of rainbow trout (O. mykiss) intestine: Ftir imaging and histological correlative study. Aquaculture 2018, 497, 1–9. [Google Scholar] [CrossRef]
- National Research Council (U.S.). Nutrient Requirements of Fish and Shrimp; National Research Council (U.S.): Washington, DC, USA, 2011; p. 376. [Google Scholar]
- AOAC International. Official Methods of Analysis of AOAC International, 16th ed.; AOAC International: Rockville, MD, USA, 1998. [Google Scholar]
- Burja, A.M.; Armenta, R.E.; Radianingtyas, H.; Barrow, C.J. Evaluation of fatty acid extraction methods for Thraustochytrium Sp. ONC-T18. J. Agric. Food Chem. 2007, 55, 4795–4801. [Google Scholar] [CrossRef]
- Urán, P.A.; Schrama, J.W.; Rombout, J.H.W.M.; Taverne-Thiele, J.J.; Obach, A.; Koppe, W.; Verreth, J.A.J. Time-related changes of the intestinal morphology of Atlantic salmon, Salmo salar L., at two different soybean meal inclusion levels. J. Fish Dis. 2009, 32, 733–744. [Google Scholar] [CrossRef]
- Panettieri, V.; Chatzifotis, S.; Messina, C.M.; Olivotto, I.; Manuguerra, S.; Randazzo, B.; Ariano, A.; Bovera, F.; Santulli, A.; Severino, L.; et al. Honey bee pollen in meagre (Argyrosomus regius) Juvenile diets: Effects on growth, diet digestibility, intestinal traits, and biochemical markers related to health and stress. Animals 2020, 10, 231. [Google Scholar] [CrossRef] [Green Version]
- Zarantoniello, M.; Pulido Rodriguez, L.F.; Randazzo, B.; Cardinaletti, G.; Giorgini, E.; Belloni, A.; Secci, G.; Faccenda, F.; Pulcini, D.; Parisi, G.; et al. Conventional feed additives or red claw crayfish meal and dried microbial biomass as feed supplement in fish meal-free diets for rainbow trout (Oncorhynchus mykiss): Possible ameliorative effects on growth and gut health status. Aquaculture 2022, 554, 738137. [Google Scholar] [CrossRef]
- Olivotto, I.; Mosconi, G.; Maradonna, F.; Cardinali, M.; Carnevali, O. Diplodus sargus interrenal-pituitary response: Chemical communication in stressed fish. Gen. Comp. Endocrinol. 2002, 127, 66–70. [Google Scholar] [CrossRef]
- Olivotto, I.; Di Stefano, M.; Rosetti, S.; Cossignani, L.; Pugnaloni, A.; Giantomassi, F.; Carnevali, O. Live prey enrichment, with particular emphasis on HUFAs, as limiting factor in false percula clownfish (Amphiprion ocellaris, Pomacentridae) larval development and metamorphosis: Molecular and biochemical implications. Comp. Biochem. Physiol. Part A Mol. Integr. Psychol. 2011, 159, 207–218. [Google Scholar] [CrossRef]
- Piccinetti, C.C.; Montis, C.; Bonini, M.; Laurà, R.; Guerrera, M.C.; Radaelli, G.; Vianello, F.; Santinelli, V.; Maradonna, F.; Nozzi, V.; et al. Transfer of silica-coated magnetic (Fe3O4) nanoparticles through food: A molecular and morphological study in zebrafish. Zebrafish 2014, 11, 567–579. [Google Scholar] [CrossRef]
- CIE. Colorimetry, 3rd ed.; Technical Report For CIE; CIE: Vienna, Austria, 2004; Volume 552, p. 24. [Google Scholar]
- Veland, J.O.T.J. The Texture of atlantic salmon (Salmo salar) muscle as measured instrumentally using TPA and Warner–Brazler shear test. J. Sci. Food Agric. 1999, 79, 1737–1746. [Google Scholar] [CrossRef]
- Ayala, M.D.; Santaella, M.; Martínez, C.; Periago, M.J.; Blanco, A.; Vázquez, J.M.; Albors, O.L. Muscle tissue structure and flesh texture in gilthead sea bream, Sparus aurata L., fillets preserved by refrigeration and by vacuum packaging. LWT—Food Sci. Technol. 2011, 44, 1098–1106. [Google Scholar] [CrossRef]
- Iaconisi, V.; Marono, S.; Parisi, G.; Gasco, L.; Genovese, L.; Maricchiolo, G.; Bovera, F.; Piccolo, G. Dietary inclusion of tenebrio molitor larvae meal: Effects on growth performance and final quality treats of blackspot sea bream (Pagellus bogaraveo). Aquaculture 2017, 476, 49–58. [Google Scholar] [CrossRef]
- AOAC International. Official Methods of Analysis of AOAC International, 19th ed.; AOAC International: Gaithersburg, MD, USA, 2012; ISBN 9780935584837. [Google Scholar]
- Folch, J.; Lees, M.; Sloane Stanley, G.H. A simple method for the isolation and purification of total lipides from animal tissues. J. Biol. Chem. 1957, 226, 497–509. [Google Scholar] [CrossRef]
- Christie, W.W. A Simple procedure for rapid transmethylation of glycerolipids and cholesteryl esters. J. Lipid Res. 1982, 23, 1072–1075. [Google Scholar] [CrossRef]
- Pulido, L.; Secci, G.; Maricchiolo, G.; Gasco, L.; Gai, F.; Serra, A.; Conte, G.; Parisi, G. Effect of dietary black soldier fly larvae meal on fatty acid composition of lipids and Sn-2 position of triglycerides of marketable size gilthead sea bream fillets. Aquaculture 2022, 546, 737351. [Google Scholar] [CrossRef]
- Srinivasan, S.; Xiong, Y.L.; Decker, E.A. Inhibition of protein and lipid oxidation in beef heart surimi-like material by antioxidants and combinations of pH, NaCl, and buffer type in the washing media. J. Agric. Food Chem. 1996, 44, 119–125. [Google Scholar] [CrossRef]
- Vyncke, W. Direct determination of the thiobarbituric acid value in trichloracetic acid extracts of fish as a measure of oxidative rancidity. Fette Seifen Anstrichm. 1970, 72, 1084–1087. [Google Scholar] [CrossRef]
- Verdile, N.; Pasquariello, R.; Brevini, T.A.L.; Gandolfi, F. The 3D pattern of the rainbow trout (Oncorhynchus mykiss) enterocytes and intestinal stem cells. Int. J. Mol. Sci. 2020, 21, 9192. [Google Scholar] [CrossRef] [PubMed]
- Aksnes, A.; Hope, B.; Jönsson, E.; Björnsson, B.T.; Albrektsen, S. Size-fractionated fish hydrolysate as feed ingredient for rainbow trout (Oncorhynchus mykiss) Fed high plant protein diets: Growth, growth regulation and feed utilization. Aquaculture 2006, 1, 305–317. [Google Scholar] [CrossRef]
- Gaylord, T.G.; Teague, A.M.; Barrows, F.T. Taurine supplementation of all-plant protein diets for rainbow trout (Oncorhynchus mykiss). J. World Aquac. Soc. 2006, 37, 509–517. [Google Scholar] [CrossRef]
- Li, P.; Mai, K.; Trushenski, J.; Wu, G. New developments in fish amino acid nutrition: Towards functional and environmentally oriented aquafeeds. Amino Acids 2009, 37, 43–53. [Google Scholar] [CrossRef]
- Millamena, O.M. Replacement of fish meal by animal by-product meals in a practical diet for grow-out culture of grouper Epinephelus coioides. Aquaculture 2002, 204, 75–84. [Google Scholar] [CrossRef]
- Hu, M.; Wang, Y.; Luo, Z.; Zhao, M.; Xiong, B.; Qian, X.; Zhao, Y. Evaluation of rendered animal protein ingredients for replacement of fish meal in practical diets for gibel carp, Carassius auratus Gibelio (Bloch). Aquac. Res. 2008, 39, 1475–1482. [Google Scholar] [CrossRef]
- Xue, M.; Yun, B.; Wang, J.; Sheng, H.; Zheng, Y.; Wu, X.; Qin, Y.; Li, P. Performance, Body compositions, input and output of nitrogen and phosphorus in Siberian sturgeon, Acipenser baerii Brandt, as Affected by dietary animal protein blend replacing fishmeal and protein levels. Aquac. Nutr. 2012, 18, 493–501. [Google Scholar] [CrossRef]
- Lu, F.; Haga, Y.; Satoh, S. Effects of replacing fish meal with rendered animal protein and plant protein sources on growth response, biological indices, and amino acid availability for rainbow trout Oncorhynchus mykiss. Fish. Sci. 2015, 81, 95–105. [Google Scholar] [CrossRef] [Green Version]
- Groschwitz, K.R.; Hogan, S.P. Intestinal Barrier Function: Molecular Regulation and Disease Pathogenesis. J. Allergy Clin. Immunol. 2009, 124, 3–20. [Google Scholar] [CrossRef] [Green Version]
- Kinnebrew, M.A.; Pamer, E.G. Innate immune signaling in defense against intestinal microbes. Immunol. Rev. 2012, 245, 113–131. [Google Scholar] [CrossRef]
- Peterson, L.W.; Artis, D. Intestinal epithelial cells: Regulators of barrier function and immune homeostasis. Nat. Rev. Immunol. 2014, 14, 141–153. [Google Scholar] [CrossRef]
- Baeverfjord, G.; Krogdahl, A. Development and regression of soybean meal induced enteritis in Atlantic salmon, Salmo salar L., distal intestine: A comparison with the intestines of fasted fish. J. Fish Dis. 1996, 19, 375–387. [Google Scholar] [CrossRef]
- Penn, M.H.; Bendiksen, E.A.; Campbell, P.; Krogdahl, A.S. High level of dietary pea protein concentrate induces enteropathy in Atlantic salmon (Salmo salar L.). Aquaculture 2011, 310, 267–273. [Google Scholar] [CrossRef]
- Krogdahl, Å.; Gajardo, K.; Kortner, T.M.; Penn, M.; Gu, M.; Berge, G.M.; Bakke, A.M. Soya saponins induce enteritis in Atlantic salmon (Salmo salar L.). J. Agric. Food Chem. 2015, 63, 3887–3902. [Google Scholar] [CrossRef]
- Mambrini, M.; Roem, A.J.; Cravèdi, J.P.; Lallès, J.P.; Kaushik, S.J. Effects of replacing fish meal with soy protein concentrate and of dl-methionine supplementation in high-energy, extruded diets on the growth and nutrient utilization of rainbow trout, Oncorhynchus mykiss. J. Anim. Sci. 1999, 77, 2990–2999. [Google Scholar] [CrossRef]
- Rimoldi, S.; Finzi, G.; Ceccotti, C.; Girardello, R.; Grimaldi, A.; Ascione, C.; Terova, G. Butyrate and Taurine exert a mitigating effect on the inflamed distal intestine of European sea bass fed with a high percentage of soybean meal. Fish. Aquat. Sci. 2016, 19, 40. [Google Scholar] [CrossRef] [Green Version]
- Nimalan, N.; Sørensen, S.L.; Fečkaninová, A.; Koščová, J.; Mudroňová, D.; Gancarčíková, S.; Vatsos, I.N.; Bisa, S.; Kiron, V.; Sørensen, M. Mucosal barrier status in atlantic salmon fed marine or plant-based diets supplemented with probiotics. Aquaculture 2022, 547, 737516. [Google Scholar] [CrossRef]
- Bjørgen, H.; Li, Y.; Kortner, T.M.; Krogdahl, Å.; Koppang, E.O. Anatomy, immunology, digestive physiology and microbiota of the salmonid intestine: Knowns and unknowns under the impact of an expanding industrialized production. Fish Shellfish Immunol. 2020, 107, 172–186. [Google Scholar] [CrossRef] [PubMed]
- Panicz, R.; Żochowska-Kujawska, J.; Sadowski, J.; Sobczak, M. Effect of feeding various levels of poultry by-product meal on the blood parameters, filet composition and structure of female tenches (Tinca tinca). Aquac. Res. 2017, 48, 5373–5384. [Google Scholar] [CrossRef]
- Lu, K.L.; Xu, W.N.; Liu, W.B.; Wang, L.N.; Zhang, C.N.; Li, X.F. Association of mitochondrial dysfunction with oxidative stress and immune suppression in blunt snout bream Megalobrama amblycephala fed a high-fat diet. Chang. Publ. Wiley 2014, 26, 100–112. [Google Scholar] [CrossRef]
- Zarantoniello, M.; Zimbelli, A.; Randazzo, B.; Compagni, M.D.; Truzzi, C.; Antonucci, M.; Riolo, P.; Loreto, N.; Osimani, A.; Milanović, V.; et al. Black soldier fly (Hermetia illucens) reared on roasted coffee by-product and Schizochytrium Sp. as a sustainable terrestrial ingredient for aquafeeds production. Aquaculture 2020, 518, 734659. [Google Scholar] [CrossRef]
- Zarantoniello, M.; Randazzo, B.; Gioacchini, G.; Truzzi, C.; Giorgini, E.; Riolo, P.; Gioia, G.; Bertolucci, C.; Osimani, A.; Cardinaletti, G.; et al. Zebrafish (Danio rerio) physiological and behavioural responses to insect-based diets: A multidisciplinary approach. Sci. Rep. 2020, 10, 10648. [Google Scholar] [CrossRef]
- Bruni, L.; Secci, G.; Husein, Y.; Faccenda, F.; Lira de Medeiros, A.C.; Parisi, G. Is it possible to cut down fishmeal and soybean meal use in aquafeed limiting the negative effects on rainbow trout (Oncorhynchus mykiss) fillet quality and consumer acceptance? Aquaculture 2021, 543, 736996. [Google Scholar] [CrossRef]
- Tocher, D.R. Fatty acid requirements in ontogeny of marine and freshwater fish. Aquac. Res. 2010, 41, 717–732. [Google Scholar] [CrossRef]
- Bruni, L.; Secci, G.; Mancini, S.; Faccenda, F.; Parisi, G. A Commercial macroalgae extract in a plant-protein rich diet diminished saturated fatty acids of Oncorhynchus mykiss Walbaum fillets. Ital. J. Anim. Sci. 2020, 19, 373–382. [Google Scholar] [CrossRef]
- Pulcini, D.; Capoccioni, F.; Franceschini, S.; Martinoli, M.; Tibaldi, E. Skin pigmentation in gilthead seabream (Sparus aurata L.) fed conventional and novel protein sources in diets deprived of fish meal. Animals 2020, 10, 2138. [Google Scholar] [CrossRef]
- Pulcini, D.; Capoccioni, F.; Franceschini, S.; Martinoli, M.; Faccenda, F.; Secci, G.; Perugini, A.; Tibaldi, E.; Parisi, G. Muscle pigmentation in rainbow trout (Oncorhynchus mykiss) Fed diets rich in natural carotenoids from microalgae and crustaceans. Aquaculture 2021, 543, 736989. [Google Scholar] [CrossRef]
- de Carvalho, C.C.C.R.; Caramujo, M.J. Carotenoids in aquatic ecosystems and aquaculture: A colorful business with implications for human health. Front. Mar. Sci. 2017, 4, 93. [Google Scholar] [CrossRef] [Green Version]
- Mørkøre, T. relevance of dietary oil source for contraction and quality of pre-rigor filleted atlantic cod, Gadus morhua. Aquaculture 2006, 251, 56–65. [Google Scholar] [CrossRef]
- De Francesco, M.; Parisi, G.; Médale, F.; Lupi, P.; Kaushik, S.J.; Poli, B.M. Effect of long-term feeding with a plant protein mixture based diet on growth and body/fillet quality traits of large rainbow trout (Oncorhynchus mykiss). Aquaculture 2004, 236, 413–429. [Google Scholar] [CrossRef] [Green Version]


| Ingredients | CTRL | VEG | PAP1 | PAP2 | |
|---|---|---|---|---|---|
| Fish meal | Fish meal | PBM proteins | PBM proteins | ||
| Dehulled soy bean meal | Dehulled soy bean meal | Fish meal | Fish meal | ||
| Corn gluten | Wheat gluten | Soy oil | Feather hydrolyzed meal | ||
| Fish oil | Soy oil | Swine hemoglobin | Wheat meal | ||
| Sunflower seeds meal | Fish oil | Wheat meal | Sunflower seeds meal | ||
| Wheat meal | Wheat meal | Fish oil | Fish oil | ||
| Soy oil | Guar germ flour | Rapeseed oil | |||
| Sunflower seeds meal | Swine hemoglobin | ||||
| Soy protein concentrate | Soy oil | ||||
| Vitamin (kg−1) | Vit. A (U.I.) | 12,000 | 11,000 | 15,000 | 11,000 |
| Vit. D3 (U.I.) | 2000 | 1800 | 2500 | 1800 | |
| Vit. E (mg) | 160 | 150 | 200 | 150 | |
| Vit. C (mg) | 160 | 150 | 200 | 150 | |
| Mn (mg) | 45 | 45 | 50 | 38 | |
| Minerals (kg−1) | Zn (mg) | 60 | 60 | 75 | 55 |
| Fe2 (mg) | 20 | 20 | 26 | 20 | |
| Cu2 (mg) | 9 | 8 | 12 | 8 | |
| I (mg) | 2 | 2 | 3 | 2 | |
| Se (µg) | 160 | 150 | 200 | 150 | |
| Proximate Composition | CTRL | VEG | PAP1 | PAP2 |
|---|---|---|---|---|
| Dry matter (%) | 91.9 | 92.5 | 94.2 | 94.3 |
| Crude protein (%) | 46.7 | 45.4 | 44.6 | 46.7 |
| Crude lipid (%) | 22.9 | 23.8 | 25.5 | 24.4 |
| Ash (%) | 8.6 | 6.7 | 9.6 | 8.6 |
| Carbohydrates 1 (%) | 21.9 | 24.1 | 20.3 | 20.4 |
| Gross energy (MJ kg−1) | 21.2 | 20.6 | 22.1 | 21.7 |
| Fatty acids | ||||
| C14:0 | 2.33 | 2.06 | 1.76 | 1.32 |
| C16:0 | 13.93 | 14.00 | 14.72 | 12.60 |
| C16:1n-7 | 2.93 | 2.39 | 2.36 | 2.12 |
| C18:0 | 3.92 | 4.20 | 4.65 | 4.00 |
| C18:1n-9 | 28.52 | 24.02 | 27.57 | 38.96 |
| C18:1n-7 | 2.48 | 2.12 | 2.13 | 2.62 |
| C18:2n-6 | 25.1 | 32.12 | 31.49 | 24.77 |
| C18:3n-3 | 4.18 | 4.45 | 4.48 | 4.67 |
| C18:3n-6 | 0.66 | 0.60 | 0.49 | 0.24 |
| C20:1n-9 | 1.44 | 1.17 | 1.01 | 1.34 |
| C20:5n-3 | 3.194 | 3.036 | 1.999 | 1.067 |
| C22:6n-3 | 5.017 | 3.906 | 2.543 | 1.696 |
| ∑ SFA | 21.524 | 21.612 | 22.458 | 19.225 |
| ∑ MUFA | 36.920 | 31.279 | 34.353 | 46.313 |
| ∑ n-6PUFA | 26.312 | 33.155 | 32.299 | 25.669 |
| ∑ n-3PUFA | 14.268 | 13.010 | 10.197 | 8.325 |
| Gene | Primers Sequences | A.T. °C | Gene Bank ID | |
|---|---|---|---|---|
| Forward | Reverse | |||
| il6 | ACTCCCCTCTGTCACACACC | GGCAGACAGGTCCTCCACTA | 58 | DQ866150 |
| il10 | CCCAGAGGCCGTACATTTGA | ATTTGTGGAGGGCTTTCCTT | 57 | AB118099 |
| tnf-α | GCTATTCGGACTCCATCGGG | CCCTCGCCGATATTGGACTC | 59 | NM001124374 |
| hsp70 | ACCACACCCAGTTATGTCGCCT | CTTCCGCCCTATCAGCCGC | 60 | AY423555 |
| β-actin (hk) | ATGGAAGATGAAATCGCCGCAC | TGGCCCATCCCAACCATCAC | 60 | AJ438158 |
| ef1-α (hk) | GAATCGGCTATGCCTGGTGAC | GGATGATGACCTGAGCGGTG | 60 | BG933853 |
| Zootechnical Performences | CTRL | VEG | PAP1 | PAP2 | Significance |
|---|---|---|---|---|---|
| Lenght (cm) | 29.19 ± 1.55 | 29.19 ± 1.76 | 29.18 ± 1.85 | 29.20 ± 1.68 | n.s. |
| Final weight (g) | 343.3 ± 63.4 | 340.9 ± 67.3 | 336.2 ± 75.7 | 335.8 ± 65.9 | n.s. |
| K index | 1.37 ± 0.14 | 1.35 ± 0.10 | 1.33 ± 0.13 | 1.34 ± 0.13 | n.s. |
| Survival (%) | 100 | 93.3 ± 3.82 | 99.2 ± 1.44 | 97.5 ± 2.5 | n.s. |
| SGR | 0.44 ± 0.04 | 0.39 ± 0.06 | 0.40 ± 0.04 | 0.38 ± 0.03 | n.s. |
| FCR | 0.98 ± 0.09 | 1.08 ± 0.07 | 1.03 ± 0.08 | 1.11 ± 0.08 | n.s. |
| PER | 2.39 ± 0.21 | 2.22 ± 0.27 | 2.33 ± 0.19 | 2.06 ± 0.15 | n.s. |
| Histological Morphometry and Index Score | CTRL | VEG | PAP1 | PAP2 |
|---|---|---|---|---|
| MF (µm) | 562.6 ± 131.4 ab | 460.8 ± 11.6 b | 592.0 ± 66.8 ab | 597.5 ± 142.1 ab |
| SM (µm) | 30.6 ± 11.6 ab | 34.5 ± 14.8 a | 34.8 ± 13.6 a | 25.8 ± 10.4 b |
| MC (n 500 µm−1) | 7.8 ± 3.5 | 9.2 ± 4.1 | 11.3 ± 6.0 | 7.9 ± 3.7 |
| SV (a.u.) | + | + | ++ | ++ |
| MM (a.u.) | ++ | +++ | + | + |
| Inf (a.u.) | ++ | +++ | + | + |
| Fish Portion | Characteristics | CTRL | VEG | PAP1 | PAP2 | Significance |
|---|---|---|---|---|---|---|
| Fish skin | L* | 58.30 ± 5.61 | 56.23 ± 6.39 | 56.20 ± 6.76 | 55.73 ± 8.02 | n.s. |
| a* | −1.37 ab ± 0.77 | −0.79 a ± 1.05 | −2.08 b ± 1.03 | −1.09 ab ± 1.25 | 0.010 | |
| b* | 8.86 a ± 2.65 | 8.82 a ± 1.93 | 6.42 b ± 1.73 | 6.54 b ± 2.06 | 0.003 | |
| Fish fillet | L* | 50.79 b ± 2.15 | 53.35 a ± 2.60 | 51.39 ab ± 2.07 | 53.50 a ± 3.41 | 0.011 |
| a* | 1.21 ± 1.51 | 2.28 ± 1.78 | 2.00 ± 2.39 | 2.68 ± 1.57 | n.s. | |
| b* | 3.23 ± 0.99 | 3.16 ± 1.65 | 2.48 ± 1.32 | 3.19 ± 1.74 | n.s. | |
| WHC, % | 91.18 ± 3.81 | 92.64 ± 3.80 | 92.28 ± 5.07 | 90.54 ± 3.79 | n.s. | |
| Hardness, N | 3.40 b ± 1.25 | 5.09 a ± 2.24 | 3.25 b ± 1.18 | 5.27 a ± 1.71 | 0.001 | |
| Adhesiveness, N mm−1 | 0.67 ± 1.06 | 0.42 ± 0.31 | 0.24 ± 0.16 | 0.41 ± 0.32 | n.s. | |
| Cohesiveness | 0.28 ± 0.14 | 0.22 ± 0.05 | 0.24 ± 0.05 | 0.21 ± 0.04 | n.s. | |
| Resilience | 0.04 ± 0.05 | 0.04 ± 0.05 | 0.04 ± 0.03 | 0.02 ± 0.02 | n.s. |
| Fillet Composition | CTRL | VEG | PAP1 | PAP2 | Significance |
|---|---|---|---|---|---|
| Moisture | 68.68 ± 1.12 | 68.63 ± 3.30 | 66.86 ± 2.61 | 67.41 ± 4.07 | n.s. |
| Ashes | 1.39 ± 0.08 | 1.34 ± 0.17 | 1.59 ± 0.62 | 1.30 ± 0.10 | n.s. |
| Crude protein | 20.09 a ± 0.95 | 18.99 ab ± 1.16 | 19.96 a ± 1.74 | 18.07 b ± 1.16 | 0.0001 |
| Total lipids | 8.47 ± 1.01 | 9.43 ± 2.82 | 9.16 ± 3.05 | 11.24 ± 4.42 | n.s. |
| Fatty acids | |||||
| C14:0 | 1.93 a ± 0.10 | 1.88 ab ± 0.13 | 1.78 bc ± 0.07 | 1.74 c ± 0.12 | <0.0001 |
| C16:0 | 12.21 ab ± 0.66 | 11.97 ab ± 0.72 | 12.49 a ± 0.41 | 11.87 b ± 0.67 | 0.042 |
| C16:1n-7 | 2.87 ± 0.17 | 2.88 ± 0.34 | 2.87 ± 0.33 | 2.97 ± 0.42 | n.s. |
| C18:0 | 3.13 b ± 0.13 | 3.23 ab ± 0.17 | 3.33 a ± 0.10 | 3.19 b ± 0.12 | 0.001 |
| C18:1n-7 | 2.72 a ± 0.04 | 2.62 b ± 0.07 | 2.61 b ± 0.08 | 2.76 a ± 0.06 | <0.0001 |
| C18:1n-9 | 31.81 b ± 0.78 | 31.62 b ± 1.10 | 31.90 b ± 1.10 | 35.50 a ± 0.61 | <0.0001 |
| C18:2n-6 | 21.60 b ± 0.80 | 23.26 a ± 0.74 | 23.52 a ± 0.99 | 20.98 b ± 0.86 | <0.0001 |
| C18:3n-3 | 3.45 a ± 0.15 | 3.44 a ± 0.11 | 3.35 ab ± 0.11 | 3.29 b ± 0.17 | 0.007 |
| C18:3n-6 | 0.49 b ± 0.08 | 0.53 b ± 0.06 | 0.70 a ± 0.08 | 0.69 a ± 0.14 | <0.0001 |
| C18:4n-3 | 0.77 ab ± 0.06 | 0.73 b ± 0.05 | 0.82 a ± 0.06 | 0.79 a ± 0.07 | 0.002 |
| C20:1n-9 | 1.81 ab ± 0.06 | 1.80 b ± 0.11 | 1.64 c ± 0.12 | 1.90 a ± 0.09 | <0.0001 |
| C20:2n-6 | 1.02 ab ± 0.06 | 1.05 a ± 0.08 | 0.98 bc ± 0.08 | 0.93 c ± 0.06 | 0.0003 |
| C20:3n-6 | 0.75 ± 0.10 | 0.77 ± 0.05 | 0.81 ± 0.06 | 0.82 ± 0.10 | n.s. |
| C20:4n-6 | 0.47 b ± 0.04 | 0.52 a ± 0.04 | 0.50 ab ± 0.05 | 0.51 ab ± 0.06 | 0.038 |
| C20:5n-3 | 1.58 a ± 0.08 | 1.54 a ± 0.16 | 1.34 b ± 0.09 | 1.26 b ± 0.21 | <0.0001 |
| C22:1n-11 | 0.66 ab ± 0.06 | 0.70 a ± 0.10 | 0.59 c ± 0.06 | 0.62 bc ± 0.06 | 0.0003 |
| C22:5n-3 | 0.65 a ± 0.06 | 0.62 a ± 0.07 | 0.56 b ± 0.03 | 0.53 b ± 0.06 | <0.0001 |
| C22:6n-3 | 8.59 a ± 0.71 | 7.53 b ± 0.91 | 7.08 bc ± 0.53 | 6.43 c ± 0.86 | <0.0001 |
| Σ SFA | 18.13 ± 0.87 | 17.92 ± 0.99 | 18.43 ± 0.51 | 17.64 ± 0.88 | n.s. |
| Σ MUFA | 40.75 b ± 0.76 | 40.48 b ± 1.31 | 40.44 b ± 1.60 | 44.64 a ± 1.12 | <0.0001 |
| Σ n-6PUFA | 24.58 b ± 0.63 | 26.41 a ± 0.83 | 26.79 a ± 1.09 | 24.21 b ± 0.81 | <0.0001 |
| Σ n-3PUFA | 15.78 a ± 0.76 | 14.44 b ± 1.19 | 13.72 bc ± 0.72 | 12.85 c ± 1.19 | <0.0001 |
| Δ5+Δ6 desaturase (n-6) | 6.45 a ± 0.49 | 6.32 a ± 0.37 | 5.92 b ± 0.30 | 6.44 a ± 0.33 | 0.0007 |
| Δ5+Δ6 desaturase (n-3) | 75.72 a ± 1.68 | 73.67 b ± 2.02 | 72.80 bc ± 1.28 | 71.20 c ± 2.24 | <0.0001 |
| CD | 0.187 ± 0.017 | 0.195 ± 0.053 | 0.203 ± 0.043 | 0.226 ± 0.071 | n.s. |
| MDA | 0.460 ± 0.379 | 0.378 ± 0.243 | 0.411 ± 0.153 | 0.434 ± 0.245 | n.s. |
Publisher’s Note: MDPI stays neutral with regard to jurisdictional claims in published maps and institutional affiliations. |
© 2022 by the authors. Licensee MDPI, Basel, Switzerland. This article is an open access article distributed under the terms and conditions of the Creative Commons Attribution (CC BY) license (https://creativecommons.org/licenses/by/4.0/).
Share and Cite
Randazzo, B.; Zarantoniello, M.; Secci, G.; Faccenda, F.; Fava, F.; Marzorati, G.; Belloni, A.; Maradonna, F.; Orazi, V.; Cerri, R.; et al. Towards the Identification of a Suitable Commercial Diet for Carpione (Salmo carpio, Linnaeus 1758): A Multidisciplinary Study on Fish Performances, Animal Welfare and Quality Traits. Animals 2022, 12, 1918. https://doi.org/10.3390/ani12151918
Randazzo B, Zarantoniello M, Secci G, Faccenda F, Fava F, Marzorati G, Belloni A, Maradonna F, Orazi V, Cerri R, et al. Towards the Identification of a Suitable Commercial Diet for Carpione (Salmo carpio, Linnaeus 1758): A Multidisciplinary Study on Fish Performances, Animal Welfare and Quality Traits. Animals. 2022; 12(15):1918. https://doi.org/10.3390/ani12151918
Chicago/Turabian StyleRandazzo, Basilio, Matteo Zarantoniello, Giulia Secci, Filippo Faccenda, Francesca Fava, Giulia Marzorati, Alessia Belloni, Francesca Maradonna, Veronica Orazi, Roberto Cerri, and et al. 2022. "Towards the Identification of a Suitable Commercial Diet for Carpione (Salmo carpio, Linnaeus 1758): A Multidisciplinary Study on Fish Performances, Animal Welfare and Quality Traits" Animals 12, no. 15: 1918. https://doi.org/10.3390/ani12151918