
The Influence of Rotational Length, along with Pre- and Post-Grazing Measures on Nutritional Composition of Pasture during Winter and Spring on New Zealand Dairy Farms


Abstract
:Simple Summary
Abstract
1. Introduction
2. Materials and Methods
2.1. Pasture Types and Rotation Management
2.2. Pasture Measurements
2.3. Pasture Sampling and Processing
2.4. In Vitro Analysis
2.5. Statistical Analysis
3. Results
Description of Models
4. Discussion
5. Conclusions
Author Contributions
Funding
Institutional Review Board Statement
Informed Consent Statement
Data Availability Statement
Acknowledgments
Conflicts of Interest
References
- Moller, S.; Parker, W.; Edwards, N. Within-year variation in pasture quality has implications for dairy cow nutrition. Proc. N. Z. Grassl. Assoc. 1996, 57, 173–177. [Google Scholar] [CrossRef]
- Verkerk, G. Pasture-based dairying: Challenges and rewards for New Zealand producers. Theriogenology 2003, 59, 553–561. [Google Scholar] [CrossRef]
- Dillon, P. Achieving high dry-matter intake from pasture with grazing dairy cows. Frontis 2007, 18, 1–26. [Google Scholar]
- Machado, C.; Morris, S.; Hodgson, J.; Fathalla, M. Seasonal changes of herbage quality within a New Zealand beef cattle finishing pasture. N. Z. J. Agric. Res. 2005, 48, 265–270. [Google Scholar] [CrossRef]
- Frame, H.; Warn, L.; McLarty, G. Effects of grazing system and phosphorus application on pasture quality. Wool Technol. Sheep Breed. 2002, 50, 465–470. [Google Scholar]
- Clark, D.; Caradus, J.; Monaghan, R.; Sharp, P.; Thorrold, B. Issues and options for future dairy farming in New Zealand. N. Z. J. Agric. Res. 2007, 50, 203–221. [Google Scholar] [CrossRef] [Green Version]
- Cullen, B.; Eckard, R.; Callow, M.; Johnson, I.; Chapman, D.; Rawnsley, R.; Garcia, S.; White, T.; Snow, V. Simulating pasture growth rates in Australian and New Zealand grazing systems. Aust. J. Agric. Res. 2008, 59, 761–768. [Google Scholar] [CrossRef]
- Saul, G.; Kearney, G.; Flinn, P.; Lescun, C. Effects of superphosphate fertiliser and stocking rate on the nutritive value of perennial ryegrass and subterranean clover herbage. Aust. J. Agric. Res. 1999, 50, 537–546. [Google Scholar] [CrossRef]
- Woodfield, D.R.; Easton, H.S. Advances in pasture plant breeding for animal productivity and health. N. Z. Vet. J. 2004, 52, 300–310. [Google Scholar] [CrossRef]
- Chapman, D.; Cullen, B.; Johnson, I.; Beca, D. Interannual variation in pasture growth rate in Australian and New Zealand dairy regions and its consequences for system management. Anim. Prod. Sci. 2009, 49, 1071–1079. [Google Scholar] [CrossRef]
- Ma, W.; Renwick, A.; Bicknell, K. Higher intensity, higher profit? Empirical evidence from dairy farming in New Zealand. J. Agric. Econ. 2018, 69, 739–755. [Google Scholar] [CrossRef]
- Waghorn, G.C.; Clark, D.A. Feeding value of pastures for ruminants. N. Z. Vet. J. 2004, 52, 320–331. [Google Scholar] [CrossRef]
- Hodgson, J.; Cameron, K.; Clark, D.; Condron, L.; Fraser, T.; Hedley, M.; Holmes, C.; Kemp, P.; Lucas, R.; Moot, D. New Zealand’s pastoral industries: Efficient use of grassland resources. In Grasslands: Development Opportunities Perspectives; CRC Press: Christchurch, New Zealand, 2019; pp. 181–205. [Google Scholar]
- McMeekan, C.; Walshe, M. The inter-relationships of grazing method and stocking rate in the efficiency of pasture utilization by dairy cattle. J. Agric. Sci. 1963, 61, 147–166. [Google Scholar] [CrossRef]
- Kaine, G.W.; Tozer, P.R. Stability, resilience and sustainability in pasture-based grazing systems. Agric. Syst. 2005, 83, 27–48. [Google Scholar] [CrossRef]
- Facts and Figures: A Quick Reference Guide for New Zealand Dairy Farmers, 2nd ed.; DairyNZ: New Zealand. 2017. Available online: https://www.dairynz.co.nz/media/5795018/facts_and_figures_dnz30-001_updated_dec_2021_v6.pdf (accessed on 20 November 2019).
- Macdonald, K.; Roche, J. Back to the future–making pasture work for you this spring. DairyNZ Tech. Ser. 2016, 30, 7–10. [Google Scholar]
- Fales, S.L.; Muller, L.D.; Ford, S.A.; O’Sullivan, M.; Hoover, R.J.; Holden, L.A.; Lanyon, L.E.; Buckmaster, D.R. Stocking rate affects production and profitability in a rotationally grazed pasture system. J. Prod. Agric. 1995, 8, 88–96. [Google Scholar] [CrossRef]
- Kemp, P.D.; Matthew, C.; Lucas, R.J.; White, J.; Hodgson, J. Pasture species and cultivars. In New Zealand Pasture and Crop Science; Oxford University Press: Oxford, UK, 2000; pp. 83–100. [Google Scholar]
- Macdonald, K.A.; Beca, D.; Penno, J.W.; Lancaster, J.A.S.; Roche, J.R. Short communication: Effect of stocking rate on the economics of pasture-based dairy farms. J. Dairy Sci. 2011, 94, 2581–2586. [Google Scholar] [CrossRef]
- L’Huillier, P. Effect of dairy cattle stocking rate and degree of defoliation on herbage accumulation and quality in ryegrass—white clover pasture. N. Z. J. Agric. Res. 1987, 30, 149–157. [Google Scholar] [CrossRef]
- Curran, J.; Delaby, L.; Kennedy, E.; Murphy, J.P.; Boland, T.M.; O’Donovan, M. Sward characteristics, grass dry matter intake and milk production performance are affected by pre-grazing herbage mass and pasture allowance. Livest. Sci. 2010, 127, 144–154. [Google Scholar] [CrossRef]
- Facts and Figures: A Quick Reference Guide for New Zealand Dairy Farmers, 1st ed; DairyNZ: New Zealand. 2010. Available online: https://www.dairynz.co.nz/publications/dairy-industry/facts-and-figures/ (accessed on 12 December 2017).
- L’Huillier, P.; Thomson, N. Estimation of herbage mass in ryegrass/white clover dairy pastures. Proc. N. Z. Grassl. Assoc. 1988, 49, 117–122. [Google Scholar] [CrossRef]
- Hodgson, J.; Brookes, I.M. Nutrition of grazing animals—Chapter 9. In New Zealand Pasture and Crop Science; White, J., Hodgson, J., Eds.; Oxford University Press: Oxford, UK, 1999; pp. 117–132. [Google Scholar]
- McCarthy, S.; Wims, C.; Lee, J.; Donaghy, D. Perennial Ryegrass Grazing Management in Spring—Paddock Guide. Available online: https://www.dairynz.co.nz/media/2634153/perennial-ryegrass-grazing-guide-web.pdf (accessed on 12 March 2021).
- De Vries, M.W. Estimating forage intake and quality in grazing cattle: A reconsideration of the hand-plucking method. Rangel. Ecol. Manag. 1995, 48, 370–375. [Google Scholar] [CrossRef] [Green Version]
- Corson, D.C.; Waghorn, G.C.; Ulyatt, M.J.; Lee, J. NIRS: Forage analysis and livestock feeding. Proc. N. Z. Grassl. Assoc. 1999, 61, 127–132. [Google Scholar] [CrossRef]
- Roughan, P.G.; Holland, R. Predicting in-vivo digestibilities of herbages by exhaustive enzymic hydrolysis of cell walls. J. Sci. Food Agric. 1977, 28, 1057–1064. [Google Scholar] [CrossRef]
- Hammond, K.J.; Sandoval, E.; McKenzie, C.M.; Lees, S.; Pacheco, D.; McCoard, S.A. The effect of a fodder beet versus ryegrass grazing regime during mid-to-late gestation twin-bearing ewes on dam and progeny performance and lamb survival. N. Z. J. Agric. Res. 2022, 65, 145–162. [Google Scholar] [CrossRef]
- Somasiri, S.C.; Kenyon, P.R.; Kemp, P.D.; Morel, P.C.H.; Morris, S.T. Growth performance and carcass characteristics of lambs grazing forage mixes inclusive of plantain (Plantago lanceolata L.) and chicory (Cichorium intybus L.). Small Rumin. Res. 2015, 127, 20–27. [Google Scholar] [CrossRef]
- Pullanagari, R.; Yule, I.; Tuohy, M.; Hedley, M.; Dynes, R.; King, W. Proximal sensing of the seasonal variability of pasture nutritive value using multispectral radiometry. Grass. Forage. Sci. 2013, 68, 110–119. [Google Scholar] [CrossRef]
- Donaghy, D.; Bryant, R.; Cranston, L.; Egan, M.; Griffiths, W.; Kay, J.; Pembleton, K.; Tozer, K. Will current rotational grazing management recommendations suit future intensive pastoral systems? NZGA Res. Pract. Ser. 2021, 17, 17–24. [Google Scholar] [CrossRef]
- Fulkerson, W.; Donaghy, D. Plant-soluble carbohydrate reserves and senescence-key criteria for developing an effective grazing management system for ryegrass-based pastures: A review. Aust. J. Exp. Agric. 2001, 41, 261–275. [Google Scholar] [CrossRef]
- Rawnsley, R.; Donaghy, D.; Stevens, D. What is Limiting Production and Consumption of Perennial Ryegrass in Temperate Dairy Regions of Australia and New Zealand. In Proceedings of the Australasian Dairy Science Symposium: Meeting the Challenges for Pasture-Based Dairying, Melbourne, Australia, 18–20 September 2007; pp. 256–276. [Google Scholar]
- Howse, S.; Isherwood, P.; Miller, D.; Well, J.; Riddick, C.; Thomson, N.; Clark, D. Pasture silage in New Zealand-targets and current practice. Proc. N. Z. Grassl. Assoc. 1996, 57, 157–160. [Google Scholar] [CrossRef]
- Fulkerson, W.J.; McKean, K.; Nandra, K.S.; Barchia, I.M. Benefits of accurately allocating feed on a daily basis to dairy cows grazing pasture. Aust. J. Exp. Agric. 2005, 45, 331–336. [Google Scholar] [CrossRef]
- Lee, J.; Donaghy, D.; Roche, J. Effect of defoliation severity on regrowth and nutritive value of perennial ryegrass dominant swards. J. Agron. 2008, 100, 308–314. [Google Scholar] [CrossRef]
- Beukes, P.; McCarthy, S.; Wims, C.; Gregorini, P.; Romera, A. Regular estimates of herbage mass can improve profitability of pasture-based dairy systems. Anim. Prod. Sci. 2019, 59, 359–367. [Google Scholar] [CrossRef]
- Turner, L.; Donaghy, D.; Lane, P.; Rawnsley, R. Effect of defoliation management, based on leaf stage, on perennial ryegrass (Lolium perenne L.), prairie grass (Bromus willdenowii Kunth.), and cocksfoot (Dactylis glomerata L.) under dryland conditions. 2. Nutritive value. Grass Forage Sci. 2006, 61, 175–181. [Google Scholar] [CrossRef]
- McKenzie, F.; Jacobs, J.; Kearney, G. Effects of spring grazing on dryland perennial ryegrass/white clover dairy pastures. 1. Pasture accumulation rates, dry matter consumed yield, and nutritive characteristics. Aust. J. Agric. Res. 2006, 57, 543–554. [Google Scholar] [CrossRef]
- Turner, L.; Donaghy, D.; Lane, P.; Rawnsley, R. Changes in the physiology and feed quality of prairie grass during regrowth. J. Agron. 2006, 98, 1326–1332. [Google Scholar] [CrossRef]
- Turner, L.; Donaghy, D.; Lane, P.; Rawnsley, R. Effect of defoliation management, based on leaf stage, on perennial ryegrass (Lolium perenne L.), prairie grass (Bromus willdenowii Kunth.) and cocksfoot (Dactylis glomerata L.) under dryland conditions. 1. Regrowth, tillering and water-soluble carbohydrate concentration. Grass Forage Sci. 2006, 61, 164–174. [Google Scholar] [CrossRef]
- Kemp, D.; Michalk, D.; Virgona, J. Towards more sustainable pastures: Lessons learnt. Aust. J. Exp. Agric. 2000, 40, 343–356. [Google Scholar] [CrossRef]
- Lee, J.M.; Matthew, C.; Thom, E.R.; Chapman, D.F. Perennial ryegrass breeding in New Zealand: A dairy industry perspective. Crop Pasture Sci. 2012, 63, 107–127. [Google Scholar] [CrossRef]
- Roche, J.; Turner, L.; Lee, J.; Edmeades, D.; Donaghy, D.; Macdonald, K.; Penno, J.; Berry, D. Weather, herbage quality and milk production in pastoral systems. 2. Temporal patterns and intra-relationships in herbage quality and mineral concentration parameters. Anim. Prod. Sci. 2009, 49, 200–210. [Google Scholar] [CrossRef]
- Duranovich, F.N.; Yule, I.J.; Lopez-Villalobos, N.; Shadbolt, N.M.; Draganova, I.; Morris, S.T. Using proximal hyperspectral sensing to predict herbage nutritive value for dairy farming. J. Agron. 2020, 10, 1826–1834. [Google Scholar] [CrossRef]
- Van Soest, P.J. Nutritional Ecology of the Ruminant, 2nd ed.; Cornell University Press: New York, NY, USA, 1994; pp. 437–486. [Google Scholar]
- Van Soest, P.; Mertens, D. The Use of Neutral Detergent Fiber Versus Acid Detergent Fiber in Balancing Dairy Rations; Agri-Practice: St. Louis, MO, USA, 1985; pp. 32–36. [Google Scholar]
- Nelson, D.L.; Cox, M.M. Lehninger Principles of Biochemistry, 6th ed.; W.H. Freeman and Company: New York, NY, USA, 2004; pp. 426–496. [Google Scholar]
- Van Soest, P.J. Environment and forage quality. In Proceedings of the Cornell Nutrition Conference for Feed Manufacturers, Cornell University, Ithaca, NY, USA, 22–24 October 1996; pp. 1–9. [Google Scholar]
- Moller, S. An Evaluation of Major Nutrients in Dairy Pasture in New Zealand and Their Effects on Milk Production and Herd Reproductive Performance. Ph.D. Thesis, Massey University of New Zealand, Wellington, New Zealand, 1997; pp. 12–87. Available online: https://mro.massey.ac.nz/handle/10179/2704 (accessed on 12 June 2021).
- Cressman, S.G.; Grieve, D.; Macleod, G.; Wheeler, E.E.; Young, L. Influence of dietary protein concentration on milk production by dairy cattle in early lactation. J. Dairy Sci. 1980, 63, 1839–1847. [Google Scholar] [CrossRef]
- Forster, R.J.; Grieve, D.; Buchanan-Smith, J.; Macleod, G. Effect of dietary protein degradability on cows in early lactation. J. Dairy Sci. 1983, 66, 1653–1662. [Google Scholar] [CrossRef]
- Jordan, E.R.; Swanson, L. Effect of crude protein on reproductive efficiency, serum total protein, and albumin in the high-producing dairy cow. J. Dairy Sci. 1979, 62, 58–63. [Google Scholar] [CrossRef]
- McCormick, M.; French, D.; Brown, T.; Cuomo, G.; Chapa, A.; Fernandez, J.; Beatty, J.; Blouin, D. Crude protein and rumen undegradable protein effects on reproduction and lactation performance of Holstein cows. J. Dairy Sci. 1999, 82, 2697–2708. [Google Scholar] [CrossRef]
- Roche, J.F.; Mackey, D.; Diskin, M.D. Reproductive management of postpartum cows. Anim. Reprod. Sci. 2000, 60–61, 703–712. [Google Scholar] [CrossRef]
- Kalscheur, K.F.; Vandersall, J.H.; Erdman, R.A.; Kohn, R.A.; Russek-Cohen, E. Effects of dietary crude protein concentration and degradability on milk production responses of early, mid, and late lactation dairy cows. J. Dairy Sci. 1999, 82, 545–554. [Google Scholar] [CrossRef]
- Ji, P.; Dann, H.M. Negative protein balance: Implications for fresh and transition cows. In Proceedings of the Cornell Nutrition Conference, Syracuse, NY, USA, 22 October 2013; pp. 101–112. [Google Scholar]
- Ferguson, J.D.; Galligan, D.T.; Blanchard, T.; Reeves, M. Serum urea nitrogen and conception rate: The usefulness of test information. J. Dairy Sci. 1993, 76, 3742–3746. [Google Scholar] [CrossRef]
- Roseler, D.K.; Ferguson, J.D.; Sniffen, C.J.; Herrema, J. Dietary protein degradability effects on plasma and milk urea nitrogen and milk nonprotein nitrogen in Holstein cows. J. Dairy Sci. 1993, 76, 525–534. [Google Scholar] [CrossRef]
- Godden, S.; Lissemore, K.; Kelton, D.; Leslie, K.; Walton, J.; Lumsden, J. Relationships between milk urea concentrations and nutritional management, production, and economic variables in Ontario dairy herds. J. Dairy Sci. 2001, 84, 1128–1139. [Google Scholar] [CrossRef]
- Danfaer, A.; Thysen, I.; Ostergaard, V. Effect of the Level of Dietary Protein on Milk Production. 1. Milk Yield, Liveweight Gain and Health; Statens: Copenhagen, Denmark, 1980; pp. 492–498. [Google Scholar]
- Visek, W. Some aspects of ammonia toxicity in animal cells. J. Dairy Sci. 1968, 51, 286–295. [Google Scholar] [CrossRef]
- Visek, W.J. Ammonia: Its effects on biological systems, metabolic hormones, and reproduction. J. Dairy Sci. 1984, 67, 481–498. [Google Scholar] [CrossRef]
- Westwood, C.T.; Lean, I.J.; KeIlaway, R.C. Indications and implications for testing of milk urea in dairy cattle: A quantitative review. Part 1. Dietary protein sources and metabolism. N. Z. Vet. J. 1998, 46, 87–96. [Google Scholar] [CrossRef]
- Laven, R.; Scaramuzzi, R.; Wathes, D.; Peters, A.; Parkinson, T. Recent research on the effects of excess dietary nitrogen on the fertility of dairy cows. Vet. Rec. 2007, 160, 359–362. [Google Scholar] [CrossRef]
- Lee, J.; Donaghy, D.; Roche, J. The effect of grazing severity and fertiliser application during winter on herbage regrowth and quality of perennial ryegrass (Lolium perenne L.). Aust. J. Exp. Agric. 2007, 47, 825–832. [Google Scholar] [CrossRef]
- Stakelum, G.; Dillon, P. The effect of grazing pressure on rotationally grazed pastures in spring/early summer on subsequent sward characteristics. Irish J. Agric. Food Res. 2007, 46, 15–28. [Google Scholar]
- Donaghy, D.; Fulkerson, B. Principles for Developing an Effective Grazing Management System for Ryegrass-Based Pastures; Tasmanian Institute of Agricultural Research: Burnie, Tasmania, 2001; Available online: https://www.ausweststephenseeds.com.au/-/media/AWSPS/Documents/Public/Newslet-ter-articles/Principles_for_developing_an_effective_grazing_man.ashx?la=en (accessed on 19 September 2021).
- NRC. Nutrient Requirements of Dairy Cattle, 7th ed.; National Academy Press: Washington, DC, USA, 2001; pp. 3–15. [Google Scholar]
- Oba, M.; Allen, M.S. Evaluation of the importance of the digestibility of neutral detergent fiber from forage: Effects on dry matter intake and milk yield of dairy cows. J. Dairy Sci. 1999, 82, 589–596. [Google Scholar] [CrossRef]
- Mertens, D. NDF and DMI—Has Anything Changed? In Proceedings of the Cornell Nutrition Conference for Feed Manufactures, East Syracuse, Ithaca, NY, USA, 19–21 October 2010; pp. 160–174. [Google Scholar]
- Macdonald, K.; Glassey, C.; Rawnsley, R. The emergence, development and effectiveness of decision rules for pasture based dairy systems. In Proceedings of the 4th Australasian Dairy Science Symposium: Meeting the Challenges for Pasture-Based Dairying, Christchurch, New Zealand, 31 August–2 September 2010; pp. 199–209. [Google Scholar]


| Farm | Grazed Pasture | Grazing Rotation (Days) | |||
|---|---|---|---|---|---|
| Winter | Spring | ||||
| August | September | October | November | ||
| A | Perennial ryegrass–white clover | 30 | 20–25 | 20–25 | 20 |
| B | Perennial ryegrass–white clover | 30 | 25 | 20–25 | 20 |
| C | Perennial ryegrass–white clover | 35 | 30 | 25–30 | 25 |
| D | Perennial ryegrass–white clover | 35 | 30 | 30 | 25 |
| Tall fescue–white clover | 40 | 35 | 35 | 30 | |
| Factor | Abbreviated Term | Ascribed Level | |
|---|---|---|---|
| 1 | 2 | ||
| Pre-grazing DM (kg/ha) | PGDM | ≤3000 | >3000 |
| Pre-grazing height (cm) | PGH | ≤9 | >9 |
| Rotation length winter | RT | 30 days | 35 days |
| Rotation length spring | RT | 20–25 days | 25–30 days |
| Leaf regrowth stage at grazing | LS | ≤3 leaves/tiller | >3 leaves/tiller |
| Norms * | Mean | August | September | October | November | r2 | |
|---|---|---|---|---|---|---|---|
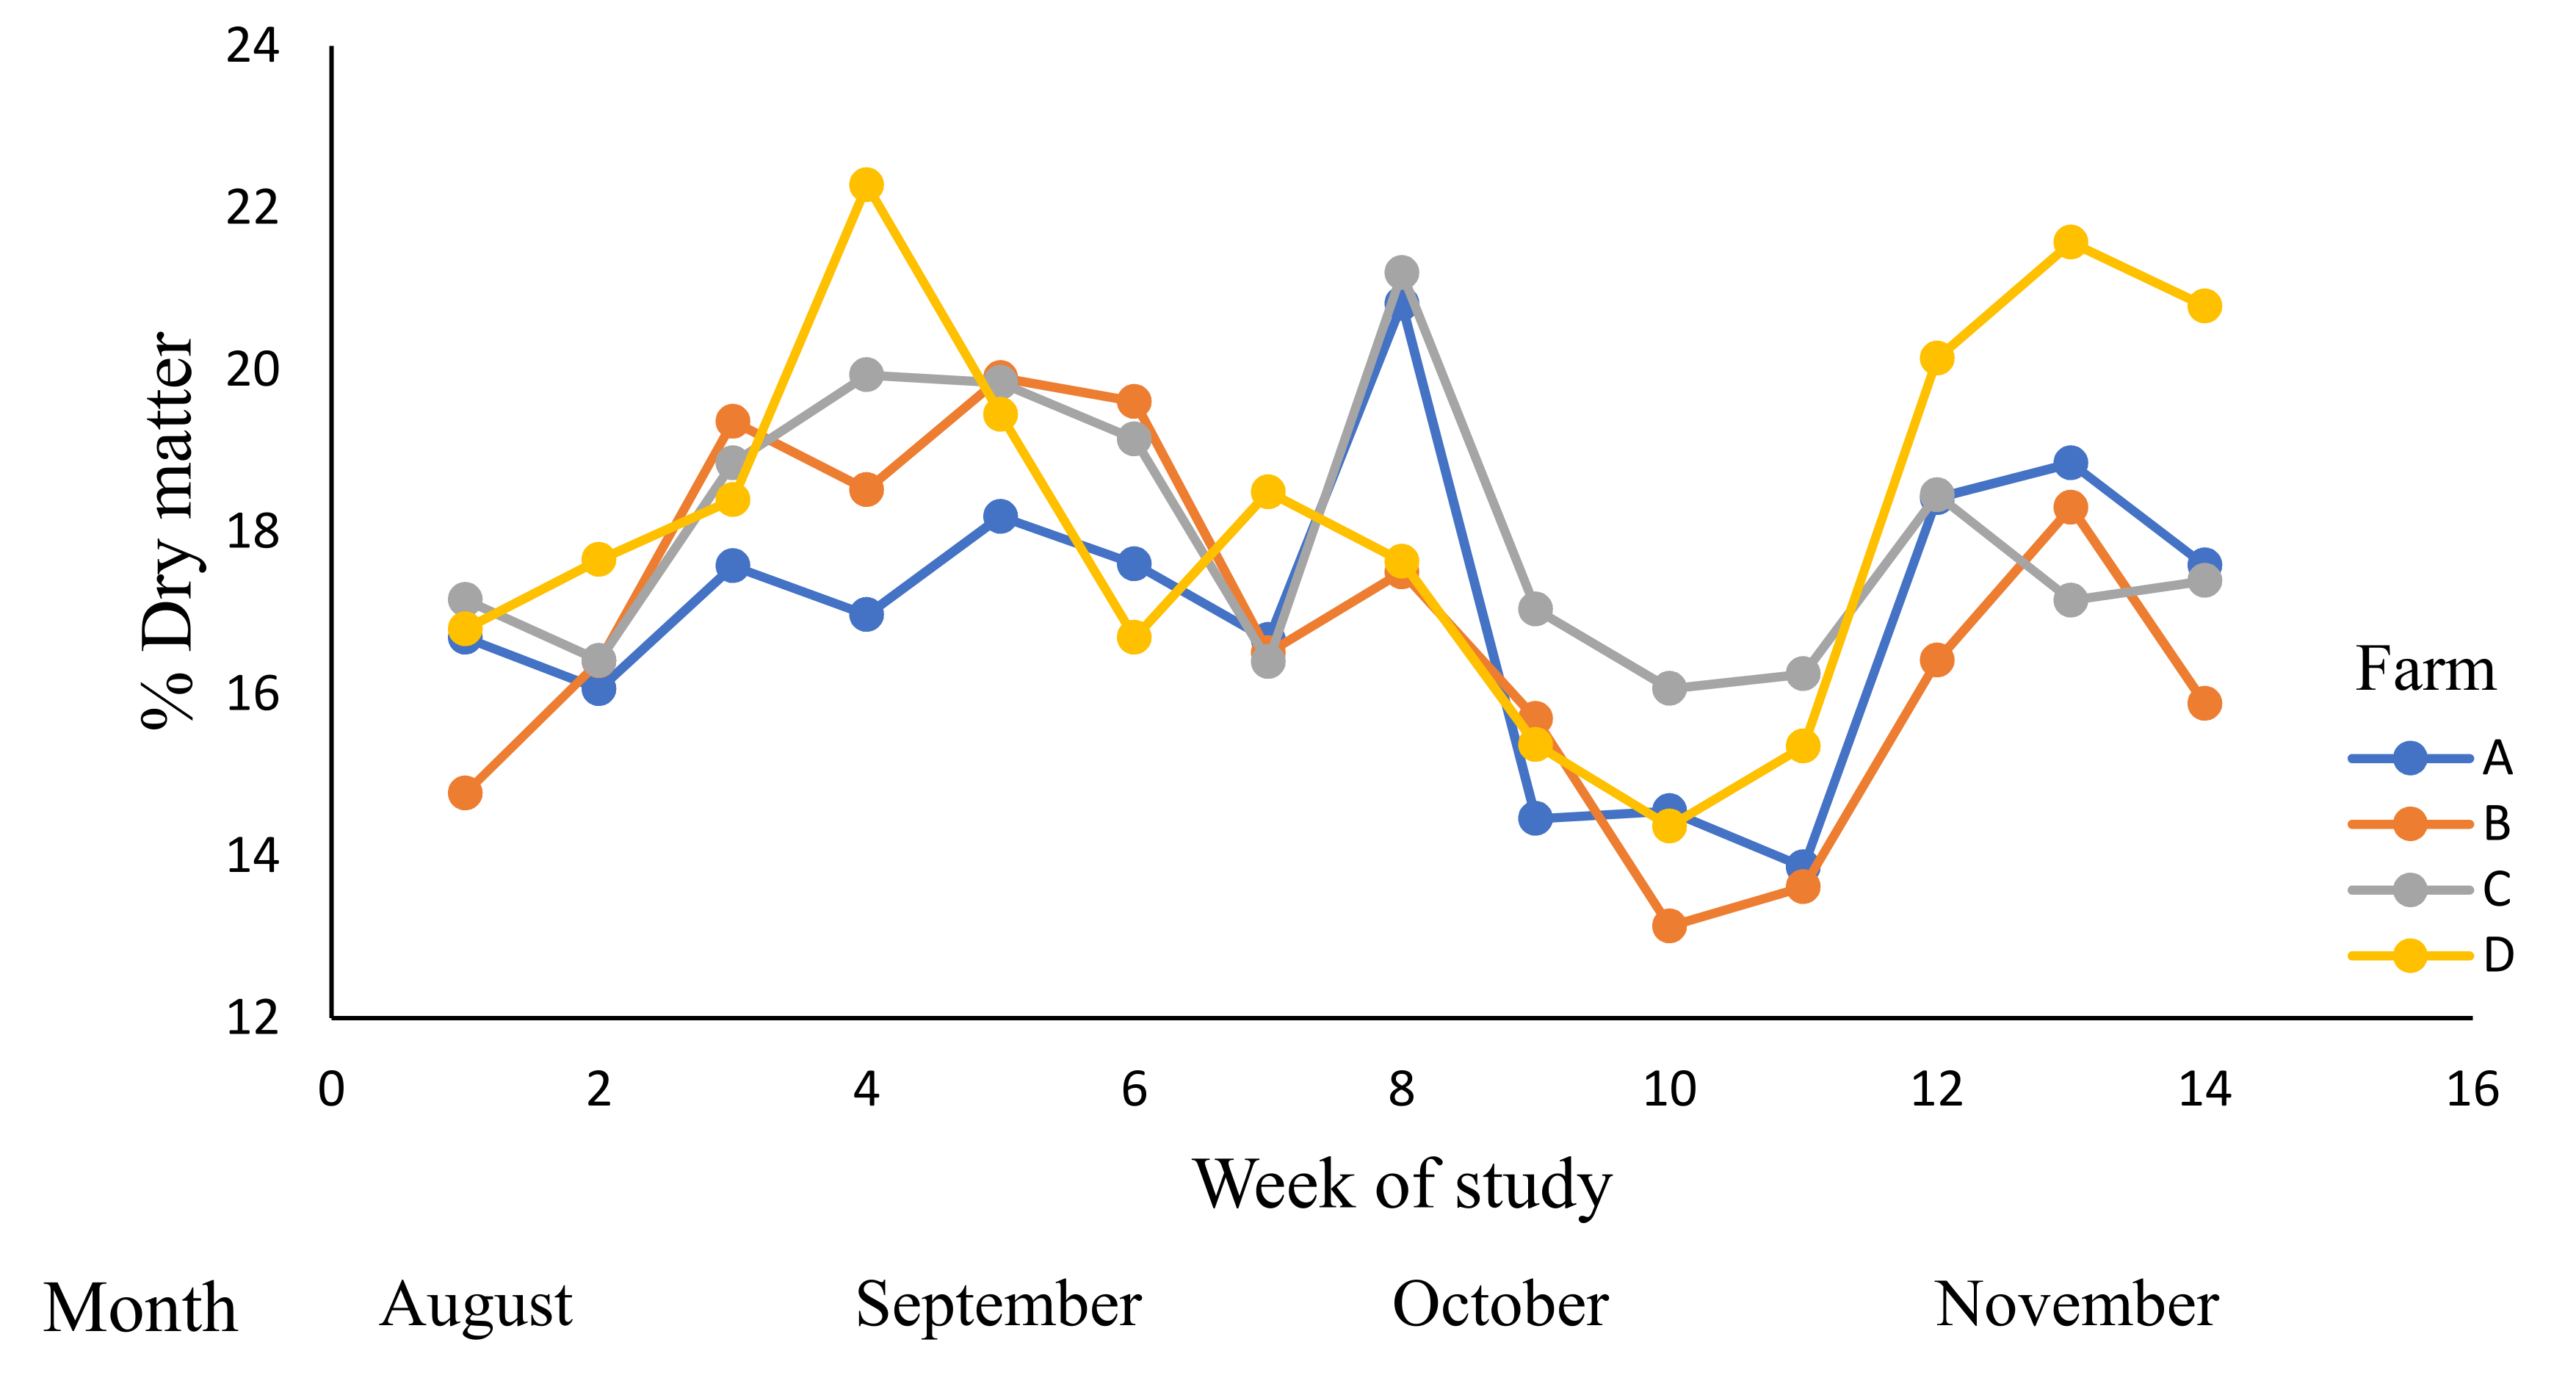
| DM (DM %) | 12–20 | 17.5 | 17.2 b | 18.51 a | 16.1 c | 18.4 a | 0.25 |
| (16.4–17.9) | (17.9–19.2) | (15.4–16.7) | (17.7–19.2) | ||||
| Ash (% DM) | 8–12 | 9.95 | 9.44 b | 9.73 b | 10.3 a | 10.3 a | 0.13 |
| (9.05–9.82) | (9.4–10.1) | (9.97–10.6) | (9.91–10.7) | ||||
| Lipid (%) DM) | 3–6 | 4.13 | 4.47 a | 4.44 a | 3.88 b | 3.7 b | 0.4 |
| (4.3–4.64) | (4.29–4.58) | (3.73–4.02) | (3.53–3.86) | ||||
| NSC (% DM) | 7–25 | 11.8 | 12.1 a | 12.3 a | 10.7 b | 12.2 a | 0.06 |
| (11–13.3) | (11.3–13.3) | (9.7–11.7) | (11–13.3) | ||||
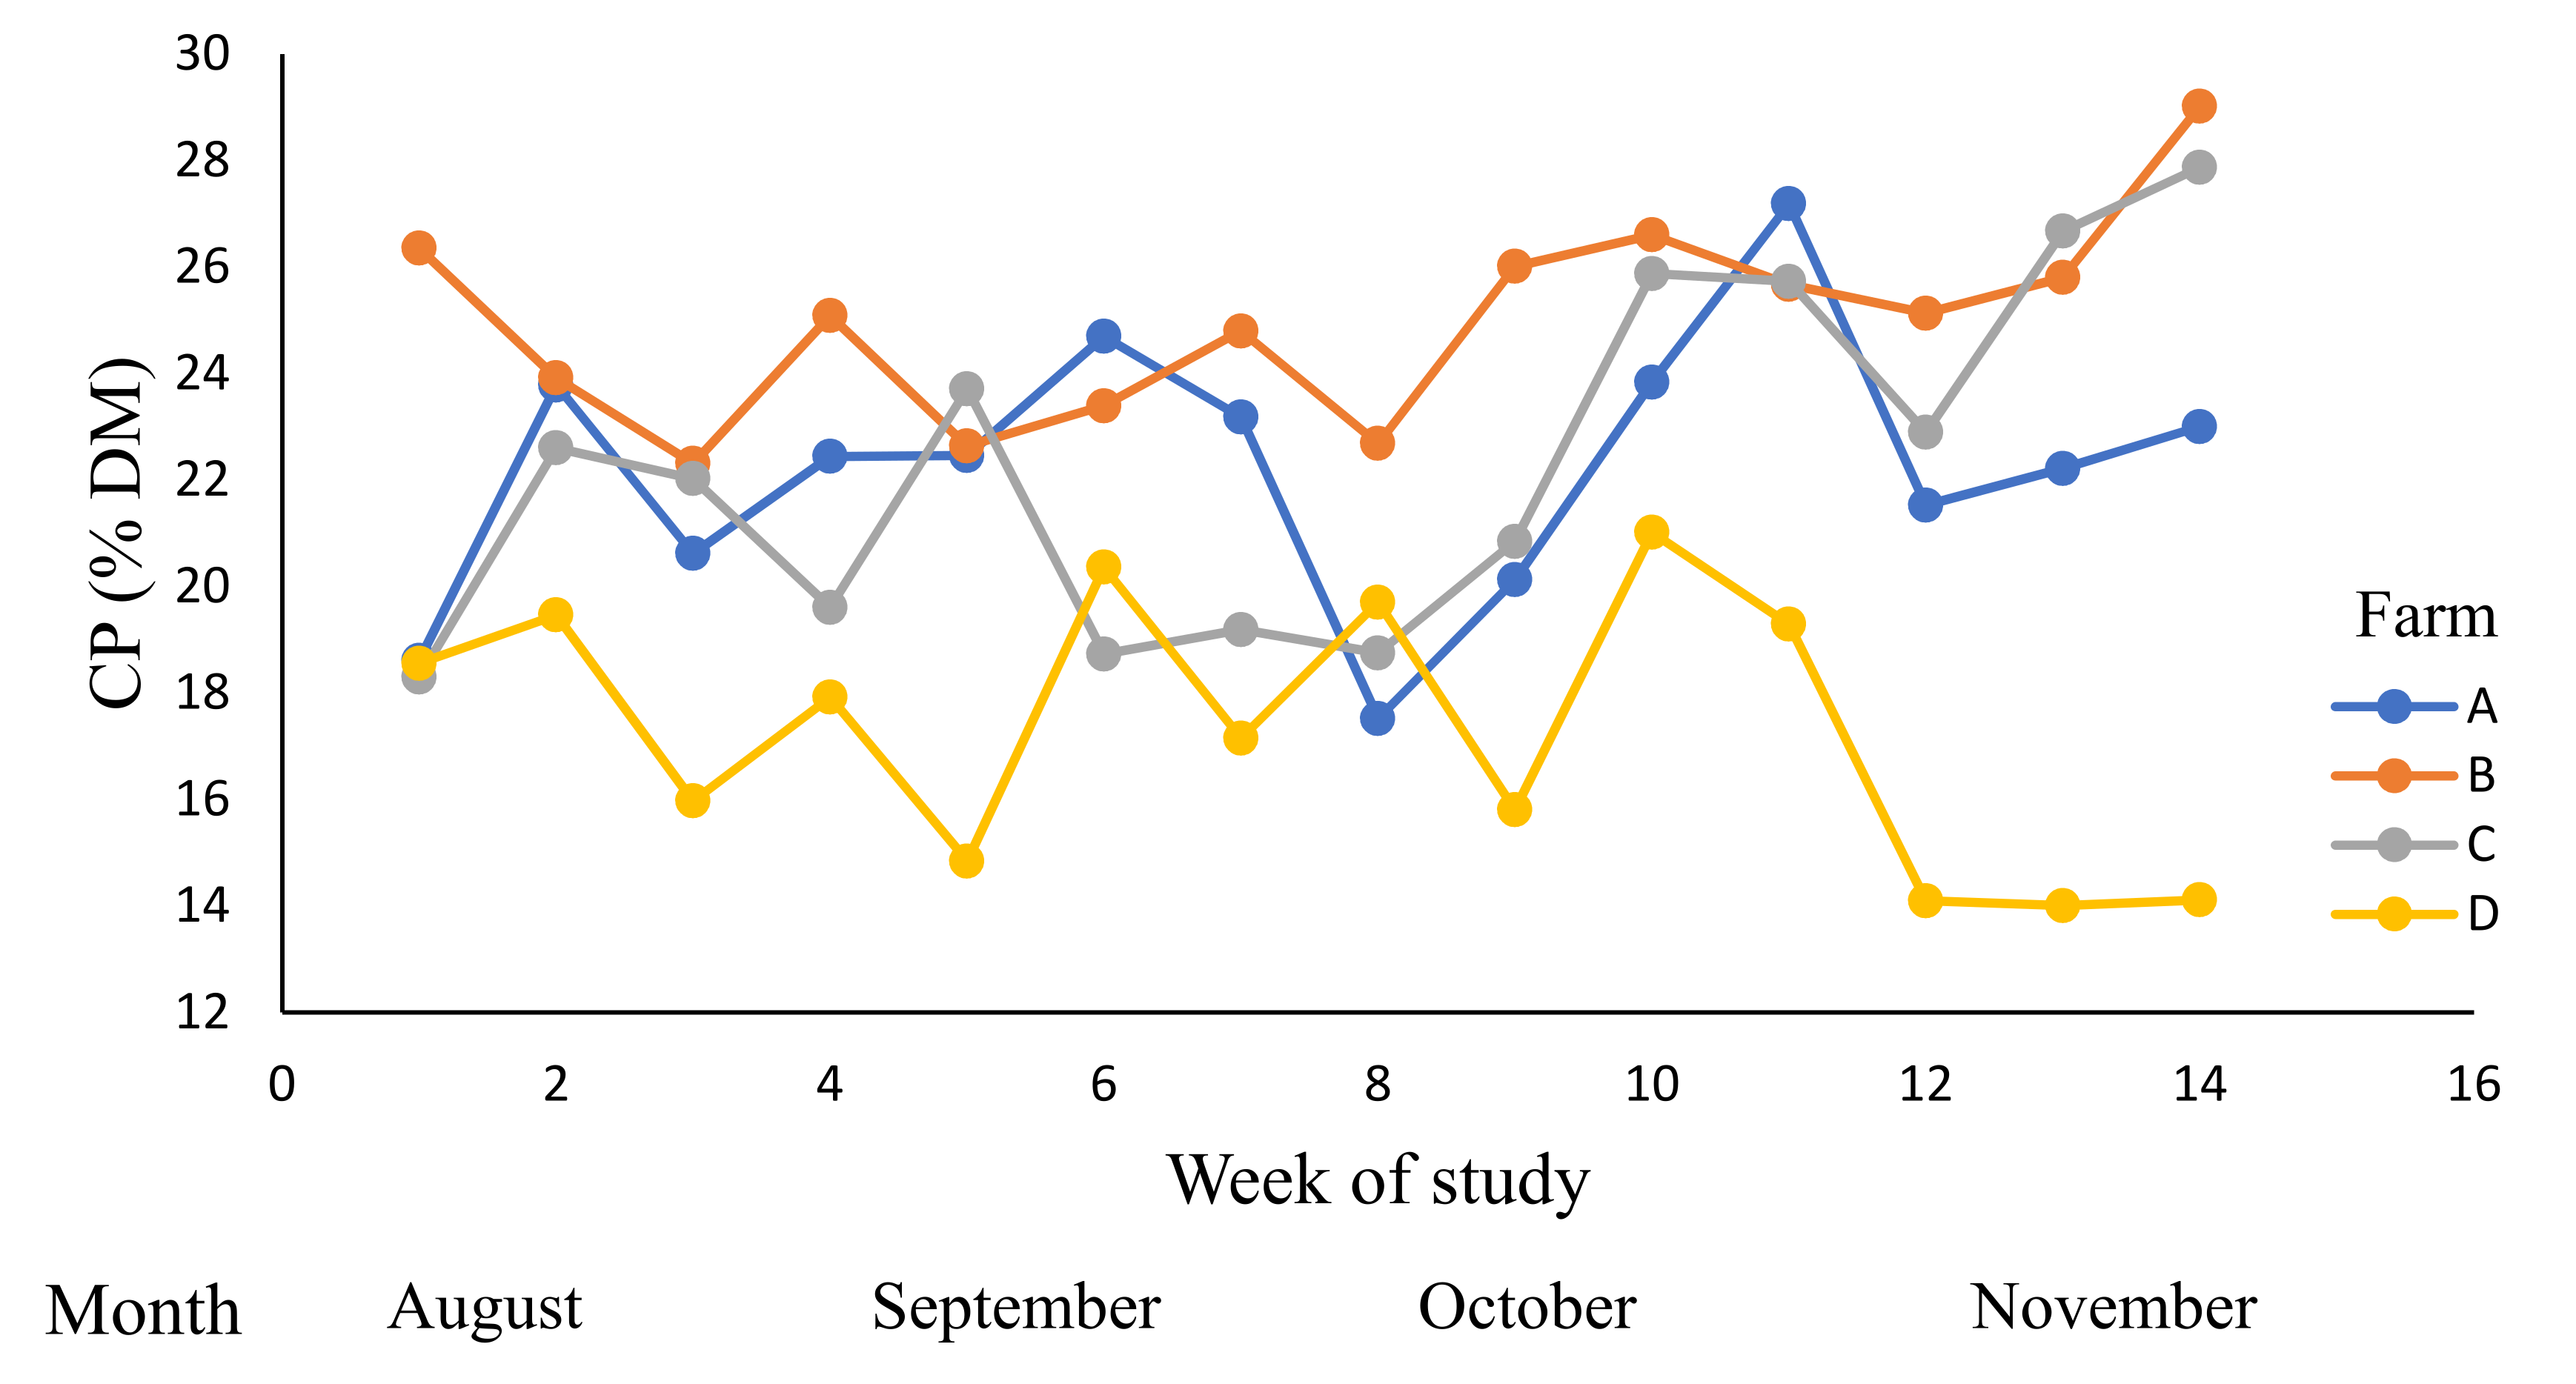
| CP (% DM) | 15–30 | 21.7 | 21.3 | 21.6 | 22.2 | 22.3 | 0.02 |
| (19.3–22.5) | (19.9–22.6) | (20.9–23.7) | (20.6–23.8) | ||||
| NDF (% DM) | 35–45 | 42.5 | 42.0 ac | 41.4 bc | 43.6 a | 42.9 ab | 0.08 |
| (40.8–43.3) | (40.4–42.5) | (42.5–44.6) | (41.7–44.1) | ||||
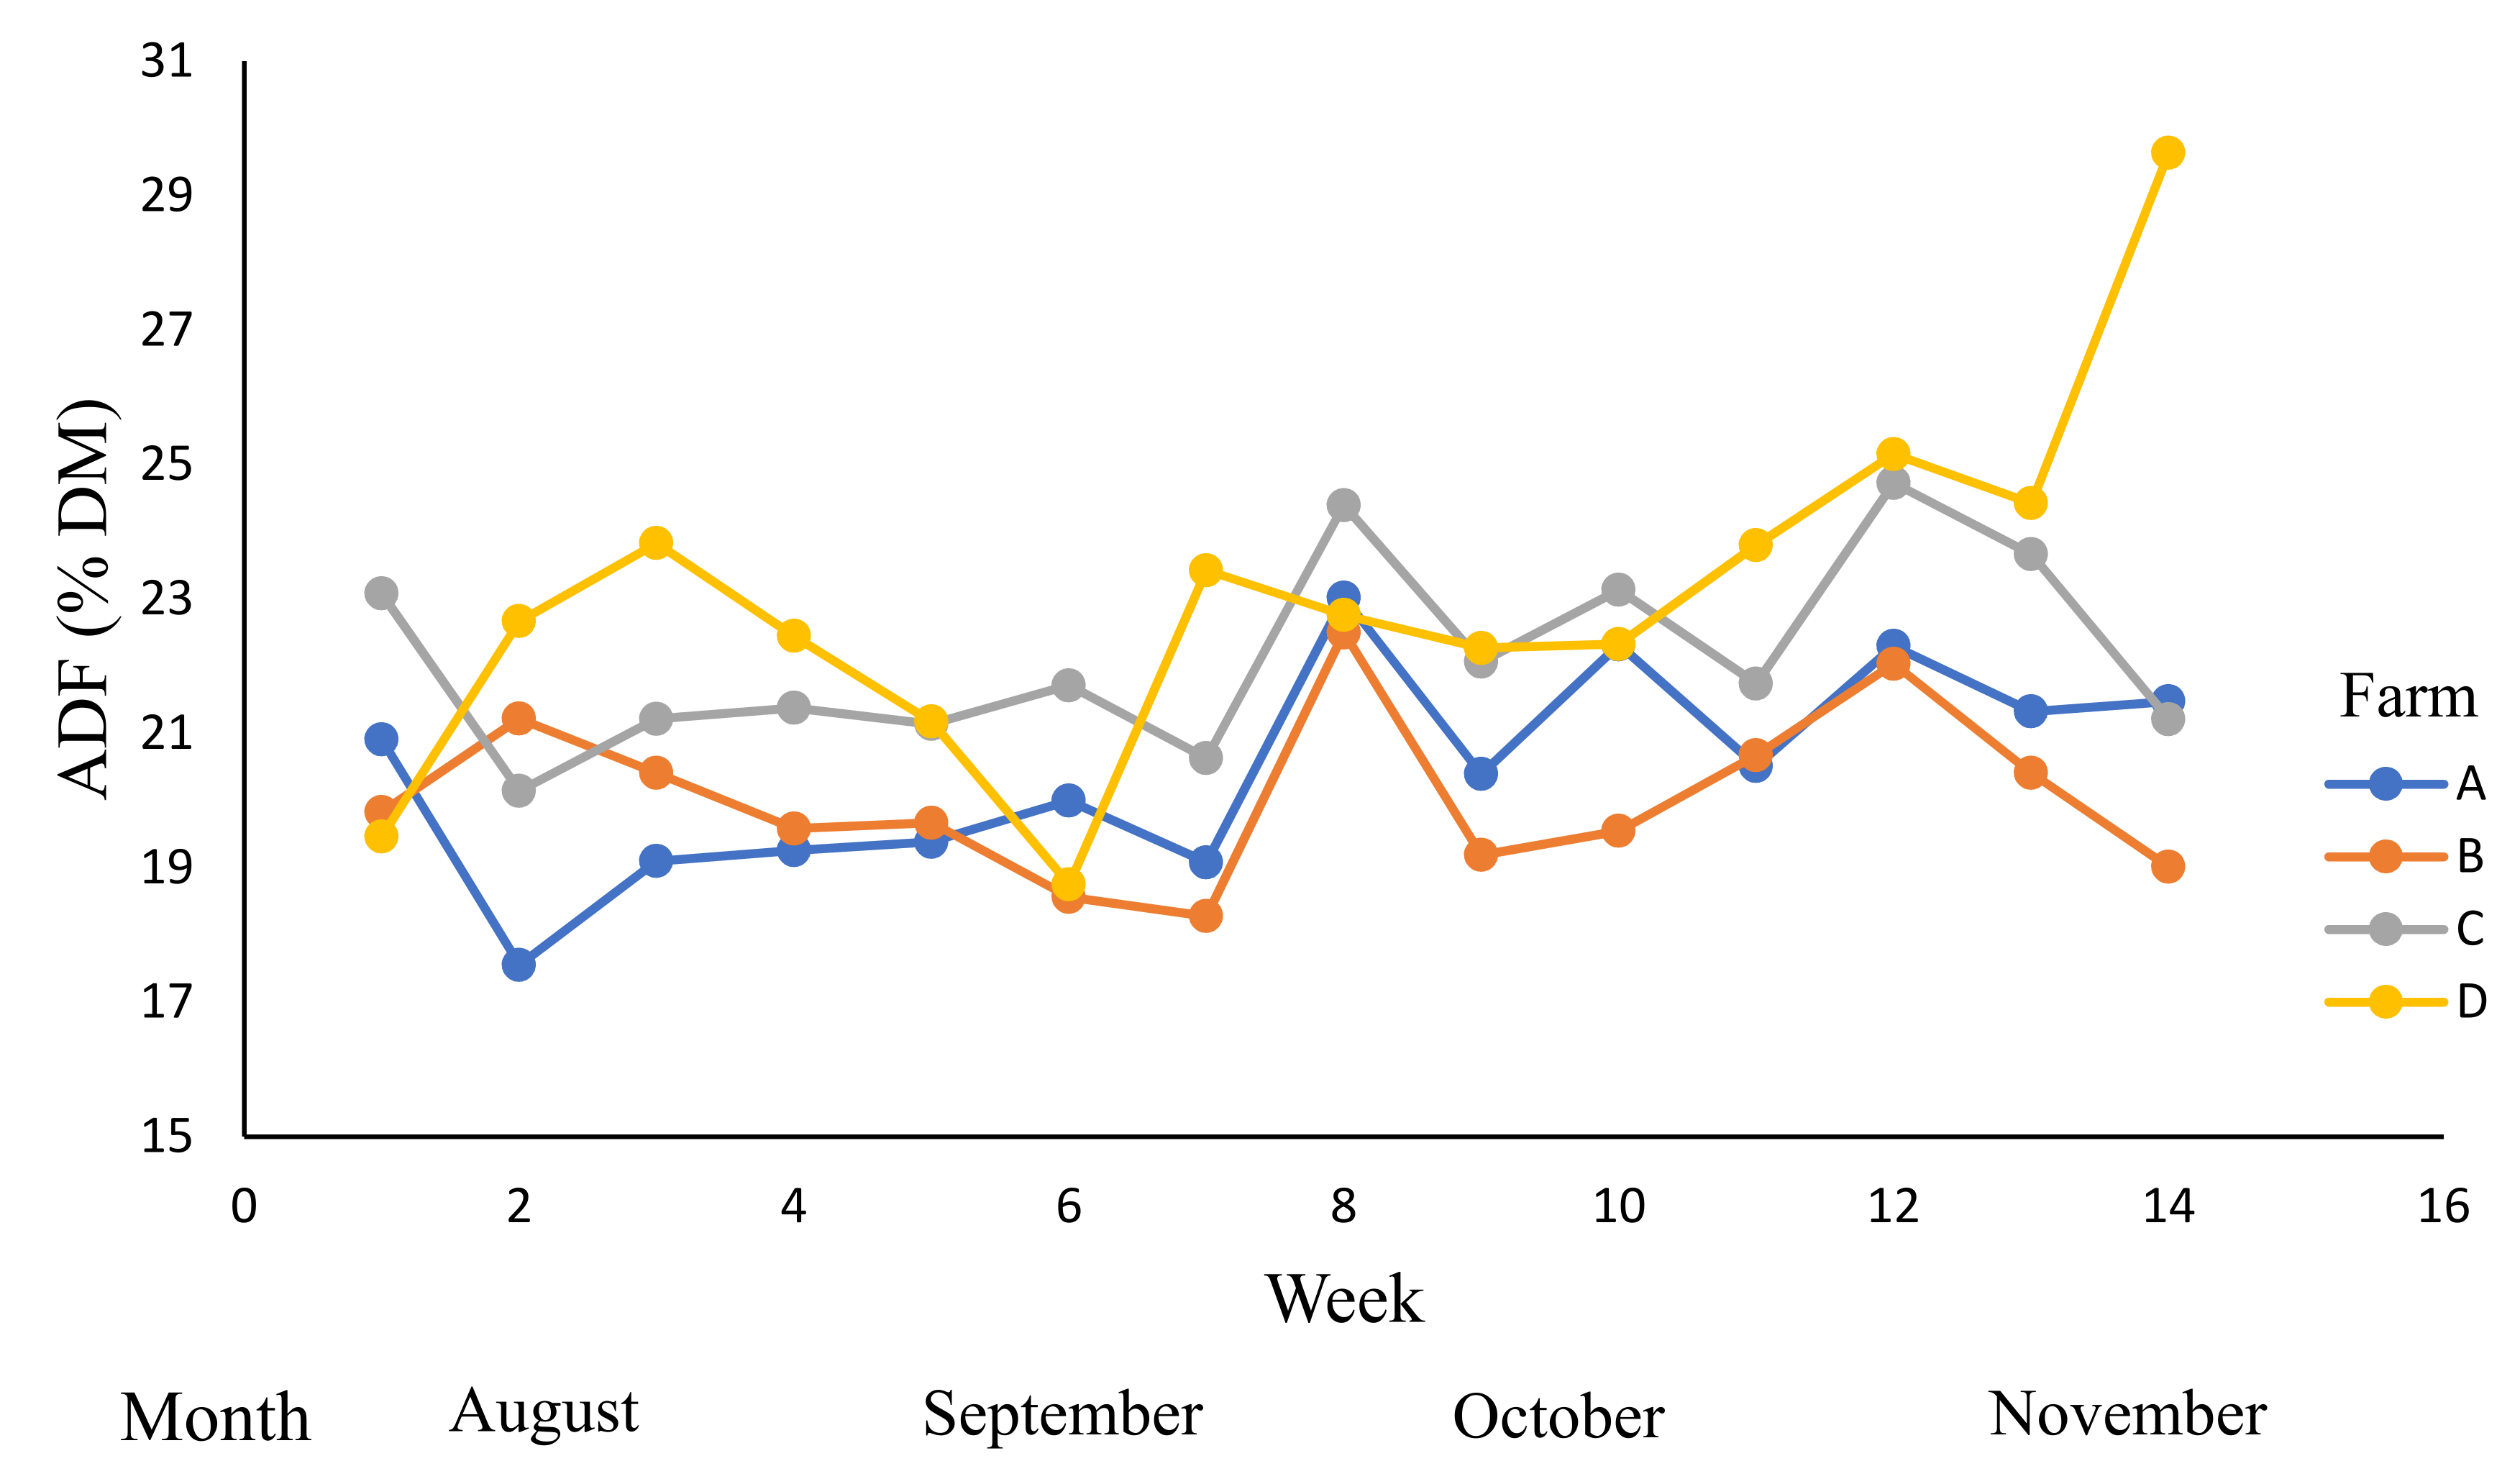
| ADF (% DM) | 20–30 | 21.4 | 20.8 b | 20.3 b | 21.9 a | 22.9 a | 0.19 |
| (19.9–21.6) | (19.5–21) | (21.2–22.7) | (22.1–23.8) | ||||
| OMD (%) DM) | 65–85 | 78.8 | 79.2 ab | 79.3 a | 78.5 ac | 77.9 bc | 0.04 |
| (78.2–80.3) | (78.4–80.3) | (77.6–79.5) | (76.8–79.0) | ||||
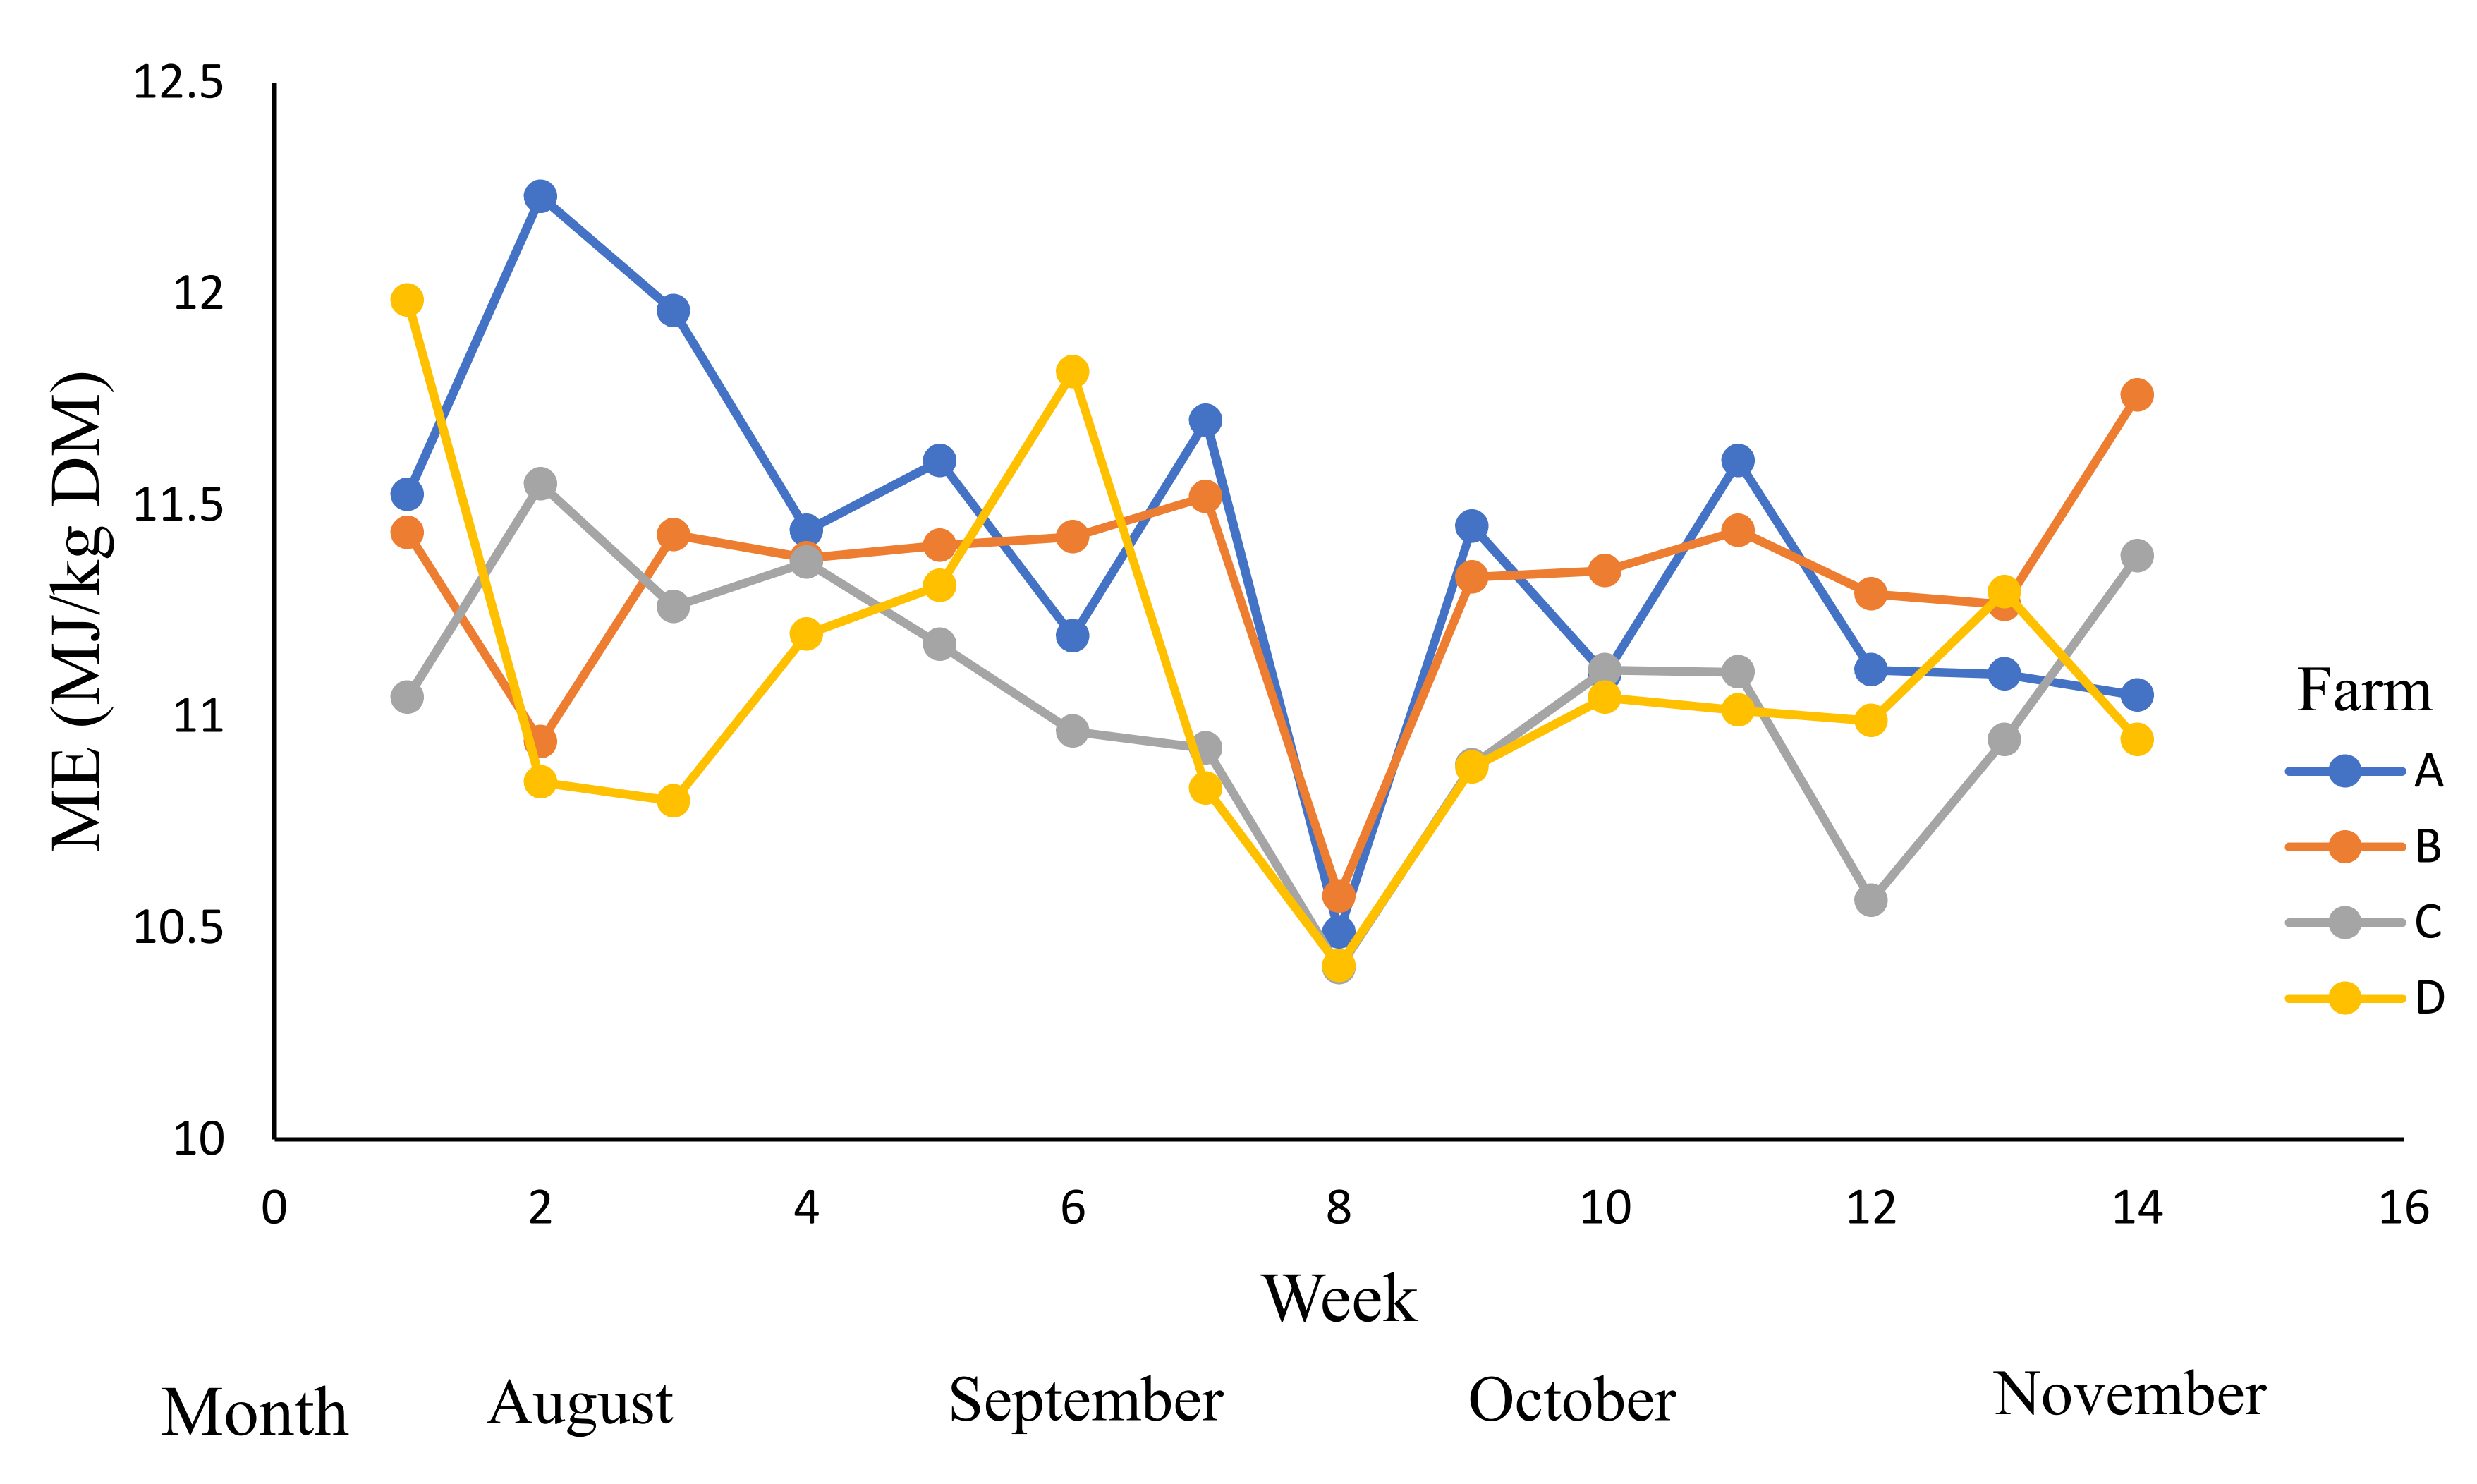
| ME (MJ/kg) DM) | 10.5–12.5 | 11.2 | 11.4 a | 11.3 a | 11.0 b | 11.1 b | 0.13 |
| (11.2–11.6) | (11.2–11.5) | (10.9–11.2) | (10.9–11.2) |
| DM | Ash | Lipid | NSC | CP | NDF | ADF | OMD | ME | |
|---|---|---|---|---|---|---|---|---|---|
| DM | 1 | ||||||||
| Ash | −0.37 **** | 1 | |||||||
| Lipid | −0.23 * | 0.13 | 1 | ||||||
| NSC | 0.37 **** | −0.62 **** | −0.06 | 1 | |||||
| CP | −0.49 **** | 0.79 **** | 0.43 **** | −0.69 **** | 1 | ||||
| NDF | 0.30 ** | −0.05 | −0.60 **** | −0.13 | −0.41 **** | 1 | |||
| ADF | 0.35 *** | −0.21 * | −0.82 **** | 0.05 | −0.53 **** | 0.84 **** | 1 | ||
| OMD | −0.45 **** | 0.33 *** | 0.64 **** | −0.08 | 0.49 **** | −0.59 **** | −0.81 **** | 1 | |
| ME | −0.28 ** | −0.01 | 0.64 **** | 0.01 | 0.38 **** | −0.72 **** | −0.80 **** | 0.83 **** | 1 |
| Mean | August | September | October | November | SEM | r2 | |
|---|---|---|---|---|---|---|---|
| Pre-grazing DM (Kg DM/ha) | 3001 | 3007 ab | 2912 b | 2951 b | 3179 a | 101 | 0.06 |
| (2850–3164) | (2776–3049) | (2815–3088) | (3021–3336) | ||||
| Post-grazing DM (Kg DM/ha) | 1707 | 1707 ab | 1639 b | 1723 a | 1775 a | 36.3 | 0.11 |
| (1650–1764) | (1590–1689) | (1673–1772) | (1718–1832) | ||||
| Pre-grazing height (cm) | 8.93 | 8.95 ab | 8.61 b | 8.75 b | 9.57 a | 0.66 | 0.1 |
| (8.39–9.52) | (8.13–9.1) | (8.27–9.24) | (9–10.13) | ||||
| Residual-height (cm) | 4.31 | 4.31 ab | 4.07 b | 4.37 a | 4.56 a | 0.13 | 0.11 |
| (4.11–4.52) | (3.9–4.25) | (4.19–4.54) | (4.35–4.76) | ||||
| Leaf regrowth stage (no. of leaves per tiller) | 2.29 | 1.90 c | 2.20 b | 2.28 b | 2.81 a | 0.10 | 0.41 |
| (1.74–2.05) | (2.07–2.34) | (2.15–2.41) | (2.66–2.97) |
| Pre-Grazing DM | Post-Grazing DM | Pre-Grazing Height | Residual Height | Leaf Stage | |
|---|---|---|---|---|---|
| Pre-grazing DM (kg DM/ha) | 1 | ||||
| Post-grazing DM (kg DM/ha) | 0.51 **** | 1 | |||
| Pre-grazing height (cm) | 0.88 **** | 0.16 | 1 | ||
| Residual height (cm) | 0.51 **** | 0.96 **** | 0.16 | 1 | |
| Leaf regrowth stage (leaves/tiller) | 0.40 **** | 0.26 *** | 0.40 **** | 0.26 ** | 1 |
| PGDM (kg DM) | PGH (cm) | RT (Days) | LS | Interactions | ||||||||||
|---|---|---|---|---|---|---|---|---|---|---|---|---|---|---|
| ≤3000 | >3000 | SEM | ≤9 | >9 | SEM | 1 | 2 | SEM | ≤3 | >3 | SEM | PGDM/RT | PGH/RT | |
| DM (DM%) | 19.8 a* | 17.6 b* | 0.7 | 18.1 | 18.8 | 0.7 | 17.5 b* | 19.3 a* | 0.7 | 17.6 b* | 19.2 a* | 0.6 | S * | S * |
| Ash (% DM) | 9.8 | 10.2 | 0.3 | 10.1 | 9.8 | 0.3 | 10.5 a** | 9.4 b** | 0.3 | 9.8 | 10.2 | 0.2 | NS | NS |
| Lipid (% DM) | 3.7 | 3.9 | 0.2 | 3.68 | 3.9 | 0.2 | 4.0 a** | 3.4 b** | 0.1 | 4.1 a** | 3.5 b** | 0.2 | NS | NS |
| NSC (% DM) | 11.8 | 11.9 | 0.9 | 11.4 | 12.2 | 1.0 | 11.5 | 12.1 | 0.8 | 11.9 | 11.5 | 0.9 | NS | NS |
| CP (% DM) | 21.4 a* | 19.0 b* | 1.1 | 21.7 a* | 19.4 b* | 1.2 | 22.2 a** | 18.3 b** | 1.1 | 21.1 | 20.4 | 0.7 | S * | S ** |
| NDF (% DM) | 42.8 | 43.8 | 0.9 | 43.0 | 43.5 | 0.9 | 42.0 b* | 44.6 a* | 0.8 | 42.5 | 44.1 | 0.7 | NS | NS |
| ADF (% DM) | 22.1 | 22.9 | 0.6 | 22.3 | 22.7 | 0.6 | 21.2 b** | 23.8 a** | 0.5 | 21.3 b** | 23.7 a** | 0.6 | NS | NS |
| OMD (% DM) | 78.7 a* | 76.6 b* | 0.8 | 77.7 | 77.6 | 0.8 | 79.1 a** | 76.3 b** | 0.6 | 78.8 a* | 76.6 b* | 0.7 | NS | NS |
| ME (MJ/kg DM) | 11.2 a* | 10.9 b* | 0.1 | 11.1 | 11.0 | 0.1 | 11.2 a* | 10.9 b* | 0.1 | 11.2 a* | 10.9 b* | 0.1 | NS | NS |
Publisher’s Note: MDPI stays neutral with regard to jurisdictional claims in published maps and institutional affiliations. |
© 2022 by the authors. Licensee MDPI, Basel, Switzerland. This article is an open access article distributed under the terms and conditions of the Creative Commons Attribution (CC BY) license (https://creativecommons.org/licenses/by/4.0/).
Share and Cite
Kumara, S.N.; Parkinson, T.J.; Laven, R.; Donaghy, D.J. The Influence of Rotational Length, along with Pre- and Post-Grazing Measures on Nutritional Composition of Pasture during Winter and Spring on New Zealand Dairy Farms. Animals 2022, 12, 1934. https://doi.org/10.3390/ani12151934
Kumara SN, Parkinson TJ, Laven R, Donaghy DJ. The Influence of Rotational Length, along with Pre- and Post-Grazing Measures on Nutritional Composition of Pasture during Winter and Spring on New Zealand Dairy Farms. Animals. 2022; 12(15):1934. https://doi.org/10.3390/ani12151934
Chicago/Turabian StyleKumara, Sagara N., Tim J. Parkinson, Richard Laven, and Daniel J. Donaghy. 2022. "The Influence of Rotational Length, along with Pre- and Post-Grazing Measures on Nutritional Composition of Pasture during Winter and Spring on New Zealand Dairy Farms" Animals 12, no. 15: 1934. https://doi.org/10.3390/ani12151934
APA StyleKumara, S. N., Parkinson, T. J., Laven, R., & Donaghy, D. J. (2022). The Influence of Rotational Length, along with Pre- and Post-Grazing Measures on Nutritional Composition of Pasture during Winter and Spring on New Zealand Dairy Farms. Animals, 12(15), 1934. https://doi.org/10.3390/ani12151934