Simple Summary
The ability to obtain in vivo information on characteristics related to fish composition is necessary for aquaculture. In addition, there is growing interest in production traits, such as growth, feed efficiency or fillet weight, but it remains difficult to precisely record in vivo individual fish traits that report to these production traits, which can increase edible fish meat production and decrease the environmental impact. In the present study, we performed an ultrasound approach for the in vivo prediction of fillet volume of the Senegalese sole (Solea senegalensis), a species considered a promising flatfish species for marine fish farming. The results show that models based on ultrasound fillet volume measurements explain above 95% of the variation observed in fillet volume. However, for fillet yield estimation, the results were modest. Therefore, further studies are necessary to better understand the potential of the ultrasound approach to this trait. Nevertheless, this work allows us to conclude that the approach with ultrasound is promising for measuring in vivo fish composition traits.
Abstract
Senegalese sole (Solea senegalensis) has been considered a promising new flatfish species for Mediterranean marine fish farming. Accurate prediction of fillet traits in live animals may allow for more efficient control of muscle deposition in fish. In this sense, this study was undertaken to develop a non-invasive method to predict in vivo fish fillet volume and yield using real-time ultrasonography (RTU). The trial was conducted with 44 market weight Senegalese sole (298.54 ± 87.30 g). Fish were scanned with an Aloka SSD 500V with a 7.5 MHz probe. Ten RTU cross-sectional images were taken from the operculum to the caudal fin at regular intervals. These images were analyzed using Fiji software. These data were then used to estimate the partial volumes of the fillet. Actual fillet volume was determined using Archimedes’ principle. Simple and stepwise multiple regression analyses were then used to develop prediction models of fillet volume and yield. The most cranial RTU sections of the fish fillet were the best single predictors of both fillet volume and fillet yield and were the ones included in the best stepwise models. The best RTU slice area explained 82% of the variation observed in fillet volume, but the other RTU slice areas used as predictors of fillet volume showed poor to moderate accuracy (0.035 ≤ R2 ≤ 0.615). Single RTU partial volumes showed poor to very high accuracy (0.395 ≤ R2 ≤ 0.970) as predictors of fillet volume. The best stepwise model based on the RTU slice areas included three independent variables and explained 88.3% of the observed variation. The best stepwise models based on RTU partial volumes (single volumes and/or combinations of single volumes) explained about 97% of the variation observed in fillet volume. Two RTU volume traits, V1–5 + V6–9, and V1+()+9, showed to be practically direct predictors of the actual fillet volume, explaining, respectively, 97% and 96% of the variation observed in the actual fillet volume. The fillet yields show lower correlations with slice areas (r between 0.044 and 0.601) than with volumes (r between 0.288 and 0.637). While further studies are clearly necessary to better understand the potential of RTU for the estimation of fillet yield in fish in general and Senegalese sole in particular, the present results showed that RTU traits can be very good predictors of Senegalese sole’s fillet volume, either used in regression models or as direct predictors.
1. Introduction
In the EU, there is an orientation to turn the aquaculture sector more competitive by focusing on quality, health and safety and providing a high-quality, highly nutritional and trustworthy product to the consumer in an eco-friendly way [1]. Senegalese sole (Solea senegalensis) is one of the species that has deserved attention and has been considered a promising flatfish species for Mediterranean marine fish farming [2]. For fish species, increasing fillet yield will result in more retail products per unit weight of live fish produced. This requires knowledge of the body composition traits in live fish, which are essential for feeding and genetics programs [3,4]. However, such programs depend critically on accurate and, above all, non-invasive methods to predict body composition in live fish [5,6]. For fish, comprehensive studies have been conducted using computed tomography (CT) [7,8,9] or magnetic resonance imaging (MRI) [3,10] to predict fish composition traits. However, despite the indisputable merit of these imaging techniques for estimating the composition of fish and other farm species [11,12], their cost and low portability limit their practical use [13]. Another imaging technique that has been widely used to predict the in vivo composition of meat species is real-time ultrasonography (RTU) [11]. This technique has shown enormous evolution in the last decade and is currently presented as indispensable in meat production as a non-invasive, versatile, simple-to-operate, and low-cost tool to assess meat traits [14]. In addition to the main meat species, this technique has also been successfully used to estimate fish composition traits [15,16,17,18,19]. These works had different objectives and used the RTU to obtain in vivo measurements of muscle and fat in fish. For example, Silva et al. [16] used the RTU and image analysis to assess the fat of Senegalese Sole, while other works used this technique to obtain muscle measurements, such as area [12] or muscle thickness measurements [4,20], with the objective of predicting slaughter yields and predictors for genetic breeding programs. In these works, there were several species, such as Common carp (Cyprinus carpio and C. rubrofuscus) [4], European sea bass (Dicentrarchus labrax) [20], rainbow trout (Oncorhynchus mykiss) [5] and tambaqui (Colossoma macropomum) [15]. In all the works that used probes from 6 to 10 MHz, it was concluded that the RTU is an effective tool to obtain in vivo body and carcass traits that can be used in feed and breeding programs in a simple, efficient and sustainable way, compared to previously used methods, namely the destructive approaches. Although ultrasound has been used for evaluating animal composition for over 60 years, little information is available about volume measurements obtained in vivo by RTU. Thus, this study was undertaken to predict the fillet volume and fillet yield of Senegalese sole individuals from RTU measurements obtained in vivo using a probe of 7.5 MHz and image analysis.
2. Material and Methods
2.1. Fish and Experimental Procedures
Forty-four market weight Senegalese sole (Solea senegalensis); mean body weight 298.54 ± 87.30 g; range 178.77 to 456.32 g) were used. The fish were chosen randomly from the aquaculture research facilities of the University of Trás-os-Montes and Alto Douro (Vila Real, Portugal). All animals were kept under the same management conditions, stocked in a rectangular PVC tank (bottom area 0.75 m2; water column 50 cm; volume: 500 L; water-flow rate: 5.5 L min−1), supplied with recirculated seawater (18.7 ± 1.6 °C; salinity: 35.2 ± 1‰), and were fed ad libitum an extruded commercial diet (2 mm) for marine fish supplied by AQUASOJA. Animal handling followed the guidelines of EU directive number 2010/63/EU and FELASA category B and C recommendations concerning the protection of animals used for scientific purposes.
2.2. Ultrasound Procedure
Fish were scanned with an Aloka SSD 500V real-time scanner (Aloka, Tokyo, Japan) equipped with a linear array transducer of 7.5 MHz (Aloka UST-5512U-7.5, Tokyo, Japan) with a gain, near gain and far gain of 64, 24 and 0.9, respectively. Figure 1 shows an example of an RTU image. The RTU images were taken in cross-sectional slices (S1 to S10; Figure 2) from the end of the operculum to the beginning of the caudal fin. To achieve this, the probes were placed perpendicular to the fish major axis and displaced along the fish in a craniocaudal movement from the end of the operculum to the beginning of the caudal fin. To ensure that the transducer was always placed in the same relative position, the length of the fish (mean length 203.11 ± 36.52 mm; range 162.30 to 299.60 mm) was considered. To ensure optimal acoustic contact, a gel standoff was placed between the probe and the fish. Fish were placed in a rectangular metallic container with saltwater (column: 3 cm), and RTU scans were taken under anesthesia using 150 mg L−1 phenoxyethanol (Merck–Schucherd, Hohenbrunn, Germany).
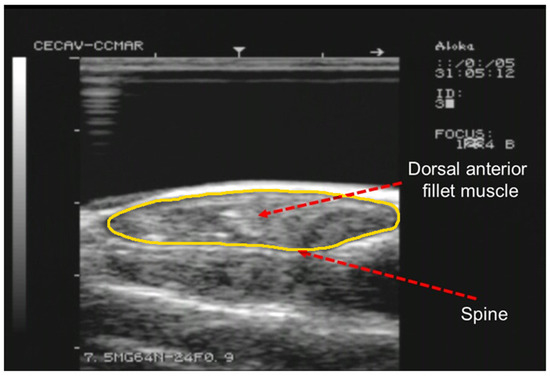
Figure 1.
Example of a RTU cross-sectional image acquired with a 7.5 MHz probe at S3 position. Arrows indicate the spine and right dorsal fillet muscle. The outline of the fillet section is highlighted in yellow.
2.3. Image Acquisition, Analysis and Volume Calculation
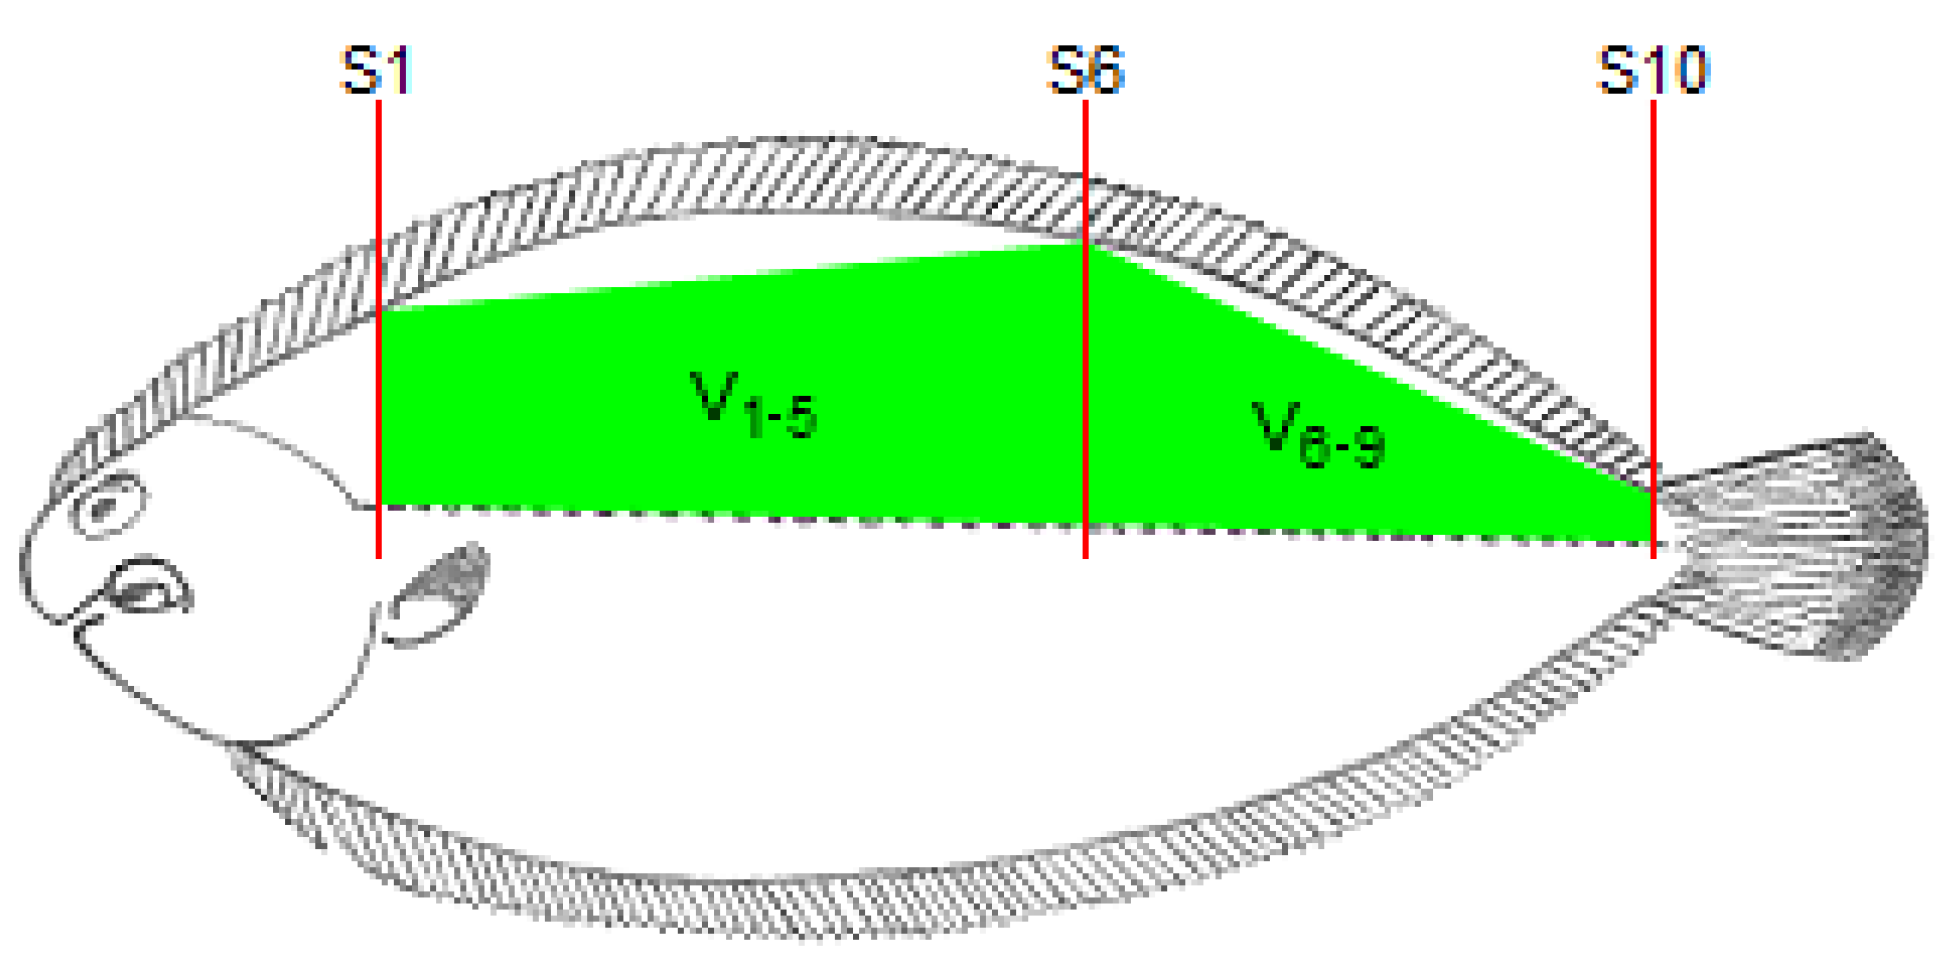
The fish length, from the end of the operculum to the beginning of the caudal fin, was determined using a ruler and this length was divided by 10 to obtain the length of each section between two consecutive locations for RTU cross-sectional scanning. As the probe moved along the 10 cross-sectional positions (S1 to S10; Figure 2), the RTU images for each position were captured. These images were identified and recorded in a TIFF file for further analysis. For each cross-sectional image, the right dorsal fillet area (A1 to A10) was determined using Fiji software (ImageJ 1.49u) [21] by tracing the contour of the muscle and counting the number of pixels within that contour. The RTU fillet volumes were then calculated using the Cavalieri principle [22] procedure (see Figure 2)—V1, V2, V3, V4, V5, V6, V7, V8 and V9, for sections between each pair of consecutive RTU slices; V1–5, for a section between slices S1 and S6; V6–9, for a section between slices S6 and S10; V1–3, for a section between slices S1 and S4; V4–6, for a section between slices S4 and S7; V7–9, for a section between slices S7 and S10. Briefly, the volume of each section (RTU partial volume) was calculated multiplying the mean fillet areas of each pair of RTU images by the section length, and for volumes between non-adjacent slices, only the areas of the limiting slices of that section are used (e.g., for V1–5, only are used area measurements from S1 and S5). The RTU fillet volume (V1+()+9; cm3) was calculated using the following equation:
where A is the mean section area (cm2), d is the section length (cm) and i is the number of sections.
2.4. Carcass Dissection and Fillet Volume Determination
After ultrasound images were recorded, the fish were euthanized with an overdose of 500 mg L−1 phenoxyethanol (Merck–Schucherd, Hohenbrunn, Germany). Body weight (BW) and body length measurements were recorded. The fish volume was also determined using Archimedes’ principle. Then, the right dorsal fillet of each fish was dissected. This dissection was meticulous enough to have a standardized fillet extract procedure. To minimize fillet shape deformation, fillets were placed over a horizontal surface. The fillet was weighed and fillet yield was calculated as the ratio between fillet weight and fish weight. The fillet volume was determined according to Archimedes’ principle—the fillets were submerged in water and the volume of water displaced by this action was measured.

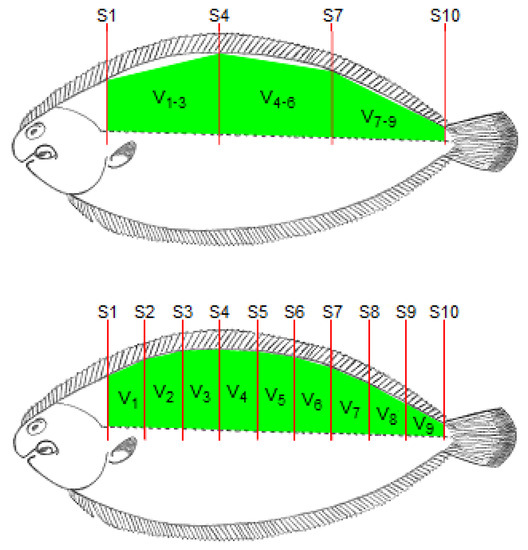
Figure 2.
Schematic representation of the location of the cross-sectional RTU slices (S1, S2, S3, S4, S5, S6, S7, S8, S9 and S10).
Figure 2.
Schematic representation of the location of the cross-sectional RTU slices (S1, S2, S3, S4, S5, S6, S7, S8, S9 and S10).

2.5. Statistical Analysis
Descriptive statistics, correlation and simple and multiple regression analysis were performed with JMP-SAS software (v.14; JMP-SAS Institute Inc. Cary, NC, USA). Multiple stepwise forward regression with k-fold cross-validation models were developed to predict fillet volume (dependent variable) from RTU partial volumes (independent variables). A 10-fold cross-validation technique was used to assess the stability of the regression models. The accuracy of the estimates was based on the coefficient of determination (R2), and the root mean square error of the cross-validation (RMSE) was used to determine the precision of the prediction models. The best models were chosen based on a high R2 and lowest RMSE.
3. Results
3.1. Descriptive Statistics
Fish body weight (BW) presented a range of variation of 178.77 to 456.32 g (Table 1). Fillet weight and fillet volume exhibited larger CV (35.0% and 35.6%, respectively) than those of BW and total volume (29.2% and 28.4%, respectively). Fillet yield showed a much smaller CV (9.6%). As expected, given the body shape of the Senegalese sole, the most cranial RTU sections are those with the largest dimensions. Concerning all RTU traits estimated, the ones with the CV closest to that of fillet volume were V5 and V1–5 (CV = 35.2%), V1+()+9 (CV = 35.1%) and V1–3+4–6+7–9 (CV = 35.9). Overall, the CV for single RTU partial volumes (29.1% ≤ CV ≤ 51.2%) was larger than the CV for slice areas (18.2% ≤ CV ≤ 39.4%) but quite close to the CV for combinations of RTU partial volumes (29.0% ≤ CV ≤ 45.2%).

Table 1.
Mean, standard deviation (sd), minimum, maximum and coefficient of variation (CV) for fish and real-time ultrasonic (RTU) traits (n = 44).
3.2. Prediction of Fillet Volume from RTU Area(s) and Volume(s)
Fillet volume estimates based on A2 showed high accuracy (R2 = 0.820; p < 0.01; Table 2), but the other estimates based on RTU slice areas showed very poor to moderate accuracy (0.035 ≤ R2 ≤ 0.615; p < 0.01; Table 2), while the estimates of fillet volume based on single RTU partial volumes showed poor to very high accuracy (0.395 ≤ R2 ≤ 0.970; p < 0.01; Table 2). For corresponding locations, single RTU partial volumes showed significantly higher accuracy than RTU slice areas. In addition, the precision of fillet volume estimates based on single RTU partial volumes was higher than that based on RTU slice areas (3.08 ≤ RMSE ≤ 13.79 and 7.51 ≤ RMSE ≤ 17.40, respectively; p < 0.01; Table 2). Both types of estimates (based on RTU slice areas or on single RTU partial volumes) showed a trend toward more accurate and precise results when obtained from the cranial part of the fish body. This was particularly clear considering V1–5 (R2 = 0.970; RMSE = 3.08; p < 0.01; Table 2) and V6–9 (R2 = 0.802; RMSE = 7.88; p < 0.01; Table 2), and V1+2+3 (R2 = 0.956; RMSE = 3.73; p < 0.01; Table 2), V4+5+6 (R2 = 0.912; RMSE = 5.24; p < 0.01; and V7+8+9 (R2 = 0.679; RMSE = 10.05; p < 0.01). Confirming this trend, the combinations of RTU partial volumes based only on the last sections of the fish body (V7+8 and V7+8+9) showed moderate accuracy as predictors of the fillet volume (respectively R2 = 0.626 and R2 = 0.679; p < 0.01; Table 2), against the high to very high accuracy shown by all the other combinations of RTU partial volumes (0.853 ≤ R2 ≤ 0.960; p < 0.01; Table 2).
Table 2.
Simple linear regressions between the right dorsal fillet volume and real-time ultrasonic (RTU) traits for the right dorsal fillet (n = 44).
3.3. Prediction of Fillet Volume Using Stepwise Multiple Linear Regression
The stepwise analysis confirmed that the trend for RTU data obtained from the cranial part of the fish body was the best predictor of fillet volume (Table 3). All stepwise models explained a very large amount of the variation observed in the fillet volume. Still, also in line with the results from simple linear regression analysis, the best stepwise model based on RTU slice areas explained a significantly less amount of variation (R2 = 0.8830; p < 0.01; Table 3) than any stepwise model based on RTU partial volumes (0.9689 ≤ R2 ≤ 0.9755; p < 0.01; Table 3). As indicated by the simple linear regression analysis, V1–5 was the best RTU predictor of fillet volume, and the stepwise analysis showed that the inclusion of other RTU partial volumes, with or without V1–5 in the final model, at best, provided a slight improvement in the amount of variation observed. As indicated by the simple linear regression analysis, V1–5 was the best single RTU predictor of fillet volume, and the stepwise analysis showed that, using different combinations of the several RTU predictors analyzed, in the final model, at best, only provided a slight improvement in the amount of variation observed. Together with the stepwise results for models with combinations of RTU volumes, this shows that the location of the RTU measurements used is more important than the amount of information used to obtain the final fillet volume estimates.
Table 3.
Best models for predicting fillet volume, obtained after stepwise multiple regression with k-fold cross-validation, considering area and volume measurements (n = 44) *.
Concerning V1–5 (33.39 ± 11.75 cm3) and V6–9 (14.52 ± 5.47 cm3), it must be pointed out that the sum of the mean RTU fillet volumes obtained with these two traits was equal to the mean RTU fillet volume (V1+()+9; 47.91 ± 16.81 cm3) and such a value wasn’t significantly different from the actual mean fillet volume (49.12 ± 17.51 cm3), with V1–5 + V6–9 and V1+()+9 explaining, respectively, 97% (p < 0.01; data not shown and 96% (p < 0.01; Table 2) of the variation observed in the actual fillet volume.
3.4. Correlations between Fillet Yields and RTU Slice Area(s) and Volume(s)
The correlations between the fillet yields and the RTU traits are presented in Table 4. The correlation values found for the fillet yield and the fillet yieldV1–5 are similar, although 19 out of 32 correlations studied were higher for the latter yield. In general, correlations based on RTU volumes tended to show higher correlations (r between 0.288, p > 0.05 and 0.637, p < 0.01 for fillet yield and r between 0.346, p < 0.05 and 0.609, p < 0.01 for fillet yieldV1–5) than those based on RTU slice areas (r between 0.055, p > 0.05 and 0.601, p < 0.01 for fillet yield and r between 0.044, p > 0.05 and 0.408, p < 0.01 for fillet yieldV1–5). Furthermore, the highest correction values were observed with measure V1 (r = 0.637, p < 0.01) and with measure V1+2 (r = 0.637, p < 0.01) for fillet yield and fillet yieldV1–5, respectively. These results show the importance of the measurements obtained in cranial positions.
Table 4.
Correlations between fillet yields and real-time ultrasonic (RTU) traits (n = 44).
4. Discussion
The larger RTU slice areas (and consequently larger RTU volumes) obtained in the cranial part of the fish body reflect the larger volume of the fillet there, given the body shape of the Senegalese sole. Therefore, such RTU data are expected to be better predictors of total fillet volume, as observed. According to this suggestion, depending on the fish shape (and muscle volume/mass distribution along the body), the single RTU slice areas shown to be the best predictors of fillet volume or weight will vary for different fish species. This is in line, for instance, with the results of Bosworth et al. [23], with catfish pointing at an RTU slice location about midway the tip of the head and the beginning of the tail fin as the best RTU predictor of fillet weight, as could be expected since catfish have a much more regular fusiform shape than Senegalese sole. The shape and size of the animals are essential for accuracy when using the RTU technique. In the present work, the size of the fish was adequate for the size of the probe, and in this way, it was possible to obtain images that allowed the area of the fillet section to be well framed. This aspect was discussed for other species as a factor that compromises the accuracy of the prediction models [14,24]. In these works, several solutions are pointed out to overcome the problem of probe length, such as the superposition of images using reference points in the images or the use of lengthier probes but generally of lower frequency, which compromises the ability to analyze the most superficial tissues. The best single-variable regression model developed by Bosworth et al. [23] for shank fillet in females showed considerably less accuracy (R2 = 0.50) than the present best single RTU slice area model. This can be related to the smaller number of ultrasound slice locations tested by Bosworth et al. [23]. As could be expected from the single regression analysis, Bosworth et al. [23] best three-variable regression model also showed smaller accuracy (R2 = 0.56) than the present best RTU slice areas stepwise model. In both cases, there were three independent variables, but the slice locations selected were more evenly distributed across the fish body in Bosworth et al. [23] study, reflecting the more regular fusiform shape of catfish.
The higher accuracy and precision of single RTU partial volumes as predictors of fillet volume, when compared with RTU slice areas, can be partially explained by the larger amount of the RTU information used (two RTU slice areas for each RTU partial volume). However, the use of the distance between each pair of RTU slice areas per single RTU partial volume, which is related to the length of the fillet, also contributed to this result.
Gonçalves et al. [17] had already obtained very good estimates of fillet volume of Tilapia, (R2 = 0.89) but inferior to the best ones now obtained for Senegalese sole. This comparison is particularly relevant concerning the estimates now obtained with V1+()+9 or with V1–5 + V6–9, since in these two cases, as in Gonçalves et al.’s [17] study, the RTU measurements used covered the entire length of the fish fillet. The difference observed in the amount of variation explained can be due to differences in the shape of the fish body (and, consequently, in the shape of the fish fillet) or to a slight difference in the estimation of total RTU fillet volume, since Gonçalves et al. [17] simply multiplied each RTU area by the mean distance between slices to obtain each partial RTU volume, while in the present study, each partial RTU volume was obtained multiplying the average of the two consecutive RTU areas by the distance between them. All the final models obtained by stepwise multiple regression were very good or even excellent predictors of fillet volume. For application in commercial conditions, the model just with V1–5, being an excellent predictor of fillet volume, seems to be quite practical. However, such an approach, relying on a prediction equation, requires a relatively homogeneous population in terms of body characteristics, such as body shape, for the model to apply. This means that the use of RTU methodology for use in research studies of genetic variation is limited at the start. This is even more regrettable, given the potential of a technology that allows in vivo collection of data. The present results seem to allow a different approach, without the need for predictive regression models, considering that V1–5 + V6–9, and V1+()+9, correspond practically to direct estimates of the actual fillet volume, in the case of V1+()+9, with a correlation of 98% with the fillet volume. The use of volume measurements (3D) in prediction models of carcass and body composition has been valued with different techniques in meat species [25,26,27] and fish [6]. In the latter study, a 3D model of common carp was developed to determine the best morphological predictors of slaughter yields. The accuracy for predicting yields with 3D is superior to or equal to those obtained by 2D predictors, but the practical advantages in obtaining information in the field are pointed out. Nevertheless, and in general, the works that use 3D measurements indicate an advantage over one-or two-dimensional measurements in the prediction models, and it is anticipated that with equipment and software advances, it will be possible to speed up all processes to obtain accurate models based on 3D images to predict in vivo composition traits [28].
The results of the current study are consistent with the findings of several studies that showed ultrasound measurements provide a poor prediction of fillet yield. For example, Flick et al. [29] pointed out fillet yield as an important trait for genetic improvement of fish production efficiency and Sang et al. [30] best model explained 77% of the variation observed in fillet yield for river catfish, with the fish volume adjusted for body weight accounting, just by itself, for 74%. However, Vandeputte et al. [20], using a linear combination of proportions of surfaces and ratios of ultrasound measurements to body length to estimate the same trait in European sea bass, showed poor accuracy (0.02 ≤ R2 ≤ 0.18) of fillet yield estimates. So did Maas et al. [9] used linear and CT measurements to estimate fillet yield of mirror carp not gutted before the CT was done (0.08 ≤ R2 ≤ 0.45). These poor accuracies are in line with the present results and relate to the fact that most of the variation observed in fillet weight is explained by the variation observed in fish weight. Vandeputte et al. [31] had already pointed out fillet yield being mostly proportional to body weight as one of the main problems in selecting for increased fillet yield. Rutten et al. [32], for instance (whose best model, using length, height, width and corrected length, only explained 15% of the variation observed in fillet yield), showed a correlation of 97% between body weight and fillet weight in Nile tilapia, resulting in a much smaller CV for fillet yield than for fillet weight or volume. As in the present study, Rutten et al. [32], Vandeputte et al. [20] and Maas et al. [9] obtained a much higher CV value for fillet weight (33.3%, 32.8% and 37.1%, respectively) than for fillet yield (7.6%, 2.8% and 5.7%, respectively). Compared to these values, Sang et al. [30] showed a similar CV value for fillet weight (CV = 35.6) and a much higher CV value for fillet yield (CV = 19.7). This much higher CV value for fillet yield shown by Sang et al. [30] may explain why the best model explained a much larger amount of the variation observed in fillet yield, but the reason for such a difference in that CV value, species related or not, remains to be clarified.
5. Conclusions
The present study showed that RTU slice areas and RTU partial fillet volumes (single or in different combinations) can be good predictors of Senegalese sole’s total fillet volume and can be used in either single or multitrait regression models. Models based on RTU partial fillet volumes can provide particularly accurate estimates of total fillet volume, either used in regression models or as direct predictors. In the latter case, this makes it possible not only to monitor changes in fillet volume, regardless of eventual changes in body/fillet proportions throughout the growing process of the fish, but also to exploit these eventual changes to achieve genetic progress. In addition, it opens the possibility to apply the same methodology to live animals of different species, breeds or genetic lines, for instance, without the need to develop specific regression models for each one. Concerning fillet yield, the poor results now obtained seem to confirm the results of previous studies showing a close relation between fillet volume/weight and body volume/weight, and further studies are necessary to better understand the potential of RTU for estimating fillet yield in fish in general and Senegalese sole in particular. Still, depending on the heritability values and genetic correlations between fillet volume and fillet yield, the former may prove to be a useful predictor trait for fillet yield, but this clearly needs further research.
Author Contributions
J.A.: Conceptualization, Methodology, Formal analysis, Writing—original draft. C.G.: Writing—review & editing, Project administration. A.T.: Writing—review & editing. P.R.: Writing—review & editing. S.S.: Conceptualization, Methodology, Data curation, Writing—review & editing. All authors have read and agreed to the published version of the manuscript.
Funding
This work was supported by the projects UIDB/CVT/00772/2020 and LA/P/0059/2020 funded by the Portuguese Foundation for Science and Technology (FCT).
Institutional Review Board Statement
All animal handling processes performed in this project are within the scope of the National (Decree-Law 113/2013) and European (European Directive 2010/63/EU) legislation, and the submitted work is part of the project FEEDNETICS 4.0 with ethical approval under reference 1639-e-DZ-2021.
Informed Consent Statement
Not applicable, as this research did not involve humans.
Data Availability Statement
Not applicable, as this study did not report any data.
Acknowledgments
The author AT is grateful to the Foundation for Science and Technology (FCT, Portugal) for financial support through national funds FCT/MCTES (PIDDAC) to CIMO (UIDB/00690/2020 and UIDP/00690/2020) and SusTEC (LA/P/0007/2020). The authors thank Francisco Silva for image support.
Conflicts of Interest
The authors declare no conflict of interest.
References
- Guillen, J.; Asche, F.; Carvalho, N.; Polanco, J.M.F.; Llorente, I.; Nielsen, R.; Nielsen, M.; Villasante, S. Aquaculture subsidies in the European Union: Evolution, impact and future potential for growth. Mar. Policy 2019, 104, 19–28. [Google Scholar] [CrossRef]
- Imsland, A.K.; Foss, A.; Conceição, L.E.C.; Dinis, M.T.; Delbare, D.; Schram, E.; Kamstra, A.; Rema, P.; White, P. A review of the culture potential of Solea solea and S. senegalensis. Rev. Fish Biol. Fish. 2003, 13, 379–408. [Google Scholar] [CrossRef]
- Veliyulin, E.; van der Zwaag, C.; Burk, W.; Erikson, U. In vivo determination of fat content in Atlantic salmon (Salmo salar) with a mobile NMR spectrometer. J. Sci. Food Agric. 2005, 85, 1299–1304. [Google Scholar] [CrossRef]
- Prchal, M.; Bugeon, J.; Vandeputte, M.; Kause, A.; Vergnet, A.; Zhao, J.; Gela, D.; Genestout, L.; Bestin, A.; Haffray, P.; et al. Potential for Genetic Improvement of the Main Slaughter Yields in Common Carp with in vivo Morphological Predictors. Front. Genet. 2018, 9, 283. [Google Scholar] [CrossRef]
- Haffray, P.; Bugeon, J.; Rivard, Q.; Quittet, B.; Puyo, S.; Allamelou, J.M.; Vandeputte, M.; Dupont-Nivet, M. Genetic parameters of in-vivo prediction of carcass, head and fillet yields by internal ultrasound and 2D external imagery in large rainbow trout (Oncorhynchus mykiss). Aquaculture 2013, 410–411, 236–244. [Google Scholar] [CrossRef]
- Prchal, M.; Kocour, M.; Vandeputte, M.; Kause, A.; Vergnet, A.; Zhao, J.; Gela, D.; Kašpar, V.; Genestout, L.; Bestin, A.; et al. Morphological predictors of slaughter yields using 3D digitizer and their use in a common carp breeding program. Aquaculture 2020, 520, 734993. [Google Scholar] [CrossRef]
- Hancz, C.; Romvári, R.; Szabó, A.; Molnár, T.; Magyary, I.; Horn, P. Measurement of total body composition changes of common carp by computer tomography. Aquac. Res. 2003, 34, 991–997. [Google Scholar] [CrossRef]
- Kolstad, K.; Vegusdal, A.; Baeverfjord, G.; Einen, O. Quantification of fat deposits and fat distribution in Atlantic halibut (Hippoglossus hippoglossus L.) using computerised X-ray tomography (CT). Aquaculture 2004, 229, 255–264. [Google Scholar] [CrossRef]
- Maas, P.; Grzegrzółka, B.; Kreß, P.; Oberle, M.; Judas, M.; Kremer-Rücker, P.V. Prediction of body composition in mirror carp (Cyprinus carpio) by using linear measurements in vivo and computed tomography post-mortem. Arch. Anim. Breed. 2020, 63, 69–80. [Google Scholar] [CrossRef]
- Wu, J.-L.; Zhang, J.-L.; Du, X.-X.; Shen, Y.-J.; Lao, X.; Zhang, M.-L.; Chen, L.-Q.; Du, Z.-Y. Evaluation of the distribution of adipose tissues in fish using magnetic resonance imaging (MRI). Aquaculture 2015, 448, 112–122. [Google Scholar] [CrossRef]
- Scholz, A.; Bünger, L.; Kongsro, J.; Baulain, U.; Mitchell, A. Non-invasive methods for the determination of body and carcass composition in livestock: Dual-energy X-ray absorptiometry, computed tomography, magnetic resonance imaging and ultrasound: Invited review. Animal 2015, 9, 1250–1264. [Google Scholar] [CrossRef]
- Silva, S.; Guedes, C.; Rodrigues, S.; Teixeira, A. Non-Destructive Imaging and Spectroscopic Techniques for Assessment of Carcass and Meat Quality in Sheep and Goats: A Review. Foods 2020, 9, 1074. [Google Scholar] [CrossRef]
- Sanchez, P.D.C.; Arogancia, H.B.T.; Boyles, K.M.; Pontillo, A.J.B.; Ali, M.M. Emerging nondestructive techniques for the quality and safety evaluation of pork and beef: Recent advances, challenges, and future perspectives. Appl. Food Res. 2022, 2, 100147. [Google Scholar] [CrossRef]
- Silva, S.R.; Cadavez, V.P. Real-time ultrasound (RTU) imaging methods for quality control of meats. In Computer Vision Technology in the Food and Beverage Industries; Sun, D.-W., Ed.; Woodhead Publishing Series in Food Science, Technology and Nutrition; Woodhead Publishing Limited: Sawston, UK, 2012. [Google Scholar]
- Perazza, C.A.; Pinaffi, F.L.V.; Silva, L.A.; Hilsdorf, A.W.S. Evaluation of ultrasound imaging to predict loin eye area in tambaqui. Bol. Inst. Pesca 2015, 41, 803–809. [Google Scholar] [CrossRef]
- Silva, S.R.; Guedes, C.M.; Rema, P.; Batista, A.C.; Rodrigues, V.; Loureiro, N.; Dias, J. In vivo assessment of fat composition in Senegalese sole (Solea senegalensis) by real-time ultrasonography and image analysis of subcutaneous fat. Aquaculture 2016, 456, 76–82. [Google Scholar] [CrossRef]
- Gonçalves, C.; Rema, P.; Guedes, C.; Basto, S.; Silva, S.R. Using real-time ultrasound to predict fillet volume of tilapia (Oreochromis niloticus, Linnaeus). Rev. Port. Zootec. 2018, 13, 188–194. [Google Scholar]
- Maas, P.; Grzegrzółka, B.; Kreß, P.; Oberle, M.; Kremer-Rücker, P.V. In vivo–determination of the fat content in mirror carps (Cyprinus carpio) using ultrasound, microwave and linear measurements. Aquaculture 2019, 512, 734359. [Google Scholar] [CrossRef]
- Prchal, M.; Zhao, J.; Gela, D.; Kašpar, J.; Lepič, P.; Kašpar, V.; Kocour, M. Simplified method for genetic slaughter yields improvement in common carp under European pond conditions. Aquac. Rep. 2021, 21, 100832. [Google Scholar] [CrossRef]
- Vandeputte, M.; Puledda, A.; Tyran, A.S.; Bestin, A.; Coulombet, C.; Bajek, A.; Baldit, G.; Vergnet, A.; Allal, F.; Bugeon, J.; et al. Investigation of morphological predictors of fillet and carcass yield in European sea bass (Dicentrarchus labrax) for application in selective breeding. Aquaculture 2017, 470, 40–49. [Google Scholar] [CrossRef]
- Rasband, W.S. ImageJ; U.S. National Institutes of Health: Bethesda, MD, USA, 2018. Available online: https://imagej.nih.gov/ij/ (accessed on 20 August 2022).
- Katz, V. A History of Mathematics: An Introduction, 2nd ed.; Addison-Wesley: Boston, MA, USA, 1998; p. 477. [Google Scholar]
- Bosworth, B.G.; Holland, M.; Brazil, B.L. Evaluation of ultrasound imagery and body shape to predict carcass and fillet yield in farm-raised catfish. J. Anim. Sci. 2001, 79, 1483–1490. [Google Scholar] [CrossRef]
- Silva, S. Use of ultrasonographic examination for in vivo evaluation of body composition and for prediction of carcass quality of sheep. Small Rumin. Res. 2017, 152, 144–157. [Google Scholar] [CrossRef]
- Alempijevic, A.; Vidal-Calleja, T.; Falque, R.; Quin, P.; Toohey, E.; Walmsley, B.; McPhee, M. Lean meat yield estimation using a prototype 3D imaging approach. Meat Sci. 2021, 181, 108470. [Google Scholar] [CrossRef] [PubMed]
- Matthews, D.; Pabiou, T.; Evans, R.D.; Beder, C.; Daly, A. Predicting carcass cut yields in cattle from digital images using artificial intelligence. Meat Sci. 2022, 184, 108671. [Google Scholar] [CrossRef] [PubMed]
- Silva, S.R.; Almeida, M.; Condotta, I.; Arantes, A.; Guedes, C.; Santos, V. Assessing the Feasibility of Using Kinect 3D Images to Predict Light Lamb Carcasses Composition from Leg Volume. Animals 2021, 11, 3595. [Google Scholar] [CrossRef]
- Bünger, L.; Clelland, N.; Moore, K.; McLean, K.; Kongsro, J.; Lambe, N. Integrating Computed tomography (CT) into commercial sheep breeding in the UK: Cost and value. In Proceedings of the Farm Animal Imaging III, Copenhagen, Denmark, 1 September 2014; Maltin, C., Craigie, C., Bünger, J., Eds.; FAIM: Copenhagen, Denmark, 2014; pp. 22–27. [Google Scholar]
- Flick, G.J.; Barua, M.A.; Enriquez, L.G. Processing finfish. In The Seafood Industry; Martin, R.E., Flick, G.J., Eds.; Van Nostrand Reinhold: New York, NY, USA, 1990; pp. 117–164. [Google Scholar]
- Sang, N.V.; Thomassen, M.; Klemetsdal, G.; Gjøen, H.M. Prediction of fillet weight, fillet yield, and fillet fat for live river catfish (Pangasianodon hypophthalmus). Aquaculture 2009, 288, 166–171. [Google Scholar] [CrossRef]
- Vandeputte, M.; Bugeon, J.; Bestin, A.; Desgranges, A.; Allamellou, J.-M.; Tyran, A.-S.; Allal, F.; Dupont-Nivet, M.; Haffray, P. First Evidence of Realized Selection Response on Fillet Yield in Rainbow Trout Oncorhynchus mykiss, Using Sib Selection or Based on Correlated Ultrasound Measurements. Front. Genet. 2019, 10, 1225. [Google Scholar] [CrossRef]
- Rutten, M.J.; Bovenhuis, H.; Komen, H. Modeling fillet traits based on body measurements in three Nile tilapia strains (Oreochromis niloticus L.). Aquaculture 2004, 231, 113–122. [Google Scholar] [CrossRef]
Publisher’s Note: MDPI stays neutral with regard to jurisdictional claims in published maps and institutional affiliations. |
© 2022 by the authors. Licensee MDPI, Basel, Switzerland. This article is an open access article distributed under the terms and conditions of the Creative Commons Attribution (CC BY) license (https://creativecommons.org/licenses/by/4.0/).