Simple Summary
Characterization of the complete mitochondrial genome can provide information regarding important genomic features, such as genome size and the relative location of genes, and is widely used in studies on genetic diversity and phylogeny of animals. The displacement loop region (D-loop) of mitochondrial DNA (mtDNA) is considered to be a beneficial molecular marker for genetic distance determination and differentiation analysis. This study presents the mtDNA diversity and genetic characterization of Pingpu Yellow chicken (PYC) breeds, including insights into their genetic background. The median-joining (MJ) network showed that the haplotypes were clustered into all three haplogroups (A, B, and C), indicating that PYC may have three maternal origins. The phylogenetic tree constructed with the neighbor joining (NJ) method based on the full mitogenomes showed that the 21 chicken breeds could be separated into two groups.
Abstract
In this study, the complete mitochondrial genome sequence of one female Pingpu Yellow chicken (PYC) and the D-loop sequences obtained from 60 chickens were analyzed to investigate their genetic diversity and phylogeny. The total length of the PYC mitogenome is 16,785 bp and that of the complete D-loop is 1231 to 1232 bp. The mitogenome comprises 22 transfer ribonucleic acids (tRNAs), 2 ribosomal ribonucleic acids (rRNAs), 13 protein-coding genes (PCGs), and 1 non-coding control region (D-loop). Additionally, the total length of the 13 PCGs is 11,394 bp, accounting for 67.88% of the complete mitogenome sequence, and the PCGs region has 3798 codons. A majority of the PCGs have ATG as the start codon. The haplotype and nucleotide diversity of PYC were 1.00000 ± 0.00029 and 0.32678 ± 0.29756, respectively. In the D-Loop data set, we found 25 polymorphic sites, which determined 18 haplotypes and 3 major haplogroups (A–C). Therefore, PYC has a classical vertebrate mitogenome, with comparatively high nucleotide diversity and potentially three maternal lineages. The neighbor-joining (NJ) tree analysis results showed PYC grouped with the Luhua (MT555049.1) and Nandan chickens (KP269069.1), which indicates that PYC is closely related to these two breeds.
1. Introduction
Mitochondrial DNA (mtDNA) is maternally inherited, and the highly variable D-loop region of its sequence is often used for phylogenetic and phylogeographic analyses. Several mtDNA sequences have been used in phylogenetic analyses, including 12S rRNA, 16S rRNA, CytB, and COI genes [1,2]. Analysis of the D-loop region was successfully applied in an investigation of the origins and genetic diversity of Chinese domestic chickens. mtDNA sequence polymorphisms have also been used to investigate maternal origins, domestication events [3,4,5], and genetic relationships within and among European and African chicken populations [6,7].
The domestication of chickens is traced to 2000 BC. Chickens evolved from red jungle fowl (Gallus gallus) under the influence of natural and artificial selection [8,9]. The Pingpu Yellow chicken (PYC), a medium-sized breed, is a popular local chicken of the Anhui province in China (Figure 1). Currently, researchers have utilized the full-length mtDNA D-loop sequence in population analysis of chicken [10,11,12], sheep [13,14], and cattle [15,16]. In this study, using complete and partial mtDNA sequences, we assessed the phylogenetic relationship between PYC and several related breeds. We extracted DNA from the blood of adult birds and sequenced the complete control region. Consequently, we analyzed the genetic diversity and carried out the phylogenetic characterization of PYC. Our results may provide insights into the genetic background of PYC and a basis for further research on its evolution.

Figure 1.
The geographical location of the Pingpu Yellow chicken.
2. Materials and Methods
2.1. Ethics Statement
Chickens were acquired from Wuhu Zhongs Poultry Conservation and Breeding, Co. Ltd., Anhui, China. All protocols involving the chickens were approved by the Animal Care and Use Committee of Anhui Agricultural University (approval number: SYXK 2016-007).
2.2. Specimen Collection and DNA Extraction
We randomly selected PYCs with complete pedigree information. Blood samples from 60 adult chickens (30 males and 30 females) were obtained from the farm, the total genomic DNA was isolated using a DNA extraction kit (Tiangen, Beijing, China), and stored at −20 °C. DNA integrity was assessed using 1.5% agarose gel electrophoresis. One female PYC was randomly selected to study the complete mitochondrial genome by next-generation sequencing, and a total of 60 samples were used to determine the D-loop sequences.
2.3. PCR Amplification and DNA Sequencing of D-Loop
Using the full mitochondrial genomic data of Gallus gallus (NCBI, GenBank: GU261704.1), the length of the D-loop was determined to be 1 231 bp. Oligo7 software [17] was used to design the primers (F: 5′-CAAACTCACTAACCACCCA-3′, R: 5′-GCCTGATACCTGCTCC-3′) for the D-loop, and these were synthesized by Nanjing Kinco Biotechnology (Nanjing, China). PCR was performed using a 25 μL reaction mixture containing 9.5 μL ddH2O, 12.5 μL 2Taq PCR Master Mix, 1 μL (50–100 ng) template DNA, and 1 μL of each primer. The cycling conditions were 94 °C for 5 min followed by 1 cycle of 94 °C for 30 s, 60 °C for 30 s, 72 °C for 60 s, and a final extension step of 10 min at 72 °C. The specificity of the primers was assessed by performing a 1.5% agarose gel electrophoresis of the PCR products. A pair of primers was selected as the D-loop amplification primers in the present study.
2.4. Next-Generation Sequencing of the Mitogenome
The DNA was fragmented using ultrasound, and the fragmented DNA was purified and selected by 1.5% agarose gel electrophoresis. PCR amplification was performed to create a sequencing library, which was then subjected to library quality control. Then, the qualified library was sequenced on an Illumina NovaSeq 6000 platform, with paired-end read lengths of 150 bp.
2.5. Data Analysis
After data filtering, the whole mitogenome sequence was edited and aligned with the reference genome (GU261704.1) by Spades software (Version: 3.13.0; parameter: -K 127). The splicing results were compared by BLASTN (Version: BLAST 2.2.30+; parameters: -evalue 1 × 10⁻⁵), and the candidate sequence assembly results were determined based on the alignment. We used MITOS2 (http://mitos2.bioinf.uni-leipzig.de/index.py, accessed on 16 August 2021) for gene annotation. The circular mitogenome map was depicted using OGDRAW [18]. The nucleotide composition and relative synonymous codon usages (RSCU) of PCGs of PYC were calculated using MEGA v7 [19]. The strand asymmetries were computed using a formula, AT-skew = (A − T)/(A + T) and GC-skew = (G − C)/(G + C) [20]. The secondary structure of tRNAs was inferred by the tRNAscan-SE v2.0 [21]. We downloaded 20 chicken breed reference sequences from NCBI (GenBank: KP681581.1 Guangxi three-buff, KM433666.1 Cenxi three-buff, MH732978.1 Lindian, KX987152.1 Zhengyang yellow, MK163565.1 Chahua, KY054997.1 Lueyang yellow, KJ778617.1 Taihe, KF981434.1 Taoyuan, GU261719.1 Chigulu, GU261678.1 Gushi, GU261676.1 Wuding, GU261713.1 Jiangbian, KX781318.1 Zhuxiang, KF954727.1 Huang Lang, KP244335.1 Hengshan yellow, KF826490.1 Xuefeng black boned, MK163562.1 Tibetan, GU261677.1 Xianju, MT555049.1 Luhua, and KP269069.1 Nandan chickens). Molecular phylogenetic analyses and visualization of the neighbor-joining (NJ) tree were conducted using MEGA v7 software [19,22]. The evolutionary distances were computed by the Kimura 2-parameter (K2P) model [23], and corresponded to the number of base substitutions per site.
D-loop sequences were assembled and aligned using Contig Express in Vector NTI Advance 11 sequence analysis software (Invitrogen, Waltham, MA, USA) [24] against the reference sequence of G. gallus mtDNA (GU261704.1) using CLUSTAL software [25]. DNAsp v6 software [26] was used to analyze the number of PYC D-loop haplotypes, haplotype polymorphism sites, and nucleotide polymorphisms. Some haplotype sequences for chickens [27,28] were downloaded from NCBI (GenBank: A1, GU261684; A2, GU261695; A3, GU261700; B1, GU261704; B2, GU261705; B3, GU261714; B4, GU261699; C1, GU261681; C2, GU261718; C3, GU261716; D1, NC_007236; D2, GU261683; D3, GU261677; E1, GU261713; E2, GU261712; E3, GU261694; F, GU261711; G, GU261676; H, GU261715; X, GU261692; W, GU261706; Y, GU261693; Z1, GU261674; Z2, GU261696), and NETWORK10.2 software (Fluxus Technology Ltd., at www.fluxus-engineering.com, Cambridge, United Kingdom, accessed on 18 October 2021) was used to draw a haplotype network diagram.
3. Results
3.1. The Analysis of Complete mtDNA
The size of the PYC mitogenome is similar to that of the mitogenomes of other chicken breeds. The complete mtDNA length of PYC is 16 785 bp (GenBank accession number: MZ911748). Characterization of the mitogenome revealed thirteen PCGs, seven of which correlate with the diverse subunits of NADH (NADH1-6 and NADH4L), three with COX1-3, two with ATP synthase subunits (ATP6 and ATP8), and one with cytochrome b (CytB). The mitogenome also consists of 2 rRNA genes (rRNAL and rRNAS) and 22 tRNA genes. Eight tRNA genes, ND6, and two rRNA genes are situated on the negative strand, and the remaining 14 tRNA genes and 13 PCGs on the positive strand (Table 1).

Table 1.
Organization of the Pingpu Yellow chicken mitogenome.
According to the mtDNA genome map, the base composition was A: 30.3%, T: 23.7%, G: 13.5%, and C: 32.5%. The GC content (46.0%) is lower than the AT content (54.0%) (Figure 2).
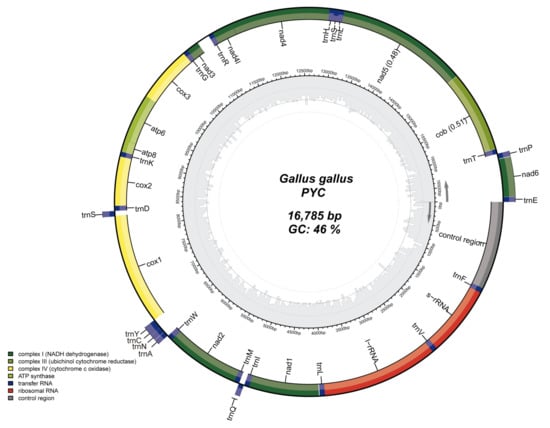
Figure 2.
Mitochondrial genome structure of the Pingpu Yellow chicken. Genes in the inner circle plot are located on the N-strand, and the rest of the genes are located on the J-strand. Dark green, light green, and yellow represent PCGs coding complex I, III, and IV, respectively. ATP synthase, rRNA, tRNA genes, and the control region are colored with olive green, red, dark blue, and gray, respectively.
3.2. Codon Usage and PCGs
The length of 13 PCGs in PYC is 11,394 bp, accounting for 67.88% of the whole mitogenome sequence. The 13 PCGs ranged in length from 165 bp (ATP8) to 1 818 bp (ND5). The PCGs region of the PYC mitogenome consists of 3798 codons. Most of the PCGs have ATG as a start codon, except for that of COX1, which uses GTG as the start codon. The longest coding sequence (CDS) is ND5 (1818 bp), which is located between ND4 and CYTB. The shortest was ATP8 (165 bp), which is located between COX2 and ATP6. The standard stop codon TAA occurs in ND1, COX2, ATP6, ATP8, ND3, ND4L, ND5, CYTB, and ND6; COX1 and ND4 use AGG and TGA as the stop codon (Table 2 and Figure 3).
Table 2.
Nucleotide composition in different regions of the mitochondrial genome of the Pingpu Yellow chicken.
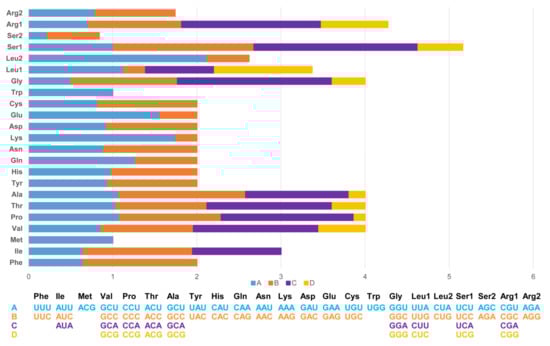
Figure 3.
Relative synonymous codon usage (RSCU) in the Pingpu Yellow chicken mitochondrial genome.
The codon usage in PCGs is biased toward amino acids encoded by A-rich codons (two or more A’s per triplet). The most frequently used codons are all A-rich, with the most common codons being TAA (34.62%) and AGA (3.84%). In contrast, the frequency of G-rich codons (two or more G’s in a triplet) was 11.54%.
3.3. Transfer and Ribosomal RNA Genes of PYC
Most of the tRNAs could be folded into the canonical cloverleaf secondary structure, except for tRNA-Ser (GCT), which lacks the DHU arm (Figure 4). Regarding the genetic diversity and population structure, we found that the nucleotide diversity (Pi) was 0.00600 ± 0.00451, and haplotype diversity (Hd) was 0.93600 ± 0.00020. The tRNAs ranged in size from 66 bp (trnC) to 76 bp (trnW).
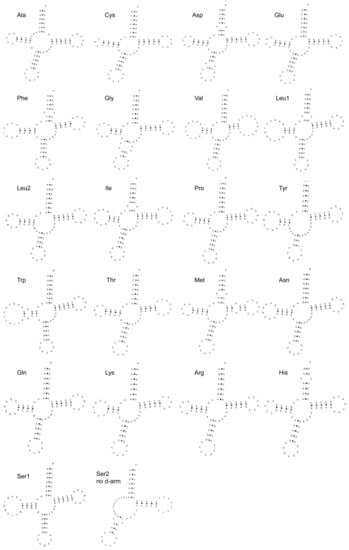
Figure 4.
The inferred secondary structure of 22 tRNA genes from the Pingpu Yellow chicken.
The whole length of two rRNAs was 2600 bp. The AT content occupied 60.1%, AT-skew was positive (0.2360), and GC-skew was negative (−0.2189).
3.4. Structural Features and Sequence Composition of the Full-Length mtDNA D-Loop
The whole mtDNA D-loop succession was in the range of 1231 and 1232 bp. Most (66.33%) of the sequences were from the 1231 bp haplotype. The base composition is 30.3% A, 23.7% T, 13.5% G, and 32.5% C. The GC content (46.0%) is lower than the AT content (54.0%). A total of 25 polymorphic sites and 18 haplotypes were identified and named sequentially from PYC1 to PYC18 (GenBank accession numbers: MZ971232 to MZ971249). Among the haplotypes, three groups could be distinguished (Table 3).
Table 3.
Haplotypes and polymorphic sites of the mtDNA D-loop sequence of the Pingpu Yellow chicken.
The first group (haplogroup A) consisted of twelve haplotypes (PYC1, PYC2, PYC3, PYC4, PYC5, PYC7, PYC10, PYC11, PYC12, PYC13, PYC16, and PYC17); the second group (haplogroup B) consisted of three haplotypes (PYC6, PYC8, and PYC9); and the third group (haplogroup C) consisted of three haplotypes (PYC14, PYC15, and PYC18) (Figure 5). Transitions and substitution mutations were the cause of all polymorphic locations. We used NETWORK 10.2 software (Fluxus Technology Ltd., Cambridge, UK, at www.fluxus-engineering.com, accessed on 18 October 2021) to compare the 18 haplotypes of PYC with haplogroups A, B, and C [27,28] and found that the haplotypes were clustered into all three haplogroups (A, B, and C), although mostly in haplogroup A, indicating that PYC may have three maternal origins.
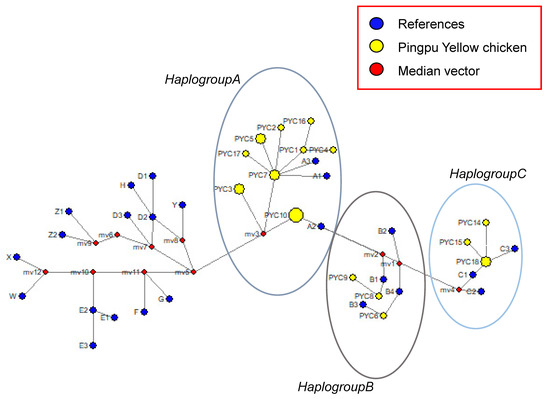
Figure 5.
Median-joining network of chicken mtDNA D-loop haplotypes.
The circular areas correspond to the haplotype frequency. Yellow circles are haplotypes determined in this study. Blue circles are 24 haplotypes which were found previously.
3.5. Phylogenetic Reconstructions Based on Complete mtDNA
The phylogenetic tree compared PYC with 20 reference breeds. PYC was found to be in a cluster with the Luhua (MT555049.1) and Nandan (KP269069.1) chickens, based on the results of the neighbor-joining tree analysis, which indicates that PYC is closely related to these two breeds (Figure 6).
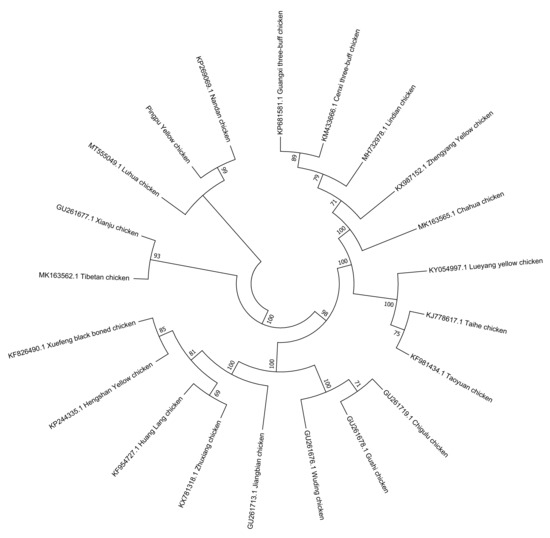
Figure 6.
Evolutionary relationships of the Pingpu Yellow chicken and other chicken breeds.
4. Discussion
There is little recombination in the mitochondrial genome, which is only passed down from mother to child [29]; however, nucleotide substitution rates of the mitochondrial genome are five to ten times higher than those of the single-copy genes in the nucleus [30]. The vast majority of mtDNA mutations have very few insertions or deletions. Additionally, owing to the various rates of mitochondrial gene evolution, various genes in the mitochondrial genome can be utilized in different phylogenetic and population genetic studies [31]. Furthermore, mitochondrial genes are easier to identify because of their close association. Over the past four decades, mitochondrial genes have been widely used as phylogenetic molecular markers. In studies dealing with conservation genetics, a plethora of genetic markers serve as useful tools. However, the variety of markers that can be used is limited by the difficulty of obtaining high-quality DNA from PYC populations present in the wild. Therefore, to investigate the PYC genetic variation, we used mtDNA control region (CR) sequences. Our results suggest that the CR sequence in PYC has the same structure as that of other vertebrates [32,33].
The length of the PYC mtDNA was the same as that reported by Gu and Li [34] and Miao et al. [28]. Thus, this study provides baseline genetic information for PYC and used mitochondrial markers to determine maternal origin. mtDNA analysis revealed three major matrilineal origins: clades A, B, and C. These findings demonstrate a genetic association between PYC and the Luhua (MT555049.1) and Nandan (KP269069.1) chicken breeds; thus, indicating that PYC is closely related to them.
5. Conclusions
The sequencing and annotation of the mitogenome of G. gallus and its comparison with the mitogenomes of other chicken breeds showed that the mitogenome characteristics of G. gallus are mostly consistent with those of the other chicken mitogenomes that have been reported. PYC genetic diversity, population structure, and phylogeny can be assessed by analyzing the full-length D-loop sequence of its mtDNA. The findings of this study will have useful application for the breeding and conservation of PYC.
Author Contributions
Conceptualization and writing—review and editing, S.J. and Z.G.; writing—original draft preparation, J.X. and S.J.; data analysis, F.J., L.J., X.W., X.L. (Xuling Liu) and X.L. (Xing Liu); writing—review and editing, S.J., J.X. and Z.G. All authors have read and agreed to the published version of the manuscript.
Funding
The current study was funded by Anhui Poultry-Industry Technology Research System (AHCYJSTX-06); Program for Young Outstanding Scientists of University(gxyqZD2022017); Municipal Science and Technology Cooperation Project (KJ2021564); Municipal Science and Technology Cooperation Project (KJ20200323); The Science and Technology Major Project of Anhui Province(201903a06020018).
Institutional Review Board Statement
All experimental protocols and samples collection were performed in accordance with the regulations for the Administration of Affairs Concerning Experimental Animals of the State Council of the People’s Republic of China and the Institutional Ani-mal Care and were approved by the Institutional Animal Care and Use Committee of the College of Animal Science and Technology (approval number: SYXK 2016-007), Anhui Agricultural University, Hefei, China.
Informed Consent Statement
Not applicable.
Data Availability Statement
The genome sequence data reported in the article have been deposited in NCBI database (https://www.ncbi.nlm.nih.gov/, accessed on 27 October 2021), which were openly available under the accession number MZ911748.
Acknowledgments
The authors thank Wuhu Zhongs Poultry Conservation and Breeding Co. Ltd., China for providing assistance during the sample collection. We are also acknowledged all farmers for allowing us to obtain the blood of chickens for free. Sincerely thanks to our lab team for assisting in the laboratory experiment.
Conflicts of Interest
The authors declare no conflict of interest.
References
- Kuznetsova, M.V.; Kholodova, M.V.; Lushchekina, A.A. Phylogenetic analysis of sequences of the 12S and 16S rRNA mitochondrial genes in the family Bovidae: New evidence. Genetika 2002, 38, 1115–1124. [Google Scholar]
- Webb, D.M.; Moore, W.S. A phylogenetic analysis of woodpeckers and their allies using 12S, Cyt b, and COI nucleotide sequences (class Aves; order Piciformes). Mol. Phylogenet. Evol. 2005, 36, 233–248. [Google Scholar] [CrossRef] [PubMed]
- Kanginakudru, S.; Metta, M.; Jakati, R.D.; Nagaraju, J. Genetic evidence from Indian red jungle fowl corroborates multiple domestication of modern day chicken. BMC Evol. Biol. 2008, 8, 174. [Google Scholar] [CrossRef] [PubMed]
- Oka, T.; Ino, Y.; Nomura, K.; Kawashima, S.; Kuwayama, T.; Hanada, H.; Amano, T.; Takada, M.; Takahata, N.; Hayashi, Y.; et al. Analysis of mtDNA sequences shows Japanese native chickens have multiple origins. Anim. Genet. 2007, 38, 287–293. [Google Scholar] [CrossRef] [PubMed]
- Silva, P.; Guan, X.; Ho-Shing, O.; Jones, J.; Xu, J.; Hui, D.; Notter, D.; Smith, E. Mitochondrial DNA-based analysis of genetic variation and relatedness among Sri Lankan indigenous chickens and the Ceylon junglefowl (Gallus lafayetti). Anim. Genet. 2009, 40, 1–9. [Google Scholar] [CrossRef] [PubMed]
- Halima, H.; Neser, F.W.; Van Marle-Koster, E.; De Kock, A. Village-based indigenous chicken production system in north-west Ethiopia. Trop. Anim. Health Prod. 2007, 39, 189–197. [Google Scholar] [CrossRef] [PubMed]
- Mwacharo, J.M.; Bjornstad, G.; Mobegi, V.; Nomura, K.; Hanada, H.; Amano, T.; Jianlin, H.; Hanotte, O. Mitochondrial DNA reveals multiple introductions of domestic chicken in East Africa. Mol. Phylogenet. Evol. 2011, 58, 374–382. [Google Scholar] [CrossRef]
- Fumihito, A.; Miyake, T.; Takada, M.; Shingu, R.; Endo, T.; Gojobori, T.; Kondo, N.; Ohno, S. Monophyletic origin and unique dispersal patterns of domestic fowls. Proc. Natl. Acad. Sci. USA 1996, 93, 6792–6795. [Google Scholar] [CrossRef]
- Vaisanen, J.; Hakansson, J.; Jensen, P. Social interactions in Red Junglefowl (Gallus gallus) and White Leghorn layers in stable groups and after re-grouping. Br. Poult. Sci. 2005, 46, 156–168. [Google Scholar] [CrossRef]
- Gao, Y.S.; Jia, X.X.; Tang, X.J.; Fan, Y.F.; Lu, J.X.; Huang, S.H.; Tang, M.J. The genetic diversity of chicken breeds from Jiangxi, assessed with BCDO2 and the complete mitochondrial DNA D-loop region. PLoS ONE 2017, 12, e0173192. [Google Scholar]
- Zhang, T.; Liu, H.; Yang, L.K.; Yin, Y.J.; Lu, H.Z.; Wang, L. The complete mitochondrial genome and molecular phylogeny of Lueyang black-bone chicken. Br. Poult. Sci. 2018, 59, 618–623. [Google Scholar] [CrossRef] [PubMed]
- Boudali, S.F.; Al-Jumaili, A.S.; Bouandas, A.; Mahammi, F.Z.; Tabet Aoul, N.; Hanotte, O.; Gaouar, S.B.S. Maternal origin and genetic diversity of Algerian domestic chicken (Gallus gallus domesticus) from North-Western Africa based on mitochondrial DNA analysis. Anim. Biotechnol. 2022, 33, 457–467. [Google Scholar] [CrossRef] [PubMed]
- Fu, D.; Ma, X.; Jia, C.; Lei, Q.; Wu, X.; Chu, M.; Ding, X.; Bao, P.; Pei, J.; Guo, X.; et al. Characterization of the complete mitochondrial genome sequence of Jialuo sheep (Ovis aries). Mitochondrial DNA B Resour. 2019, 4, 2116–2117. [Google Scholar] [CrossRef] [PubMed]
- Qiao, G.; Zhang, H.; Zhu, S.; Yuan, C.; Zhao, H.; Han, M.; Yue, Y.; Yang, B. The complete mitochondrial genome sequence and phylogenetic analysis of Alpine Merino sheep (Ovis aries). Mitochondrial DNA B Resour. 2020, 5, 990–991. [Google Scholar] [CrossRef] [PubMed]
- Pramod, R.K.; Velayutham, D.; Sajesh, P.K.; Beena, P.S.; Zachariah, A.; Zachariah, A.; Chandramohan, B.; Sujith, S.S.; Ganapathi, P.; Dhinoth Kumar, B.; et al. Complete mitogenome reveals genetic divergence and phylogenetic relationships among Indian cattle (Bos indicus) breeds. Anim. Biotechnol. 2019, 30, 219–232. [Google Scholar] [CrossRef]
- Xia, X.; Qu, K.; Zhang, G.; Jia, Y.; Ma, Z.; Zhao, X.; Huang, Y.; Chen, H.; Huang, B.; Lei, C. Comprehensive analysis of the mitochondrial DNA diversity in Chinese cattle. Anim. Genet. 2019, 50, 70–73. [Google Scholar] [CrossRef]
- Rychlik, W. OLIGO 7 primer analysis software. Methods Mol. Biol. 2007, 402, 35–60. [Google Scholar]
- Stephan, G.; Pascal, L.; Ralph, B. Organellar Genome DRAW (OGDRAW) version 1.3.1: Expanded toolkit for the graphical visualization oforganellar genomes. Nucleic Acids Res. 2019, 47, W59–W64. [Google Scholar]
- Kumar, S.; Stecher, G.; Tamura, K. MEGA7: Molecular evolutionary genetics analysis version 7.0 for bigger datasets. Mol. Biol. Evol. 2016, 33, 1870–1874. [Google Scholar] [CrossRef]
- Perna, N.T.; Kocher, T.D. Patterns of nucleotide composition at fourfold degenerate sites of animal mitochondrial genomes. J. Mol. Evol. 1995, 41, 353–358. [Google Scholar] [CrossRef]
- Chan, P.P.; Lowe, T.M. tRNAscan-SE: Searching for tRNA genes in genomic sequences. In Gene Prediction; Methods in Molecular Biology; Springer: Berlin/Heidelberg, Germany, 2019; Volume 1962, pp. 1–14. [Google Scholar]
- Saitou, N.; Nei, M. The neighbor-joining method: A new method for reconstructing phylogenetic trees. Mol. Biol. Evol. 1987, 4, 406–425. [Google Scholar] [PubMed]
- Kimura, M. A simple method for estimating evolutionary rates of base substitutions through comparative studies of nucleotide sequences. J. Mol. Evol. 1980, 16, 111–120. [Google Scholar] [CrossRef] [PubMed]
- Li, G.Q.; Moriyama, E.N. Vector NTI, a balanced all-in-one sequence analysis suite. Brief Bioinform. 2004, 5, 378–388. [Google Scholar]
- Larkin, M.A.; Blackshields, G.; Brown, N.P.; Chenna, R.; McGettigan, P.A.; McWilliam, H.; Valentin, F.; Wallace, I.M.; Wilm, A.; Lopez, R.; et al. Clustal W and Clustal X version 2.0. Bioinformatics 2007, 23, 2947–2948. [Google Scholar] [CrossRef]
- Rozas, J.; Ferrer-Mata, A.; Sanchez-DelBarrio, J.C.; Guirao-Rico, S.; Librado, P.; Ramos-Onsins, S.E.; Sanchez-Gracia, A. DnaSP 6: DNA sequence polymorphism analysis of large data sets. Mol. Biol. Evol. 2017, 34, 3299–3302. [Google Scholar] [CrossRef]
- Liu, Y.P.; Wu, G.S.; Yao, Y.G.; Miao, Y.W.; Luikart, G.; Baig, M.; Beja-Pereira, A.; Ding, Z.L.; Palanichamy, M.G.; Zhang, Y.P. Multiple maternal origins of chickens: Out of the Asian jungles. Mol. Phylogenet. Evol. 2006, 38, 12–19. [Google Scholar] [CrossRef]
- Miao, Y.W.; Peng, M.S.; Wu, G.S.; Ouyang, Y.N.; Yang, Z.Y.; Yu, N.; Liang, J.P.; Pianchou, G.; Beja-Pereira, A.; Mitra, B.; et al. Chicken domestication: An updated perspective based on mitochondrial genomes. Heredity 2013, 110, 277–282. [Google Scholar] [CrossRef]
- Lansman, R.A.; Avise, J.C.; Huettel, M.D. Critical experimental test of the possibility of “paternal leakage” of mitochondrial DNA. Proc. Natl. Acad. Sci. USA 1983, 80, 1969–1971. [Google Scholar] [CrossRef]
- Brown, W.M.; George, M., Jr.; Wilson, A.C. Rapid evolution of animal mitochondrial DNA. Proc. Natl. Acad. Sci. USA 1979, 76, 1967–1971. [Google Scholar] [CrossRef]
- Wenink, P.W.; Baker, A.J.; Tilanus, M.G. Mitochondrial control-region sequences in two shorebird species, the turnstone and the dunlin, and their utility in population genetic studies. Mol. Biol. Evol. 1994, 11, 22–31. [Google Scholar]
- Saccone, C.; Pesole, G.; Sbisa, E. The main regulatory region of mammalian mitochondrial DNA: Structure-function model and evolutionary pattern. J. Mol. Evol. 1991, 33, 83–91. [Google Scholar] [CrossRef] [PubMed]
- Southern, S.O.; Southern, P.J.; Dizon, A.E. Molecular characterization of a cloned dolphin mitochondrial genome. J. Mol. Evol. 1988, 28, 32–42. [Google Scholar] [CrossRef] [PubMed]
- Gu, J.; Li, S. The complete mitochondrial genome of the Luhua chicken (Gallus gallus). Mitochondrial DNA B Resour. 2020, 5, 2832–2834. [Google Scholar] [CrossRef]


Publisher’s Note: MDPI stays neutral with regard to jurisdictional claims in published maps and institutional affiliations. |
© 2022 by the authors. Licensee MDPI, Basel, Switzerland. This article is an open access article distributed under the terms and conditions of the Creative Commons Attribution (CC BY) license (https://creativecommons.org/licenses/by/4.0/).