1. Introduction
Lipid inclusion in the form of oil and fats in poultry feed is essential as an excellent low-cost energy source and provides a wide array of fatty acids [
1]. In addition, oil inclusion in the feed has beneficial effects in terms of the physical quality of feed, enhancing palatability, supplying extra caloric effect by improving the absorption of other dietary nutrients and supplying essential fat-soluble vitamins and increasing their absorption [
2,
3,
4]. Hence, adding lipids, especially plant-based oil, to the feed is common in poultry feeding. However, the types of oils used in poultry feed vary, depending on local production and availability of the oil in a particular country. Soybean, rapeseed and linseed oils are commonly used in poultry feed, particularly in temperate countries.
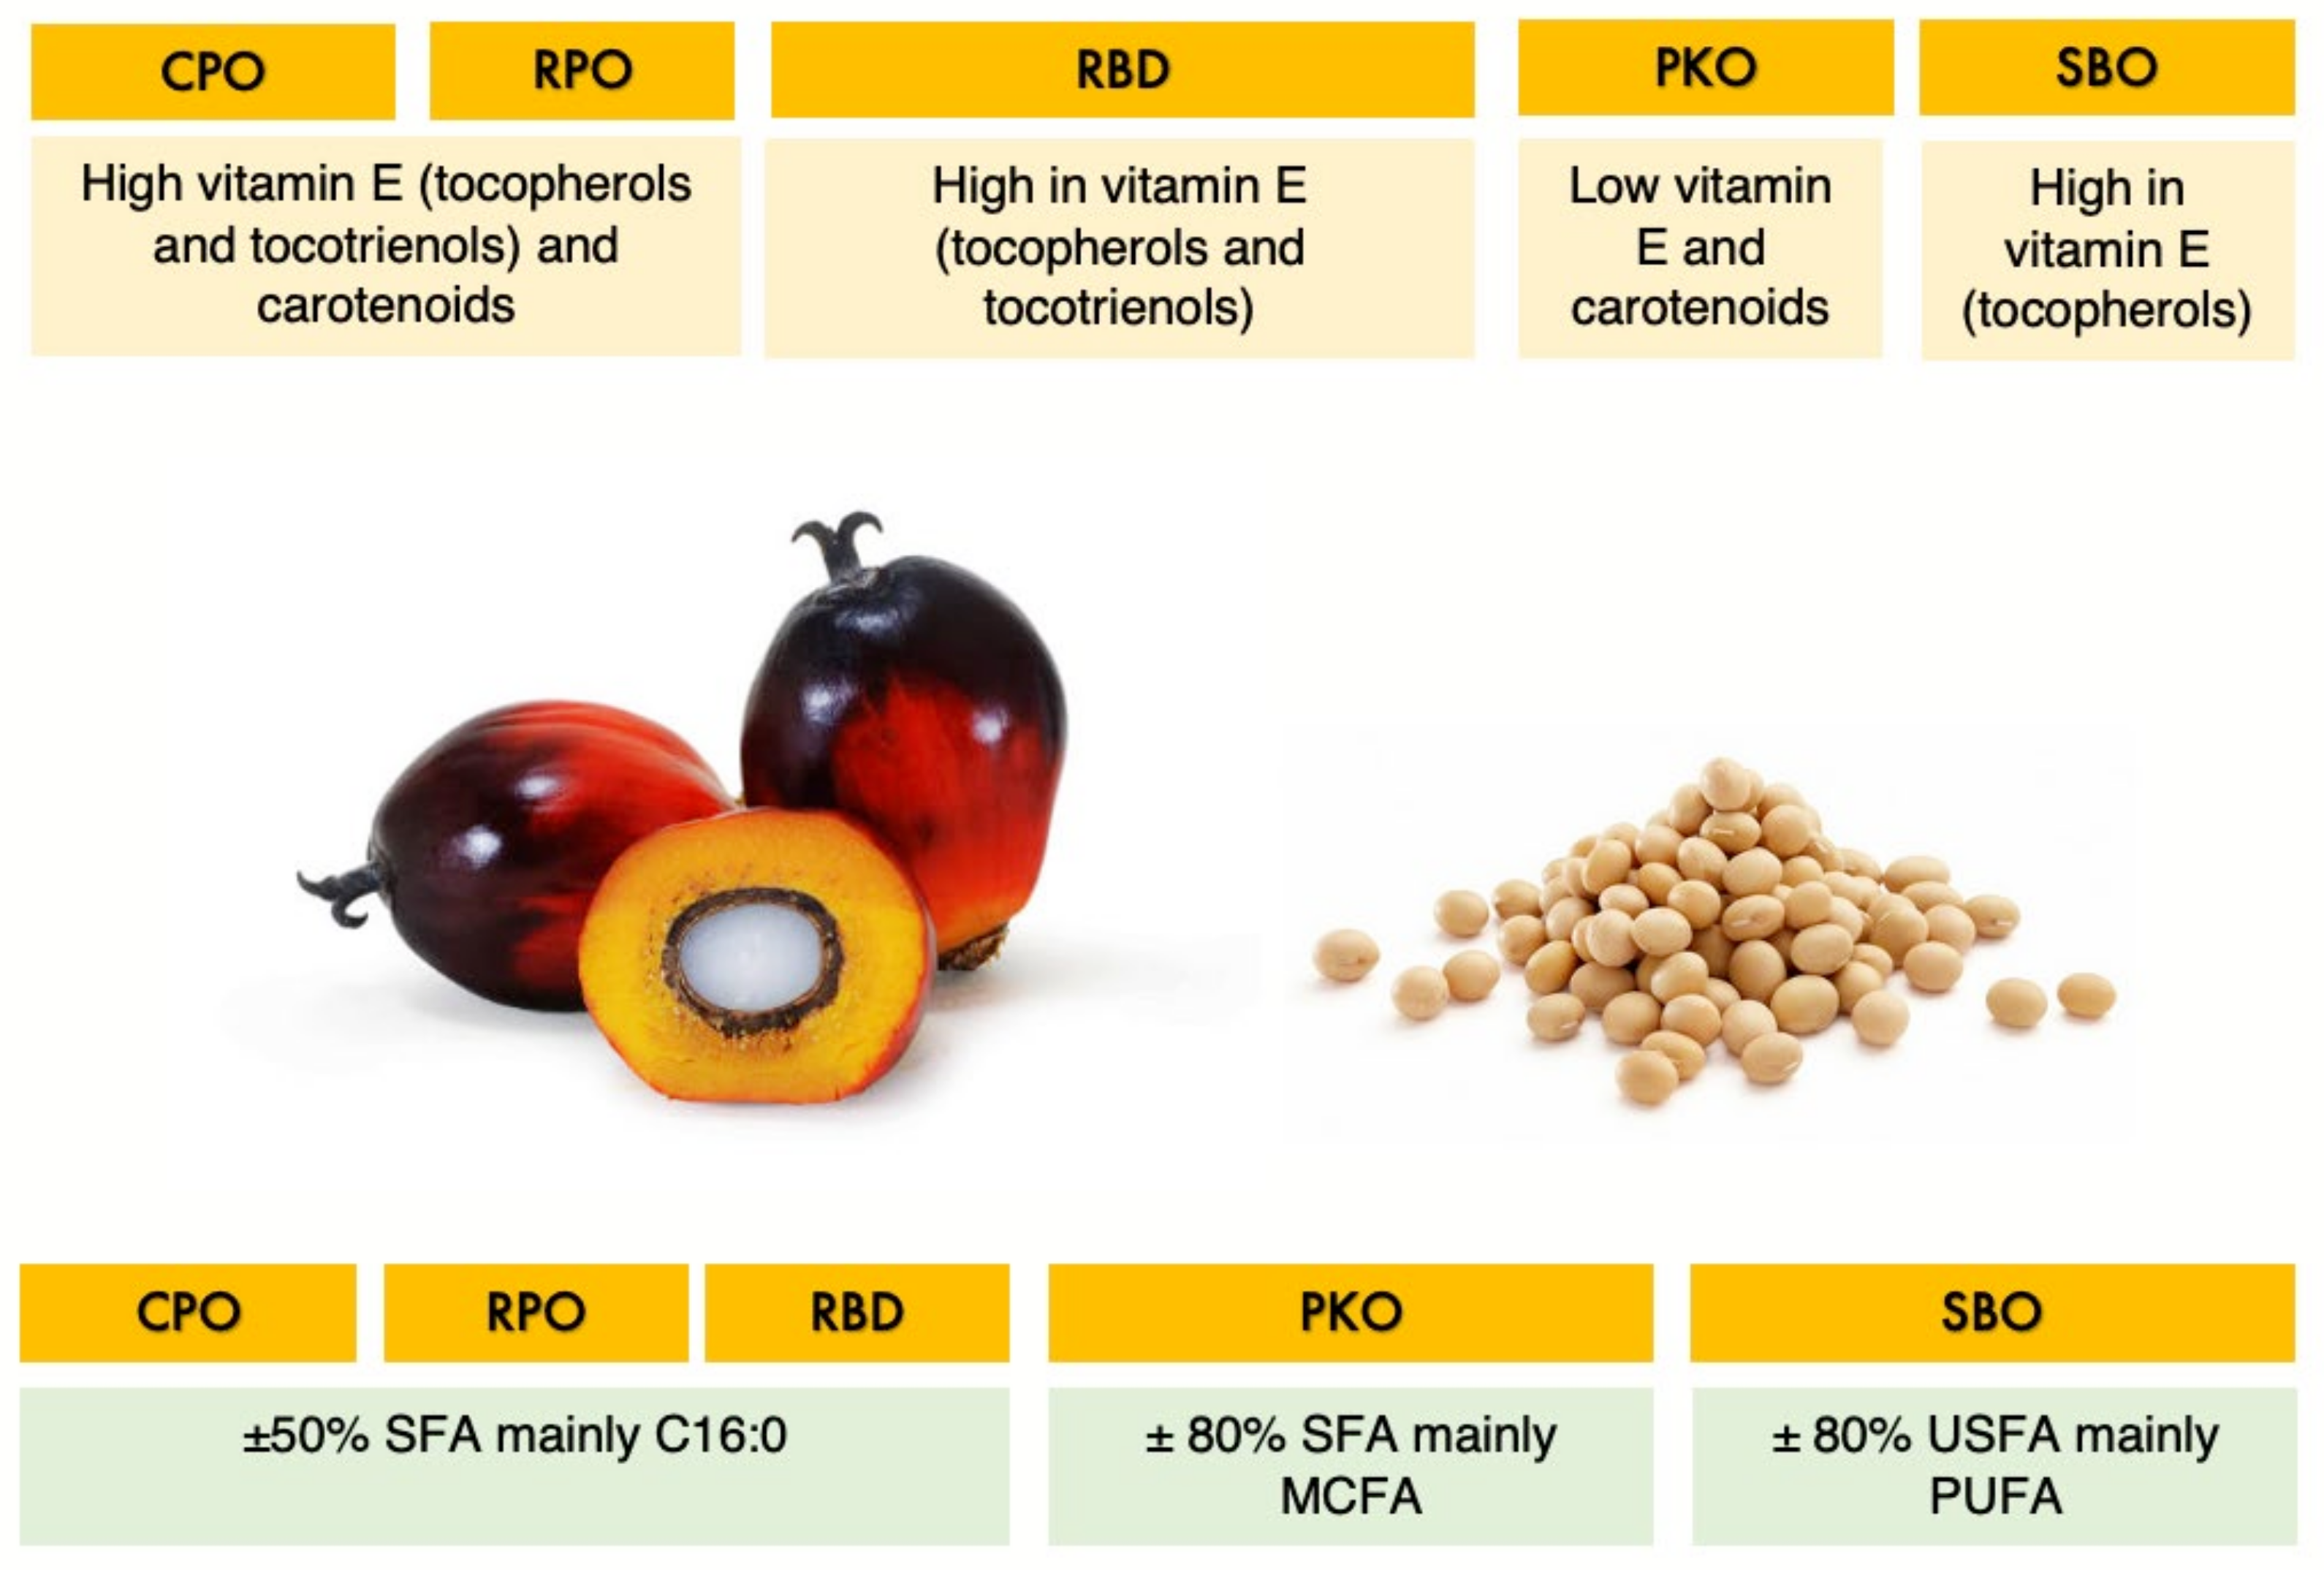
In tropical countries, palm oil is widely used as a source of energy and essential fatty acids in poultry feed. Several types of oils can be produced from the mesocarp (fiber) and the kernel of palm oil fruits. Crude palm oil (CPO) is produced from crude extraction of the mesocarp of palm fruits. Red palm oil (RPO) is a refined red–orange oil produced from the CPO’s molecular distillation process, which retains the carotenoids and phytonutrients. The refining, bleaching and deodorization process of CPO produces refined palm oil (RBD). The benefit of palm oil is mainly the composition of potent antioxidants and balance in fatty acid saturation. Palm oil’s balance in fatty acid saturation has the advantage of less exposure to oxidation concurrently with the presence of antioxidants. It has the richest source of antioxidants with essential fat-soluble compounds such as carotenoids, tocopherols, tocotrienols and water-soluble phenolic compounds. Tocopherols and tocotrienols are isomers of vitamin E, which have high-antioxidant potential and are the primary antioxidants for lipids to protect lipids from oxidation [
5]. The carotenoids are part of the antioxidant defense system and efficient antioxidants in scavenging singlet molecular oxygen and peroxyl radicals [
6].
On the other hand, palm kernel oil (PKO) is an oil extracted from the kernel of palm fruits which is a highly saturated oil rich in medium-chain fatty acids (MCFA). The MCFA has been shown to reduce the gut pathogen load and contribute to broiler chickens’ gut health and performance [
7,
8]. However, adding PKO to the poultry diet is less common than palm oils, mainly due to the abundance and cheaper price of palm oils as well as that PKO is mainly used for human food application. Whereas, extraction of oil from soybeans and the refining, bleaching and deodorization process produce soybean oil (SBO) which is rich in polyunsaturated fatty acids (PUFA), mainly in the form of linoleic acid.
Figure 1 summarizes the similarity and differences in the properties of the oil of interest.
The published research on dietary palm oil in laying hens was limited and focused on different inclusion levels of the oil or using a single type of palm oil and comparing it with other vegetable oils [
9,
10,
11,
12]. Furthermore, a lack of studies compared palm oil with medium-chain-rich kernel oil and highly unsaturated oil in poultry, particularly laying hens. The parameters measured in previous studies were not extensive or in-depth and lacked information on the measurement of the serum biochemical, deposition and metabolism of beta-carotene, retinol and vitamin E, as well as its gene expression. Hence, the current study explored the effects of dietary palm oils, PKO and SBO, on egg production performance, egg quality, serum biochemical, metabolism of β-carotene, retinol and α-tocopherol and meat physicochemical attributes in laying hens.
2. Materials and Methods
2.1. Ethical Approval, Animals and Management
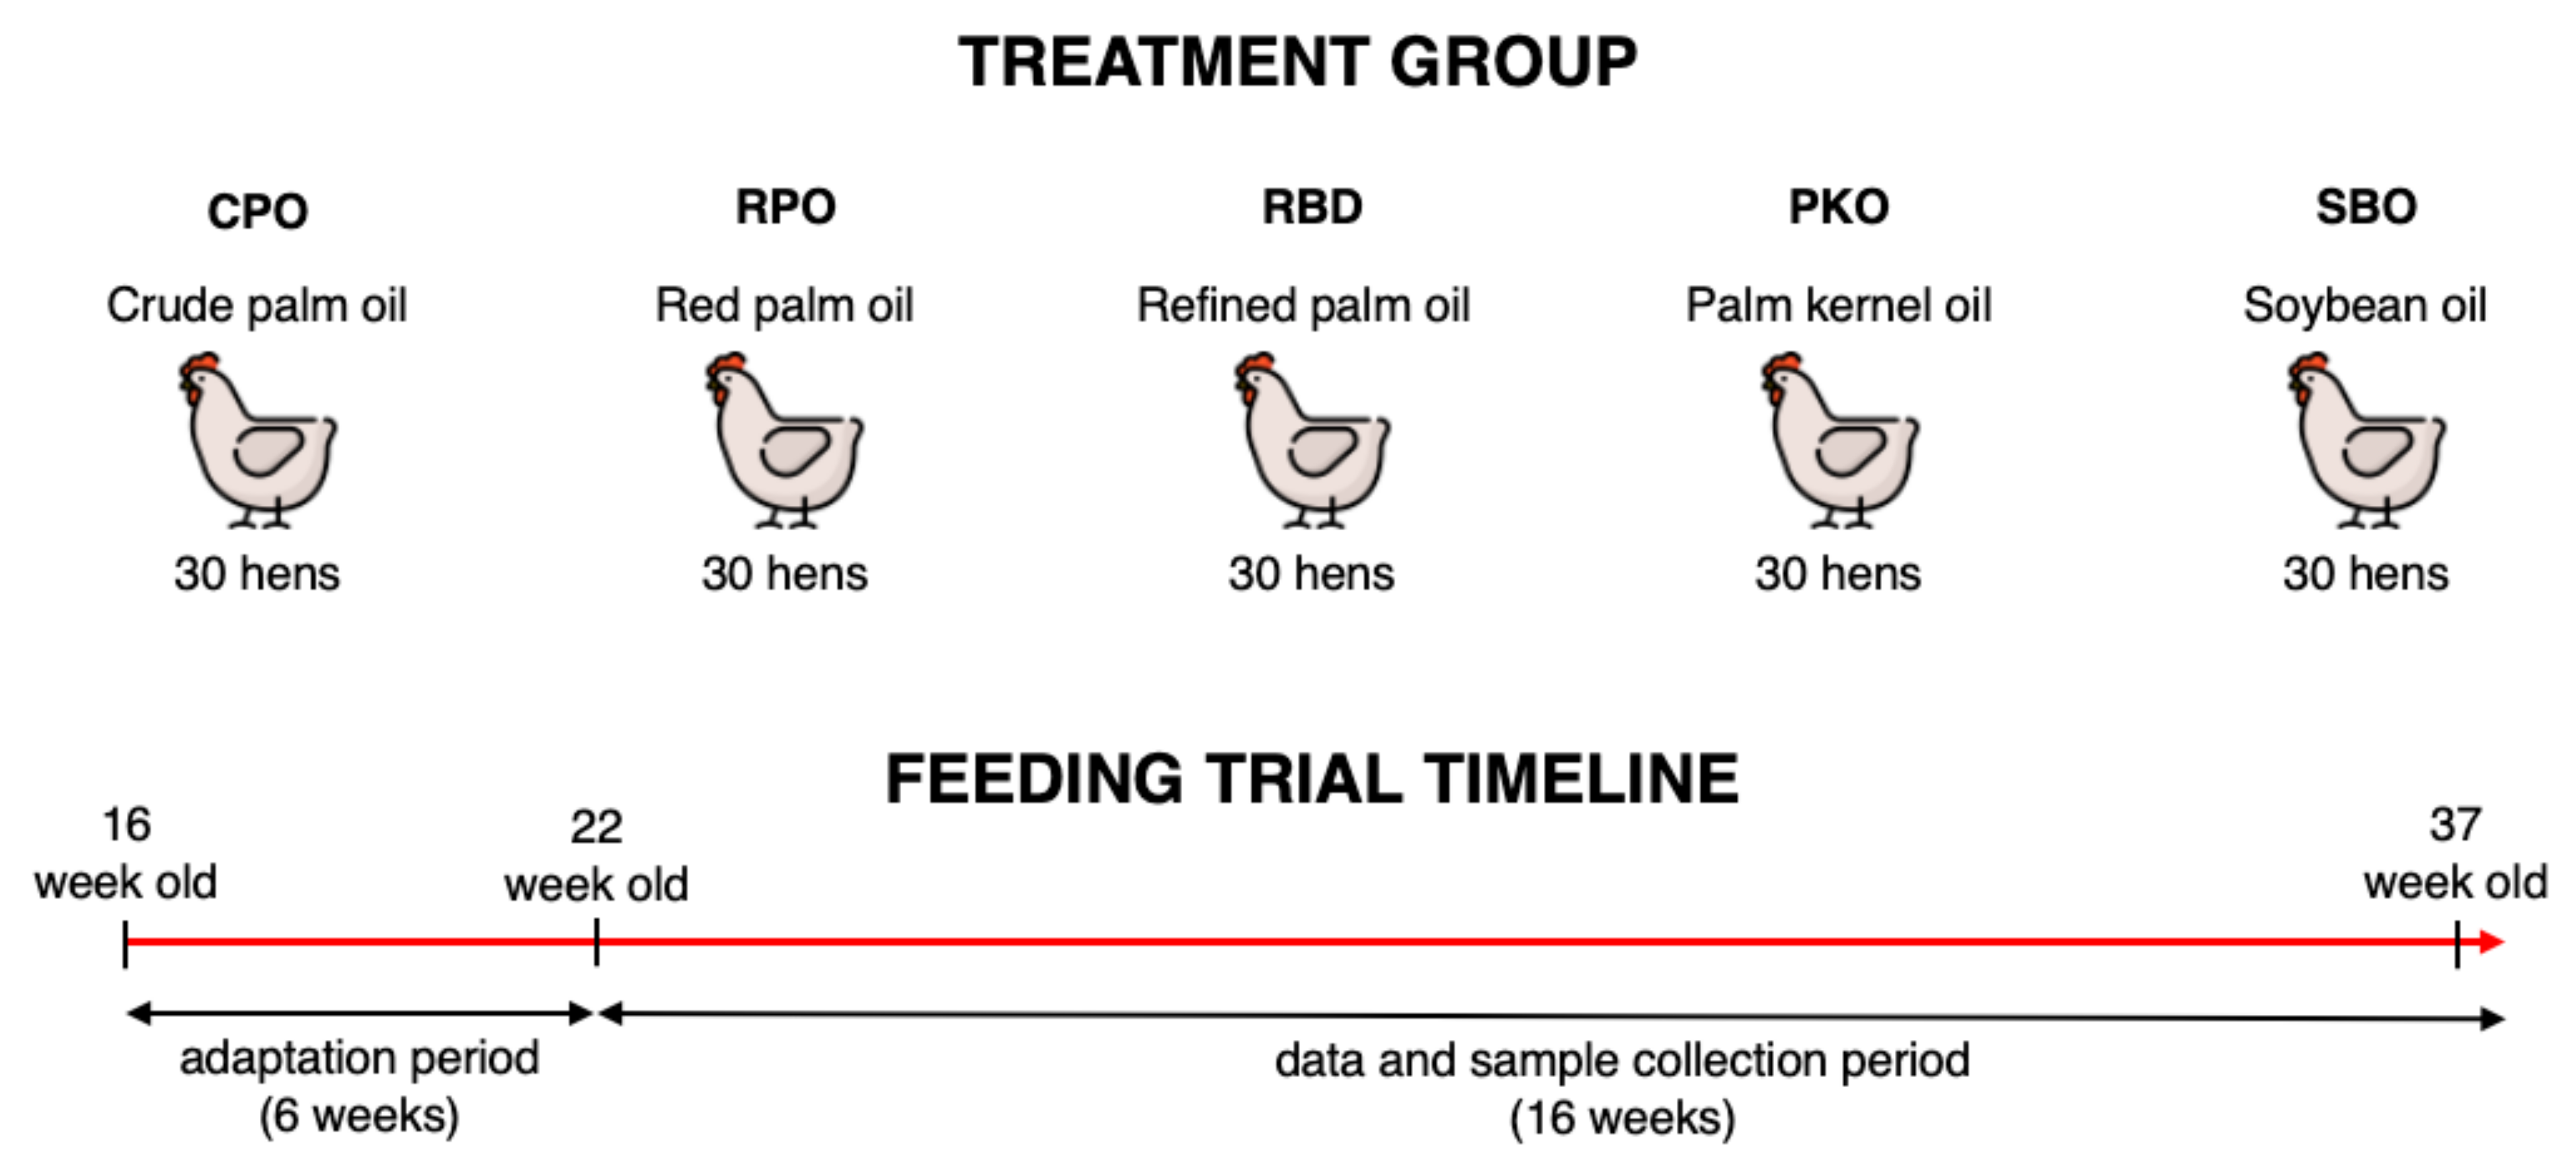
The use of laying hens in the study was approved by the Institutional Animal Care and Use Committee of Universiti Putra Malaysia (AUP No: UPM/IACUC/AUP-R013/2020). The feeding trial was conducted at the Poultry Unit, Farm 15, Department of Animal Science, Faculty of Agriculture, Universiti Putra Malaysia. A total of 150 Hisex Brown laying hens at 16 weeks of age were purchased from a local commercial layer farm (QL Poultry Farms, Rawang, Selangor). The hens were randomized into five treatment groups (30 hens per group), which contained six biological replicates per treatment and five hens per biological replicate. The hens were kept in an individual cage (30 cm width, 50 cm depth and 40 cm height) of a two-tier A-type battery cage in an open-sided hen house system. The lighting was programmed automatically and consisted of 16 h light and 8 h dark which includes average daylight of ±12 h and an additional 4 h using LED lighting. During the feeding trial, the temperature ranged between 24 to 32 °C and the mean humidity was 80 ± 5%.
2.2. Dietary Treatments
Five dietary treatments contained different oil types, namely CPO, RPO, RBD, PKO and SBO, as shown in
Table 1. The isocaloric and isonitrogenous diet was formulated using feed formulation software (FeedLIVE, Nonthaburi, Thailand) containing 3% oil from different sources. The nutrient requirement of Hisex Brown laying hens fed 120 g feed/hen daily was met according to the management guide. The experimental diets were prepared monthly and kept in an airtight plastic container at room temperature. The feed was offered daily in the morning (0700–0800) in the mash form, and water was offered ad libitum via a nipple drinker. The adaptation period lasted 6 weeks (week 16 to week 21), and hens received a diet with respective oils. The feeding trial period (data and sample collection) lasted 16 weeks ranging from week 22 to week 37. The experimental design and feeding trial timeline are simplified in
Figure 2.
2.3. Field Data Collection
Eggs were collected daily in the morning (0900) from the individual hen for egg number and egg weight. Feed intake was determined weekly by collecting feed refusal at the end of the week. The data were used to calculate hen-day egg production (HDEP), egg weight, egg mass, feed intake and feed conversion ratio (FCR). Two eggs from each replicate (a total of 12 eggs per treatment) were collected fortnightly for egg quality analysis. Feed samples were collected during feed preparation at the feed mill and kept in a −80 °C freezer until analysis.
2.4. Egg Quality
Egg quality was determined using EggAnalyzer® (ORKA Food Technology, Herzliya, Israel) to yield egg weight, albumen thickness, Haugh unit and yolk color parameters. The yolk color was further measured using calibrated ColorFlex EZ spectrophotometer (HunterLab, Reston, VA, USA) with an optical grade sample cup. The individual yolk sample was read in triplicate per sample with 90° sample rotation for each reading. The color measurement for egg yolk samples was expressed as L* (lightness), a* (redness) and b* (yellowness). Eggshells were dried in a 60 °C oven for 24 h to determine the eggshell weight, percentage of eggshell to overall egg weight and eggshell thickness using a digital vernier caliper (Mitutoyo Digimatic Caliper Series 500, Kawasaki, Japan). Egg yolk samples from week 16 were collected, freeze-dried (Labconco, Kansas City, MO, USA) and kept in an 80 °C freezer for subsequent analysis.
2.5. Sacrifice and Sample Collection
At the end of the feeding trial (week 37), one hen from each replicate (6 birds per treatment) was randomly selected and transported to the abattoir of the Department of Animal Science, Faculty of Agriculture, Universiti Putra Malaysia, for sacrificing and collecting samples. The hens were euthanized through the Halal slaughter method, and approximately 8 mL of blood was collected into a 10 mL blood tube (BD Vacutainer® Serum Tubes) at the bleeding point. Blood was kept on ice to clot, centrifuged at 3000× g to collect serum, and stored at −80 °C freezer until subsequent analysis. The internal organs were eviscerated. A portion of the lower right lobe of the liver sample was collected, kept in a cryotube and frozen in liquid nitrogen immediately before keeping at −80 °C.
2.6. Serum Biochemistry
The serum biochemistry analysis was conducted at the Veterinary Haematology and Clinical Biochemistry Laboratory, Faculty of Veterinary Medicine, Universiti Putra Malaysia, using respective kits on Hitachi 902 Automatic Analyzer (Roche Diagnostics, Basel, Switzerland). Serum samples were analyzed for liver enzymes, namely alkaline phosphatase (ALP), alanine transaminase (ALT), aspartate transaminase (AST) and gamma-glutamyl transferase (GGT). In addition, the total protein, albumin (A), globulin (G), A:G, calcium (Ca), phosphorus (P) and Ca:P were also determined.
2.7. β-Carotene Determination
The solvent extraction was conducted using acetone, and the measurement of β-carotene concentration was measured using UV/VIS spectrometric detection according to the protocol described by Biswas et al. [
13]. For the extraction procedure, 1 g of samples were weighed in a glass test tube with a screw cap. Chilled acetone was added and held for 15 min with occasional shaking in a chiller at 4 °C and mixed by vortex for 10 min. Next, the tubes were centrifuged at 1370×
g for 10 min at 4 °C. The supernatant was transferred into a separate test tube; the second extraction was conducted with another 5 mL of chilled acetone, mixed by vortex before centrifugation. The supernatant was combined in a tube and filtered using Whatman filter paper No. 42. The β-carotene (Sigma-Aldrich, St. Louis, MO, USA) standards were prepared ranging from 0.1 to 100 μg/mL in acetone. The absorbance of the extract, blank and standards was measured at 449 nm using a Multiskan™ Go spectrophotometer (Thermo Scientific, Waltham, MA, USA). The concentration of β-carotene in the samples was extrapolated using a standard curve of absorbance vs. the known concentration of β-carotene.
2.8. Retinol and α-Tocopherol Concentration by HPLC
The sample preparation and extraction were as described by Grebenstein and Frank [
14]. Briefly, 200 mg of liver or yolk sample was transferred in a glass tube with a PTFE-lined screw-cap (on ice) and added with 2 mL of ethanolic 1% (
w/
v) ascorbic acid, 900 μL distilled water and 300 μL saturated potassium hydroxide. The tubes were incubated for 30 min in a 70 °C shaking water bath for saponification before being cooled on ice. About 1 mL of distilled water, 25 μL ethanolic 0.001% (
w/
v) BHT (Sigma-Aldrich, St. Louis, MO, USA), 300 μL glacial acetic acid (Merck, Boston, MA, USA) and 2 mL n-hexane (Sigma-Aldrich, St. Louis, MO, USA) was added into the tubes and mixed by hand inversion. Serum samples were not saponified, in which 200 μL of serum was transferred in a glass tube and mixed with 2 mL of ethanolic 1% (
w/
v) ascorbic acid, 900 μL distilled water and 2 mL n-hexane and mixed by hand inversion. Liver, yolk and serum samples were centrifuged for phase separation at 1500 rpm for 3 min, and a 1.5 mL n-hexane layer was aliquoted into a new glass test tube. A similar extraction step was repeated by adding 2 mL n-hexane into the sample tube and collecting a 1.5 mL n-hexane layer into the glass test tube. The n-hexane was dried under a vacuum using a centrifugal evaporator. The viscous remaining was resuspended in 100 μL of mobile phase and kept in a 2 mL amber glass vial with a PTFE-lined screw cap.
The liquid chromatography was conducted on Agilent 1100 Series HPLC System. The mobile phase was a mixture of HPLC grade methanol and ethanol (Sigma-Aldrich, St. Louis, MO, USA) at a ratio of 75:25, respectively, and running at a constant flow rate of 0.8 mL/min. The separation of peaks was conducted on a Synergy™ 4u Hydro-RP 80A column, 150 mm × 4.6 mm × 4 μm (Phenomenex, Torrance, CA, USA), fitted with a guard column heated at 40 °C. Retinol and α-tocopherol were detected at 325 nm and 292 nm, respectively, using a fluorescence detector (FLD). In addition, a standard curve of retinol and α-tocopherol (Sigma Aldrich, St. Louis, MO, USA) was constructed to extrapolate the concentration of retinol and α-tocopherol in the samples.
2.9. Liver mRNA Expression of β-Carotene, Retinol and Tocopherol
Extraction of the total RNA was conducted using NucleoSpin
® RNA plus kit (Machery Nagel, Dueren, Germany) according to the protocol outlined by the manufacturer. The extraction kit contained NucleoSpin
® gDNA Removal Column for removing DNA contamination and a NucleoSpin
® RNA Plus Column to bind and purify RNA before elution with TE buffer (pH 7.5). The total RNA quantity and quality were determined using a Multiskan™ Go spectrophotometer (Thermo Scientific, Waltham, MA, USA). The total RNA (1000 ng) was transcribed to cDNA using the cDNA Synthesis Kit (Biotechrabbit, Berlin, Germany) following the manufacturer-supplied protocol. The qPCR was conducted on LightCycler
® 480 Instrument (Roche, Basel, Switzerland) with a 96-well plate format using 4× CAPITAL
TM qPCR Green Master Mix (Biotechrabbit, Berlin, Germany). The qPCR reaction mix contained 5 μL CAPITAL qPCR Green Mix, 2 μL forward and reversed primers, 1 μL cDNA and 12 μL nuclease-free water. The cycling program was set at 95 °C for 2 min and 30 s for initial activation. Then, 45 cycles of quantification step comprising of denaturation at 95 °C for 15 s and combined annealing, and extension for 30 s at a temperature specific to the primer used. A melting curve was then conducted to confirm the specificity of the amplification following the instrument’s melt curve program. The information on the primers of housekeeping and target genes is provided in
Table 2. The gene expression result is expressed as a fold-change of the treated groups to the control group using the 2
−∆∆Ct method [
15].
2.10. Experimental Design and Statistical Analysis
The experiment was designed for a completely randomized design (CRD). All statistical analysis was conducted on the SAS software package, version 9.4 (SAS Inst. Inc., Cary, NC, USA). The data obtained were checked for distribution using PROC UNIVARIATE and determined based on Shapiro–Wilk. All data were normally distributed. The data were analyzed using one-way analysis of variance (ANOVA) using the General Linear Model (GLM). In addition, Duncan’s multiple range test was performed for treatment means comparisons. The difference was considered significant at p < 0.05.
5. Conclusions
Overall, despite the difference in saturation profile of various dietary oils failed to influence the egg production performance of the laying hens. The RBD contributed to the improvement of the egg mass. The CPO improved the freshness of eggs through an increase in HU and AH. Serum biochemicals were not affected, except for higher ALP in PKO and SBO. The presence of natural carotenoids in CPO and RPO improved the presence of carotenoids in feed and deposition in the liver and egg yolk thus enhancing egg yolk color. No effects were seen on serum, liver and yolk retinol and α-tocopherol. However, the liver RBP4A gene was upregulated in CPO and PKO, and the CYP26A1 gene was downregulated in palm oils and PKO groups. Therefore, it can be concluded that palmitic-rich saturated fatty acids in palm oils and MCFA-rich PKO did not influence egg production performance and quality.


 ,
, 
