3.1. Effects of Species and Dietary Treatment on Change in BW, BCS, Linear Measures, and BMI
Initial BW, BCS, linear measures, and most BMI differed (
p < 0.05) between KAT and ALP, except for BMI based on length only (i.e., BMI-H and BMI-P;
Table 1). Initial BW, BCS, Hook, Pin, Heart, Rump, BMI-W, BMI-WH, and BMI-WP were greater for KAT than for ALP, whereas Wither, BMI-G, BMI-GH, BMI-GP, and BMI-WGH were greater for ALP. The species differences in linear body measurements and consequently BMI agree with findings in a number of other studies [
7,
10,
11,
22,
40].
There were no significant species × diet interactions in change in values during the experiment (
Table 1). Change in Heart and Rump, BCS, and BMI were affected (
p < 0.05) by species and diet except for BMI-H, BMI-P, BMI-G, BMI-GH, and BMI-WGH. Species differences, when they occurred, typically involved greater values for KAT than for ALP. For diets, values were in most cases greater for ALF than for LES or ALF:LES and LES.
The greater increase in BCS during the experiment for KAT vs. ALP (
p < 0.05) suggests a greater level of fat in tissues accreted by KAT, which is in addition to the greater initial BCS (
p < 0.05;
Table 1). In the present study, dairy goats and a hair sheep meat breed were used during various stages of growth before maturity. Growing animals bred for meat production tend to deposit more muscle protein and carcass fat rather than high accretion fat in internal depots [
22,
29,
30,
34,
35,
41], which might result in greater BCS in KAT sheep relative to the ALP goat breed for milk production. In the present study, species (sheep and goat) and animal type (meat versus dairy type) were confounded. The species differences between sheep and goat exist for muscle and fat deposition. For example, meat breeds of sheep deposit greater proportions of noncarcass fat and lesser proportions of muscle compared with meat breeds of goats [
42]. Similar BCS for ALF and ALF:LES and the lower (
p < 0.05) value for LES suggests that the composition of tissues accreted by animals consuming diets with ALF was similar and that tissues deposited by animals ingesting LES was higher in protein and lower in fat, in addition to less tissue gain. However, it is realized that BCS is subjective and determined largely by the amount and distribution of subcutaneous fat. The deposition of fat in internal sites may have influenced the relationship between BCS and variables such as ADG [
22,
23,
32].
It has been suggested that Heart alone or combined with a measure of length or height could be used to accurately predict BW [
16]. Relatedly, feed restriction lowered BMI based on Wither and body length [
26]. Palm oil or rapeseed oil fed to lactating goats caused differences in BW and BMI based on height and body length but not BCS, likely due to internal body fat mobilization to maintain milk production [
22]. In regard to the discussion above, it would be useful to evaluate relationships between these variables to identify most appropriate linear measures and BMI for use rather than only viewing breed or species means.
3.2. Relationships between BCS, Linear Measures, and BMI
There were significant moderate to high correlations (
p < 0.001) between BCS and all linear measures for both species, except for the correlation coefficient of 0.18 (
p = 0.047) between BCS and Rump for ALP (
Table 2). The correlations were always greater for KAT than for ALP, except for similar values between Heart and Pin. Among the correlations between BCS and linear measures, the greatest value was between BCS and Pin for ALP and between BCS and Heart for KAT. Liu et al. [
23] reported that BCS of Alpine doelings had positive low to moderate correlations with all linear measures except Wither, with the greatest relationship for Heart. In the present experiment, without considering correlation between Hook and Pin, which would be expected to be high relative to other measures, the greatest association was observed between Heart and Pin (0.71), followed by Heart and Hook (0.66). For KAT, the highest correlation was between Heart and Rump (0.82), followed by similar values for Heart-Wither, Heart-Hook, and Hook-Rump (0.68 to 0.69). These findings are in accordance with those of Liu et al. [
23] as well.
There were positive correlations (
p < 0.001) between BCS and all BMI for both species, with greater values for KAT than for ALP (
Table 3). From these results, as would be expected, it is evident that BMI were better predictors of BCS than linear measures alone. Although BCS had the greatest correlation with Pin for ALP and with Heart for KAT, the BMI calculated from these linear measures were not more highly related to BCS compared with other BMI. This type of discrepancy was also noted by Liu et al. [
23]. There were relatively small differences among BMI in regard to the relationship with BCS, with correlations for ALP ranging from 0.63 to 0.71 (excluding the r of 0.52 for BMI-P) and for KAT ranging from 0.77 to 0.86. Ptaček al. [
4], Chavarria-Aguilar et al. [
43], and Eknæs et al. [
22] used similar BMI to assess animal conditions. In addition to differences between species such as in the present experiment, breed within species could have impact. For example, the correlation between BCS and BMI based on height and length measures was stronger (r = 0.80) in Pelibuey ewes [
43] compared with the relationship between BCS and a BMI also calculated from height and length (r = 0.39) in Wallachian sheep [
22].
All correlations between BMI were highly significant (p < 0.001) in both species. In ALP, the lowest association was for BMI-P with BMI-G (0.61) and the highest was between BMI-WH and BMI-WGH and between BMI-GH and BMI-GP (0.93). In KAT, the lowest correlation was also between BMI-P and BMI-G (0.75) and the highest was between BMI-GH and BMI-GP (0.97), with values higher than for ALP.
3.3. Relationships for BCS and Linear Measures with Performance
Diet and species effects on DMI, ADG, and KR were addressed by Wang et al. [
28]. There were no species × diet interactions in variables addressed in this report. Dry matter intake tended (
p = 0.063) to be greater for KAT than for ALP (4.14 and 3.84% BW, respectively) and was similar among diets. Average daily gain (180 and 88 g) and KR (10.5 and 6.3 g/kg BW
0.75, respectively) were greater for KAT than for ALP. Diet had a marked effect on ADG, with differences among each and values of 159, 132, and 111 g/day for ALF, ALF:LES, and LES, respectively, in accordance with change in BW. Factors that appeared responsible for differences in ADG among diets, despite similar feed intake, appeared to be dietary levels of condensed tannins (CT; 0.9, 5.8, and 10.0%) and crude protein (21.2, 17.1, and 13.0% for ALF, ALF:LES, and LES, respectively). Digestibility decreased with increasing levels of lespedeza and CT, particularly of N. Wang et al. [
28] postulated that decreasing amino acid absorption and protein status with increasing level of lespedeza may have prevented an increase in feed intake that has been observed in some other studies [
44,
45].
For ALP, there was a correlation (
p < 0.05) between BCS and BW, but the correlations between BCS and ADG, DMI in g/day and relative to BW and kg BW
0.75, and KR were not significant (
Table 4). However,
p values for correlation coefficients between BCS and ADG (r = 0.38,
p = 0.065) and DMI in g/day (r = 0.35;
p = 0.093) only approached significance. For KAT, BCS was, however, correlated with BW (
p < 0.001), ADG (
p < 0.001), and DMI in g/day (
p<0.001), with moderate to high correlations. Likewise, Delfa et al. [
20] found that BCS was correlated with BW of goats. Relationships between BCS and milk production have been reported in Scottish Halfbred [
46] and Awassi [
47] goat breeds as a result of mobilization of body fat and protein reserves in early lactation. In a study with ALP doelings fed high forage diets, low to moderate relationships (r = 0.21 to 0.39) were noted between BCS and BW, DMI in g/day, and ADG [
23]. All of these results indicate that BCS can be an indicator or reflective of animal performance, but the strength of such relationships will depend on many factors. For example, the much higher association between BCS and BW for KAT than for ALP could be attributed to differences in sites of fat deposition, with potentially relatively more subcutaneous and less internal fat depots in KAT vs. ALP [
3,
32]. Similarly, it has been suggested that Churra [
32] and Finnish Landrace [
33] breeds of sheep deposit a greater proportion of noncarcass fat than other breeds. The magnitude of change in BW per unit of BCS differs among breeds depending on body size, conformation, fat distribution throughout the body, and standard reference body weight [
3,
33,
48]. The stronger relationships between BCS and production variables for KAT compared with ALP in the present study are unclear, but may involve differences in BCS scoring in the two species. Katahdin has been selected for meat production, which would include deposition of considerable carcass fat, whereas ALP is a dairy or milk breed that deposits considerable fat internally relative to greater subcutaneous accretion in meat goat breeds [
29,
30], similar to differences between dairy and beef cattle breeds [
31].
Body weight was correlated (
p < 0.05) with all linear measures, with the highest correlation for Pin (0.85) and lowest value for Wither (0.48;
Table 4). For KAT, BW also was correlated (
p < 0.05) with all linear measures, with the lowest coefficient for Wither (0.68) and highest value for Rump (0.91). High correlations between linear measures and BW have been observed in many other studies as well (i.e., [
1,
18,
23,
49]).
No linear measure for ALP was correlated with ADG, DMI in g/day, % BW, or g/kg BW
0.75, or KR (
Table 4). In contrast, for KAT, DMI in g/day was correlated (
p < 0.05) with all linear measures (r of 0.41 to 0.70), with the greatest value for Rump (0.70), followed by Hook (0.63). Moreover, ADG of KAT was correlated (
p < 0.05) with Heart and Rump. However, similar to ALP, other variables for KAT such as DMI in % BW and g/kg BW
0.75 and KR were not related to linear measures. Liu et al. [
23] reported that correlations for ALP doelings between linear measures, except for Pin and DMI in g/day and g/kg BW
0.75 and ADG, were of low to moderate magnitude. The highest correlation coefficients were for Heart and DMI in g/day (0.78) and % BW (0.53), whereas for DMI in g/kg BW
0.75, the coefficients of 0.42–0.49 were noted for Wither, Hook, Heart, and Rump.
3.4. Relationships between BMI and Performance
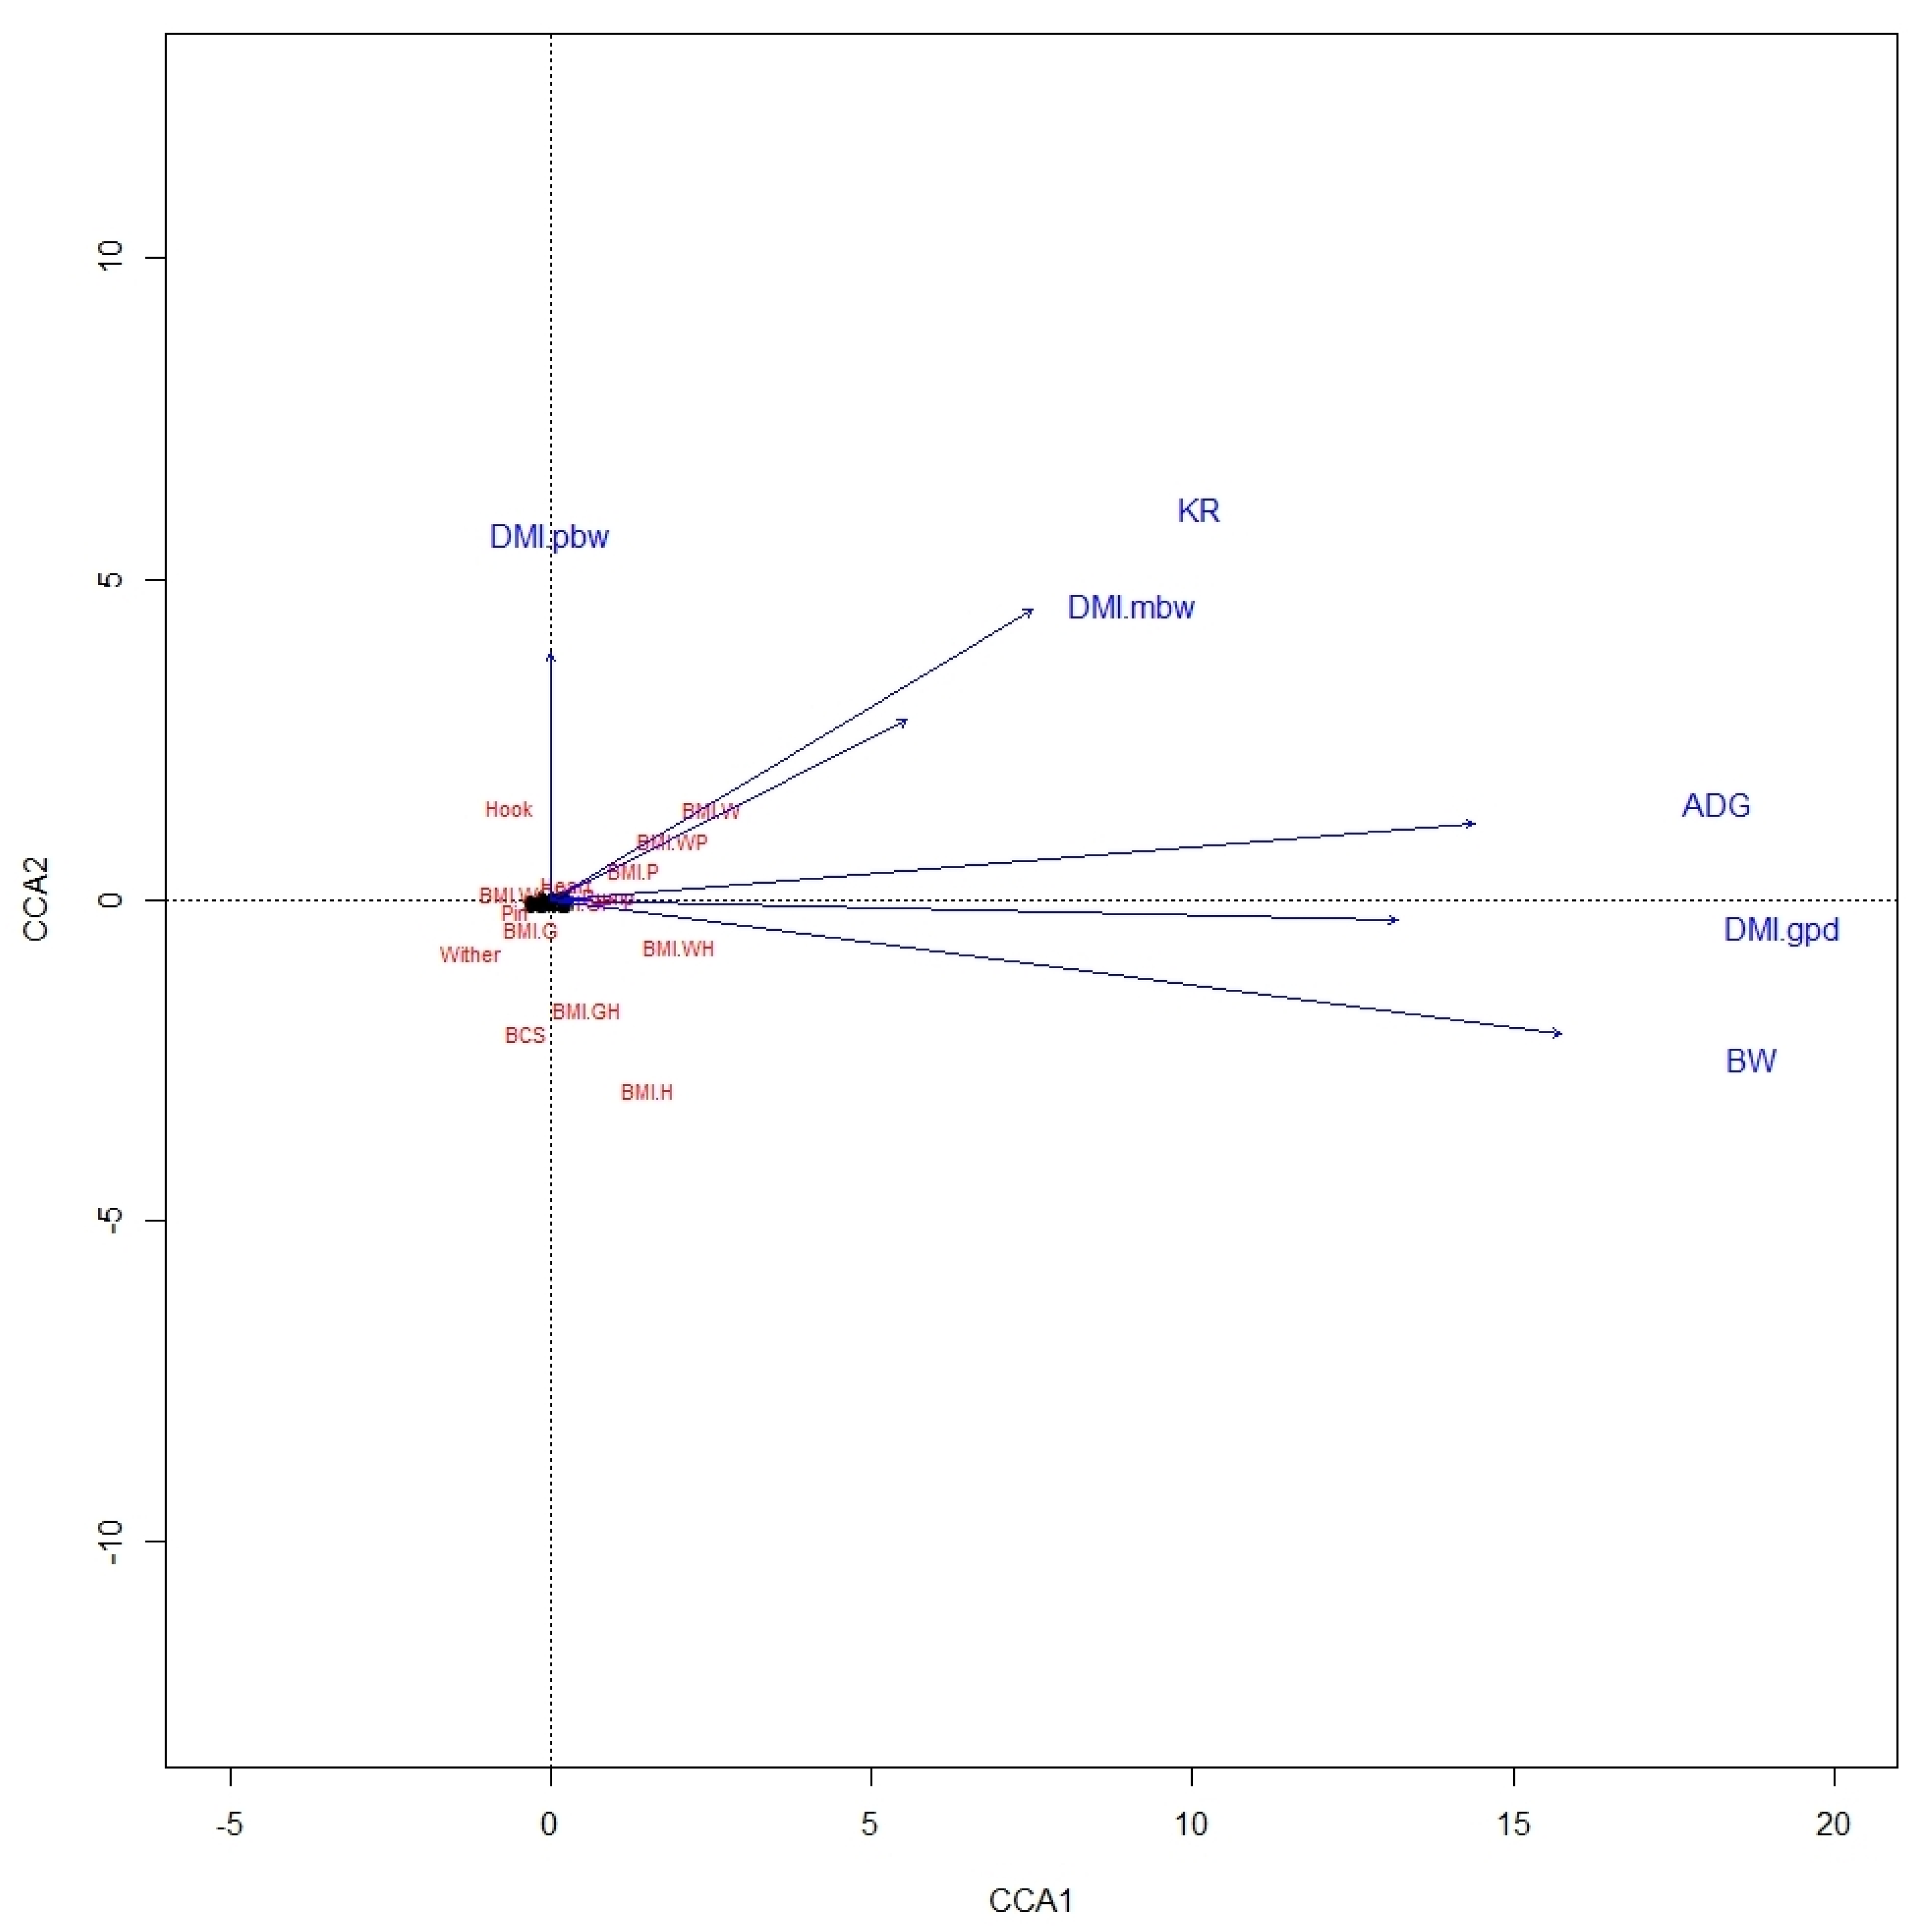
From the CCA biplot for ALP, it was noted that BMI were highly related to variables of BW, ADG, DMI in g/day, and KR, whereas BCS was not related to any performance variable (
Figure 1). In KAT also, ADG, BW, and DMI in g/day were highly related to BMI-WH, as was also true between KR and BMI-W and BMI-WP, but there were no relationships between BCS and performance variables (
Figure 2). This likely involves the fact that BW is used in estimating both BMI and these expressions of DMI.
As expected based on how BMI are calculated, BW of both species was related (
p < 0.05) to all BMI (
Table 5). For ALP, correlation coefficients ranged from 0.58 for BMI-H to 0.88 for BMI-WP and for KAT from 0.48 for BMI-WGH to 0.91 for BMI-GH. These correlations compare with those for BCS of ALP and KAT of 0.49 and 0.91, respectively. The correlations between BW and BMI based on combinations of two linear measures were in most cases greater than the correlation between BMI calculated from one or three linear measures. Likewise, Liu et al. [
23] noted that associations between BW and a BMI based on Wither, Heart, and Pin were not significant and, thus, this BMI was not recommended. Similar to BW, ADG were correlated (
p < 0.05) with all BMI of both species, with correlation coefficients for ALP ranging from 0.41 for BMI-W to 0.65 for BMI-GH and for KAT from 0.47 for BMI-G to 0.72 for BMI-GH. The associations between ADG and BMI were always greater for KAT than for ALP, except for BMI-WGH, with a lower value for KAT. Overall, BMI were more highly related to ADG than were linear measures. It is also important to note that BCS of ALP was not related to ADG, and the correlation coefficient for KAT was 0.57 and less than for most BMI. In Wallachian sheep, milk production was significantly correlated with BMI calculated from height and length [
4]. Similarly, goats with a relatively high BMI produced more milk than those with low BMI [
50].
Dry matter intake in g/day by ALP was correlated (
p < 0.05) with five of the nine BMI, BMI-P, BMI-G, BMI-WP, BMI-GH and BMI-GP, with the highest (0.61) for BMI-GP and lowest (0.43) for BMI-WP. Dry matter intake by KAT in g/day was correlated with all BMI, with the highest correlation for BMI-GH and BMI-GP (0.75) and lowest for BMI-WGH (0.52), and all correlations were greater for KAT than for ALP. Similar to ADG, BCS of ALP was not significantly related to DMI in g/day, and the correlations for KAT were less than for BMI based on two linear measures (i.e., 0.63). Liu et al. [
23] reported that there were significant relations between DMI by ALP doelings in g/day and all BMI, except for BMI-WGH, which is in accordance with results of the present study for ALP but not KAT. Liu et al. [
23] also noted that the relation between DMI in g/day and BMI was greatest for BMI-WP (0.63), BMI-GP (0.58), and BMI-P (0.56). In the present experiment, DMI in % BW and g/kg BW
0.75 was not related (
p > 0.05) to BMI for either species, and the same was true for BCS. As noted before, this could relate to influence of BW on both variables. In contrast, Liu et al. [
23] noted significant correlation between DMI in % BW and g/kg BW
0.75 by ALP doelings and some BMI, with greatest values for BMI-P and BMI-WP. Interestingly, and in contrast with involvement of BW in estimation of BMI and DMI in % BW and g/kg BW
0.75, the KR of ALP was related to some BMI, though the correlations were moderate (i.e., 0.42, 0.41, and 0.43 for BMI-H, BMI-GH, and BMI-WGH, respectively). However, the KR of KAT was not related to any BMI, and BCS of both species was not related to KR.
3.5. Relationships between Changes (∆) in Performance Variables and BCS and BMI
There were few significant correlations between ∆BCS and change in linear measures and ∆BMI (
Table 6). For ALP, ∆BCS was only correlated with ∆Wither (r = 0.45). The BCS of KAT was correlated (
p < 0.05) with ∆BMI-H, ∆BMI-WH, ∆BMI-WP, and ∆BMI-GH (r = 0.47, 0.52, 0.42, and 0.42, respectively). There were correlations (
p < 0.05) between ADG and change in all linear measures except ∆Wither for both ALP and KAT, suggesting that ∆ADG is not highly associated with proportional height changes. For ALP, ADG was correlated (
p < 0.05) with all ∆BMI except ∆BMI-
p and ∆BMI-H, with the greatest correlation for ∆BMI-WH (0.77) and ∆BMI-W (0.76). Significant correlations for KAT were noted for ∆BMI-W, ∆BMI-P, ∆BMI-WH, ∆BMI-WP, and ∆BMI-GP, with the greatest value for ∆BMI-W (0.83), followed by ∆BMI-WP (0.75). Although ∆Wither was not related to ∆ADG, ∆BMI based on Wither was highly related to ∆ADG for both species. The correlation between ∆BCS for ALP and ADG was not significant, and that for KAT was significant but lower than for ∆BMI-W, ∆BMI-WH, and ∆BMI-WP. Interestingly, change in KR was correlated (
p < 0.05) with the same variables for which there were correlations with ADG for both species. No significant correlations were noted between any expressions of ∆DMI with changes in any linear measures or ∆BMI for ALP. For KAT, ∆DMI in g/day, % BW, and g/kg BW
0.75 were correlated (
p < 0.05) with ∆Heart but not with change in other linear measures. For KAT, ∆DMI in g/day was related (
p < 0.05) to ∆BMI-W, ∆BMI-WH, and ∆BMI-WP (r = 0.50, 0.48, and 0.49, respectively). For KAT, there was no significant correlation for DMI in % BW for either species involving change in BMI. For KAT, DMI in g/kg BW
0.75 was moderately related (
p < 0.05) only to two ∆BMI variables, i.e., ∆BMI-P and ∆BMI-WP (0.44 and 0.43, respectively). For both species, ∆BCS was not correlated (
p > 0.05) with any DMI expressions.

 ,
, 

