
Functional Divergence of the N-Lobe and C-Lobe of Transferrin Gene in Pungitius sinensis (Amur Stickleback)

School of Life Sciences, Jiangsu University, Zhenjiang 212013, China
Animals 2022, 12(24), 3458; https://doi.org/10.3390/ani12243458
Submission received: 5 November 2022
/
Revised: 3 December 2022
/
Accepted: 5 December 2022
/
Published: 7 December 2022
(This article belongs to the Section Aquatic Animals)
Abstract
:Simple Summary
As an iron-binding glycosylated protein, transferrin plays key roles in iron metabolism and immune response. Here, a transferrin transcript was identified from Amur stickleback, which encoded 679 amino acid peptides harbored obvious N-lobe and C-lobe domains. This transferrin was highly expressed in liver and increased by pathogen stimulation. Molecular evolution was performed on the N-lobe and C-lobe domains. Iron-binding capacity and antibacterial characteristics were also compared between N-lobe and C-lobe. These results will have important reference significance for the subsequent functional research.
Abstract
Transferrin is an important iron-binding glycosylated protein and plays key roles in iron-binding and immune response. Here, a 2037-bp open reading frame was obtained from our previous transcriptome sequencing data of Amur stickleback, which encoded a 679 amino acid putative transferrin protein harbored obvious N-lobe and C-lobe domains. The tissue-specific expression pattern showed that the transcript was detected in a variety of tissues, with the highest signal in liver. Moreover, Streptococcus iniae pathogen stimulation can increase the expression level of this transcript, implying important immune properties for organisms. Next, N-lobes and C-lobes were obtained from 45 fish species. The phylogenetic tree showed that N-lobes and C-lobes were in two different evolutionary branches, and they had different motif composition. Functional divergence indicated a higher evolutionary rate or site-specific alteration among the N-lobe and C-lobe groups. Ka/Ks value of C-lobe group was relatively higher than that of N-lobe group, indicating a faster change rate of C-lobe sequences in evolution. Moreover, some sites experiencing positive selection were also found, which may be involved in the iron- or anion-binding, pathogen resistance and diversification of transferrin protein. Differential iron-binding activity was also detected between N-lobe and C-lobe of Amur stickleback transferrin protein with Chrome Azurol S assay. Compared with the C-lobe, the N-lobe showed stronger growth inhibitory activity of Escherichia coli, implying their potential antibacterial properties. This study will give a reference for subsequent research of transferrin proteins.
1. Introduction
As an essential trace element of an organism, iron functions in many metabolic and physiological processes such as electron transfer, DNA synthesis, etc. [1,2,3]. The bioavailability of iron depends on the Fe2+ and Fe3+ forms. Among them, the free ferrous iron (Fe2+) is highly toxic and can form hydroxyl radicals, causing oxidative damage of macromolecules. Therefore, the free ferric form (Fe3+) is necessary for its transportation [4,5]. Fe3+ is insoluble, so organisms usually use specialized iron-binding proteins to transport or store it [6]. In addition, excessive iron promotes the production of free radicals and the propagation of pathogens [1,2]. It is thus clear that maintaining an appropriate iron balance is essential for organisms [7]. The maintenance of iron homeostasis requires a series of protein interactions and their regulation, among which transferrin (TF) plays key roles in iron transport and storage [8].
TF is a glycosylated protein with about 70–80 kDa and plays roles in iron metabolism, cell proliferation, inflammation, immune response, and antibacterial functions [9,10]. According to their localizations, structures, and functional characteristics, transferrins are divided into several subclasses including serum transferrin, melanotransferrin, lactoferrin, ovotransferrin, and other transferrin-like proteins [11]. Serum transferrin is mainly responsible for the transport of iron, which is synthesized in the liver [12], while melanotransferrin plays a membrane-bound role present in melanoma [13]. Lactoferrin mainly exists in milk secretion and plays a role in the innate immune [12,14]. Ovotransferrin has antibacterial and antiviral effects, expressed in the oviduct and liver [15]. Structurally, they contain N-lobe and C-lobe. Both domains are composed of highly conserved anion-binding and iron-binding sites [16,17]. They also have similar peptide residues and three-dimensional structure, which are considered to be the result of fusion after ancestral gene duplication [18,19]. Each lobe contains two subdomains which can interact and form ion binding sites. Although the growth of some pathogens is enhanced in the presence of TF, it can limit infections caused by some pathogens through reducing the iron level in the surrounding environment [20,21]. Many reports have confirmed that TF plays important roles in host response to pathogen invasion, and it participates in host innate immunity [22,23]. TF can be cleaved into small fragments by elastase, which can increase the expression of chemokines and cytokines and be used as a key activator of antibacterial response [24,25,26].
TF proteins have undergone a complex evolutionary process. Abundant polymorphisms have been observed in TF of many vertebrates [27]. In mammals, a large number of single nucleotide and/or single amino acid substitutions lead to the TF polymorphisms [28]. In addition, selection pressure also functions in evolution and leads to high DNA polymorphism of fish TF genes [29,30,31,32,33]. Furthermore, recombination and gene transformation events also cause the diversification of TF protein alleles [34]. The polymorphism of TF proteins is helpful for organisms to adapt to environmental changes and resist pathogen infection [17,29,31,35].
Transferrin has been studied in some teleost fishes with specific tissue distribution [36,37,38,39,40,41,42,43] and important roles in iron chelation [37], antibacterial reaction [36,37], and immune response [2,23,38,40,43]. The species and resources of fish are extremely rich. As lower vertebrates, although fish do not have some immune organs of higher vertebrates, such as the spinal cord and lymph nodes of mammals, the immune system of fish also consists of the innate and adaptive immune system. Therefore, its research is helpful to understand the evolution of vertebrate immune system. In addition, it also helps to study the species change, environmental adaptation, and evolutionary history and promote the sustainable development of fisheries.
Pungitius sinensis (Amur stickleback) is one kind of the Gasterosteidae family. This fish has become an important model due to its small size, strong vitality, and short breeding cycle. Here, one TF gene was obtained from Amur stickleback, and its tissue and pathogen induced expression pattern, phylogenetic relationship, motif composition, functional divergence, selection pressure, iron-binding activity, and antibacterial characteristics were analyzed.
2. Materials and Methods
2.1. Preparation of P. sinensis, RNA Extraction, Expression Patterns in Different Tissues and under Pathogen Infection
All of the procedures complied with and were approved by the Institutional Animal Care and Use Committee (ethical approval number: UJS-LAER-2018120901). The Amur stickleback (P. sinensis) was obtained from a farm in Hunan, China. Twenty sticklebacks were cultured in 22–23 °C. Total RNA from six healthy tissues (liver, intestine, kidney, muscle, gill, and heart) was isolated with high-purity Trizol total RNA extraction kit (Sangon, Shanghai, China). RNA quality and concentration were determined with NanoDrop (Thermo Scientific, Wilmington, NC, USA). Next, reverse transcription was performed with M-MLV (TakaRa, Dalian, China) and random primers. The TruSeq Stranded mRNA LTSample prep kit (Illumina, San Diego, CA, USA) was used to construct cDNA. To explore the response of the TF gene to a pathogen, healthy fish was injected with 100 μL of 1 × 10⁴ CFU/mL live Streptococcus iniae (Pier and Madin strain) purchased from MingzhouBio, a Gram-positive bacteria and a serious aquaculture pathogen that can infect a variety of aquaculture fish. Each test group was sampled at 3 h, 6 h, 12 h, 24 h, 2 d, 3 d, and 4 d after post-challenge, and liver tissue was collected to extract RNA and reverse transcribe into cDNA as previously described. Quantitative PCR with the LightCycler® 480 II Real-time PCR Instrument (Roche, Basel, Switzerland) was performed using specific primers (Table 1). Actin gene was used as an internal reference (Supplementary Data S1). Relative expression level of the TF was measured by the 2−ΔΔCt method [44]. Three biological replicates were used for this analysis.
2.2. Sequence Retrieval of Fish TFs
To identify potential TF proteins in the 45 fish species, the TF protein sequence of Amur stickleback identified by our previous transcriptome sequencing data [45] was used to BLAST the Ensembl database (http://www.ensembl.org/index.html, accessed on 8 June 2021) [46] with cutoff E-value of 1 × 10⁻¹. For each species, the candidate with the highest homology with the Amur stickleback TF protein was selected for subsequent analysis (Supplementary Data S2). Next, Pfam database [47] was used to confirm the candidates based on whether the conserved transferrin domain existed or not and to distinguish sequences of N-lobe and C-lobe.
2.3. Phylogeny and Motif Analysis
Multiple sequence alignment of these N-lobes and C-lobes was performed with MUSCLE 3.52 [48]. Subsequently, MEGA v6 [49] was used for phylogenetic analysis using neighbor joining (NJ) method with pairwise-deletion, p-distance, and 1000 bootstrap replicates parameters. Conserved motifs were identified with MEME (http://meme-suite.org, accessed on 28 August 2021) [50] in each amino acid sequence with parameters: maximum 6 motif and 6–50 widths.
2.4. Functional Divergence Analyses
DIVERGE V2.0 [51] was used to estimate functional divergence among the N-lobes and the C-lobes of fish TF genes. Type I functional divergence can detect specific residue regions, which means that these residues undergo functional change [51]. Type II functional divergence can detect some conserved residues with different biochemical characteristics that function for protein specification. θI and θII stand for the coefficients among different groups predicted by type I and type II functional divergence, respectively. When these coefficients are greater than 0, it means that the site-specific selection changes the physicochemical properties of amino acids. In addition, significant differences in evolutionary rate and amino acid physicochemical properties existing between different group members were also indicated with posterior analysis [52].
2.5. Site-Specific Selection Assessment and Testing
The selective pressure of each residue of TF proteins was estimated with the synonymous rate (Ks) and non-synonymous rate (Ka) of nucleotide substitution. Here, Ka/Ks values were calculated with M8, M8a, M7, and M5 models. All of these models calculate the Ka/Ks value between sites with eight discrete classes and posterior distribution [53,54]. I-TASSER [55] was used to predict the tertiary structure of TF protein in Amur stickleback.
2.6. Recombinant N-Lobe and C-Lobe Plasmid Construction, Expression, and Purification
The cDNA fragments of N-lobe and C-lobe were amplified by the specific primers with Nde I and Xba I restriction sites (Table 1). The PCR products were digested, connected to the expression vector pCZN1, and transformed into BL21 strain. Cells were cultured until the concentration of 0.6 at OD600 in LB liquid medium adding ampicillin at 37 °C and inducted with 0.2 mM IPTG (isopropyl β-D-thiogalactopyranpside) at 15 °C overnight. The recombinant peptides were purified with His Band Resin columns (Novagen, Madison, WI, USA) after sonication. Their purity was analyzed through 12% SDS-PAGE (sodium dodecyl sulfate polyacrylamide gel electrophoresis). NanoDrop (Thermo Scientific, Wilmington, NC, USA) was used to measure the peptide concentration. It can quantify protein by detecting the absorbance value of protein at 280 nm without using protein standard.
2.7. Iron-Binding Assay of N-Lobe and C-Lobe of TF in Amur Stickleback
The iron-binding characteristics of N-lobe and C-lobe were evaluated with Chrome Azurol S (CAS) assay [56]. A 500 μL CAS assay solution (Sigma Aldrich, USA) was used to mix with expressed N-lobe, C-lobe, and maltose binding protein (MBP, Abcam; a protein tag, which can increase the solubility of protein and assist in protein folding but does not have any antibacterial and iron-binding capacity), and the mixture was incubated at room temperature in dark conditions for 1 h and measured the light absorbance value at 630 nm. Here, protein with different concentrations was used to detect the effect of sample concentration on iron-binding ability. The negative control is represented by an equivalent amount of elution buffer. Finally, the average of the relative absorbance of the three repetitions was calculated to represent their iron-binding activities.
2.8. Antibacterial Assay of N-Lobe and C-Lobe of TF in Amur Stickleback
Escherichia coli was first cultured in 37 °C LB medium at 200 rpm for about 6 h and diluted to the absorbance value of 1. Then, 100 μL diluted E. coli liquid (DH5α) and FeCl3 with final concentration of 1μM were added to the 96 well microtiter plate, respectively. Then, equal amounts of N-lobes, C-lobes, MBP or elution buffer (control) were added into each well to 2 μM final concentration. Finally, the light absorption value of bacterial solution at 600 nm in different time periods was measured to verify the growth of the strain. The test is repeated three times.
3. Results
3.1. Identification and Expression Patterns of TF Gene in Amur Stickleback
A 2037-bp open reading frame was obtained from our transcriptome sequencing data of Amur stickleback [45], which encodes a TF protein with 679 amino acid residues. This TF transcript of Amur stickleback, similar to the zebrafish transferrin-a gene, has high homology with the mammalian serum transferrin. It has N-lobe and C-lobe typical functional domains, separated by a short bridge (Supplementary Data S2). This TF protein of Amur stickleback was homologous to those of other species (Figure 1).
Next, the tissue distribution of PsTF transcripts was also detected. The results indicated that the expression of PsTF transcripts was differentially distributed in the six examined tissues. The highest expression pattern of PsTF mRNA was detected in liver, followed by intestine, kidney, and muscle. Moreover, the lowest expression level of PsTF transcripts was detected in gill and heart (Figure 2A).
To study the effect of pathogen stimuli to the PsTF, the dynamic expression patterns of PsTF gene in liver tissue infected with S. iniae were analyzed (Figure 2B). The result indicated that at 24 h and 2 days after bacterial infection, the expression level of PsTF was the highest. Compared with the control, the increase fold of PsTF transcripts was about 4.7 and 3.8 at these two points of time, respectively. Therefore, the transcriptional changes of PsTF gene may be an immune mechanism against pathogenic stimuli.
3.2. Phylogenetic Analysis of the N-Lobe and C-Lobe
To further elucidate the evolutionary relationship of the N-lobe and C-lobe of TF family genes from 45 fish species, an NJ phylogenetic tree was constructed. According to the sequence similarity and phylogeny, these members were classed into two groups, named N-lobe and C-lobe groups (Figure 3). This structure is believed to originate from a gene duplication event about 670 million years ago [18,19].
3.3. Motif Distribution of the N-Lobe and C-Lobe Sequences in Fish TFs
To further understand the diversity of N-lobe and C-lobe in fish, six conserved motifs were identified in these sequences (Figure 4).
These N-lobes and C-lobes share most of the motif distribution, while the C-lobes specifically contain motif 6, suggesting that these sequences from ancient gene duplication have changed in evolution. The specific motif 6 in C-lobe group may confer different functions of this family protein in evolution.
3.4. Functional Divergence Analysis between N-Lobe and C-Lobe Groups
Type I and Type II functional divergence were estimated to investigate the residue substitution leading to adaptive functional diversification. The results showed that the type I divergence coefficient (θI) of these two groups was 0.599 (Table 2), indicating the change of specific sites among them. Selective restriction on different lobe members may lead to changes in specific functions after divergence. In addition, the type II divergence coefficient (θII) was also estimated with high standard error (Table 3).
To identify key residues associated with functional changes among N-lobe and C-lobe groups of TF proteins, posterior divergence probability of each site was estimated. The larger value of posterior probability indicates a great possibility of change in site-specific amino acids [52]. As a result, some key residues were identified related to functional divergence in these groups (Table 2 and Table 3).
3.5. Selective Pressure Estimation
To identify which residues experienced positive selection, the Ka/Ks value was calculated for each site of N-lobe and C-lobe sequences (Table 4). The Ka/Ks value of the C-lobe group was relatively higher than that of the N-lobe, indicating a faster change rate in C-lobe. All values of Ka/Ks were less than 1, indicating that each group had undergone purification selection. However, seventeen sites were identified to undergo positive selection in the N-lobe group predicted by M8 model (Table 4). At the same time, thirty-nine and forty-six sites were also found in the C-lobe group predicted by M8 and M5 model, respectively (Table 4). For instance, among the 17 sites of N-lobe group, 23V, 33L, 95R, 127K, and 278V sites were located in the motifs 3, 1, and 5 (Figure 5).
3.6. Iron-Binding Activity of the N-Lobe and C-Lobe of TF Protein in Amur Stickleback
Next, N-lobes and C-lobes of TF in Amur stickleback were first expressed and purified in vitro (Figure 6A and Figure S1).
Firstly, CAS assay reagent was used to detect the potential binding ability of N-lobe and C-lobe to ferric ions (Fe3+). The results indicate that both N-lobe and C-lobe have the ability to bind Fe3+, and the level increases with the increase in concentration (Figure 6B). Compared with C-lobe, N-lobe has a stronger ability to bind iron ions. However, compared with the control, MBP has no reaction to iron-binding activity.
3.7. Antimicrobial Properties of the N-Lobe and C-Lobe of TF Protein in Amur Stickleback
Next, their potential antimicrobial properties were also analyzed. The results showed that both N-lobe and C-lobe had potential antibacterial ability (Figure 7).
Compared with C-lobe, N-lobe showed stronger bacterial growth inhibitory activity. The high Fe3+-binding efficiency of N-lobe may play key roles in inhibiting bacterial growth. Here, the results also showed that MBP did not produce any significant changes in bacterial growth.
4. Discussion
Here, a transcript was obtained from Amur stickleback, which encodes a TF protein with obvious N-lobe and C-lobe domains. First, the differential tissue distribution and bacterial stimulation of this transcript were detected (Figure 2). Liver tissue is the main site for TF synthesis in vertebrates [57]. Therefore, high levels of PsTF transcripts were detected in the liver in this study. Similar results were also observed in other species of fish [10,36,37,39,40,58,59]. In some species, a large amount of TF gene expression was also detected in blood and other tissues [12]. This indicates that TF may play important roles in multiple tissues. Previous studies have also reported that bacterial stimulation can up-regulate the expression of TF gene [36,38]. In fish, high levels of TF transcripts were usually detected under pathological conditions [36]. In addition, insect TF has also been shown to be up-regulated under pathological conditions such as bacterial stimulation [60,61]. These results suggest that PsTF may exhibit an immune response to pathogenic infection.
Some iron- and anion-binding residues were also described by previous study [17]. In this study, four iron- and two anion-binding sites were also found in the N-lobe and C-lobe of Amur stickleback TF protein, respectively. They are residues D73, Y103, Y196, and H255 of N-lobe and D394, Y429, Y521, and H581 of C-lobe, which are located in motifs 3, 1, 2, and 4, respectively. In addition, anion-binding residues of the T128 and K132 in N-lobe and T454 and R458 in C-lobe were also found to locate in the motif 1. Mutation of some equivalent ligands resulted in a significant sharp reduction or loss of iron-binding capacity of TFs in human, rat, pufferfish, and chicken [17,62,63]. This suggests that N-lobes and C-lobes from duplication have had functional divergence in evolution.
Functional divergence identified some critical amino acid sites (Table 2 and Table 3). For instance, seventeen key functional divergent were identified between N-lobe and C-lobe groups predicted by type I functional divergence. Among them, fifteen sites were in the motifs 3 and 1. Some sites are near the Fe-binding residues and anion-binding residues described by previous study [17]. These sites may affect the Fe-binding and anion-binding function. The different evolution rates of some key residues may lead to functional differentiation of fish TF gene family.
In the process of evolution, selection pressure, evaluated by Ka/Ks value, usually causes specific peptides to mutate, thereby changing the structure and function of proteins. When the Ka/Ks value was greater than or less than 1, it indicated positive selection or purification selection, respectively [64]. Here, some positive selection sites were predicted in the N-lobe and C-lobe groups (Table 4). Among them, some sites are close to the iron- and anion-binding residues and may affect the ability of binding iron or anion [17]. The positive selection of fish TFs is considered to be caused by its competition with pathogenic bacterial proteins [29]. In addition, positive selection plays key roles in the diversification of TF proteins [31,35,65]. It suggests that selection pressure promotes the rapid change of TFs, which may be related to organisms’ adaptation to different environments.
Here, N-lobe was identified to have a stronger ability to bind iron ions compared with C-lobe. Previous studies have also indicated that the Fe-binding abilities are different among N-lobe and C-lobe, and N-lobe are easier to bind iron than C-lobe [16,17,66]. Moreover, the differential iron-binding activity also existed in amphioxus (Branchiostoma belcheri) [67], disk abalone (Haliotis discus discus) [68], and rock bream (Oplegnathus fasciatus) [10]. In addition, the linger regions of N- and C-lobes also affect the flexibility and Fe-binding rate of TF protein [69]. TF can perform some antibacterial activity through combining free iron and then creating a low iron level environment [70,71]. This study further confirmed that N-lobe are easier to bind iron than C-lobe [16,17,66]. Iron is a basic nutrient necessary for biology and participates in many important biological processes [1,2,3]. Therefore, maintaining a certain concentration of iron ions is necessary for the growth and metabolism of organisms. Under pathological conditions, the combination of TF and iron ions leads to the decrease in available iron concentration, which inhibits the growth of pathogens.
5. Conclusions
One TF gene from Amur stickleback was characterized by analyzing its expression, motif distribution, functional divergence, molecular evolution, iron-binding ability, and antibacterial properties. This TF gene was mainly expressed in liver and strongly induced by pathogenic bacteria. The N-lobe and C-lobe regions have different motif composition, selection pressure, and functional divergence in evolution. Moreover, different iron-binding activity and antibacterial characteristics also existed in the N-lobe and C-lobe of Amur stickleback TF protein. Therefore, in the process of evolution, the N-lobe and C-lobe domains of TF genes experienced different selection pressures, resulting in the changes of their motif composition and functional divergence and the differences of their iron-binding activity and antibacterial properties. This study will provide a basis for the subsequent study of TF family genes.
Supplementary Materials
The following supporting information can be downloaded at: https://www.mdpi.com/article/10.3390/ani12243458/s1, Figure S1: Quality detection and Western blot analysis of the expressed N-lobe and C-lobe segments after gel cutting; Supplementary Data S1: Transferrin and Actin sequences obtained from previous transcriptome sequencing data of Amur stickleback for primer designing in this study; Supplementary Data S2: Transferrin sequences used in this study. N-lobe and C-lobe segments are also marked.
Funding
The research was funded by Jiangsu University “Youth Backbone Teacher Training Project”.
Institutional Review Board Statement
All of the procedures complied with and were approved by the Institutional Animal Care and Use Committee (ethical approval number: UJS-LAER-2018120901 at 9/12/2018).
Data Availability Statement
The author confirms that all relevant data are included in the article and/or its Supplementary Data files.
Conflicts of Interest
The author declares no conflict of interest.
References
- Crichton, R.R.; Wilmet, S.; Legssyer, R.; Ward, R.J. Molecular and cellular mechanisms of iron homeostasis and toxicity in mammalian cells. J. Inorg. Biochem. 2002, 91, 9–18. [Google Scholar] [CrossRef]
- Neves, J.V.; Wilson, J.M.; Rodrigues, P.N. Transferrin and ferritin response to bacterial infection: The role of the liver and brain in fish. Dev. Comp. Immunol. 2009, 33, 848–857. [Google Scholar] [CrossRef] [PubMed]
- Gkouvatsos, K.; Papanikolaou, G.; Pantopoulos, K. Regulation of iron transport and the role of transferrin. Biochim. Biophys. Acta 2012, 1820, 188–202. [Google Scholar] [CrossRef] [PubMed]
- Byers, B.R.; Arceneaux, J.E. Microbial iron transport: Iron acquisition by pathogenic microorganisms. Met. Ions Biol. Syst. 1998, 35, 37–66. [Google Scholar]
- Aisen, P.; Enns, C.; Wessling-Resnick, M. Chemistry and biology of eukaryotic iron metabolism. Int. J. Biochem. Cell Biol. 2001, 33, 940–959. [Google Scholar] [CrossRef] [PubMed]
- Cheng, Y.; Zak, O.; Aisen, P.; Harrison, S.C.; Walz, T. Structure of the human transferrin receptor-transferrin complex. Cell 2004, 116, 565–576. [Google Scholar] [CrossRef] [Green Version]
- Anderson, G.J.; Frazer, D.M. Hepatic iron metabolism. Semin. Liver Dis. 2005, 25, 420–432. [Google Scholar] [CrossRef] [PubMed]
- Aisen, P.; Listowsky, I. Iron transport and storage proteins. Annu. Rev. Biochem. 1980, 49, 357–393. [Google Scholar] [CrossRef]
- Johnson, E.E.; Wessling-Resnick, M. Iron metabolism and the innate immune response to infection. Microbes Infect. 2012, 14, 207–216. [Google Scholar] [CrossRef] [Green Version]
- Perera, N.C.N.; Godahewa, G.I.; Hwang, J.Y.; Kwon, M.G.; Hwang, S.D.; Lee, J. Molecular, structural, and functional comparison of N lobe and C lobe of the transferrin from rock bream, Oplegnathus fasciatus, with respect to its immune response. Fish Shellfish Immunol. 2017, 68, 299–309. [Google Scholar] [CrossRef]
- Brown, J.P.; Hewick, R.M.; Hellström, I.; Hellström, K.E.; Doolittle, R.F.; Dreyer, W.J. Human melanoma-associated antigen p97 is structurally and functionally related to transferrin. Nature 1982, 296, 171–173. [Google Scholar] [CrossRef]
- Lambert, L.A. Molecular evolution of the transferrin family and associated receptors. Biochim. Biophys. Acta 2012, 1820, 244–255. [Google Scholar] [CrossRef] [PubMed]
- Richardson, D.R. The role of the membrane-bound tumour antigen, melanotransferrin (p97), in iron uptake by the human malignant melanoma cell. Eur. J. Biochem. 2000, 267, 1290–1298. [Google Scholar] [CrossRef]
- Teng, C.T. Lactoferrin: The path from protein to gene. Biometals 2010, 23, 359–364. [Google Scholar] [CrossRef]
- Giansanti, F.; Leboffe, L.; Pitari, G.; Ippoliti, R.; Antonini, G. Physiological roles of ovotransferrin. Biochim. Biophys. Acta 2012, 1820, 218–225. [Google Scholar] [CrossRef] [PubMed]
- Park, I.; Schaeffer, E.; Sidoli, A.; Baralle, F.E.; Cohen, G.N.; Zakin, M.M. Organization of the human transferrin gene: Direct evidence that it originated by gene duplication. Proc. Natl. Acad. Sci. USA 1985, 82, 3149–3153. [Google Scholar] [CrossRef] [PubMed] [Green Version]
- Lambert, L.A.; Perri, H.; Halbrooks, P.J.; Mason, A.B. Evolution of the transferrin family: Conservation of residues associated with iron and anion binding. Comp. Biochem. Physiol. B Biochem. Mol. Biol. 2005, 142, 129–141. [Google Scholar] [CrossRef]
- Lambert, L.A.; Perri, H.; Meehan, T.J. Evolution of duplications in the transferrin family of proteins. Comp. Biochem. Physiol. B Biochem. Mol. Biol. 2005, 140, 11–25. [Google Scholar] [CrossRef]
- Jamroz, R.C.; Gasdaska, J.R.; Bradfield, J.Y.; Law, J.H. Transferrin in a cockroach: Molecular cloning, characterization, and suppression by juvenile hormone. Proc. Natl. Acad. Sci. USA 1993, 90, 1320–1324. [Google Scholar] [CrossRef] [Green Version]
- Ellis, A.E. Innate host defense mechanisms of fish against viruses and bacteria. Dev. Comp. Immunol. 2001, 25, 827–839. [Google Scholar] [CrossRef]
- Skaar, E.P. The battle for iron between bacterial pathogens and their vertebrate hosts. PLoS Pathog. 2010, 6, e1000949. [Google Scholar] [CrossRef] [PubMed] [Green Version]
- Stafford, J.L.; Belosevic, M. Transferrin and the innate immune response of fish: Identification of a novel mechanism of macrophage activation. Dev. Comp. Immunol. 2003, 27, 539–554. [Google Scholar] [CrossRef]
- Trites, M.J.; Barreda, D.R. Contributions of transferrin to acute inflammation in the goldfish, C. auratus. Dev. Comp. Immunol. 2017, 67, 300–309. [Google Scholar] [CrossRef] [PubMed]
- Haddad, G.; Belosevic, M. Transferrin-derived synthetic peptide induces highly conserved pro-inflammatory responses of macrophages. Mol. Immunol. 2009, 46, 576–586. [Google Scholar] [CrossRef]
- Stafford, J.L.; Neumann, N.F.; Belosevic, M. Products of proteolytic cleavage of transferrin induce nitric oxide response of goldfish macrophages. Dev. Comp. Immunol. 2001, 25, 101–115. [Google Scholar] [CrossRef] [PubMed]
- Zhang, X.; Mosser, D.M. Macrophage activation by endogenous danger signals. J. Pathol. 2008, 214, 161–178. [Google Scholar] [CrossRef]
- Trinchella, F.; Parisi, E.; Scudiero, R. Evolutionary analysis of the transferrin gene in Antarctic Notothenioidei: A history of adaptive evolution and functional divergence. Mar. Genom. 2008, 1, 95–101. [Google Scholar] [CrossRef]
- Laurent, P.; Rodellar, C. Characterization of a single nucleotide polymorphism in the coding sequence of the bovine transferrin gene. Mutat. Res. 2001, 458, 1–5. [Google Scholar] [CrossRef]
- Ford, M.J.; Thornton, P.J.; Park, L.K. Natural selection promotes divergence of transferrin among salmonid species. Mol. Ecol. 1999, 8, 1055–1061. [Google Scholar] [CrossRef]
- Teixeira, A.S.; Jamieson, A.; Raposo, J.C. Transferrin polymorphism in Central Amazon populations of pescada, Plagioscion squamosissimus. Genet. Mol. Res. 2002, 1, 216–226. [Google Scholar] [PubMed]
- Yang, L.; Gui, J.F. Positive selection on multiple antique allelic lineages of transferrin in the polyploid Carassius auratus. Mol. Biol. Evol. 2004, 21, 1264–1277. [Google Scholar] [CrossRef]
- Yang, L.; Zhou, L.; Gui, J.F. Molecular basis of transferrin polymorphism in goldfish (Carassius auratus). Genetica 2004, 121, 303–313. [Google Scholar] [CrossRef] [PubMed] [Green Version]
- Rengmark, A.H.; Lingaas, F. Genomic structure of the Nile tilapia (Oreochromis niloticus) transferrin gene and a haplotype associated with saltwater tolerance. Aquaculture 2007, 272, 146–155. [Google Scholar] [CrossRef]
- Antunes, A.; Templeton, A.R.; Guyomard, R.; Alexandrino, P. The role of nuclear genes in intraspecific evolutionary inference: Genealogy of the transferrin gene in the brown trout. Mol. Biol. Evol. 2002, 19, 1272–1287. [Google Scholar] [CrossRef] [PubMed] [Green Version]
- Andersen, Ø.; De Rosa, M.C.; Pirolli, D.; Tooming-Klunderud, A.; Petersen, P.E.; André, C. Polymorphism, selection and tandem duplication of transferrin genes in Atlantic cod (Gadus morhua)-conserved synteny between fish monolobal and tetrapod bilobal transferrin loci. BMC Genet. 2011, 12, 51. [Google Scholar] [CrossRef] [Green Version]
- Gao, J.; Ding, S.; Huang, X.; Shi, X. Cloning and expression characterization of the serum transferrin gene in the Chinese black sleeper (Bostrichthys sinensis). Gene 2013, 515, 89–98. [Google Scholar] [CrossRef]
- Jurecka, P.; Irnazarow, I.; Westphal, A.H.; Forlenza, M.; Arts, J.A.; Savelkoul, H.F.; Wiegertjes, G.F. Allelic discrimination, three-dimensional analysis and gene expression of multiple transferrin alleles of common carp (Cyprinus carpio L.). Fish Shellfish Immunol. 2009, 26, 573–581. [Google Scholar] [CrossRef]
- Ding, Z.; Zhao, X.; Su, L.; Zhou, F.; Chen, N.; Wu, J.; Fu, X.; Wu, F.; Wang, W.; Liu, H. The Megalobrama amblycephala transferrin and transferrin receptor genes: Molecular cloning, characterization and expression during early development and after Aeromonas hydrophila infection. Dev. Comp. Immunol. 2015, 49, 290–297. [Google Scholar] [CrossRef]
- Denovan-Wright, E.M.; Ramsey, N.B.; McCormick, C.J.; Lazier, C.B.; Wright, J.M. Nucleotide sequence of transferrin cDNAs and tissue-specific of the transferrin gene in Atlantic cod (Gadus morhua). Comp. Biochem. Physiol. B Biochem. Mol. Biol. 1996, 113, 269–273. [Google Scholar] [CrossRef] [PubMed]
- Liu, H.; Takano, T.; Abernathy, J.; Wang, S.; Sha, Z.; Jiang, Y.; Terhune, J.; Kucuktas, H.; Peatman, E.; Liu, Z. Structure and expression of transferrin gene of channel catfish, Ictalurus punctatus. Fish Shellfish Immunol. 2010, 28, 159–166. [Google Scholar] [CrossRef]
- Tange, N.; Jong-Young, L.; Mikawa, N.; Hirono, I.; Aoki, T. Cloning and characterization of transferrin cDNA and rapid detection of transferrin gene polymorphism in rainbow trout (Oncorhynchus mykiss). Mol. Mar. Biol. Biotechnol. 1997, 6, 351–356. [Google Scholar]
- Nynca, J.; Dietrich, M.A.; Adamek, M.; Steinhagen, D.; Bilińska, B.; Hejmej, A.; Ciereszko, A. Purification, characterization and expression of transferrin from rainbow trout seminal plasma. Comp. Biochem. Physiol. B Biochem. Mol. Biol. 2017, 208–209, 38–46. [Google Scholar] [CrossRef] [PubMed]
- Poochai, W.; Choowongkomon, K.; Srisapoome, P.; Unajak, S.; Areechon, N. Characterization and expression analysis of the transferrin gene in Nile tilapia (Oreochromis niloticus) and its upregulation in response to Streptococcus agalactiae infection. Fish Physiol. Biochem. 2014, 40, 1473–1485. [Google Scholar] [CrossRef]
- Livak, K.J.; Schmittgen, T.D. Analysis of Relative Gene Expression Data Using Real-Time Quantitative PCR and the 2−ΔΔCT Method. Methods 2001, 25, 402–408. [Google Scholar] [CrossRef]
- Cao, J.; Cheng, X. Transcriptome-based identification and molecular evolution of the Cytochrome P450 genes and expression profiling under dimethoate treatment in Amur stickleback (Pungitius sinensis). Animals 2019, 9, 873. [Google Scholar] [CrossRef] [PubMed] [Green Version]
- Yates, A.D.; Achuthan, P.; Akanni, W.; Allen, J.; Allen, J.; Alvarez-Jarreta, J.; Amode, M.R.; Armean, I.M.; Azov, A.G.; Bennett, R.; et al. Ensembl 2020. Nucleic Acids Res. 2020, 48, D682–D688. [Google Scholar] [CrossRef]
- El-Gebali, S.; Mistry, J.; Bateman, A.; Eddy, S.R.; Luciani, A.; Potter, S.C.; Qureshi, M.; Richardson, L.J.; Salazar, G.A.; Smart, A.; et al. The Pfam protein families database in 2019. Nucleic Acids Res. 2019, 47, D427–D432. [Google Scholar] [CrossRef]
- Edgar, R.C. MUSCLE: Multiple sequence alignment with high accuracy and high throughput. Nucleic Acids Res. 2004, 32, 1792–1797. [Google Scholar] [CrossRef] [Green Version]
- Tamura, K.; Stecher, G.; Peterson, D.; Filipski, A.; Kumar, S. MEGA6: Molecular Evolutionary Genetics Analysis version 6.0. Mol. Biol. Evol. 2013, 30, 2725–2729. [Google Scholar] [CrossRef] [PubMed] [Green Version]
- Bailey, T.L.; Williams, N.; Misleh, C.; Li, W.W. MEME: Discovering and analyzing DNA and protein sequence motifs. Nucleic Acids Res. 2006, 34, W369–W373. [Google Scholar] [CrossRef]
- Gu, X. Maximum-likelihood approach for gene family evolution under functional divergence. Mol. Biol. Evol. 2001, 18, 453–464. [Google Scholar] [CrossRef] [PubMed] [Green Version]
- Gaucher, E.A.; Gu, X.; Miyamoto, M.M.; Benner, S.A. Predicting functional divergence in protein evolution by site-specific rate shifts. Trends Biochem. Sci. 2002, 27, 315–321. [Google Scholar] [CrossRef] [PubMed]
- Yang, Z. Maximum likelihood phylogenetic estimation from DNA sequences with variable rates over sites: Approximate methods. J. Mol. Evol. 1994, 39, 306–314. [Google Scholar] [CrossRef] [Green Version]
- Stern, A.; Doron-Faigenboim, A.; Erez, E.; Martz, E.; Bacharach, E.; Pupko, T. Selecton 2007: Advanced models for detecting positive and purifying selection using a Bayesian inference approach. Nucleic Acids Res. 2007, 35, W506–W511. [Google Scholar] [CrossRef] [Green Version]
- Yang, J.; Yan, R.; Roy, A.; Xu, D.; Poisson, J.; Zhang, Y. The I-TASSER Suite: Protein structure and function prediction. Nat. Methods 2015, 12, 7–8. [Google Scholar] [CrossRef] [Green Version]
- Schwyn, B.; Neilands, J.B. Universal chemical assay for the detection and determination of siderophores. Anal. Biochem. 1987, 160, 47–56. [Google Scholar] [CrossRef]
- Beutler, E.; Gelbart, T.; Lee, P.; Trevino, R.; Fernandez, M.A.; Fairbanks, V.F. Molecular characterization of a case of atransferrinemia. Blood 2000, 96, 4071–4074. [Google Scholar] [CrossRef] [PubMed]
- Sahoo, P.K.; Mohanty, B.R.; Kumari, J.; Barat, A.; Sarangi, N. Cloning, nucleotide sequence and phylogenetic analyses, and tissue-specific expression of the transferrin gene in Cirrhinus mrigala infected with Aeromonas hydrophila. Comp. Immunol. Microbiol. Infect. Dis. 2009, 32, 527–537. [Google Scholar] [CrossRef]
- Yin, X.; Yang, Y.; Han, K.; Wu, L.; Wu, H.; Bian, X.; Wei, X.; Guo, Z.; Mu, L.; Ye, J. Purification and functional characterization of serum transferrin from Nile tilapia (Oreochromis niloticus). Fish Shellfish Immunol. 2019, 88, 36–46. [Google Scholar] [CrossRef]
- Guz, N.; Attardo, G.M.; Wu, Y.; Aksoy, S. Molecular aspects of transferrin expression in the tsetse fly (Glossina morsitans morsitans). J. Insect Physiol. 2007, 53, 715–723. [Google Scholar] [CrossRef] [Green Version]
- Yoshiga, T.; Hernandez, V.P.; Fallon, A.M.; Law, J.H. Mosquito transferrin, an acute-phase protein that is up-regulated upon infection. Proc. Natl. Acad. Sci. USA 1997, 94, 12337–12342. [Google Scholar] [CrossRef] [Green Version]
- He, Q.Y.; Mason, A.B.; Woodworth, R.C.; Tam, B.M.; MacGillivray, R.T.; Grady, J.K.; Chasteen, N.D. Inequivalence of the two tyrosine ligands in the N-lobe of human serum transferrin. Biochemistry 1997, 36, 14853–14860. [Google Scholar] [CrossRef] [PubMed]
- Mason, A.B.; Halbrooks, P.J.; James, N.G.; Connolly, S.A.; Larouche, J.R.; Smith, V.C.; MacGillivray, R.T.; Chasteen, N.D. Mutational analysis of C-lobe ligands of human serum transferrin: Insights into the mechanism of iron release. Biochemistry 2005, 44, 8013–8021. [Google Scholar] [CrossRef]
- Hurst, L.D. The Ka/Ks ratio: Diagnosing the form of sequence evolution. Trends Genet. 2002, 18, 486. [Google Scholar] [CrossRef]
- Ford, M.J. Molecular evolution of transferrin: Evidence for positive selection in salmonids. Mol. Biol. Evol. 2001, 18, 639–647. [Google Scholar] [CrossRef] [Green Version]
- Zak, O.; Aisen, P. A new method for obtaining human transferrin C-lobe in the native conformation: Preparation and properties. Biochemistry 2002, 41, 1647–1653. [Google Scholar] [CrossRef] [PubMed]
- Liu, J.; Zhang, S.; Li, L. A transferrin-like homolog in amphioxus Branchiostoma belcheri: Identification, expression and functional characterization. Mol. Immunol. 2009, 46, 3117–3124. [Google Scholar] [CrossRef]
- Herath, H.M.; Elvitigala, D.A.; Godahewa, G.I.; Whang, I.; Lee, J. Molecular insights into a molluscan transferrin homolog identified from disk abalone (Haliotis discus discus) evidencing its detectable role in host antibacterial defense. Dev. Comp. Immunol. 2015, 53, 222–233. [Google Scholar] [CrossRef] [PubMed]
- Wally, J.; Halbrooks, P.J.; Vonrhein, C.; Rould, M.A.; Everse, S.J.; Mason, A.B.; Buchanan, S.K. The crystal structure of iron-free human serum transferrin provides insight into inter-lobe communication and receptor binding. J. Biol. Chem. 2006, 281, 24934–24944. [Google Scholar] [CrossRef] [Green Version]
- Gomme, P.T.; McCann, K.B.; Bertolini, J. Transferrin: Structure, function and potential therapeutic actions. Drug Discov. Today 2005, 10, 267–273. [Google Scholar] [CrossRef]
- Dietrich, M.A.; Zmijewski, D.; Karol, H.; Hejmej, A.; Bilińska, B.; Jurecka, P.; Irnazarow, I.; Słowińska, M.; Hliwa, P.; Ciereszko, A. Isolation and characterization of transferrin from common carp (Cyprinus carpio L.) seminal plasma. Fish Shellfish Immunol. 2010, 29, 66–74. [Google Scholar] [CrossRef] [PubMed]
Figure 1.
Alignment of transferrin amino acid sequences between P. sinensis (marked with red asterisks) and other seven fish species randomly selected. The N-lobe and C-lobe areas are marked with arrows.
Figure 1.
Alignment of transferrin amino acid sequences between P. sinensis (marked with red asterisks) and other seven fish species randomly selected. The N-lobe and C-lobe areas are marked with arrows.

Figure 2.
Expression patterns of TF gene in P. sinensis. (A) Relative expression level of the TF gene in six healthy tissues of P. sinensis (liver, intestine, kidney, muscle, gill, and heart) by qRT-PCR. Different letters indicated statistical significance at the level of p < 0.05. Values were described as mean ± SE (n = 3). (B) Relative expression pattern of the P. sinensis TF gene in the liver after Streptococcus iniae infection by qRT-PCR. Values were described as mean ± SE (n = 3). The asterisks indicated statistically significant differences from the control group (* p < 0.05).

Figure 3.
Phylogenetic relationship of N-lobe and C-lobe of TF proteins in 45 fish species. NJ tree was constructed with 1000 bootstrap replicates. Amur stickleback is marked with red asterisks.
Figure 3.
Phylogenetic relationship of N-lobe and C-lobe of TF proteins in 45 fish species. NJ tree was constructed with 1000 bootstrap replicates. Amur stickleback is marked with red asterisks.
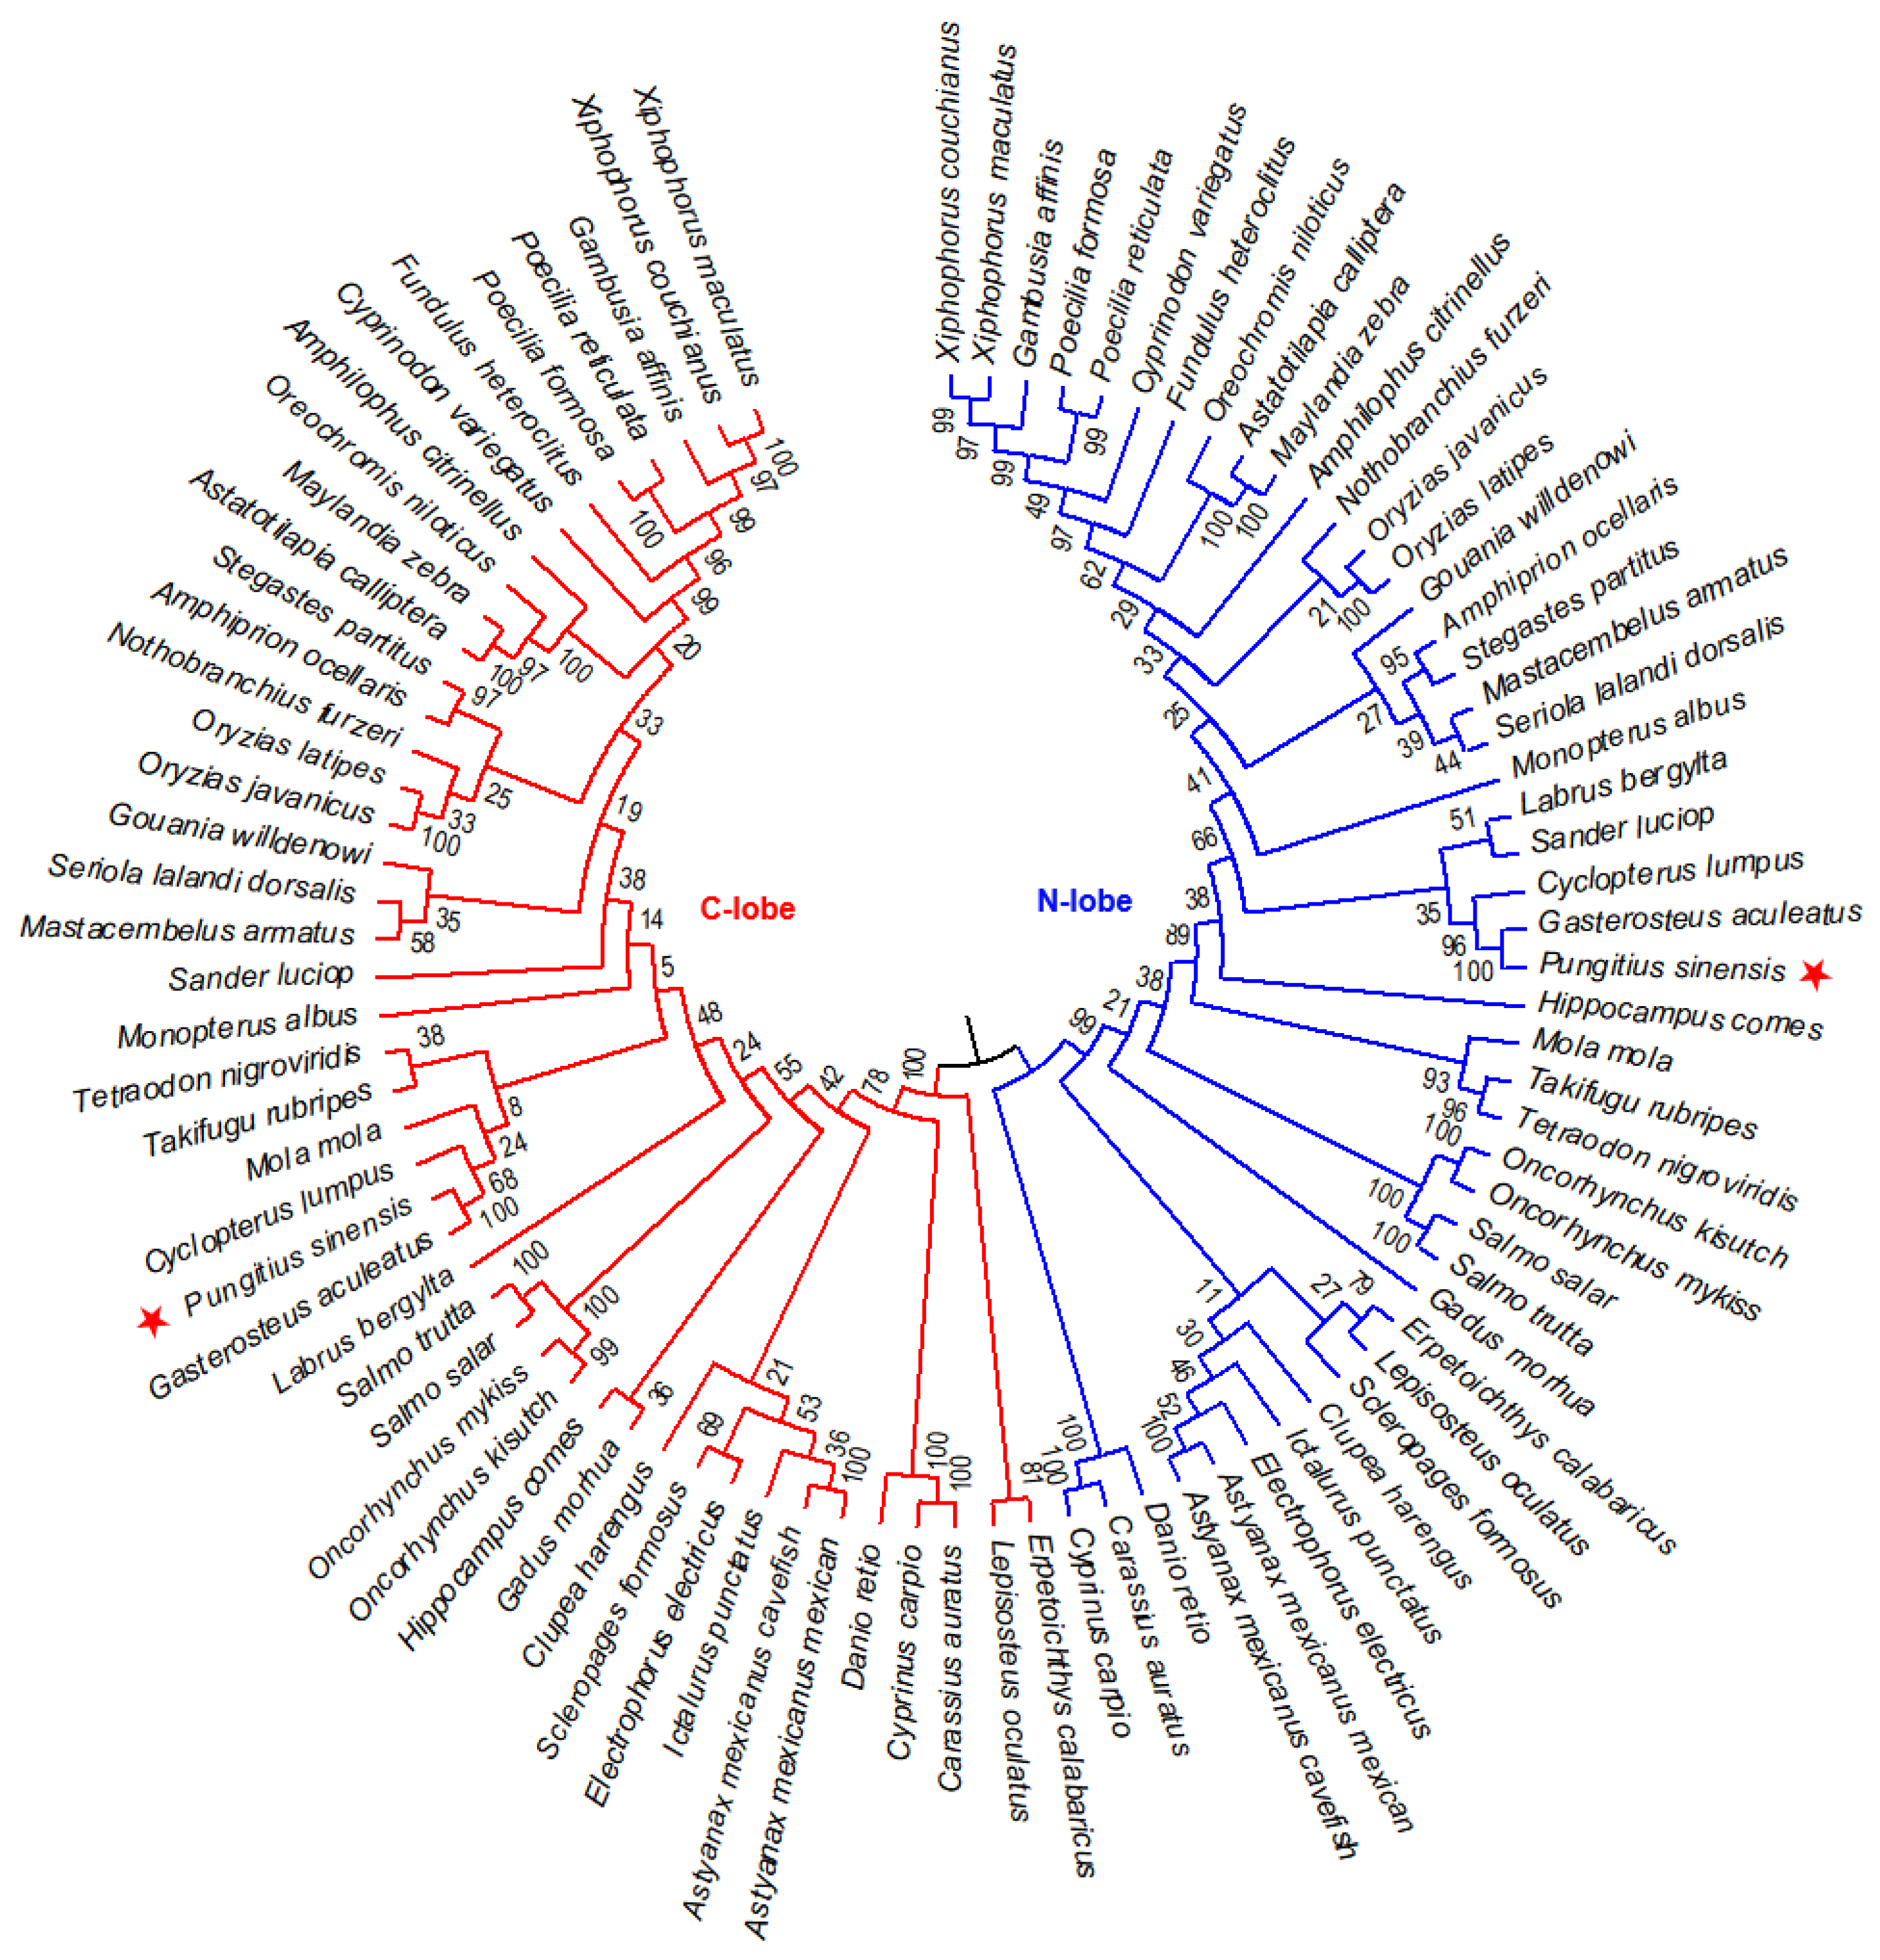
Figure 4.
Motif distribution of N-lobe and C-lobe of TF proteins. Sequence logos of six conserved motifs are also shown here. Four iron-binding residues are marked with red stars, and two anion binding residues are marked with green stars. The size of the letter represents the degree of conservation of the amino acid. The larger the letter, the more conservative the amino acid.

Figure 5.
Three-dimensional structure of the N-lobe of TF protein in Amur stickleback predicted with the I-TASSER server [55]. Seventeen positive selection sites predicted by M8 model are marked with arrows.
Figure 5.
Three-dimensional structure of the N-lobe of TF protein in Amur stickleback predicted with the I-TASSER server [55]. Seventeen positive selection sites predicted by M8 model are marked with arrows.
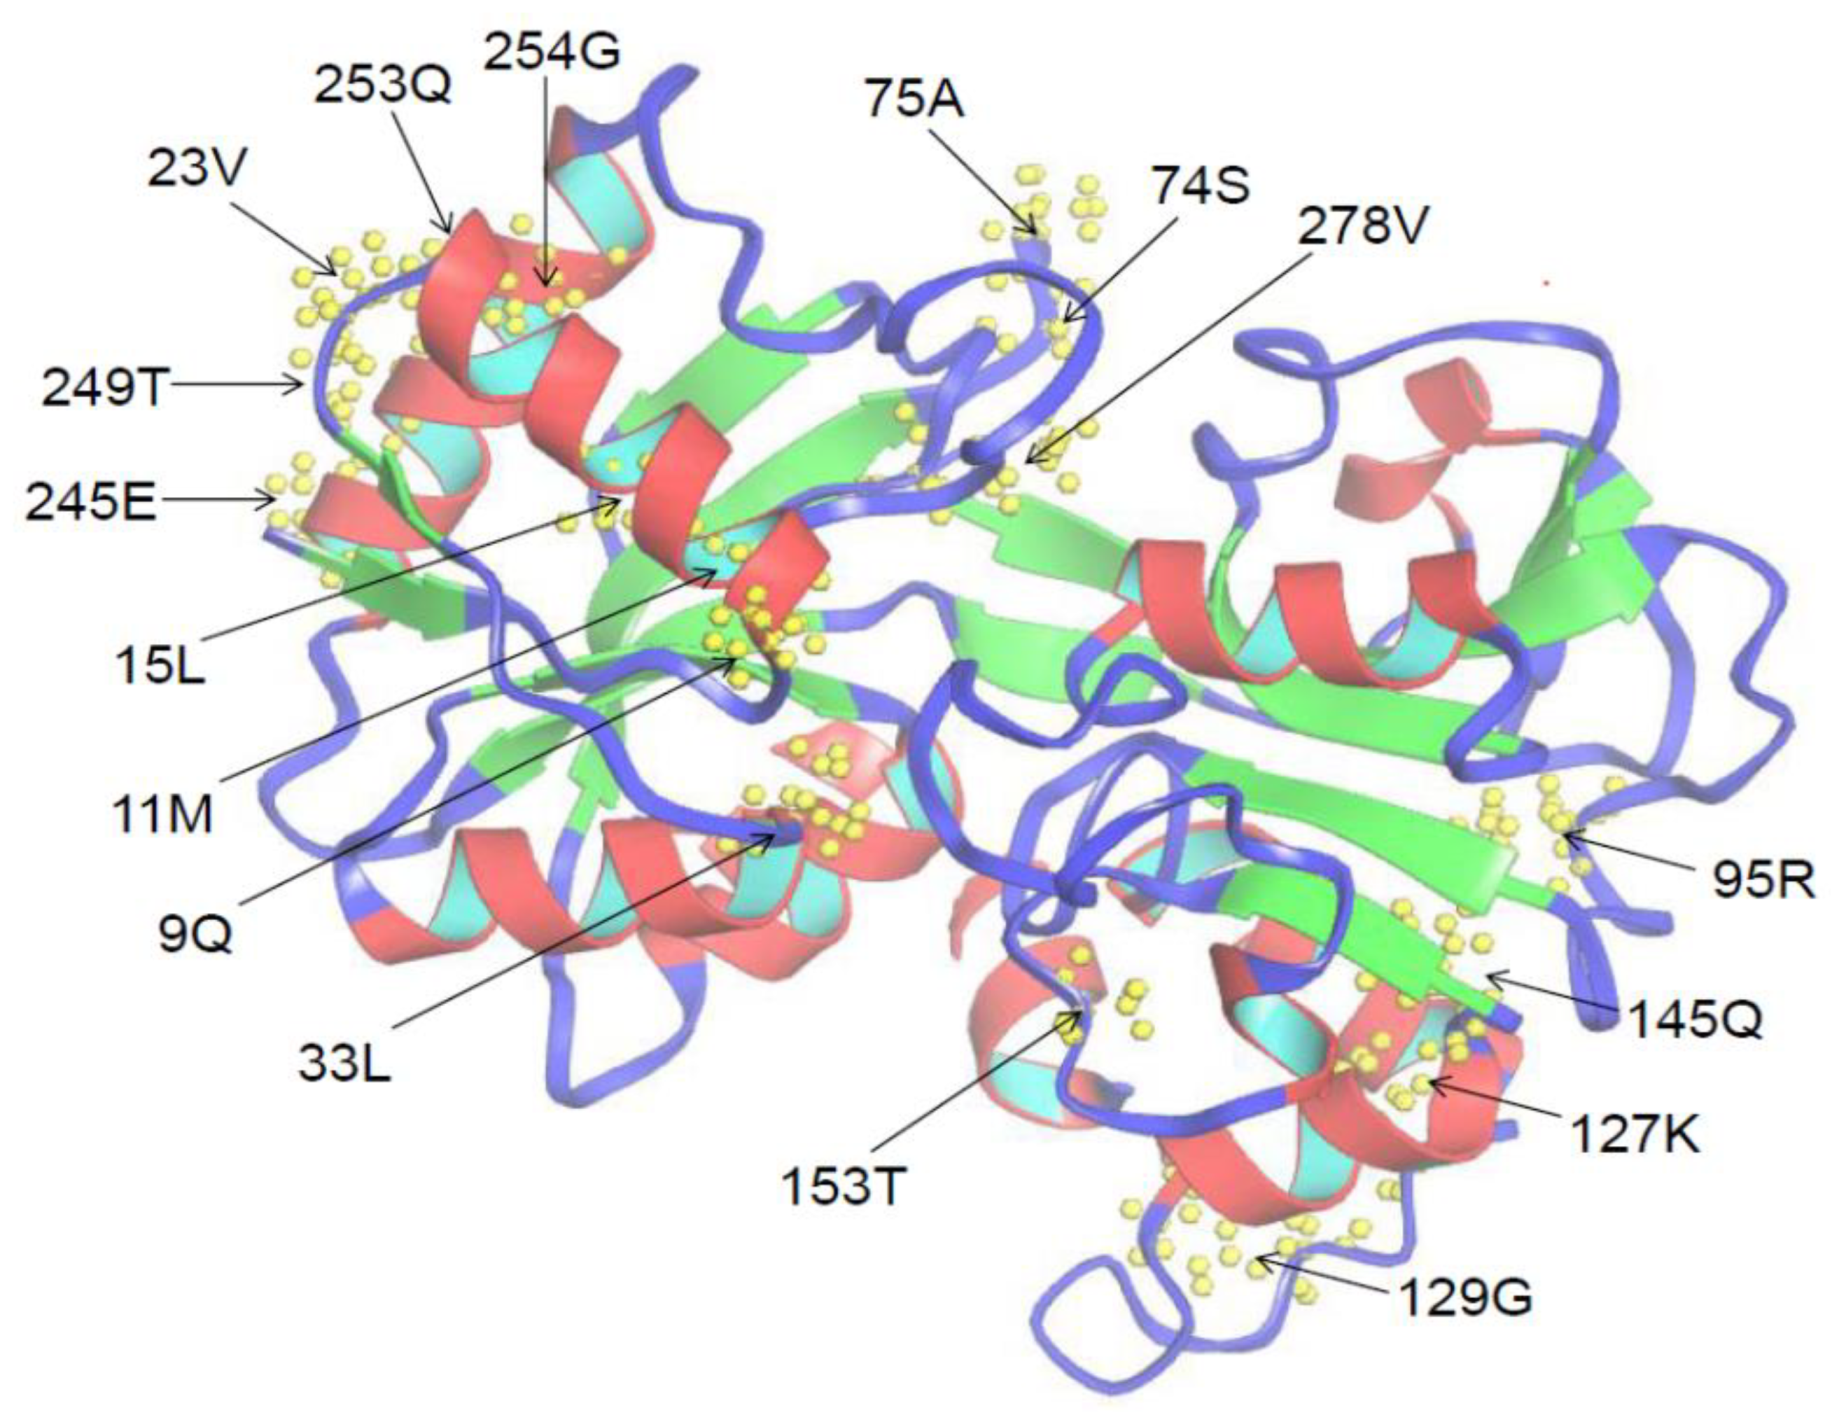
Figure 6.
Protein expression and iron-binding activity. (A) SDS-PAGE analysis of Amur stickleback TF N-lobe and C-lobe. Lines: M—marker; N1 and N2—soluble fraction after sonication of N-lobe expressed cells; N3 and N4—purified N-lobe fragments after elution; C1 and C2—soluble fraction after sonication of C-lobe expressed cells; C3 and C4—purified C-lobe fragments after elution; (B) Iron-binding activity of the TF N-lobe and C-lobe in Amur stickleback. The x-axis represents the protein concentration, and the y-axis represents the light absorption value at 630 nm. Values were described as mean ± SE (n = 3). Asterisks (* p < 0.05; ** p < 0.01) indicated the statistically significant differences between treatments.

Figure 7.
Analysis of iron-dependent bacterial growth inhibition. The x-axis represents time, and the y-axis represents the light absorption value at 600 nm. Values were described as mean ± SE (n = 3). Asterisks (* p < 0.05; ** p < 0.01) indicated the statistically significant differences between treatments. MBP: maltose binding protein; OD: optical density.


Table 1.
Primers used in this study.
| Primers | Nucleotide Sequences (5′-3′) | Purpose |
|---|---|---|
| N-F | GAGAGACATATGACGGTGAAGTGGTGCGTCACGT | Protein expression |
| N-R | GAGAGATCTAGAAAGGGAACTGATGCTACTCATGTA | Protein expression |
| C-F | GAGAGACATATGTCCTCTGCCATTAAATGGTGCGCTGT | Protein expression |
| C-R | GAGAGATCTAGATCTGAGCGAAGTCATGGCATCCAT | Protein expression |
| TF-F | CTCACGCTGTTGTCAGCCGTAAG | RT-qPCR |
| TF-R | GCACTCTTCAACTGTAGGGGCA | RT-qPCR |
| actin-F | TGCTGATTGGCATGGATGAGGCC | RT-qPCR |
| actin-R | TCTGGAATGTCGTGAGGGACGAT | RT-qPCR |
Table 2.
Type I functional divergence between the N-lobe and the C-lobe of fish transferrin gene family. The critical sites are displayed by residues on the N-lobe.
Table 2.
Type I functional divergence between the N-lobe and the C-lobe of fish transferrin gene family. The critical sites are displayed by residues on the N-lobe.
| Comparison | Type I θI ± SE | LRT | Posterior Probability (>0.8) | Critical Sites |
|---|---|---|---|---|
| N-lobe/C-lobe | 0.599 ± 0.067 | 79.847 | 17 | 52A, 53G, 58I, 59T, 65I, 74D, 78I, 112G, 114T, 115F, 116G, 117I, 122G, 123K, 125S, 130L, 142T |
Table 3.
Type II functional divergence between the N-lobe and the C-lobe of fish transferrin gene family. The critical sites are displayed by residues on the N-lobe.
Table 3.
Type II functional divergence between the N-lobe and the C-lobe of fish transferrin gene family. The critical sites are displayed by residues on the N-lobe.
| Comparison | Type II θII ± SE | Posterior Probability (>0.8) | Critical Sites |
|---|---|---|---|
| N-lobe/C-lobe | 0.166 ± 0.219 | 10 | 52A, 53G, 59T, 64D, 72N, 73Y, 74D, 76Q, 83D, 142T |
Table 4.
Likelihood values and parameter estimates for N-lobe and C-lobe of TF genes. Ka/Ks: the synonymous rate (Ks) and non-synonymous rate (Ka) of nucleotide substitution; ωs: beta + w.
Table 4.
Likelihood values and parameter estimates for N-lobe and C-lobe of TF genes. Ka/Ks: the synonymous rate (Ks) and non-synonymous rate (Ka) of nucleotide substitution; ωs: beta + w.
| Gene Branches | Selection Model | Ka/Ks | Log-Likelihood | Positive-Selection Sites |
|---|---|---|---|---|
| N-lobe | M8 (ωs ≥ 1) | 0.2902 | −19,184 | 9Q; 11M; 15L; 23V; 33L; 74S; 75A; 95R; 127K; 129G; 145Q; 153T; 245E; 249T; 253Q; 254G; 278V |
| M8a (ωs = 1) | 0.2799 | −19,186.2 | / | |
| M7 (beta) | 0.2739 | −19,194.8 | / | |
| M5 (gamma) | 0.2858 | −19,188 | / | |
| C-lobe | M8 (ωs ≥ 1) | 0.3769 | −21,704.9 | 2S; 15A; 29T; 31S; 36N; 38P; 80Q; 81D; 82L; 85R; 86A; 87D; 89T; 136V; 138N; 157S; 162S; 165V; 211Q; 220D; 224S; 228S; 238A; 243T; 246A; 252N; 266A; 270R; 281G; 282Q; 286P; 287A; 295N; 313A; 315R; 316S; 323P; 327D; 330K |
| M8a (ωs = 1) | 0.3187 | −21,730.7 | / | |
| M7 (beta) | 0.3061 | −21,757.7 | / | |
| M5 (gamma) | 03797 | −21,711.6 | 2S; 15A; 19T; 26T; 29T; 31S; 36N; 38P; 80Q; 81D; 82L; 85R; 86A; 87D; 89T; 132Q; 136V; 138N; 157S; 162S; 165V; 211Q; 220D; 224S; 228S; 238A; 241E; 243T; 246A; 247S; 252N; 266A; 270R; 278R; 281G; 282Q; 286P; 287A; 295N; 313A; 315R; 316S; 319E; 323P; 327D; 330K |
Publisher’s Note: MDPI stays neutral with regard to jurisdictional claims in published maps and institutional affiliations. |
© 2022 by the author. Licensee MDPI, Basel, Switzerland. This article is an open access article distributed under the terms and conditions of the Creative Commons Attribution (CC BY) license (https://creativecommons.org/licenses/by/4.0/).
Share and Cite
MDPI and ACS Style
Cao, J. Functional Divergence of the N-Lobe and C-Lobe of Transferrin Gene in Pungitius sinensis (Amur Stickleback). Animals 2022, 12, 3458. https://doi.org/10.3390/ani12243458
AMA Style
Cao J. Functional Divergence of the N-Lobe and C-Lobe of Transferrin Gene in Pungitius sinensis (Amur Stickleback). Animals. 2022; 12(24):3458. https://doi.org/10.3390/ani12243458
Chicago/Turabian StyleCao, Jun. 2022. "Functional Divergence of the N-Lobe and C-Lobe of Transferrin Gene in Pungitius sinensis (Amur Stickleback)" Animals 12, no. 24: 3458. https://doi.org/10.3390/ani12243458
Note that from the first issue of 2016, this journal uses article numbers instead of page numbers. See further details here.