
Microbiological Composition of Diets of Cactus Pear-Based with Increasing Levels of Buffel Grass Hay and Relationship to Nutritional Disorders in Sheep

 , ,
, ,  ,
,  ,
,
Abstract
:Simple Summary
Abstract
1. Introduction
2. Materials and Methods
2.1. Place and Period of Execution of the Experiment
2.2. Animal Management and Experimental Treatments
2.3. Food Management and Consumption
2.4. Food Sampling and Analysis
2.5. Blood Collections, Serum and Physiological Parameters
2.6. Fecal Score and Microbial Population Count
2.7. Statistical Analysis
2.7.1. Blood, Microbiological Count and Physiological Parameters
2.7.2. Fecal Score
3. Results
4. Discussion
5. Conclusions
Author Contributions
Funding
Institutional Review Board Statement
Conflicts of Interest
References
- Souza, B.B. Leite de Cabra: Raças Utilizadas e Sistemas de Alimentação Utilizados no Cariri Paraibano. 2015. Available online: https://www.milkpoint.com.br/artigos/producao/leite-de-cabra-racas-utilizadas-e-sistemas-de-alimentacao-utilizados-no-cariri-paraibano-70309n.a%E2%80%A6 (accessed on 7 October 2019).
- Pinho, R.M.A.; Santos, E.M.; Oliveira, J.S.; Carvalho, G.G.P.; Silva, T.C.; Macedo, A.J.S.; Correa, Y.R.; Zanine, A.M. Does the level of forage neutral detergent fiber affect the ruminal fermentation, digestibility and feeding behavior of goats fed cactus pear? Anim. Sci. J. 2018, 89, 1424–1431. [Google Scholar] [CrossRef] [PubMed]
- Santos, A.O.A.; Batista, A.M.; Mustafa, A.; Amorim, G.L.; Guim, A.; Moraes, A.C.; Lucena, R.B.; Andrade, R. Effects of Bermudagrass hay and soybean hulls inclusion on performance of sheep fed cactus-based diets. Trop. Anim. Health Prod. 2010, 42, 487–494. [Google Scholar] [CrossRef] [PubMed]
- Paulino, R.S.; Oliveira, J.S.; Santos, E.M.; Pereira, G.A.; Ramos, J.P.F.; Cesar Neto, J.M.; Cruz, G.F.L.; Leite, G.M.; Satake, F.; Silva, A.L.; et al. Spineless cactus use management on microbiological quality, performance, and nutritional disorders in sheep. Trop. Anim. Health Prod. 2021, 53, 53–168. [Google Scholar] [CrossRef] [PubMed]
- Pinho, R.M.A.; Santos, E.M.; Oliveira, J.S.; Bezerra, H.F.; Carvalho, G.G.P.; Campos, F.S.; Pereira, G.A.; Correia, R.M. Avaliação de fenos de capim-buffel colhido em diferentes alturas de corte. Rev. Bras. Saúde Prod. Anim. 2013, 14, 437–447. [Google Scholar] [CrossRef] [Green Version]
- Edvan, R.L.; Santos, E.M.; Da Silva, D.S.; De Andrade, A.P.; Costa, R.G.; Vasconcelos, W.A. Características de produção do capim-buffelsubmetido a intensidades e frequências de corte. Arch. Zootec. 2011, 60, 1281–1289. [Google Scholar] [CrossRef] [Green Version]
- National Research Council (NRC). Nutrient Requirements of Small Ruminants: Sheep, Goats, Cervids, and New World Camelids; The National Academies Press: Washington, DC, USA, 2007. [Google Scholar]
- Association of Official Analytical Chemists. Official Methods of Analysis, 19th ed.; AOAC: Gaithersburg, MD, USA, 2012; p. 2610. [Google Scholar]
- Van Soest, P.J. Nutricional Ecology of the Ruminant, 2nd ed.; Cornell University Press: Ithaca, NY, USA, 1994; 476p. [Google Scholar]
- Sniffen, C.J.; O’Connor, J.D.; Van Soest, J.P.; Fox, D.G.; Russell, J.B. A net carbohydrate and protein system for evaluating cattle diets: II. Carbohydrate and protein availability. J. Anim. Sci. 1992, 70, 3562–3577. [Google Scholar] [CrossRef] [PubMed]
- Collier, H.B. Standardizations of blood haemoglobin determinations. Can. Med. Assoc. J. 1994, 50, 550–552. [Google Scholar]
- Rosenfeld, G. Método rápido de coloração de esfregaços de sangue. Noções práticas sobre corantes pancrônicos e estudos de diversos fatores. Mem. Inst. Butantà 1947, 20, 315–328. [Google Scholar]
- Rosalinski-moraes, F.; Fernandes, F.G.; Munaretto, A.; Oliveira, S.; Wilmsen, M.O.; Pereira, M.W.; Meirelles, A.C.F. Método FAMACHA©, escore corporal e de diarreia como indicadores de tratamento anti- helmíntico seletivo de ovelhas em reprodução. Biosci. J. 2012, 28, 1–12. [Google Scholar]
- Bezerra, H.F.C.; Santos, E.M.; Oliveira, J.S.; Pinho, R.M.A.; Perazzo, A.F.; Silva, A.P.G.; Ramos, J.P.F.; Pereira, G.A. Fenos de capim-buffel amonizados com ureia. Rev. Bras. Saúde Prod. Anim. 2014, 3, 561–569. [Google Scholar] [CrossRef]
- Macêdo, A.J.S.; Santos, E.M.; Oliveira, J.S.; Perazzo, A.F. Microbiologia de silagens: Revisão de Literatura. REDVET. Rev. Electrón. Vet. 2017, 18, 1–11. [Google Scholar]
- Wanapat, M.; Cherdthong, A. Use of Real-Time PCR Technique in Studying Rumen Cellulolytic Bacteria Population as Affected by Level of Roughage in Swamp Buffalo. Curr. Microbiol. 2008, 58, 294–299. [Google Scholar] [CrossRef] [PubMed]
- Pereira, G.A.; Santos, E.M.; Oliveira, J.S.; Araujo, G.G.L.; Paulino, R.S.; Perazzo, A.F.; Ramos, J.P.F.; Cesar Neto, J.M.; Cruz, G.F.L.; Leite, G.M. Intake, nutrient digestibility, nitrogen balance, and microbial protein synthesis in sheep fed spineless cactus silage. Small Rumin. Res. 2021, 194, 1–22. [Google Scholar] [CrossRef]
- Vedovatto, M.G.; Bento, A.L.; Kiefer, C.; Souza, K.M.R.; Franco, G.F. Micotoxinas na dieta de bovinos de corte: Revisão. Arch. Zootec. 2020, 69, 234–244. [Google Scholar] [CrossRef] [Green Version]
- Sousa, N.M.; Oliveira, J.S.; Santos, E.M.; Medeiros, A.N.; Brito, E.A. Levels of neutral detergent fiber in diets with forage palm for dairy goats. Arq. Bras. Med. Vet. Zootec. 2018, 70, 1595–1604. [Google Scholar] [CrossRef] [Green Version]
- Halfen, J.; Rahal, N.M.; Barbosa, A.A.; Corrêa, M.N.; Del Pino, F.A.B.; Brauner, C.C.; Schmitt, E. Influência da restrição alimentar e do estresse térmico sobre parâmetros fisiológicos em ovinos. Arq. Bras. Med. Vet. Zootec. 2020, 72, 1911–1919. [Google Scholar] [CrossRef]
- Seixas, L.; Peripolli, V.; Ficher, V.; Poli, C.H.E.C.; Melo, C.B.; Louvandini, H. Physiological and hematological parameters of sheep reared in the tropics and subtropics. Arq. Bras. Med. Vet. Zootec. 2021, 73, 622–630. [Google Scholar] [CrossRef]
- Batista, M.C.S.; Castro, R.S.; Rego, E.W.; Carvalho, F.A.A.; Silva, S.M.S.; Carvalho, C.C.D.; Riet-Correa, F. Hemograma, proteinograma, ionograma e dosagens bioquímicas e enzimáticas de ovinos acometidos por conidiobolomicose no Nordeste do Brasil. Pesqui. Vet. Bras. 2009, 29, 17–24. [Google Scholar] [CrossRef]
- Neves, R. O Que é o Leucograma? Entenda os Resultados do Exame! 2019. Available online: https://cuidadospelavida.com.br/saude-e-tratamento/baixa-imunidade/leucograma (accessed on 5 July 2021).
- Madureira, K.M.; Gomes, V.; Barcelos, B.; Zani, B.H.; Shecaira, C.L.; Benesi, F.J. Parâmetros hematológicos e bioquímicos de ovinos da raça Dorper. Semin. Ciênc. Agrár. 2013, 34, 811–816. [Google Scholar] [CrossRef] [Green Version]


| Ingredients | ||||||
|---|---|---|---|---|---|---|
| Item 1 (g/kg DM) | Cactus | Buffel Grass Hay | Corn Bran | Soybean Meal | Cotton Pie | Urea |
| DM 2 | 123.0 | 913.5 | 892.4 | 906.0 | 927.0 | 975.3 |
| CP | 44.0 | 38.3 | 94.7 | 400.0 | 202.7 | 281.0 |
| NFC | 518.9 | 50.5 | 647.8 | 342.3 | 148.5 | 0.0 |
| EE | 19.3 | 10.8 | 66.0 | 17.1 | 94.3 | 0.0 |
| MM | 118.0 | 79.2 | 16.4 | 64.8 | 46.8 | 2.1 |
| NDF | 299.8 | 821.2 | 175.1 | 175.8 | 507.7 | 0.0 |
| ADF | 184.2 | 486.0 | 38.9 | 86.6 | 276.8 | 0.0 |
| Cellulose | 141.3 | 376.1 | 34.3 | 81.8 | 245.5 | 0.0 |
| Hemicellulose | 115.1 | 302.8 | 90.0 | 69.3 | 207.3 | 0.0 |
| Lignin | 45.4 | 79.7 | 12.1 | 15.6 | 41.8 | 0.0 |
| Diets 1 | ||||
| Item (g/kg DM) | 7.5% | 15% | 30% | 45% |
| Cactus pear | 409.3 | 336.6 | 191.2 | 45.8 |
| Buffel grass hay | 72.7 | 145.4 | 290.8 | 436.2 |
| Soybean meal | 64.6 | 64.6 | 64.6 | 64.6 |
| Corn bran | 235.6 | 235.6 | 235.6 | 235.6 |
| Cotton pie | 178.4 | 178.3 | 178.1 | 178.0 |
| Urea | 8.8 | 8.9 | 9.0 | 9.2 |
| Mineral nucleus | 16.2 | 16.2 | 16.2 | 16.2 |
| Ammonium chloride | 13.5 | 13.5 | 13.5 | 13.5 |
| Ammonium sulfate | 1.0 | 1.0 | 1.0 | 1.0 |
| Item (g/kg DM) | Chemical Composition 2 | |||
| DM 3 | 248.7 | 285.6 | 406.2 | 703.0 |
| CP | 141.3 | 142.0 | 141.7 | 142.3 |
| NFC | 442.0 | 409.9 | 347.0 | 283.4 |
| EE | 42.2 | 41.5 | 40.3 | 39.0 |
| MM | 48.9 | 43.2 | 31.8 | 20.4 |
| NDF | 325.6 | 363.4 | 439.2 | 514.9 |
| Log CFU/g 1 | Levels Buffel Grass Hay % | Period (Days) | Overall Average (BH) | F 2 Test p-Value | p-Value | |||||
|---|---|---|---|---|---|---|---|---|---|---|
| 1° | 21° | BH | P | Interaction (BH x P) | %BH 3 | |||||
| L | Q | C | ||||||||
| Enterobacteria, Leftovers | 7.5 | 7.97 a ± 0.51 | 5.46 b ± 0.51 | 6.72 ± 0.49 | 0.0052 | <0.0001 | <0.0001 | 0.3670 | 0.0002 | 0.0077 |
| 15 | 6.64 a ± 0.51 | 4.41 b ± 0.51 | 6.02 ± 0.49 | 0.5414 | 0.1173 | 0.0498 | ||||
| 30 | 5.75 a ± 0.51 | 5.39 a ± 0.51 | 5.57 ± 0.49 | |||||||
| 45 | 3.87 a ± 0.51 | 3.79 a ± 0.51 | 3.83 ± 0.49 | |||||||
| Overall Average (P) | 6.06 ± 0.25 | 5.01 ± 0.25 | ||||||||
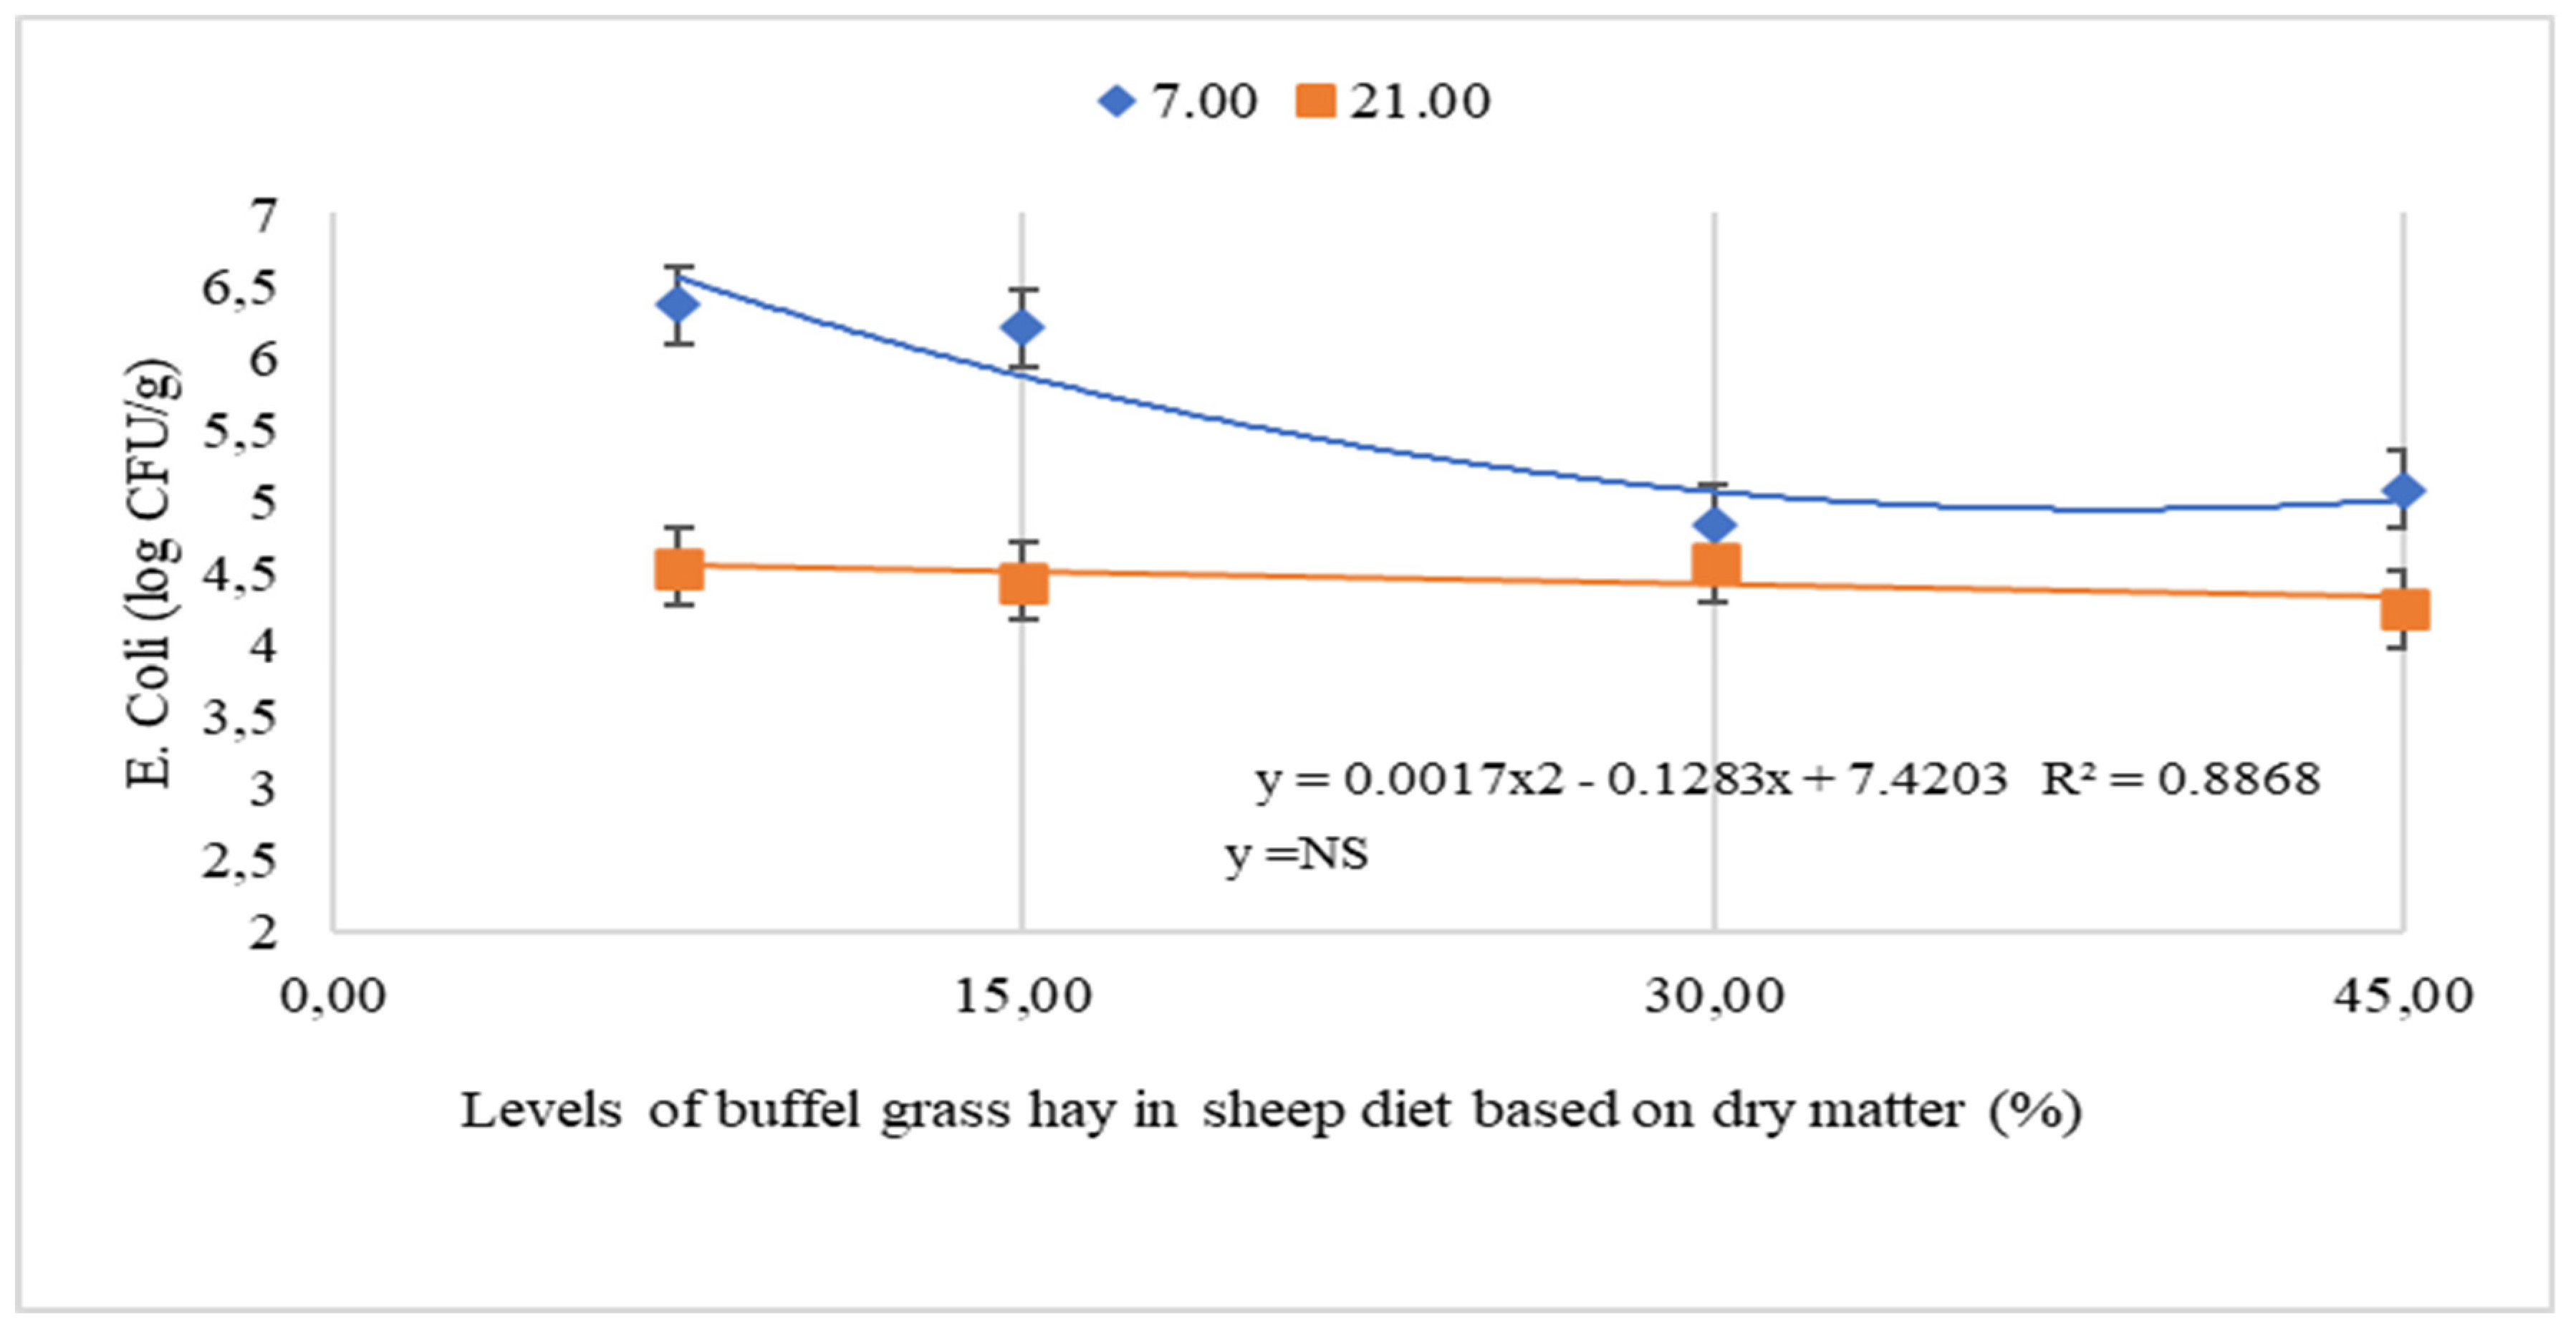
| E. coli, Leftovers | 7.5 | 6.37 a ± 0.27 | 4.54 b ± 0.27 | 5.46 ± 0.23 | 0.0502 | <0.0001 | 0.0043 | 0.5584 | 0.0002 | 0.6641 |
| 15 | 6.21 a ± 0.27 | 4.44 b ± 0.27 | 5.33 ± 0.23 | 0.9881 | 0.7555 | 0.4027 | ||||
| 30 | 4.84 a ± 0.27 | 4.57 a ± 0.27 | 4.71 ± 0.23 | |||||||
| 45 | 5.08 a ± 0.27 | 4.25 a ± 0.27 | 4.66 ± 0.23 | |||||||
| Overall Average (P) | 5.63 ± 0.14 | 4.45 ± 0.14 | ||||||||
| Enterobacteria, Feces | 7.5 | 8.24 ± 0.19 | 5.41 ± 0.19 | 6.83 ± 0.15 | 0.7663 | <0.0001 | 0.3328 | 0.7191 | 0.3344 | 0.8749 |
| 15 | 8.03 ± 0.19 | 5.50 ± 0.19 | 6.76 ± 0.15 | |||||||
| 30 | 7.73 ± 0.19 | 5.50 ± 0.19 | 6.62 ± 0.15 | |||||||
| 45 | 8.03 ± 0.19 | 5.32 ± 0.19 | 6.67 ± 0.15 | |||||||
| Overall Average (P) | 8.01 a ± 0.09 | 5.43 b ± 0.09 | ||||||||
| E. coli, Feces | 7.5 | 6.73 ± 0.22 | 4.76 ± 0.22 | 5.71 ± 0.15 | 0.5140 | <0.0001 | <0.1243 | 0.8374 | 0.3487 | 0.2521 |
| 15 | 7.10 ± 0.22 | 4.32 ± 0.22 | 6.00 ± 0.15 | |||||||
| 30 | 7.17 ± 0.22 | 4.83 ± 0.22 | 5.74 ± 0.15 | |||||||
| 45 | 7.25 ± 0.22 | 4.24 ± 0.22 | 5.75 ± 0.15 | |||||||
| Overall Average (P) | 7.06 a ± 0.11 | 4.54 b ± 0.11 | ||||||||
| Score | Levels of Buffel Grass Hay, % | p-Value | |||||
| 7.5 c | 15 c | 30 b | 45 a | BH 1 | P 2 | BH x P 3 | |
| % | |||||||
| 0 | 2.6 | 3.8 | 2.8 | 100 | 0.0034 | 0.9991 | 0.9311 |
| 1 | 20.2 | 26.5 | 78.6 | 0 | |||
| 2 | 70.7 | 63.2 | 12.1 | 0 | |||
| 3 | 6.5 | 6.5 | 6.5 | 0 | |||
| Levels of Buffel Grass Hay, % | EP 4 | p-Value | |||||
| 7.5 | 15 | 30 | 45 | L | Q | ||
| DMI, kg/dia | 1.05 | 1.38 | 1.30 | 1.07 | 0.235 | 0.6262 | 0.0101 |
| Variables | Levels of Buffel Grass Hay (%) | Average | SEM | p-Value | |||
| 7.5 | 15 | 30 | 45 | ||||
| T. 1 rectal (°C) | 39.12 | 39.11 | 39.10 | 39.05 | 39.09 | 0.096 | 0.953 |
| T. of the nape (°C) | 35.99 | 36.56 | 36.55 | 37.24 | 36.58 | 0.439 | 0.263 |
| T. of palette (°C) | 34.29 | 33.94 | 34.28 | 34.86 | 34.34 | 0.325 | 0.257 |
| T. of ham (°C) | 33.46 | 32.24 | 34.00 | 34.48 | 33.54 | 0.814 | 0.246 |
| RR 2 (mov.min−1) | 25.72 | 25.55 | 25.22 | 24.89 | 25.35 | 1.296 | 0.496 |
| Belly temperature (°C) | Levels of Buffel Grass Hay % | Period/Day | SEM | p-Value | |||
| 1° | 21° | BH 3 | P | BH x P | |||
| 7.5 | 36.24 Aa | 35.40 Ba | 0.243 | 0.393 | 0.275 | 0.031 | |
| 15 | 36.79 Aa | 36.79 Aa | |||||
| 30 | 36.40 Aa | 36.75 Aa | |||||
| 45 | 36.66 Aa | 36.99 Aa | |||||
| Characteristic | Levels Buffel Grass Hay % | Period (Days) | Overall Average (BH) | F 1 Test p-Value | p-Value 2 | ||||||
|---|---|---|---|---|---|---|---|---|---|---|---|
| 1° | 7° | 21° | BH | P | Interaction(BH x P) | %BH | |||||
| L | Q | C | |||||||||
| Erythrocyte, mm3 | 7.5 | 6.73 ± 0.87 | 7.07 ± 0.87 | 8.55 ± 0.87 | 7.45 ± 0.75 | 0.4139 | <0.0001 | 0.3695 | 0.5713 | 0.1404 | 0.5182 |
| 15 | 5.84 ± 0.92 | 7.73 ± 0.92 | 9.86 ± 0.92 | 7.81 ± 0.79 | |||||||
| 30 | 9.04 ± 0.97 | 8.69 ± 0.95 | 9.96 ± 0.92 | 9.23 ± 0.81 | |||||||
| 45 | 7.68 ± 0.87 | 8.10 ± 0.87 | 9.27 ± 0.90 | 8.35 ± 0.76 | |||||||
| Overall Average (P) | 7.33 b ± 0.50 | 7.90 b ± 0.51 | 9.45 a ± 0.35 | ||||||||
| Hemoglobin, g/dL | 7.5 | 7.17 b ± 0.41 | 8.20 ab ± 0.43 | 9.24 a ± 0.43 | 8.20 ± 0.36 | 0.1888 | <0.0001 | <0.0001 | 0.2456 | 0.0628 | 0.8732 |
| 15 | 5.91 b ± 0.43 | 7.98 a ± 0.43 | 9.07 a ± 0.45 | 7.65 ± 0.37 | |||||||
| 30 | 8.10 b ± 0.43 | 7.92 b ± 0.43 | 9.43 a ± 0.43 | 8.76 ± 0.36 | |||||||
| 45 | 8.62 b ± 0.43 | 8.63 b ± 0.41 | 9.02 b ± 0.43 | 8.26 ± 0.34 | |||||||
| Overall Average (P) | 7.45 ± 0.21 | 8.18 ± 0.21 | 9.19 ± 0.22 | ||||||||
| Hematocrit, % | 7.5 | 19.36 ± 2.45 | 20.78± 2.45 | 25.90 ± 2.45 | 23.28 ± 2.30 | 0.4201 | <0.0001 | 0.1726 | 0.5145 | 0.1610 | 0.4890 |
| 15 | 17.60 ± 2.59 | 22.58 ± 2.59 | 29.68 ± 2.59 | 27.23 ± 2.33 | |||||||
| 30 | 26.27 ± 2.67 | 24.91 ± 2.67 | 30.51 ± 2.59 | 24.46 ± 2.19 | |||||||
| 45 | 22.45 ± 2.45 | 23.03 ± 2.45 | 27.90 ± 2.51 | 22.01 ± 2.19 | |||||||
| Overall Average (P) | 21.42 b ± 1.27 | 22.83 b ± 1.27 | 28.50 a ± 1.27 | ||||||||
| CHCM 3, g/dL | 7.5 | 30.18 b ± 0.68 | 33.07 a ± 0.66 | 32.90 a ± 0.66 | 31.52 ± 0.55 | 0.4230 | <0.0001 | 0.0092 | 0.2556 | 0.9691 | 0.2186 |
| 15 | 31.12 b ± 0.69 | 32.51 b ± 0.69 | 30.92 b ± 0.69 | 31.21 ± 0.57 | |||||||
| 30 | 31.60 b ± 0.72 | 31.18 b ± 0.72 | 32.97 b ± 0.66 | 32.40 ± 0.53 | |||||||
| 45 | 32.97 b ± 0.66 | 33.16 b ± 0.66 | 31.08 b ± 0.68 | 32.05 ± 0.53 | |||||||
| Overall Average (P) | 31.27 ± 0.34 | 32.59 ± 0.34 | 31.52 ± 0.34 | ||||||||
| Leukocytes, μL | 7.5 | 7020.00 b ± 765.81 | 7510.00 b ± 765.81 | 7519.18 b ± 765.81 | 7349.73 ± 673.29 | 0.2666 | 0.0106 | 0.0090 | 0.4417 | 0.2737 | 0.1508 |
| 15 | 5277.78 b ± 807.24 | 8011.11 a ± 807.24 | 7955.56 a ± 807.24 | 7081.48 ± 706.89 | |||||||
| 30 | 7266.67 b ± 807.24 | 7166.67 b ± 807.24 | 7122.22 b ± 807.24 | 7185.19 ± 706.89 | |||||||
| 45 | 8930.00 b ± 765.81 | 9488.74 b ± 780.49 | 7890.00 b ± 765.81 | 8769.58 ± 672.49 | |||||||
| Overall Average (P) | 7123.61 ± 393.40 | 8044.13 ± 395.20 | 7621.74 ± 395.96 | ||||||||
| Segmented, μL | 7.5 | 4339.70 b ± 471.60 | 4716.10 b ± 471.60 | 4361.00 b ± 471.60 | 4472.27 ± 409.58 | 0.5301 | <0.0001 | 0.0083 | 0.5195 | 0.6331 | 0.2173 |
| 15 | 3342.78 b ± 497.11 | 4791.34 ab ± 512.75 | 4891.44 a ± 497.11 | 4341.85 ± 433.77 | |||||||
| 30 | 3094.73 b ± 512.75 | 4849.11 b ± 497.11 | 4039.11 b ± 497.11 | 4194.32 ± 433.77 | |||||||
| 45 | 4749.42 ab ± 487.10 | 6095.64 a ± 487.10 | 4232.40 b ± 471.60 | 5025.82 ± 415.14 | |||||||
| Overall Average (P) | 4031.66 ± 246.18 | 5113.05 ± 246.18 | 4380.99 ± 242.26 | ||||||||
| Eosinophiles, μL | 7.5 | 118.60 b ± 26.66 | 182.90 b ± 24.44 | 155.63 b ± 26.66 | 152.38 ± 18.59 | 0.0393 | 0.0001 | 0.0066 | 0.4268 | 0.0156 | 0.5424 |
| 15 | 97.22 b ± 26.82 | 173.96 b ± 28.11 | 205.79 b ± 28.26 | 158.99 ± 19.61 | 0.3693 | 0.6334 | 0.0492 | ||||
| 30 | 158.67 b ± 26.82 | 150.44 b ± 26.82 | 296.22 a ± 26.82 | 201.78 ± 19.19 | 0.0880 | 0.0028 | 0.2620 | ||||
| 45 | 190.21 b ± 26.66 | 231.80 b ± 25.44 | 234.25 b ± 26.66 | 218.75 ± 18.59 | |||||||
| Overall Average (P) | 141.17 ± 13.37 | 184.78 ± 13.23 | 222.97 ± 13.55 | ||||||||
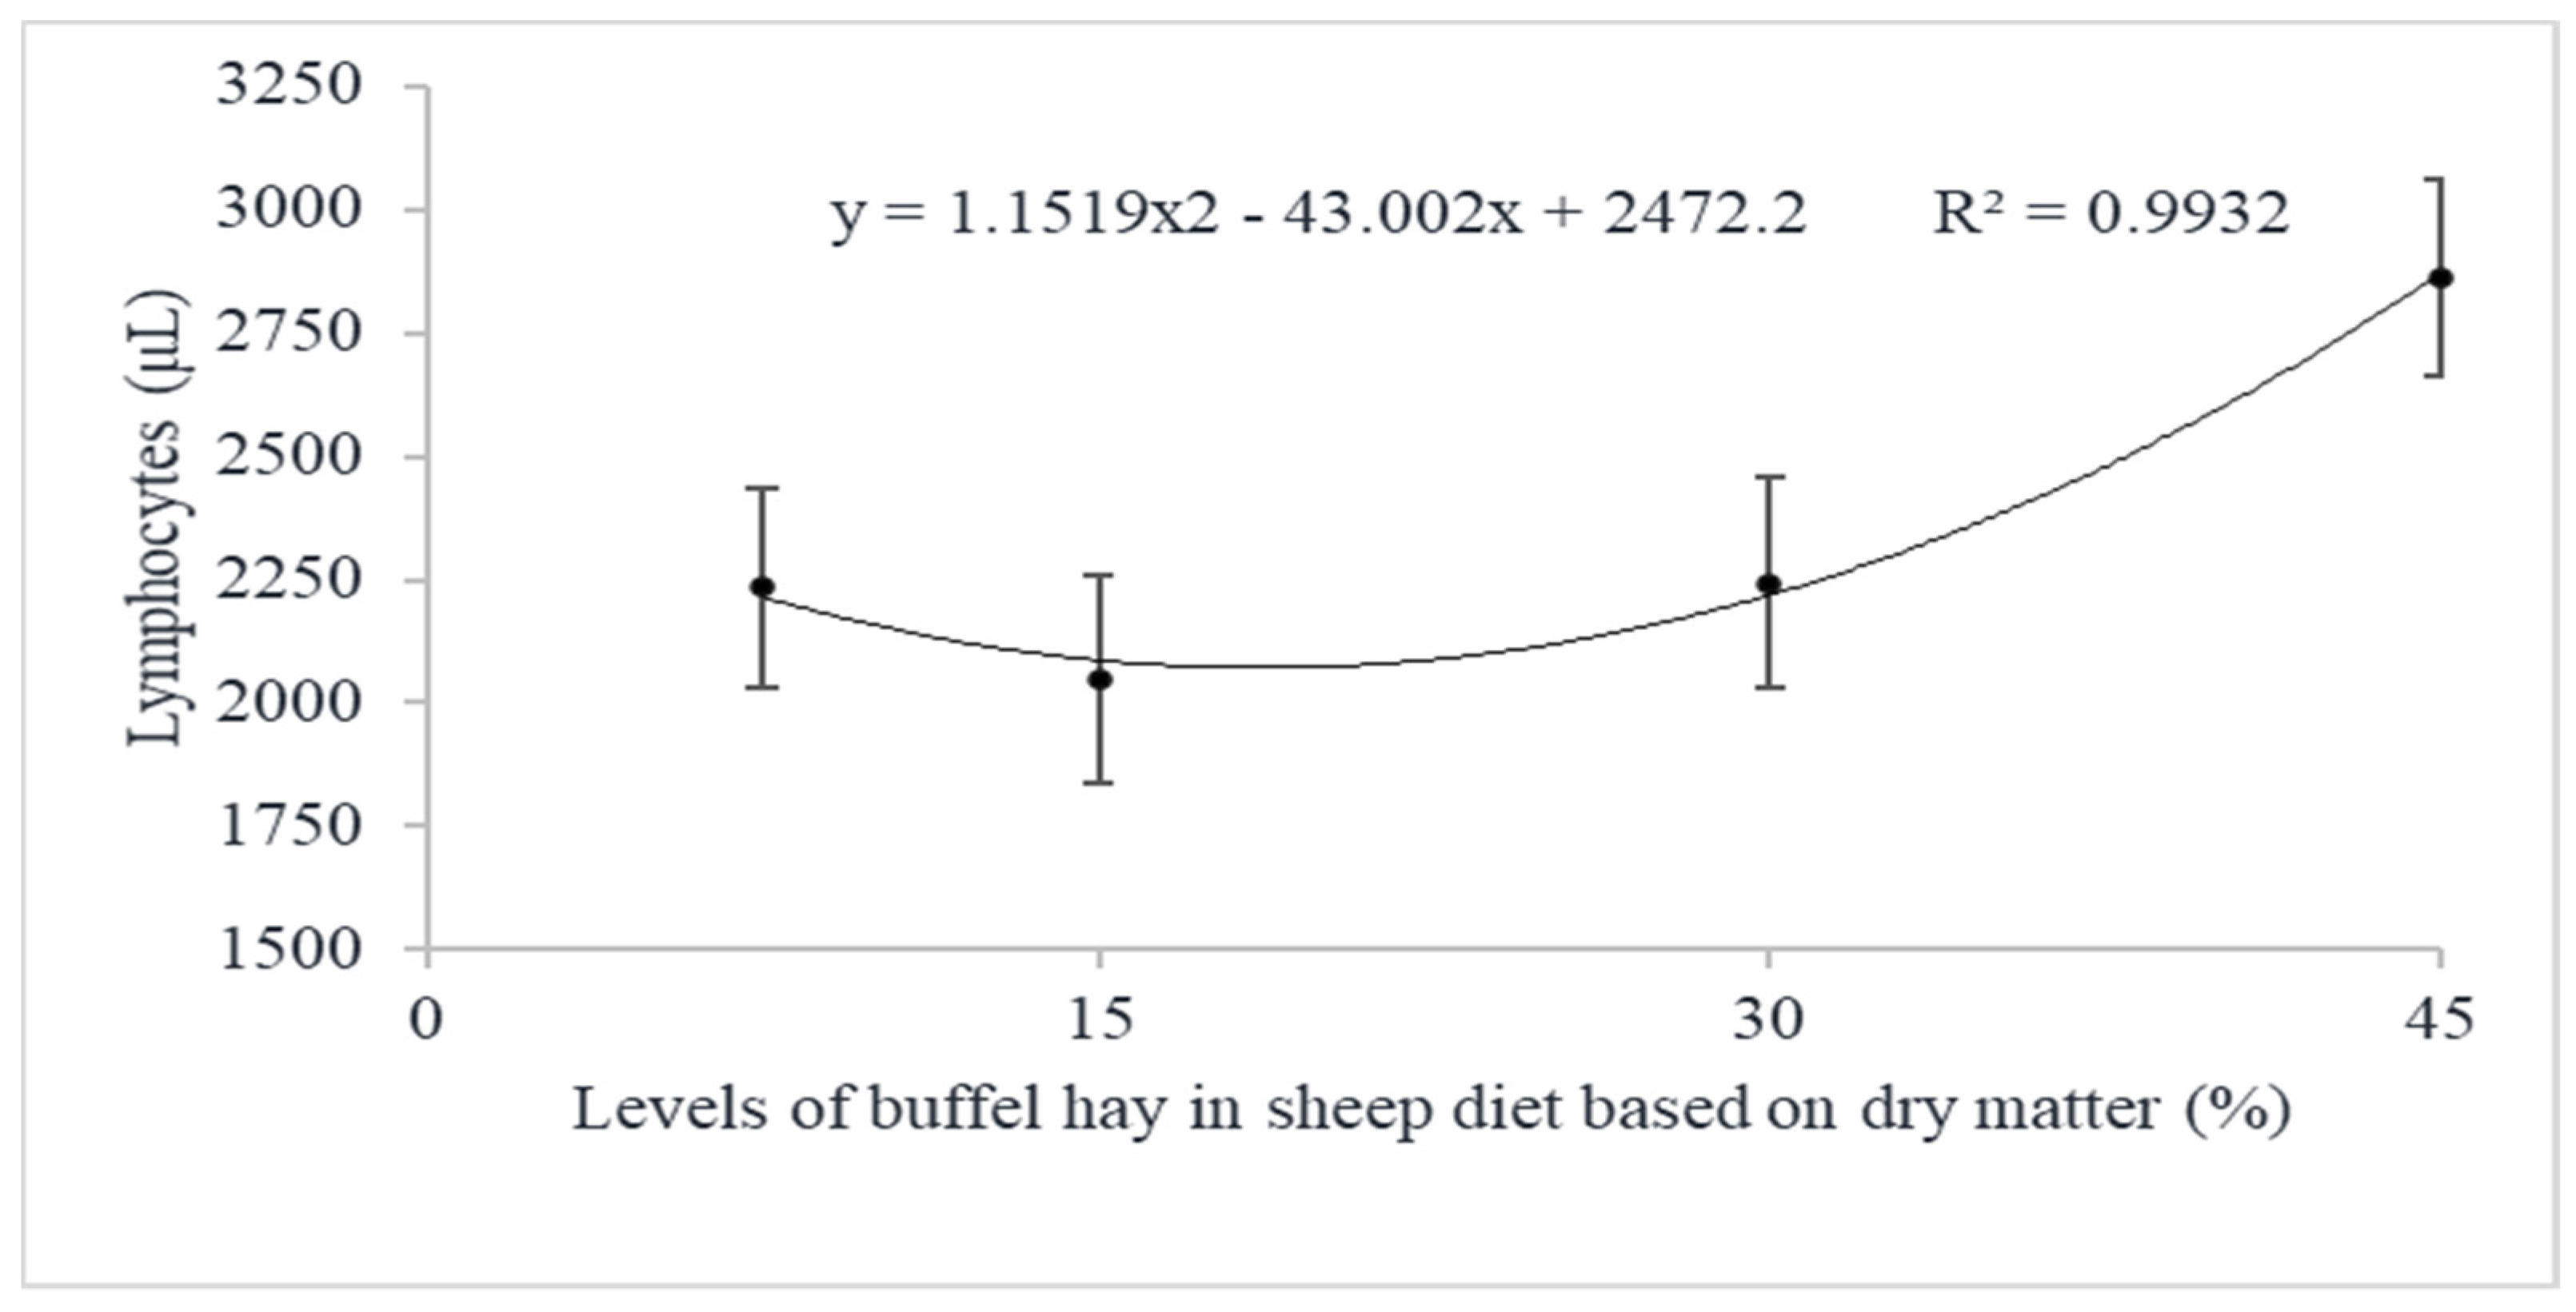
| Lymphocytes, μL | 7.5 | 2289.50 ± 274.83 | 2052.74± 287.94 | 2362.10 ± 287.94 | 2234.78 ± 202.09 | 0.0343 | 0.0124 | 0.0779 | 0.2054 | 0.0507 | 0.0771 |
| 15 | 1655.22 ± 289.70 | 2090.89 ± 289.70 | 2399.11 ± 289.70 | 2048.41 ± 208.81 | |||||||
| 30 | 2597.46 ± 305.94 | 1666.34 ± 305.94 | 2468.78 ± 289.70 | 2244.19 ± 214.99 | |||||||
| 45 | 3310.00 ± 274.83 | 2344.81 ± 287.93 | 2931.50 ± 274.83 | 2862.10 ± 200.15 | |||||||
| Overall Average (P) | 2463.05 a ± 143.31 | 2038.69 b ± 146.49 | 2540.37 a ± 142.81 | ||||||||
| Monocytes, μL | 7.5 | 217.85 b ± 49.38 | 392.30 ab ± 47.26 | 554.40 a ± 47.26 | 388.18 ± 35.64 | 0.4195 | <0.0001 | 0.0024 | 0.1459 | 0.7624 | 0.4403 |
| 15 | 183.33 b ± 49.82 | 423.00 a ± 49.82 | 379.28 ab ± 52.32 | 32,854 ± 37.61 | |||||||
| 30 | 308.44 b ± 49.82 | 322.00 b ± 49.82 | 384.78 b ± 49.82 | 338.41 ± 37.23 | |||||||
| 45 | 318.90 b ± 47.26 | 484.10 b ± 47.26 | 398.50 b ± 49.38 | 400.50 ± 35.64 | |||||||
| Overall Average (P) | 257.13 ± 24.54 | 405.35 ± 24.28 | 429.24 ± 24.86 | ||||||||
| Platelets, μL | 7.5 | 752,900 ± 71,317 | 699,300 ± 71,317 | 790,700 ± 71,317 | 747,633 ± 60,078 | 0.8455 | 0.2644 | 0.1051 | 0.7651 | 0.8834 | 0.4105 |
| 15 | 706,667 ± 75,174 | 843,111 ± 75,174 | 836,444 ± 75,174 | 795,407 ± 63,328 | |||||||
| 30 | 726,222 ± 75,174 | 684,556 ± 75,174 | 840,349 ± 77,909 | 750,376 ± 63,694 | |||||||
| 45 | 857,100 ± 71,317 | 906,800 ± 71,317 | 768,700 ± 71,317 | 810,867 ± 60,078 | |||||||
| Overall Average (P) | 760,722 ± 36,636 | 758,422 ± 36,636 | 809,048 ± 36,991 | ||||||||
| Total plasma Protein., g/dL | 7.5 | 7.23 b ± 0.10 | 7.44 b ± 0.09 | 7.08 b ± 0.09 | 7.25 ± 0.06 | 0.5801 | <0.0001 | 0.0142 | 0.3311 | 0.3211 | 0.8704 |
| 15 | 7.03 b ± 0.10 | 7.52 a ± 0.10 | 6.98 b ± 0.10 | 7.18 ± 0.06 | |||||||
| 30 | 7.00 b ± 0.10 | 7.30 b ± 0.10 | 7.46 b ± 0.10 | 7.25 ± 0.06 | |||||||
| 45 | 7.19 b ± 0.09 | 7.48 b ± 0.10 | 7.21 b ± 0.09 | 7.29 ± 0.06 | |||||||
| Overall Average (P) | 7.11 ± 0.05 | 7.43 ± 0.05 | 7.18 ± 0.05 | ||||||||
Publisher’s Note: MDPI stays neutral with regard to jurisdictional claims in published maps and institutional affiliations. |
© 2022 by the authors. Licensee MDPI, Basel, Switzerland. This article is an open access article distributed under the terms and conditions of the Creative Commons Attribution (CC BY) license (https://creativecommons.org/licenses/by/4.0/).
Share and Cite
Vieira, D.d.S.; Oliveira, J.S.d.; Santos, E.M.; Santos, B.R.C.d.; Pinto, L.F.B.; Zanine, A.d.M.; Coelho, D.F.O.; Sobral, G.d.C.; Leite, G.M.; Soares, R.L.; et al. Microbiological Composition of Diets of Cactus Pear-Based with Increasing Levels of Buffel Grass Hay and Relationship to Nutritional Disorders in Sheep. Animals 2022, 12, 500. https://doi.org/10.3390/ani12040500
Vieira DdS, Oliveira JSd, Santos EM, Santos BRCd, Pinto LFB, Zanine AdM, Coelho DFO, Sobral GdC, Leite GM, Soares RL, et al. Microbiological Composition of Diets of Cactus Pear-Based with Increasing Levels of Buffel Grass Hay and Relationship to Nutritional Disorders in Sheep. Animals. 2022; 12(4):500. https://doi.org/10.3390/ani12040500
Chicago/Turabian StyleVieira, Diego de S., Juliana S. de Oliveira, Edson M. Santos, Betina Raquel C. dos Santos, Luís Fernando B. Pinto, Anderson de M. Zanine, Diego Francisco O. Coelho, Gilberto de C. Sobral, Guilherme M. Leite, Rafael L. Soares, and et al. 2022. "Microbiological Composition of Diets of Cactus Pear-Based with Increasing Levels of Buffel Grass Hay and Relationship to Nutritional Disorders in Sheep" Animals 12, no. 4: 500. https://doi.org/10.3390/ani12040500