
Impact of Rearing Strategies on the Metabolizable Energy and SID Lysine Partitioning in Pigs Growing from 90 to 200 kg in Body Weight

 ,
,  ,
,  ,
,  ,
,  , , and
Abstract
:Simple Summary
Abstract
1. Introduction
2. Materials and Methods
2.1. Pig Housing and Rearing
2.2. Live and Postmortem Measurements
2.3. Experimental Design
- (i)
- The control group (C) had pigs raised under the traditional heavy pig production system for dry-cured ham. Thus, feed restriction was applied and pigs were fed a restricted medium-protein (MP) diet, with lysine as the first-limiting indispensable AA. They were slaughtered at 9 months SA and 170 kg in SW.
- (ii)
- The older pig (OA) strategy was based on a SID lysine restriction in addition to the feed or energy restriction to shift the pigs toward a greater lipid deposition (Ld) and lower Pd to improve the ham seasoning aptitude [19]. Thus, the OA pigs were fed as restrictively as the C pigs, but with feeds lower in SID lysine content (LP). The pigs were slaughtered at >9 months SA at 170 kg in SW. Information from this group of pigs was used to evaluate the ME partitioning and the marginal efficiency of SID lysine utilization for Pd.
- (iii)
- (iv)
- The third alternative strategy programmed pigs to reach the maximum SW (>170 kg) at 9 months SA (greater weight, GW). The pigs were given the same HP feeds, fed ad libitum, as the YA group and were slaughtered at the same SA (9 months) but at a greater SW (>170 kg) than the C pigs. A comparison between YA and GW was carried out for an evaluation of the effect of an increased SW and SA on energy and SID lysine needs and partitioning at the heavy BW range (170–200 kg in SW) of the pigs.
2.4. Feeds

| Early Finishing Feeds | Late-Finishing Feeds | |||||
|---|---|---|---|---|---|---|
| Ingredient | High Protein | Medium Protein | Low Protein | High Protein | Medium Protein | Low Protein |
| Corn grain | 350.9 | 342.0 | 381.7 | 388.7 | 390.2 | 391.1 |
| Wheat grain | 249.5 | 282.5 | 272.4 | 248.4 | 248.9 | 249.3 |
| Barley grain | 96.4 | 97.0 | 97.2 | 96.9 | 97.3 | 97.4 |
| Soybean meal 48% (solv. ex.) | 201.0 | 87.7 | 39.3 | 147.3 | 57.9 | 18.9 |
| Wheat bran | 25.5 | 84.6 | 82.6 | 7.2 | 55.8 | 60.7 |
| Wheat middlings | 0.0 | 19.6 | 29.4 | 39.1 | 66.3 | 88.5 |
| Cane molasses | 16.0 | 16.1 | 16.3 | 18.1 | 18.2 | 18.2 |
| Lard | 22.1 | 24.0 | 23.4 | 22.2 | 22.3 | 22.3 |
| Dried-sugar beet pulp | - | 9.9 | 19.8 | 0.0 | 9.9 | 20.4 |
| Calcium carbonate | 16.6 | 16.7 | 16.7 | 14.4 | 14.5 | 14.5 |
| Dicalcium phosphate | 4.8 | 4.9 | 4.9 | 2.2 | 2.2 | 2.2 |
| Sodium chloride | 3.3 | 3.3 | 3.3 | 3.3 | 3.3 | 3.3 |
| Sodium bicarbonate | 2.7 | 2.8 | 2.8 | 2.8 | 2.8 | 2.8 |
| Vitamin and mineral premix a | 2.0 | - | 2.0 | 2.0 | 2.0 | 2.0 |
| Grapeseed meal | 7.3 | 7.4 | 7.4 | 7.4 | 7.4 | 7.4 |
| Choline, liquid, 75% b | 0.6 | 0.0 | - | - | - | - |
| L-Lysine c | 1.1 | 1.6 | 0.7 | - | 1.1 | 1.1 |
| DL-Methionine d | 0.2 | - | - | - | - | - |
2.5. Feeding Regime
| Early Finishing Feeds a | Late-Finishing Feeds | |||||
|---|---|---|---|---|---|---|
| HP | MP | LP | HP | MP | LP | |
| Analyzed nutrient composition b | ||||||
| DM, g/kg as fed | 906 | 904 | 904 | 906 | 902 | 904 |
| CP (N × 6.25) | 178.8 | 141.6 | 125.0 | 152.3 | 131.9 | 115.0 |
| Starch | 455.8 | 508.8 | 539.8 | 533.1 | 521.1 | 542.0 |
| Ether extract | 47.5 | 50.9 | 48.7 | 53.0 | 55.4 | 53.1 |
| aNDF-NDF | 144.6 | 152.7 | 156.0 | 130.2 | 146.3 | 148.2 |
| Ash | 53.0 | 52.0 | 53.1 | 46.4 | 45.5 | 45.4 |
| Lysine (Lys) | 9.6 | 7.3 | 5.2 | 7.5 | 5.5 | 4.0 |
| Methionine (Met) | 3.0 | 2.4 | 2.1 | 2.8 | 2.2 | 2.0 |
| Threonine (Thr) | 7.2 | 5.0 | 4.8 | 5.5 | 4.8 | 3.9 |
| Tryptophan (Trp) | 2.0 | 1.7 | 1.3 | 1.4 | 1.2 | 1.1 |
| Tyrosine (Tyr) | 6.1 | 4.2 | 3.8 | 3.8 | 3.7 | 2.9 |
| Calculated nutrient composition c | ||||||
| ME, MJ/kg DM | 14.8 | 14.6 | 14.6 | 14.8 | 14.6 | 14.5 |
| NE, MJ/kg DM | 11.0 | 11.1 | 11.2 | 11.1 | 11.1 | 11.0 |
| CP (N × 6.25) | 178.8 | 141.6 | 120.6 | 156.7 | 128.6 | 113.9 |
| Digestible CP (DCP) | 153.2 | 120.8 | 103.2 | 133.4 | 109.0 | 97.0 |
| ME/Digestible CP, MJ/kg DCP | 97 | 121 | 141 | 111 | 134 | 149 |
| Starch | 468.0 | 496.7 | 519.9 | 501.1 | 521.1 | 527.7 |
| Linoleic acid | 48.6 | 52.0 | 52.0 | 50.8 | 52.1 | 52.0 |
| Lys | 9.2 | 6.9 | 5.0 | 7.6 | 5.7 | 3.9 |
| Met | 3.0 | 2.2 | 2.0 | 2.4 | 2.1 | 1.9 |
| Thr | 6.3 | 4.8 | 4.0 | 5.4 | 4.2 | 3.8 |
| Trp | 2.2 | 1.7 | 1.3 | 1.9 | 1.4 | 1.2 |
| Tyr | 5.8 | 4.5 | 3.9 | 5.1 | 4.1 | 3.7 |
| SID Lys | 8.2 | 6.0 | 4.2 | 6.6 | 5.0 | 3.2 |
| SID Met | 2.8 | 2.0 | 1.8 | 2.3 | 1.9 | 1.8 |
| SID Thr | 5.5 | 4.0 | 3.2 | 4.9 | 3.7 | 3.1 |
| SID Trp | 1.8 | 1.3 | 1.0 | 1.5 | 1.2 | 1.0 |
| SID Tyr | 5.4 | 4.1 | 3.5 | 4.9 | 3.9 | 3.3 |
| Ratios: | ||||||
| Met/Lys (Optimum = 0.288) | 0.34 | 0.33 | 0.42 | 0.35 | 0.38 | 0.55 |
| Thr/Lys (Optimum = 0.672) | 0.68 | 0.67 | 0.76 | 0.73 | 0.73 | 0.97 |
| Trp/Lys (Optimum = 0.182) | 0.22 | 0.22 | 0.24 | 0.23 | 0.24 | 0.31 |
| Tyr/Lys (Optimum = 0.353) | 0.66 | 0.69 | 0.84 | 0.73 | 0.78 | 1.03 |
2.6. Chemical Analysis
2.7. Body Composition, Pd and Ld
2.8. Metabolizable Energy Partitioning
2.9. SID Lysine Partitioning
2.10. Statistical Analysis
3. Results
3.1. Dry Matter Intake and Growth Performance
| Treatment | p Values | Sex | p Values | ||||||||||
|---|---|---|---|---|---|---|---|---|---|---|---|---|---|
| Item | C | OA | YA | GW | SEM 2 | C vs. OA | C vs. YA | YA vs. GW | Gilts | Barrows | SEM 2 | Sex | Sex × Treatment |
| Animals, n. | 55 | 56 | 54 | 57 | - | - | - | - | 109 | 113 | - | - | - |
| Days on feed | 116 ± 4 | 133 ± 8 | 85 ± 4 | 116 ± 4 | - | - | - | - | 114 ± 17 | 112 ± 19 | - | - | - |
| Empty body weight (EBW), kg | |||||||||||||
| Initial | 84.6 | 84.1 | 84.7 | 85.2 | 1.31 | 0.82 | 0.93 | 0.80 | 83.7 | 85.7 | 0.96 | 0.12 | 0.17 |
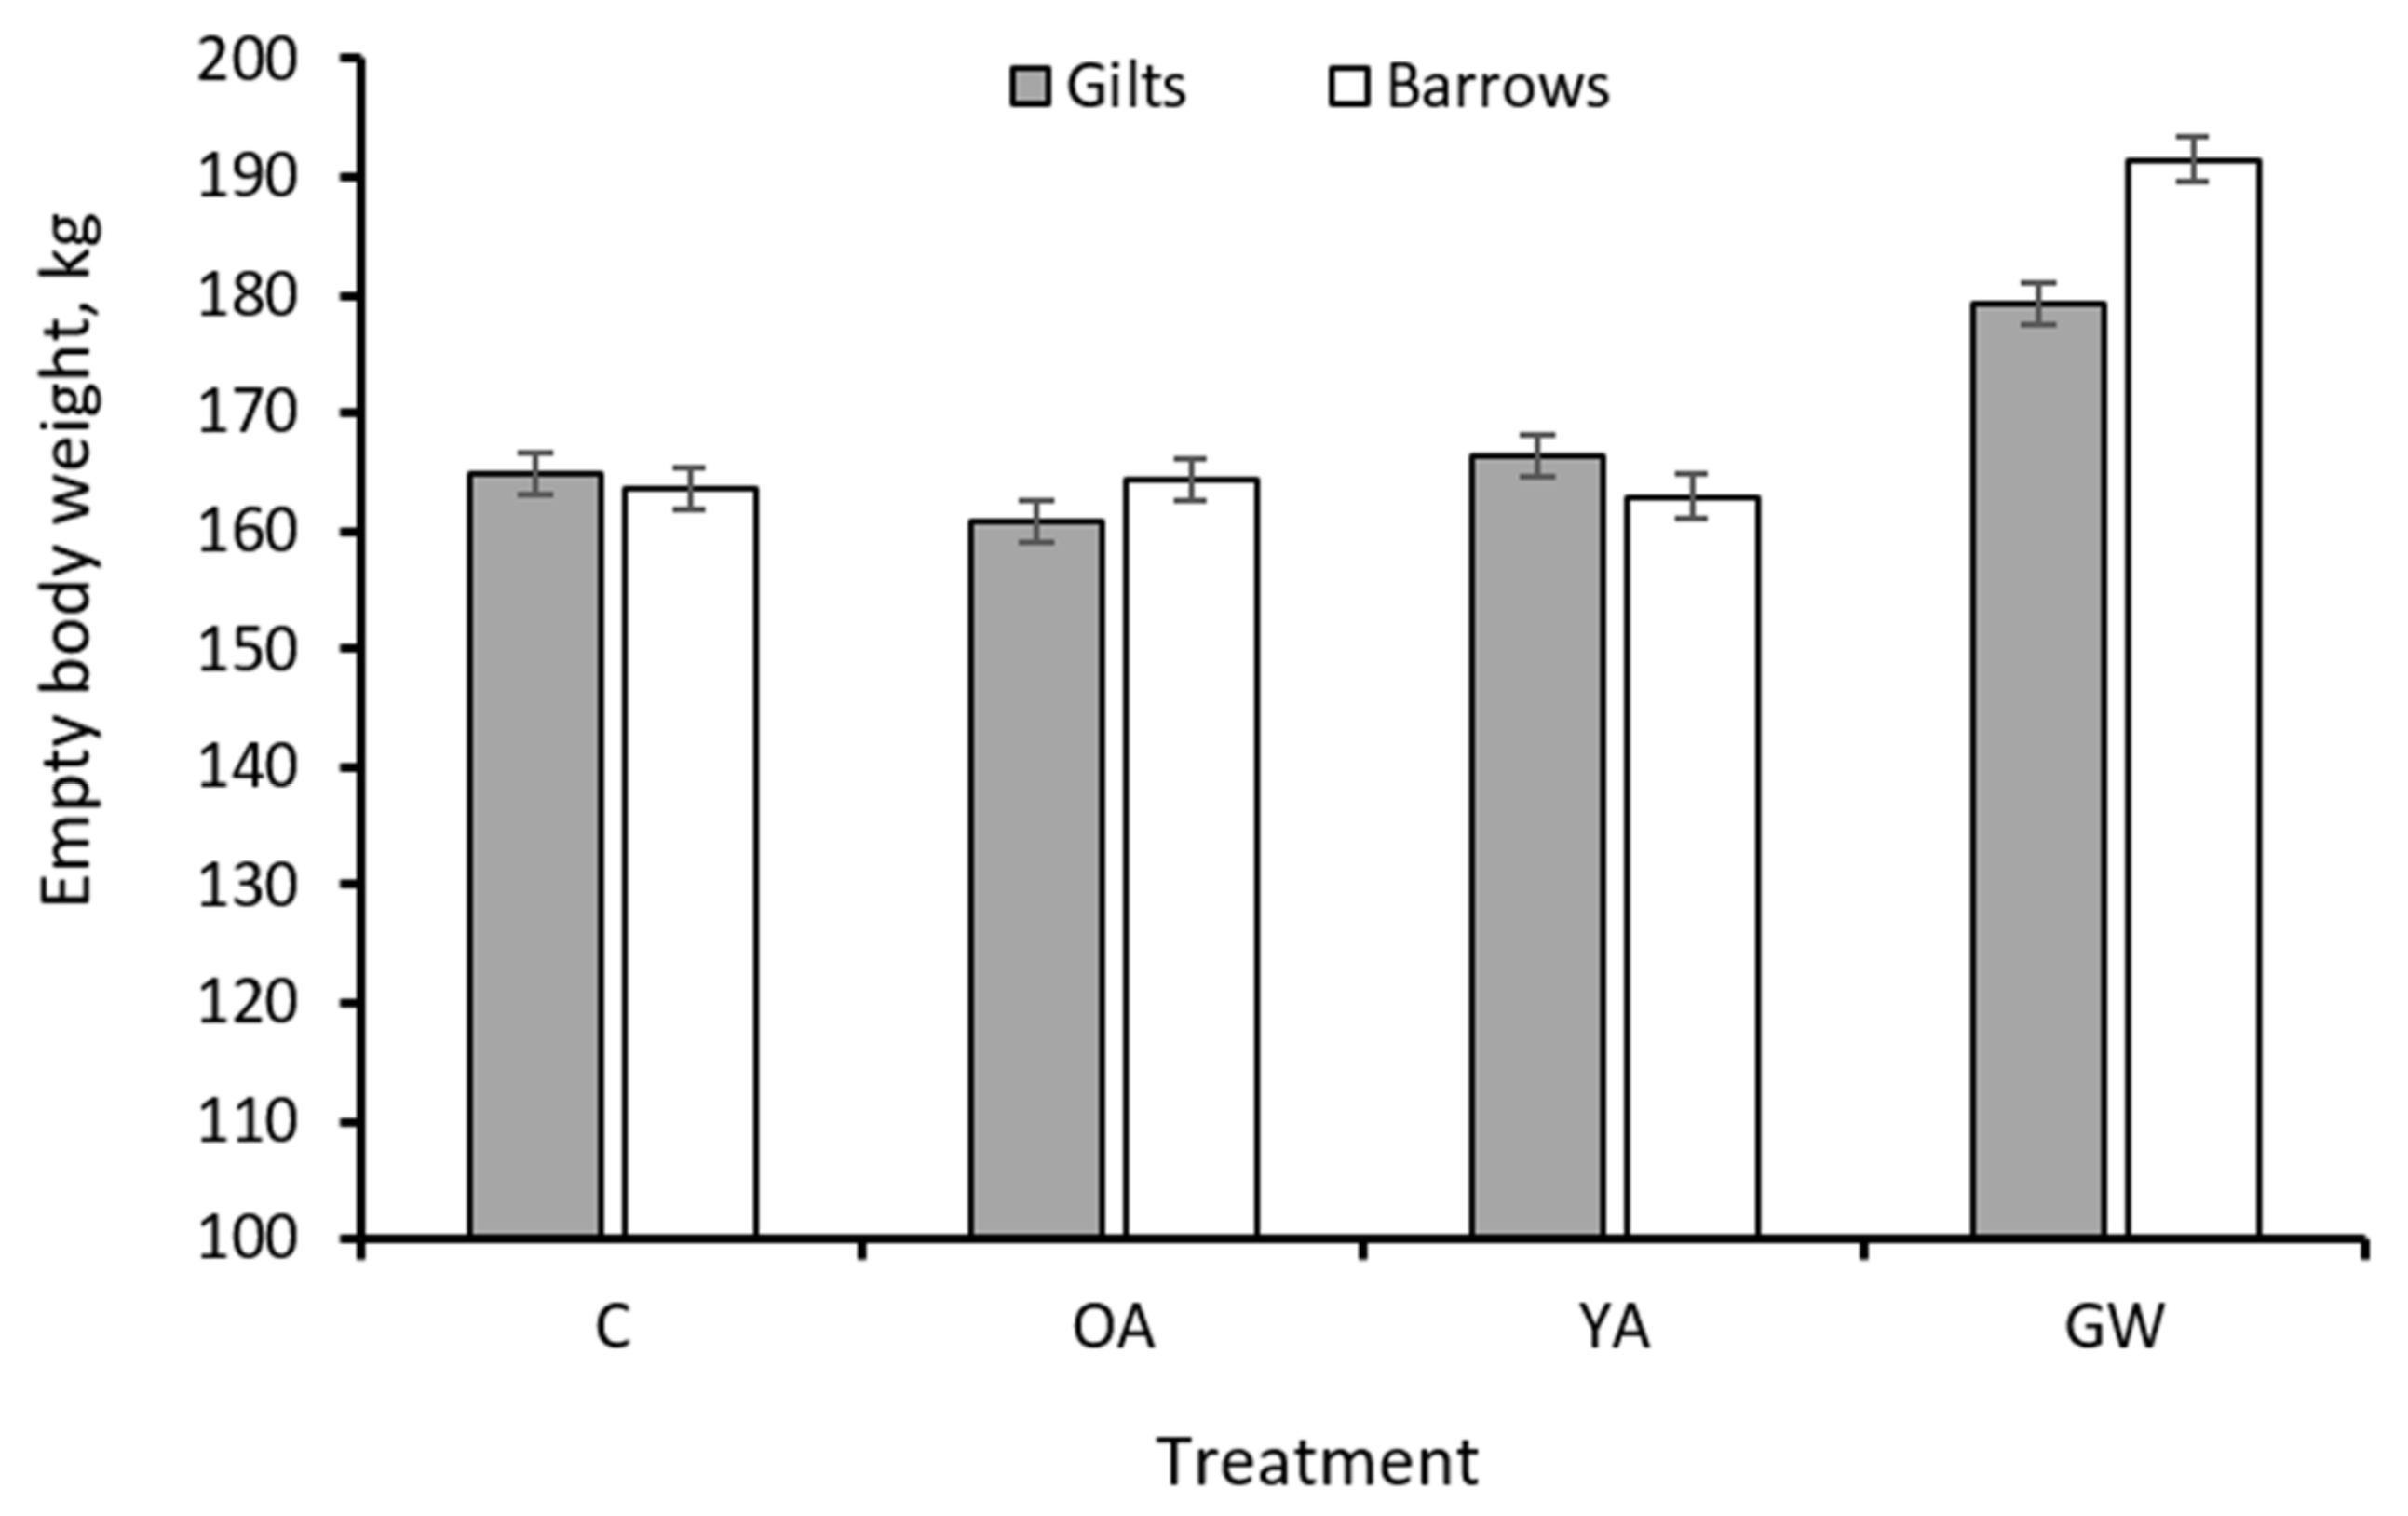
| Final 3 | 164.2 | 162.5 | 164.7 | 185.4 | 1.74 | 0.52 | 0.85 | <0.001 | 167.8 | 170.6 | 1.23 | 0.11 | 0.008 |
| Daily EBW gain, kg/d | 0.684 | 0.589 | 0.939 | 0.861 | 0.02 | 0.007 | <0.001 | 0.021 | 0.766 | 0.770 | 0.01 | 0.77 | 0.20 |
| Feed dry matter intake: | |||||||||||||
| daily, kg/d | 2.42 | 2.43 | 3.05 | 2.96 | 45.3 | 0.77 | <0.001 | 0.15 | 2.68 | 2.75 | 32.4 | 0.079 | 0.035 |
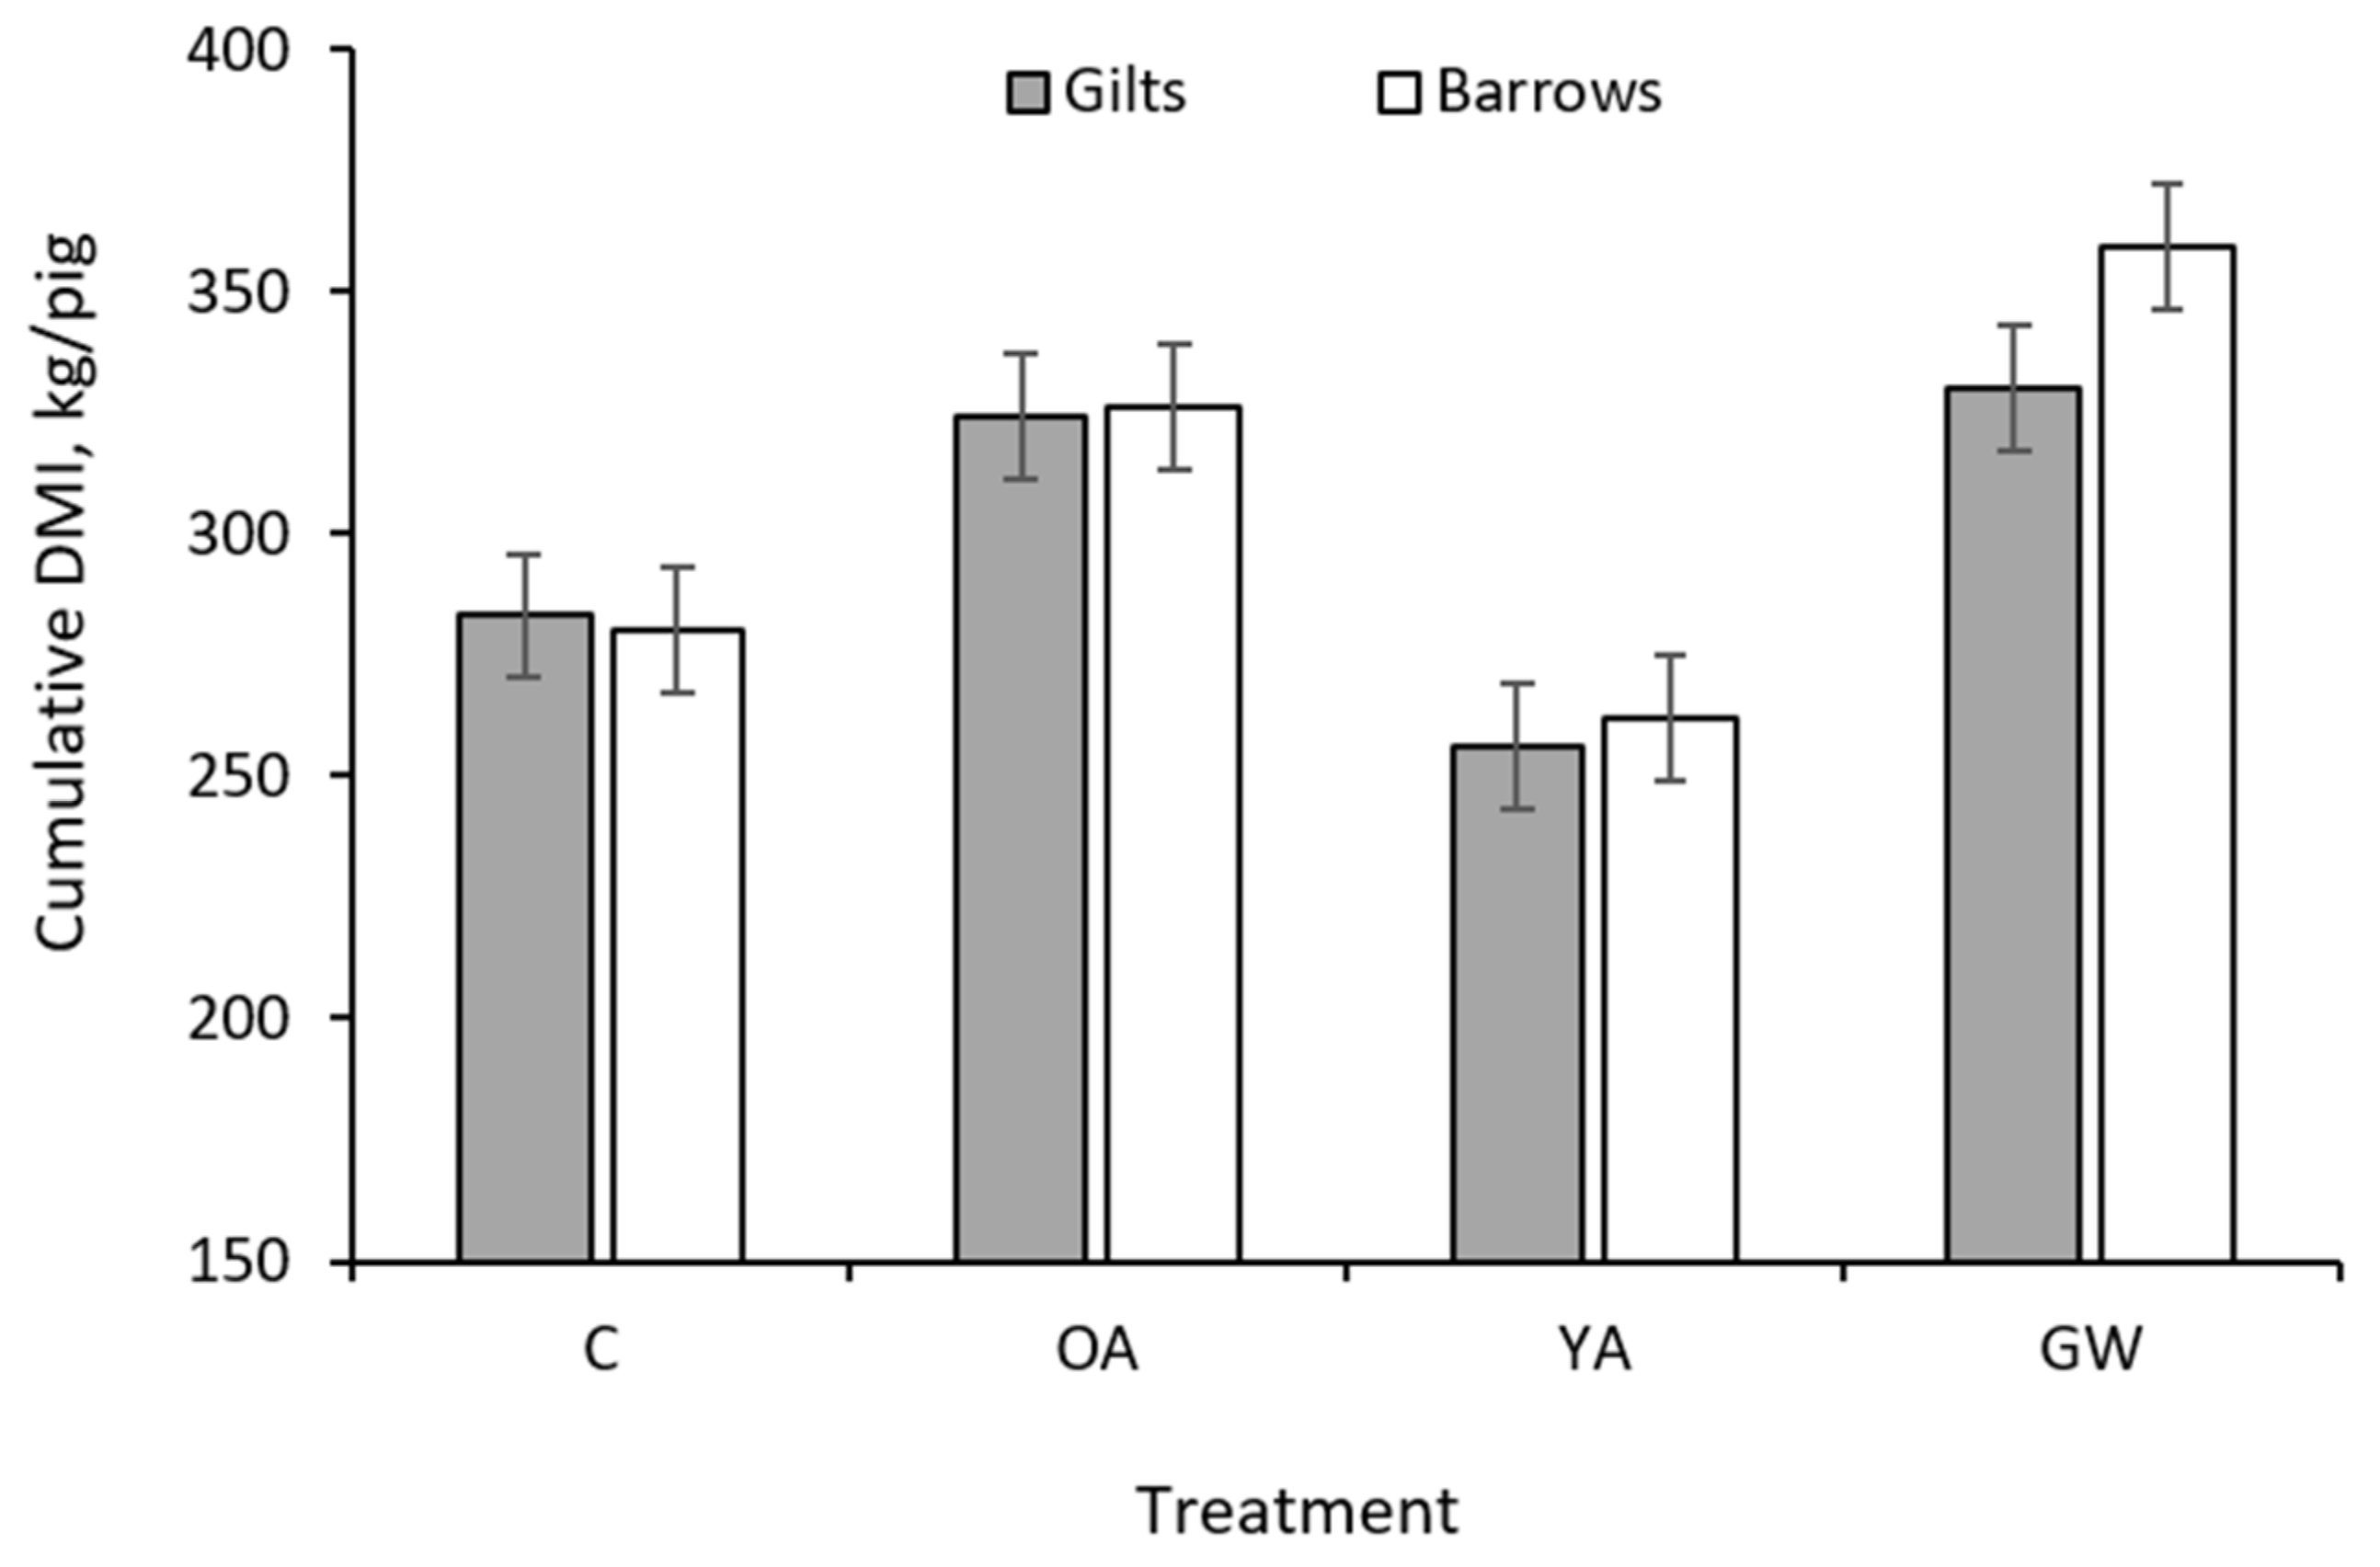
| Cumulative 4, kg/pig | 282 | 325 | 259 | 345 | 12.4 | <0.001 | 0.006 | <0.001 | 298 | 307 | 11.9 | 0.027 | 0.013 |
| Backfat depth, mm | |||||||||||||
| initial | 10.1 | 10.1 | 10.1 | 10.3 | 0.30 | 0.52 | 0.94 | 0.95 | 9.62 | 10.67 | 0.30 | <0.001 | 0.85 |
| final | 20.8 | 22.4 | 24.8 | 25.9 | 1.24 | 0.14 | 0.002 | <0.001 | 22.83 | 24.12 | 1.24 | 0.008 | 0.51 |
3.2. Body Composition Changes and ME Partitioning
| Rearing Strategy | p Values | Sex | p Values | ||||||||||
|---|---|---|---|---|---|---|---|---|---|---|---|---|---|
| Item | C | OA | YA | GW | SEM 2 | C vs. OA | C vs. YA | YA vs. GW | Gilts | Barrows | SEM | Sex | Sex × Treatment |
| Estimated body lipid mass 3, kg | |||||||||||||
| initial | 14.6 | 14.5 | 14.6 | 14.8 | 0.39 | 0.87 | 0.97 | 0.62 | 14.1 | 15.1 | 0.30 | 0.005 | 0.44 |
| final | 41.0 | 42.5 | 46.1 | 53.4 | 1.63 | 0.37 | 0.010 | 0.001 | 44.6 | 47.0 | 1.38 | 0.012 | 0.13 |
| daily lipid deposition (Ld), g/d | 226.4 | 209.8 | 370.1 | 331.4 | 14.2 | 0.40 | <0.001 | 0.07 | 278.4 | 290.5 | 9.01 | 0.13 | 0.26 |
| Estimated body protein mass 4, kg | |||||||||||||
| initial | 15.6 | 15.5 | 15.6 | 15.7 | 0.24 | 0.80 | 0.80 | 0.88 | 15.5 | 15.7 | 0.17 | 0.30 | 0.11 |
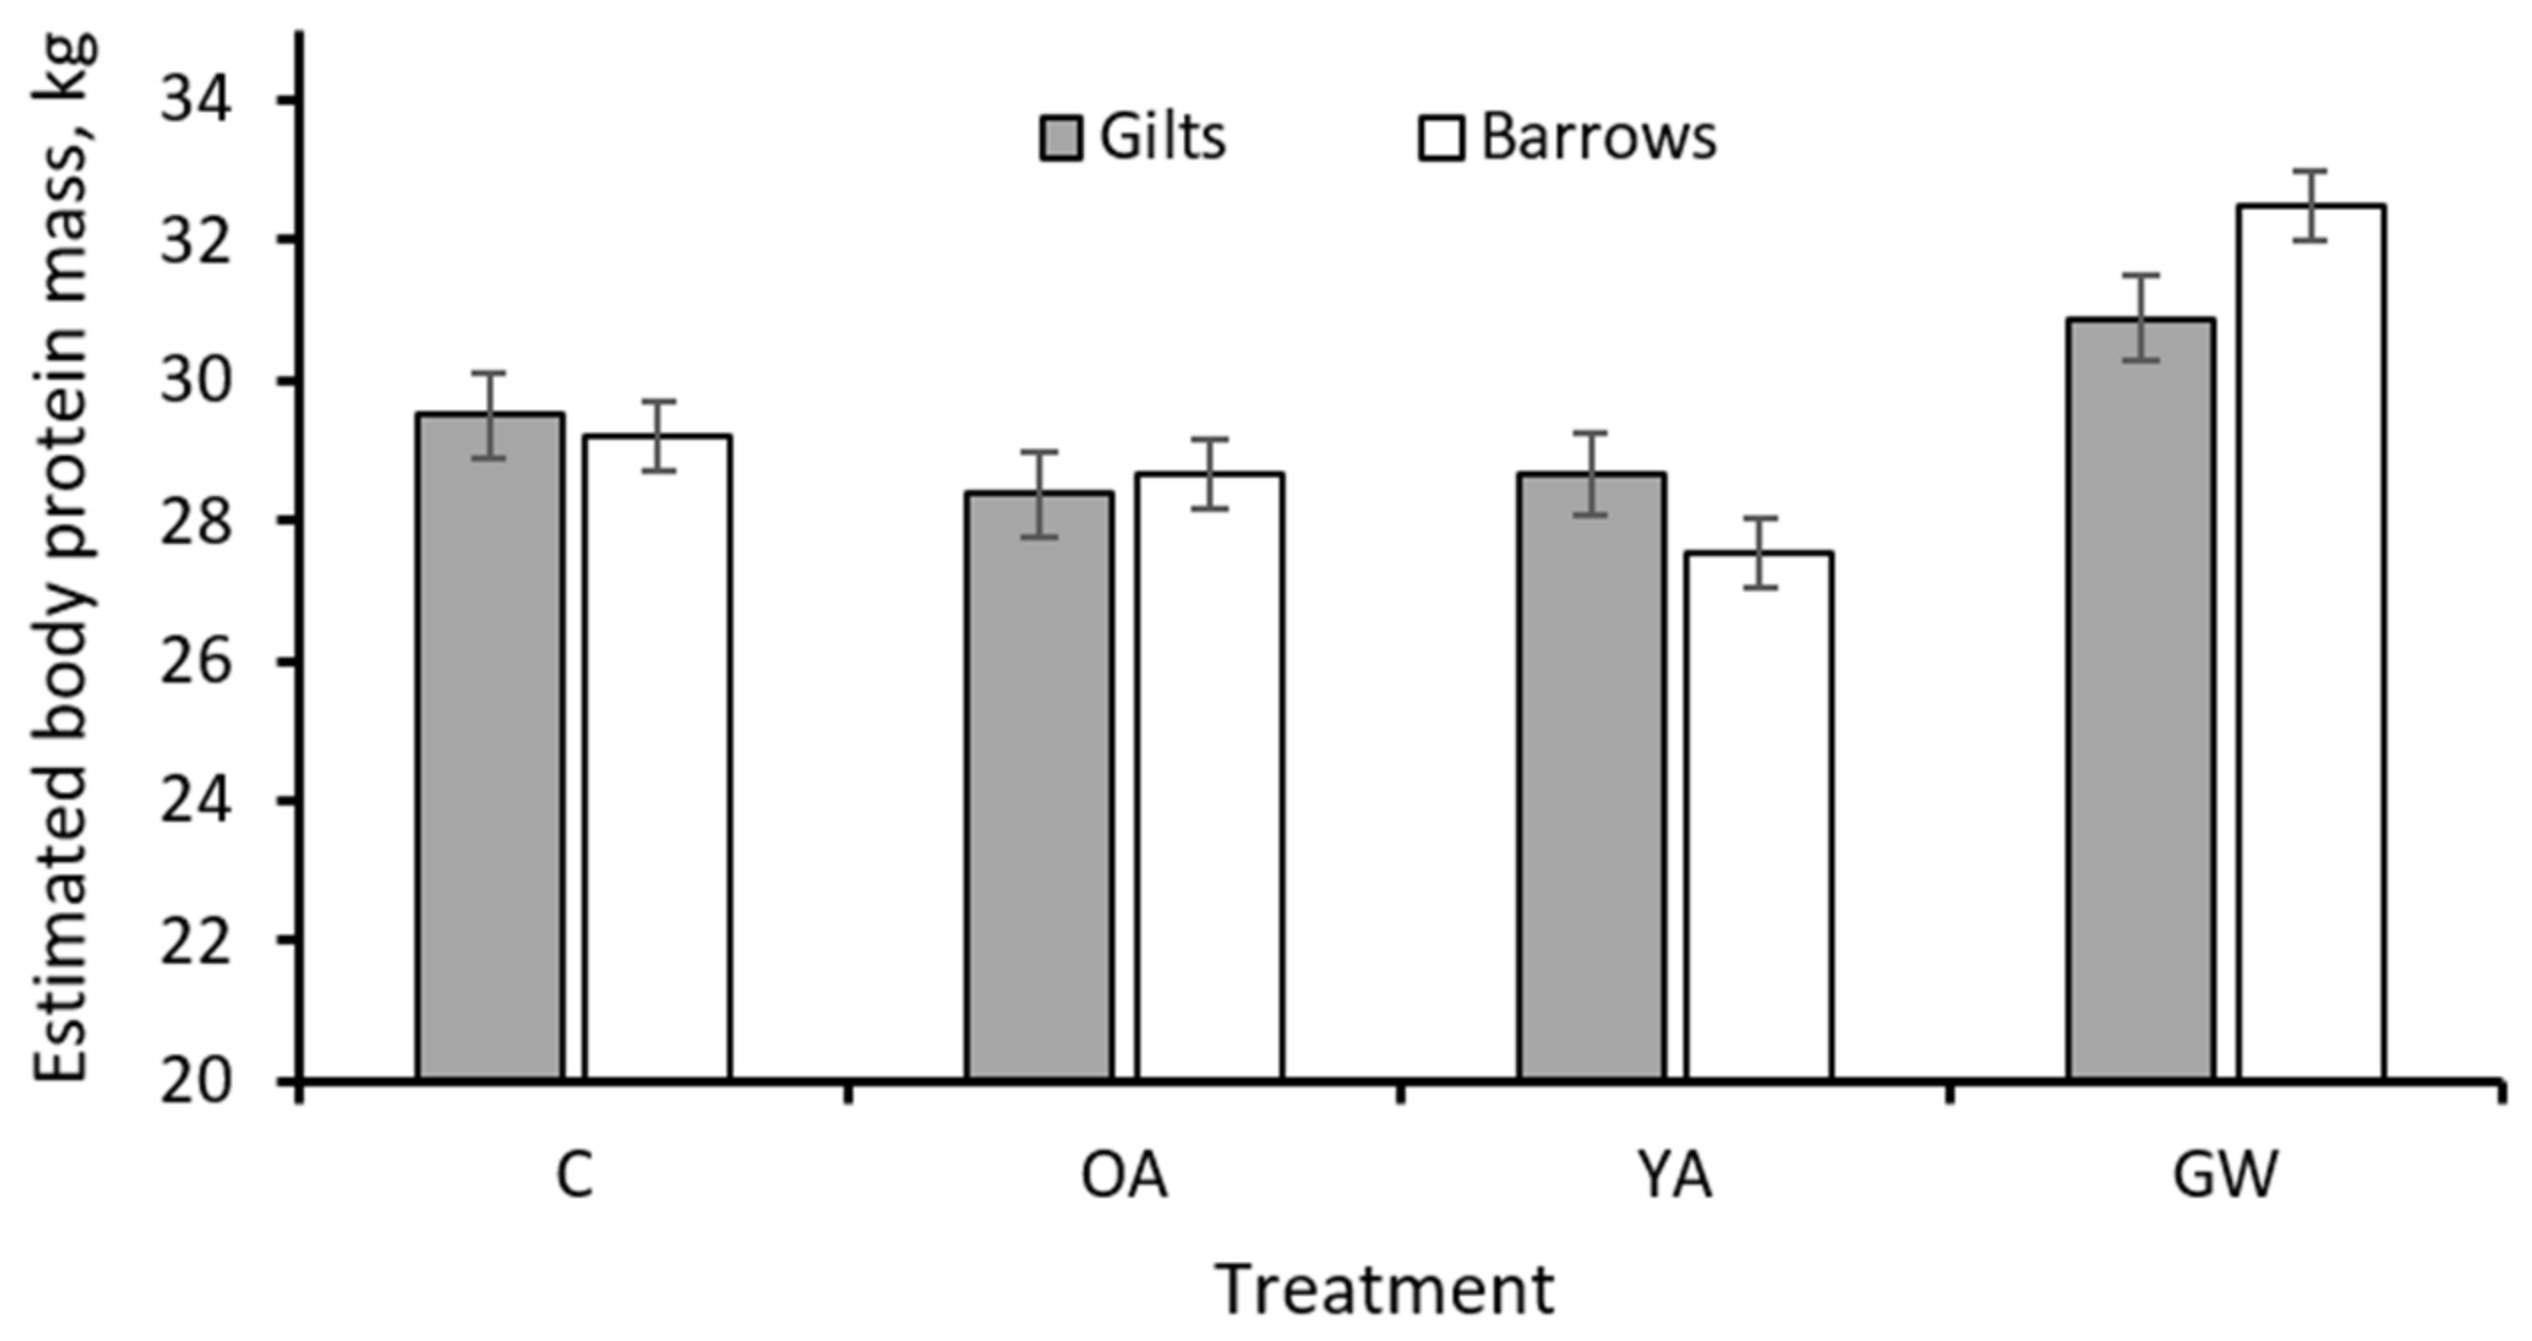
| final | 29.4 | 28.5 | 28.1 | 31.7 | 0.46 | 0.08 | 0.014 | <0.001 | 29.4 | 29.5 | 0.40 | 0.71 | 0.009 |
| daily protein deposition (Pd), g/d | 118.2 | 97.7 | 146.5 | 137.5 | 6.16 | 0.001 | <0.001 | 0.06 | 0.13 | 0.12 | 5.67 | 0.39 | 0.33 |
| Energy balance: | |||||||||||||
| ME intake 5, MJ/d | 35.3 | 35.5 | 45.1 | 43.7 | 0.67 | 0.86 | <0.001 | 0.15 | 39.4 | 40.4 | 0.47 | 0.08 | 0.035 |
| ME for growth 6, MJ/d | 17.0 | 15.2 | 25.9 | 23.4 | 0.74 | 0.12 | <0.001 | 0.039 | 20.2 | 20.7 | 0.43 | 0.23 | 0.19 |
| for Pd | 5.2 | 4.3 | 6.5 | 6.1 | 0.27 | <0.001 | <0.001 | 0.06 | 5.6 | 5.5 | 0.25 | 0.39 | 0.34 |
| for Ld | 11.8 | 10.9 | 19.4 | 17.3 | 0.74 | 0.40 | <0.001 | 0.07 | 14.6 | 15.2 | 0.47 | 0.13 | 0.26 |
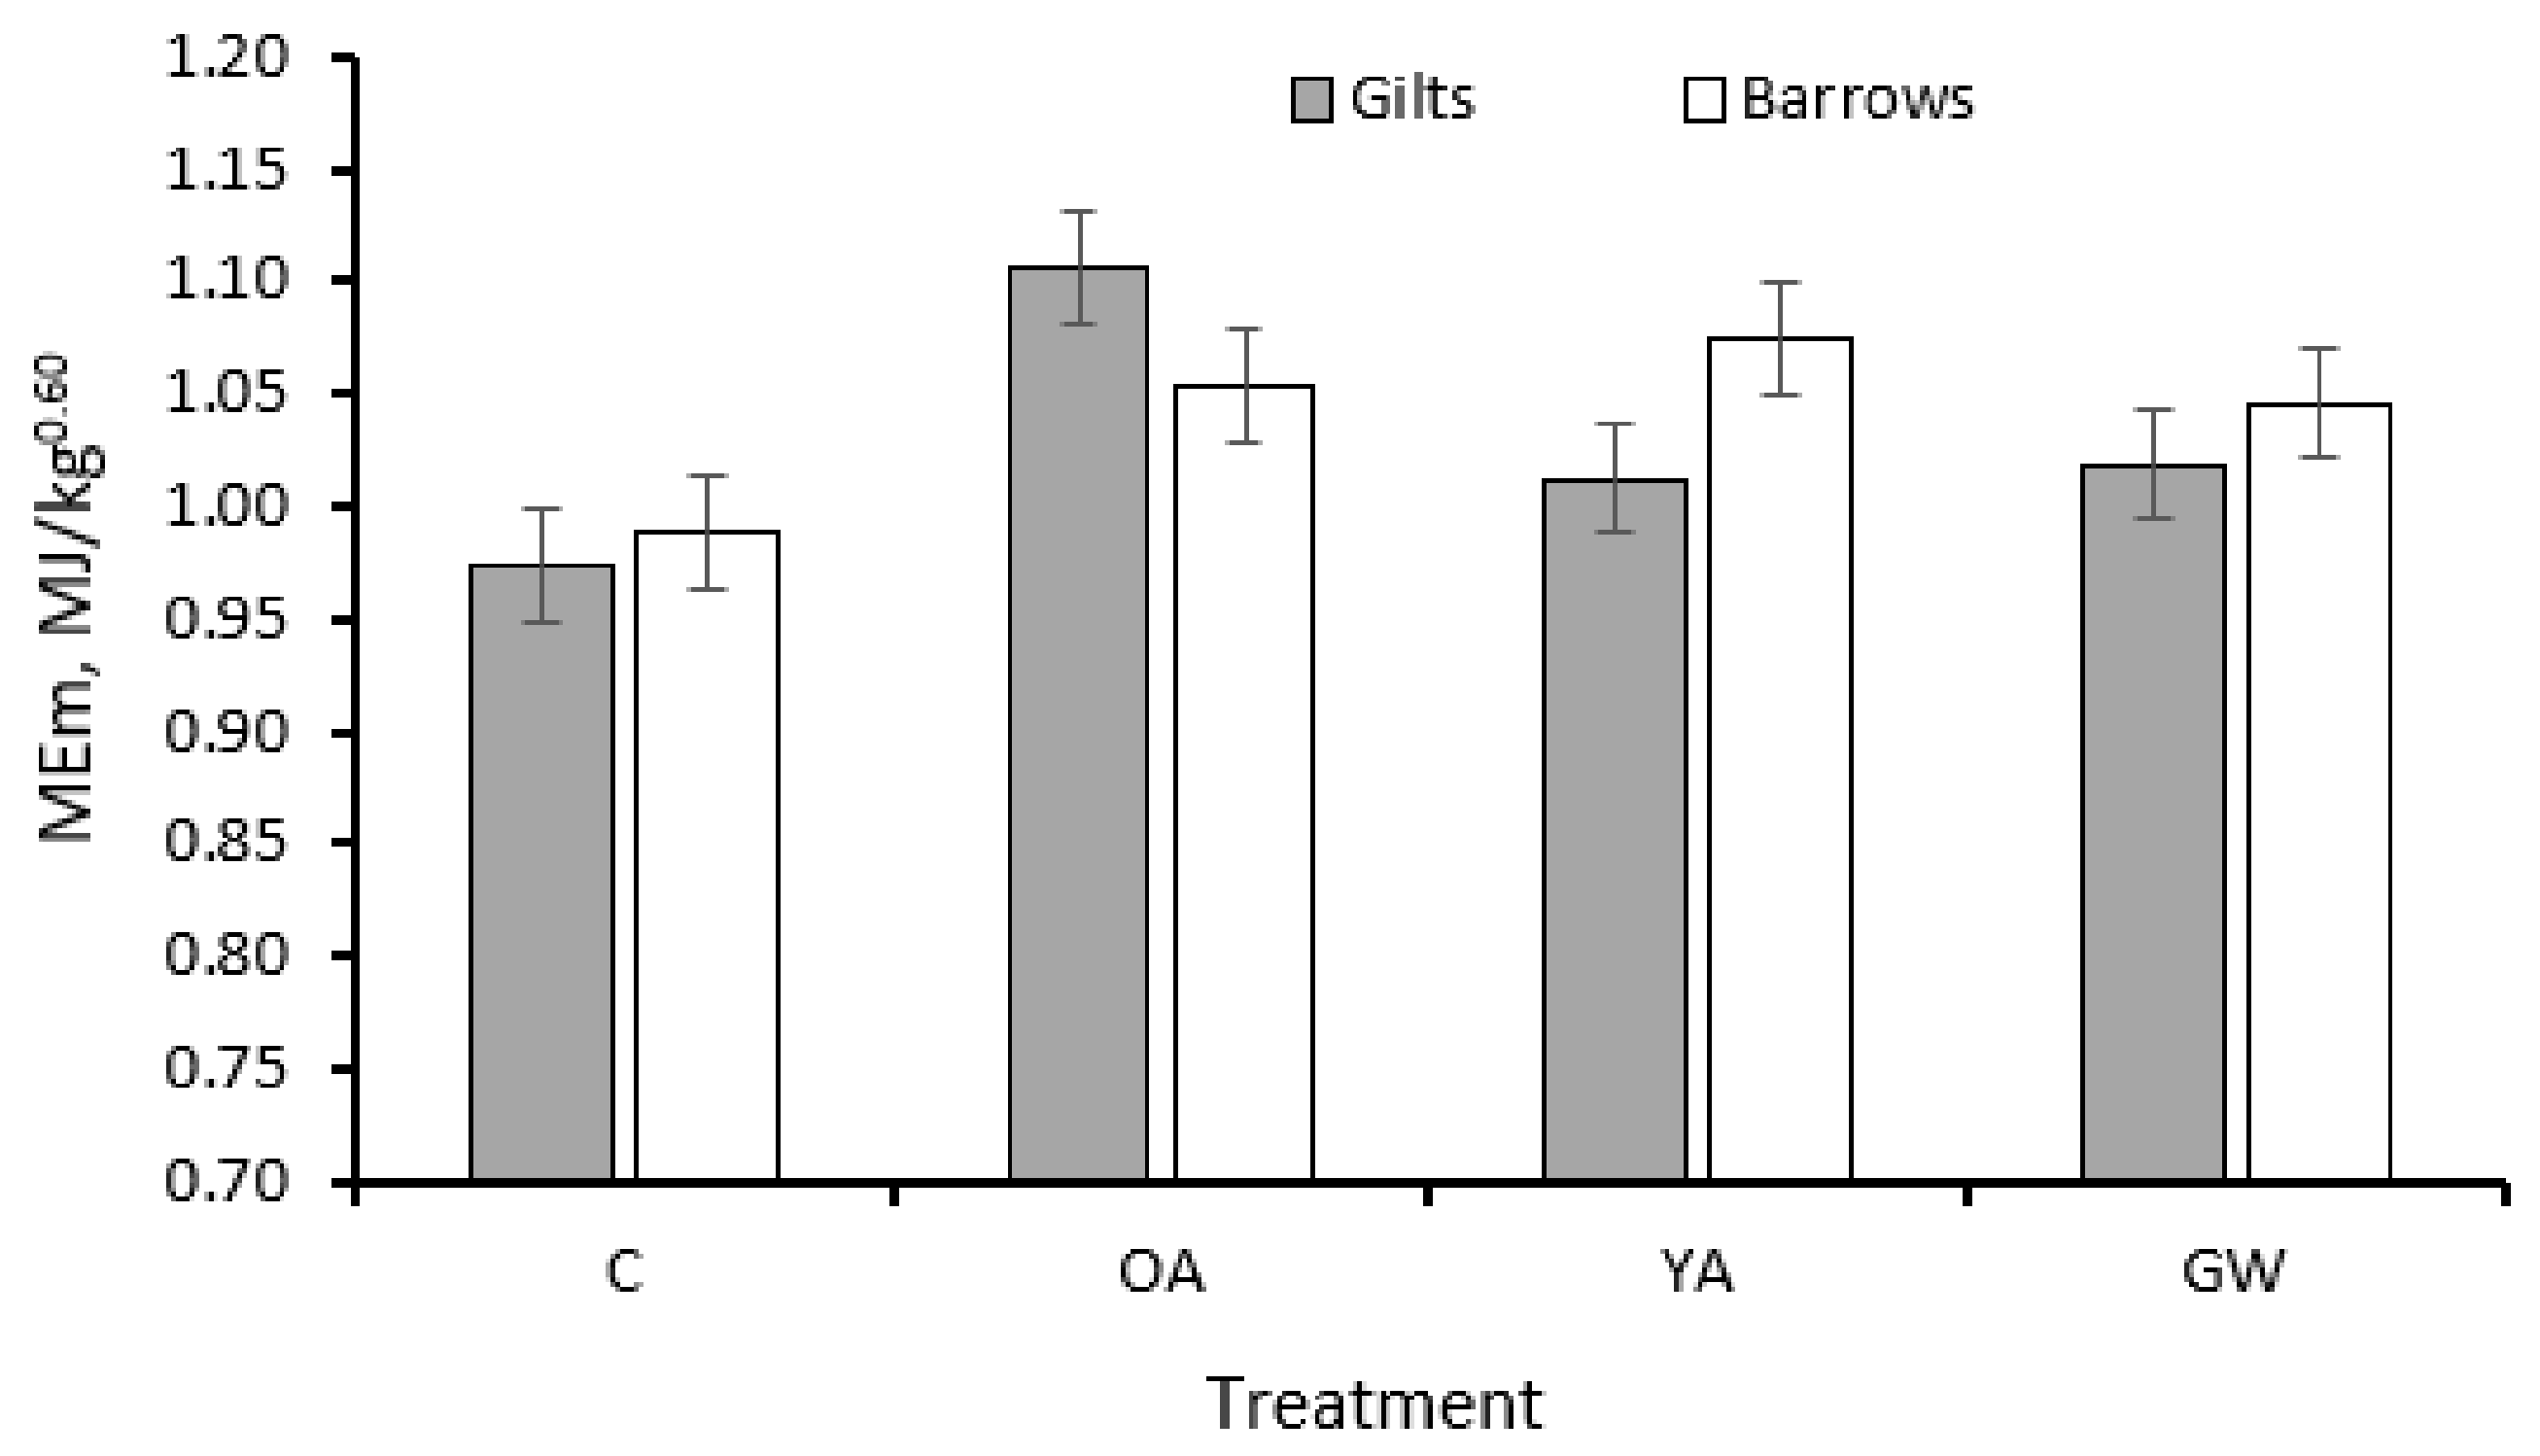
| ME for maintenance 7, MJ/kg0.60 | 0.981 | 1.091 | 1.029 | 1.036 | 0.021 | <0.001 | 0.08 | 0.79 | 1.02 | 1.04 | 0.015 | 0.34 | 0.001 |
3.3. SID Lysine Partitioning and Efficiencies of Utilization
4. Discussion
4.1. Growth Performance and Dry Matter
- (i)
- (ii)
- With the current C feeding regime, the degree of DMI or energy restriction was remarkable and in the order of 20%, similar to what is practised in some regions of Spain for dry-cured ham production [31].
- (iii)
- A rearing practice based on protein restriction, in addition to the energy restriction, decreased the daily EBW gain and increased the duration of feeding for the target SW, but it had a small influence on the in vivo backfat depth compared to the C treatment.
- (iv)
- C21 Goland pigs receiving the YA treatment evidenced a remarkable increase in EBW gain (0.939 kg/d) and backfat depth compared to the C treatment, despite the heavy range of BW (90–170 kg). Differences among individual pigs cannot be fully expressed when the pigs are kept on a restricted feeding regime, as the major factor limiting the growth is the energy and nutrient supply [32]. Therefore, the response of an EBW gain when shifting pigs from a restricted to ad libitum feeding strategy would largely depend on the growth characteristics of the pig genotype used [21]. This implies that moving from a restricted to voluntary feeding regime would lead to a greater heterogeneity among pigs intended for dry-cured ham production [23].
- (v)
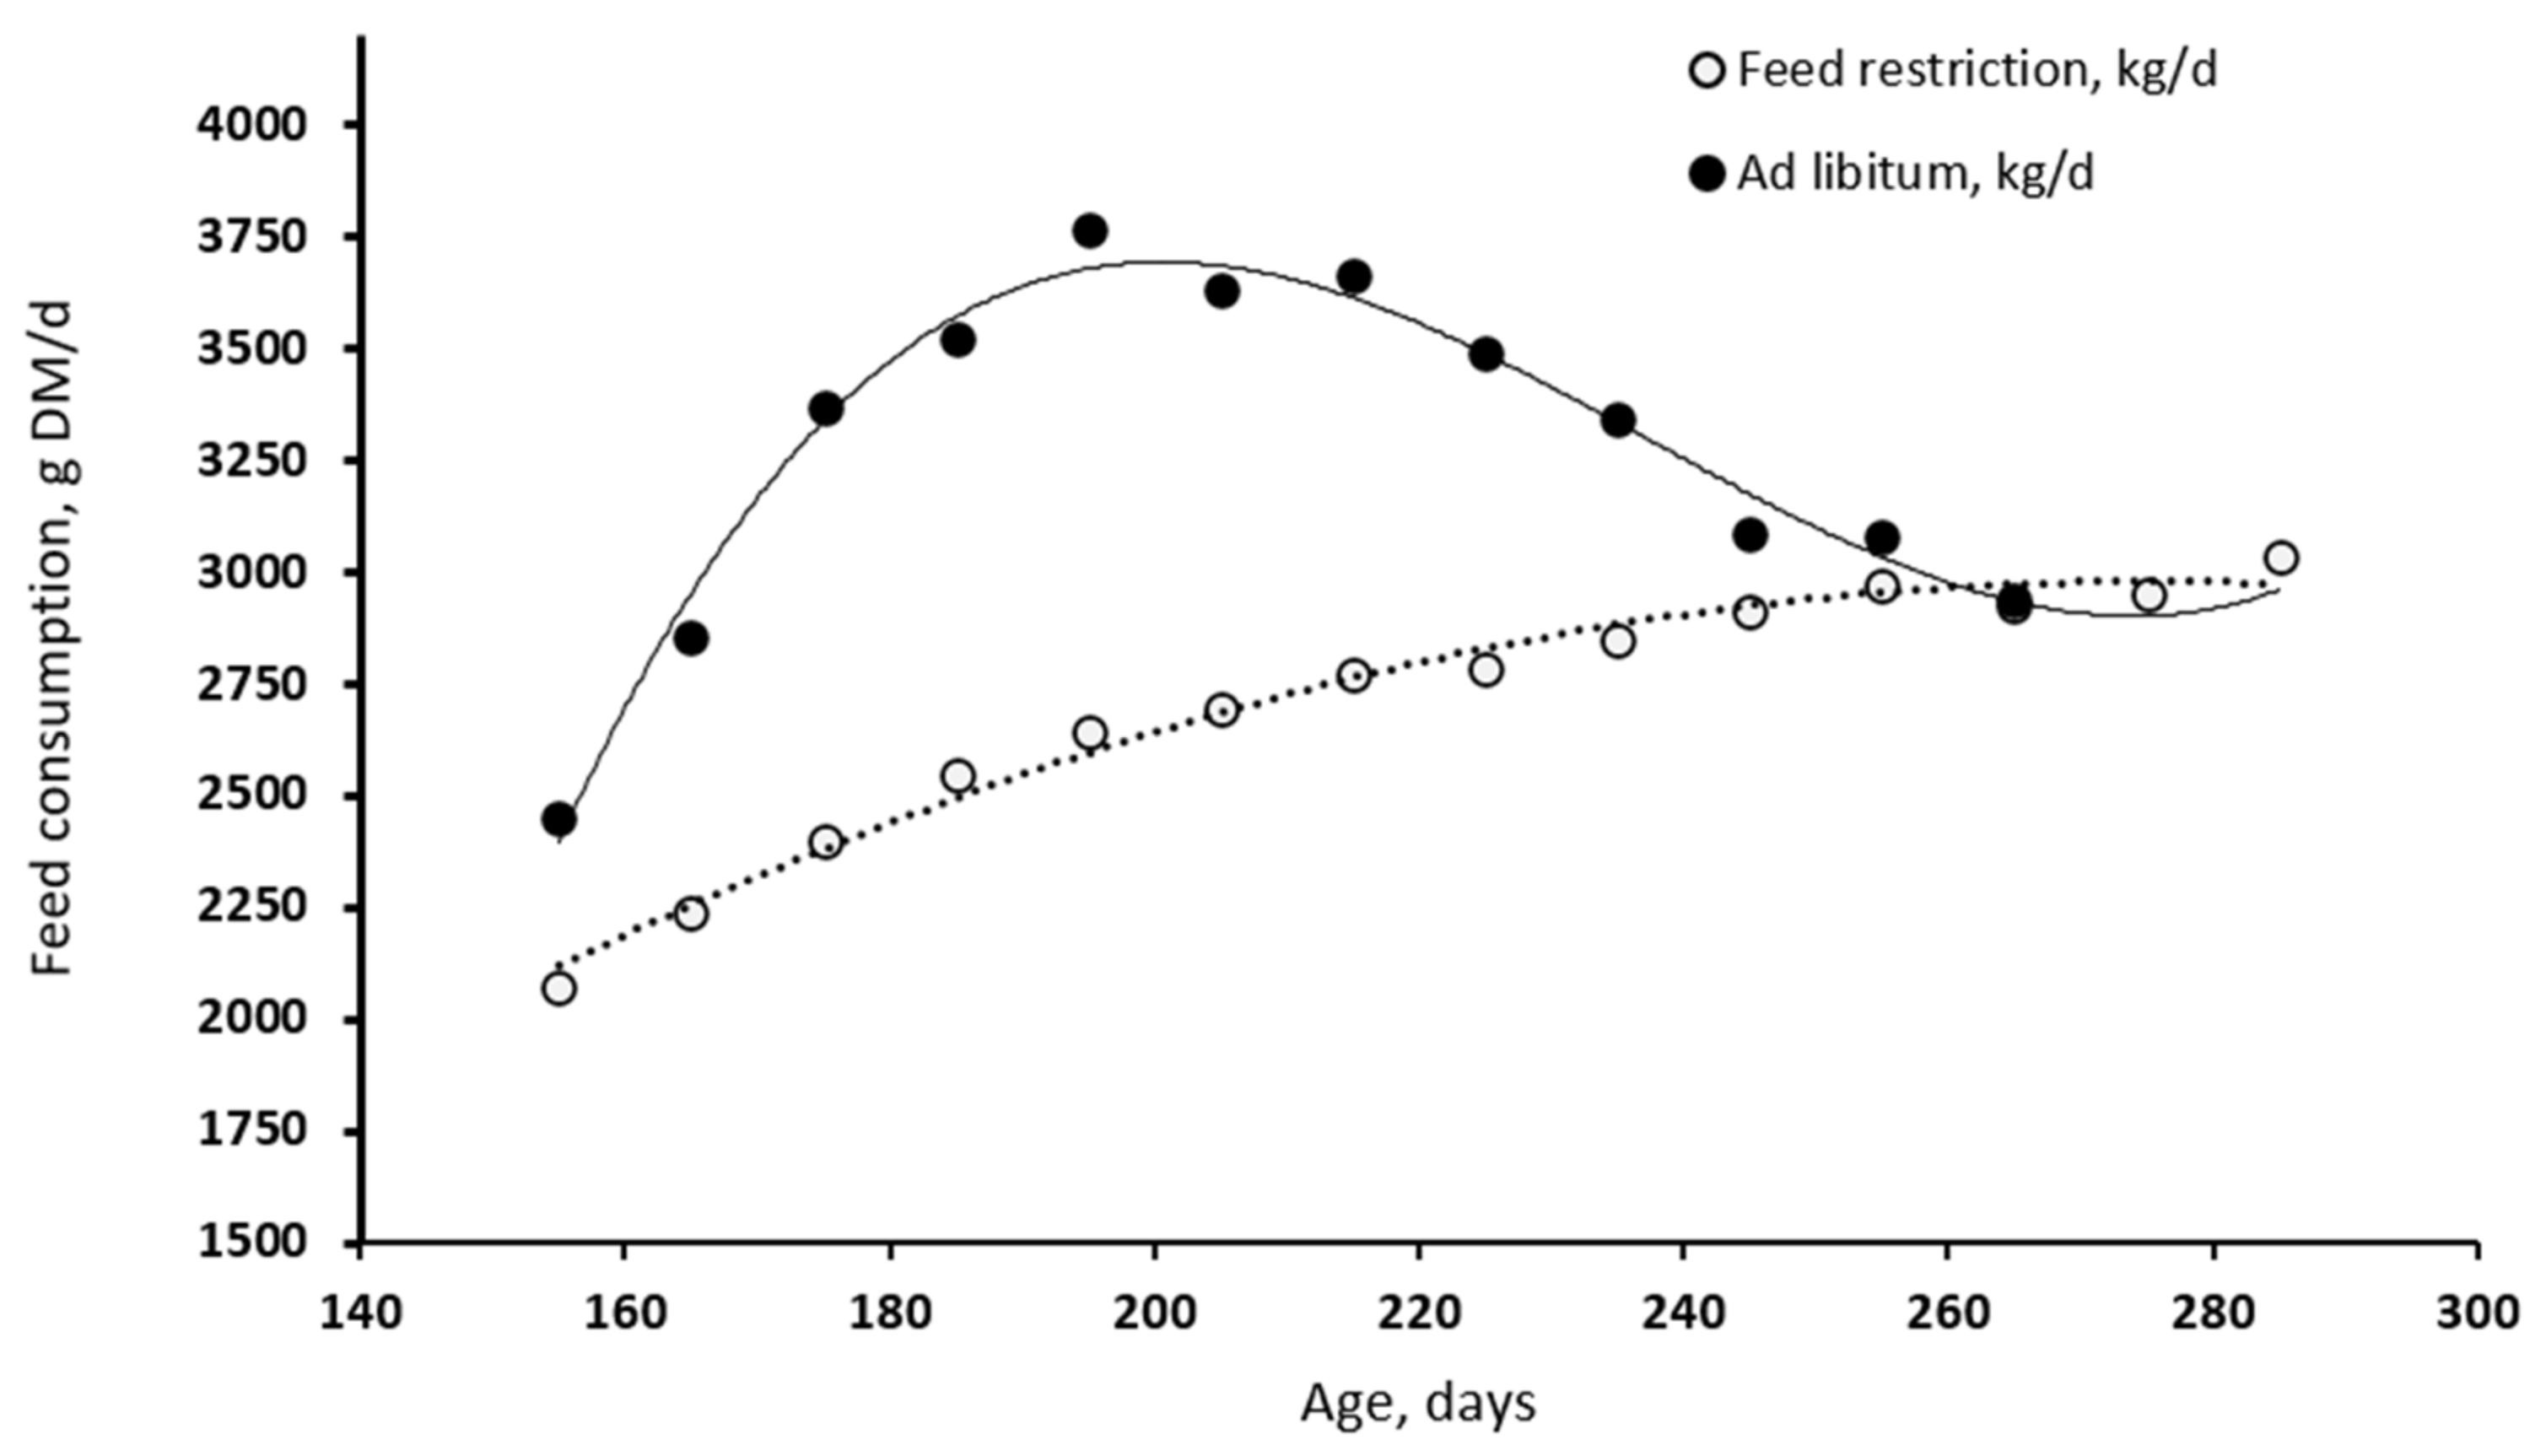
- Data from the current experiment evidenced that the voluntary DMI of the YA and GW pigs peaked at 3.750 kg/d at about 190 d of age, with a decline of 11.9 g/d (0.17 MJ/d of ME) thereafter. Assuming that voluntary feed intake is determined by the pig’s attempt to fulfil its energy demands [33], the decline would represent the progressive decrease in the ME demand for growth with increasing maturity. However, this is partially counterbalanced by an increase in the demand for MEm.
- (vi)
- Sex had some influence on growth performance. The barrows had greater cumulative DMI (+3.0%) and final backfat depth (+5.7%) but similar EBW gain compared to gilts. This suggests that barrows had a greater propensity for body fatness than gilts, as is in agreement with previous literature [34,35]. Similarly, few differences between barrows and gilts were observed in the same breed of pigs in a different study [10]. In our current work, we expected a greater difference between sex, because the ad libitum feeding regime would exploit the propensity for the growth of the various body parameters measured. However, this expectation was evidenced between barrows and gilts under the GW but not YA strategy. This is attributed to the effect of greater SW and SA resulting from the GW treatment, thus, suggesting that the differentiation between barrows and gilts would become more evident after 8 months of age and >170 kg in BW under unlimited feeding conditions.
4.2. Chemical Body Composition Estimates
4.3. Estimated Daily Protein Depositions
4.4. Metabolizable Energy Requirements and Partitioning
4.5. SID Lysine Partitioning and Efficiency
5. Conclusions
Author Contributions
Funding
Institutional Review Board Statement
Informed Consent Statement
Data Availability Statement
Acknowledgments
Conflicts of Interest
References
- National Research Council. Nutrient Requirements of Swine, 11th ed.; National Academies Press: Washington, DC, USA, 2012; ISBN 978-0-309-22423-9.
- Fiego, D.L.; Santoro, P.; Macchioni, P.; De Leonibus, E. Influence of genetic type, live weight at slaughter and carcass fatness on fatty acid composition of subcutaneous adipose tissue of raw ham in the heavy pig. Meat Sci. 2005, 69, 107–114. [Google Scholar] [CrossRef] [PubMed]
- Latorre, M.A.; García-Belenguer, E.; Ariño, L. The effects of sex and slaughter weight on growth performance and carcass traits of pigs intended for dry-cured ham from Teruel (Spain). J. Anim. Sci. 2008, 86, 1933–1942. [Google Scholar] [CrossRef] [PubMed] [Green Version]
- Gallo, L.; Bona, M.D.; Cecchinato, A.; Schiavon, S. Effect of growth rate on live performance, carcass and green thigh traits of finishing Italian heavy pigs. Ital. J. Anim. Sci. 2017, 16, 652–658. [Google Scholar] [CrossRef]
- Malgwi, I.H.; Gallo, L.; Halas, V.; Bonfatti, V.; Carcò, G.; Sasso, C.P.; Carnier, P.; Schiavon, S. The Implications of Changing Age and Weight at Slaughter of Heavy Pigs on Carcass and Green Ham Quality Traits. Animals 2021, 11, 2447. [Google Scholar] [CrossRef]
- Malgwi, I.H.; Giannuzzi, D.; Gallo, L.; Halas, V.; Carnier, P.; Schiavon, S. Influence of Slaughter Weight and Sex on Growth Performance, Carcass Characteristics and Ham Traits of Heavy Pigs Fed Ad-Libitum. Animals 2022, 12, 215. [Google Scholar] [CrossRef] [PubMed]
- Rodríguez-Sánchez, J.A.; Sanz, M.A.; Blanco, M.; Serrano, M.P.; Joy, M.; Latorre, M.A. The influence of dietary lysine restriction during the finishing period on growth performance and carcass, meat, and fat characteristics of barrows and gilts intended for dry-cured ham production. J. Anim. Sci. 2011, 89, 3651–3662. [Google Scholar] [CrossRef] [Green Version]
- Gallo, L.; Bona, M.D.; Carraro, L.; Cecchinato, A.; Carnier, P.; Schiavon, S. Effect of progressive reduction in crude protein and lysine of heavy pigs diets on some technological properties of green hams destined for PDO dry-cured ham production. Meat Sci. 2016, 121, 135–140. [Google Scholar] [CrossRef]
- Labussière, E.; van Milgen, J.; De Lange, C.F.; Noblet, J. Maintenance Energy Requirements of Growing Pigs and Calves Are Influenced by Feeding Level. J. Nutr. 2011, 141, 1855–1861. [Google Scholar] [CrossRef] [Green Version]
- Gallo, L.; Montà, G.D.; Carraro, L.; Cecchinato, A.; Carnier, P.; Schiavon, S. Growth performance of heavy pigs fed restrictively diets with decreasing crude protein and indispensable amino acids content. Livest. Sci. 2014, 161, 130–138. [Google Scholar] [CrossRef]
- Ferguson, N.S.; Gous, R.M. Evaluation of pig genotypes Theoretical aspects of measuring genetic parameters. Anim. Sci. 1993, 56, 233–243. [Google Scholar] [CrossRef]
- Ferguson, N.S.; Gous, R.M. Evaluation of pig genotypes: Testing experimental procedure. Anim. Sci. 1993, 56, 245–249. [Google Scholar] [CrossRef]
- Wellock, I.J.; Emmans, G.C.; Kyriazakis, I. Describing and predicting potential growth in the pig. Anim. Sci. 2004, 78, 379–388. [Google Scholar] [CrossRef]
- Van Milgen, J.; Dourmad, J.-Y. Concept and application of ideal protein for pigs. J. Anim. Sci. Biotechnol. 2015, 6, 15. [Google Scholar] [CrossRef] [PubMed] [Green Version]
- Van Milgen, J.; Valancogne, A.; Dubois, S.; Dourmad, J.-Y.; Sève, B.; Noblet, J. InraPorc: A model and decision support tool for the nutrition of growing pigs. Anim. Feed Sci. Technol. 2008, 143, 387–405. [Google Scholar] [CrossRef]
- Schiavon, S.; Bona, M.D.; Carcò, G.; Carraro, L.; Bünger, L.; Gallo, L. Effects of feed allowance and indispensable amino acid reduction on feed intake, growth performance and carcass characteristics of growing pigs. PLoS ONE 2018, 13, e0195645. [Google Scholar] [CrossRef] [PubMed] [Green Version]
- Schiavon, S.; Gallo, L.; Carnier, P.; Tagliapietra, F.; Ceolin, C.; Prandini, A.; Piva, A. Use of simple body measurements and allometry to predict the chemical growth and feed intake in pigs. Ital. J. Anim. Sci. 2007, 6, 27–44. [Google Scholar] [CrossRef]
- Carcò, G.; Gallo, L.; Bona, M.D.; Latorre, M.A.; Fondevila, M.; Schiavon, S. The influence of feeding behaviour on growth performance, carcass and meat characteristics of growing pigs. PLoS ONE 2018, 13, e0205572. [Google Scholar] [CrossRef] [Green Version]
- Bosi, P.; Russo, V. The production of the heavy pig for high quality processed products. Ital. J. Anim. Sci. 2004, 3, 309–321. [Google Scholar] [CrossRef] [Green Version]
- Ferguson, N.S.; Gous, R.M.; Emmans, G.C. Preferred components for the construction of a new simulation model of growth, feed intake and nutrient requirements of growing pigs. S. Afr. J. Anim. Sci. 1994, 24, 10–17. [Google Scholar]
- Kyriazakis, I.; Whittemore, C.T. Whittemore’s Science and Practice of Pig Production; Kyriazakis, I., Whittemore, C.T., Eds.; Blackwell Publishing Ltd.: Oxford, UK, 2006; ISBN 9780470995624. [Google Scholar]
- Schiavon, S.; Carraro, L.; Bona, M.D.; Cesaro, G.; Carnier, P.; Tagliapietra, F.; Sturaro, E.; Galassi, G.; Malagutti, L.; Trevisi, E.; et al. Growth performance, and carcass and raw ham quality of crossbred heavy pigs from four genetic groups fed low protein diets for dry-cured ham production. Anim. Feed Sci. Technol. 2015, 208, 170–181. [Google Scholar] [CrossRef]
- Gallo, L.; Montà, G.D.; Carraro, L.; Cecchinato, A.; Carnier, P.; Schiavon, S. Carcass quality and uniformity of heavy pigs fed restrictive diets with progressive reductions in crude protein and indispensable amino acids. Livest. Sci. 2015, 172, 50–58. [Google Scholar] [CrossRef]
- Van Soest, J.P.; Robertson, J.B.; Lewis, B.A. Methods of dietary fiber, neutral detergent fiber, and nonstarch polysaccharides in relation to animal nutrition. J. Dairy Sci. 1991, 71, 1587–1597. [Google Scholar] [CrossRef]
- AOAC International. Official Methods of Analysis of AOAC International, 17th ed.; AOAC International: Gaithersburg, MD, USA, 2003. [Google Scholar]
- Bouchard, J.; Chornet, E.; Overend, R.P. High-performance liquid chromatographic monitoring of carbohydrate fractions in partially hydrolyzed corn starch. J. Agric. Food Chem. 1988, 36, 1188–1192. [Google Scholar] [CrossRef]
- Council of Europe. Amino acid analysis. In European Pharmacopoeia 5.0; Humana Press: Strasbourg, France, 2005; Volume 5.0, pp. 86–92. [Google Scholar]
- Slump, P.; Flissebaalje, T.D.; Haaksman, I.K. Tryptophan in food proteins: A comparison of two hydrolytic procedures. J. Sci. Food Agric. 1991, 55, 493–496. [Google Scholar] [CrossRef]
- Kloareg, M.; Noblet, J.; Van Milgen, J. Estimation of whole body lipid mass in finishing pigs. Anim. Sci. 2006, 82, 241–251. [Google Scholar] [CrossRef]
- Wu, F.; Vierck, K.R.; DeRouchey, J.M.; O’Quinn, T.G.; Tokach, M.D.; Goodband, R.D.; Dritz, S.S.; Woodworth, J.C. A review of heavy weight market pigs: Status of knowledge and future needs assessment. Transl. Anim. Sci. 2017, 1, 1–15. [Google Scholar] [CrossRef] [Green Version]
- Serrano, M.P.; Valencia, D.G.; Fuentetaja, A.; Lázaro, R.; Mateos, G.G. Influence of feed restriction and sex on growth performance and carcass and meat quality of Iberian pigs reared indoors. J. Anim. Sci. 2009, 87, 1676–1685. [Google Scholar] [CrossRef]
- Schiavon, S.; Carcò, G.; Sturaro, E.; Gallo, L.; Bona, M.D. Responses of Pigs of Different Genotypes to a Variation in the Dietary Indispensable Amino Acid Content in Terms of Their Growth and Carcass and Meat Quality Traits. Animals 2019, 9, 508. [Google Scholar] [CrossRef] [Green Version]
- Knap, P.W. Voluntary Feed Intake in Pigs; Torrallardona, D., Roura, E., Eds.; Wageningen Academic Publishers: Wageningen, The Netherlands, 2009; ISBN 978-90-8686-096-8. [Google Scholar]
- Latorre, M.A.; Lázaro, R.; Valencia, D.G.; Medel, P.; Mateos, G.G. The effects of gender and slaughter weight on the growth performance, carcass traits, and meat quality characteristics of heavy pigs. J. Anim. Sci. 2004, 82, 526–533. [Google Scholar] [CrossRef]
- Latorre, M.A.; Olivares, A.; Callejo, A.; Rey, A.; Pérez-Ciria, L.; Bote, C.J.L.; Daza, A. A comparison of female and castrate pigs slaughtered at weights above and below 120 kg on carcass traits, intramuscular fat and fatty acid composition of carcasses intended for dry-cured ham and shoulder production. Anim. Prod. Sci. 2019, 59, 1923–1930. [Google Scholar] [CrossRef]
- Naatjes, M.; Susenbeth, A. Energy requirement of growing pigs under commercial housing conditions. Arch. Anim. Nutr. 2014, 68, 93–110. [Google Scholar] [CrossRef] [PubMed]
- Quiniou, N.; Noblet, J.; Dourmad, J.-Y. Effect of energy intake on the performance of different types of pig from 45 to 100 kg body weight. 2. Tissue gain. Anim. Sci. 1996, 63, 289–296. [Google Scholar] [CrossRef]
- Garcia-Valverde, R.; Barea, R.; Lara, L.; Nieto, R.; Aguilera, J. The effects of feeding level upon protein and fat deposition in Iberian heavy pigs. Livest. Sci. 2008, 114, 263–273. [Google Scholar] [CrossRef]
- Kloareg, M.; Noblet, J.; van Milgen, J. Deposition of dietary fatty acids, de novo synthesis and anatomical partitioning of fatty acids in finishing pigs. Br. J. Nutr. 2007, 97, 35–44. [Google Scholar] [CrossRef] [Green Version]
- Ferguson, N.; Kyriazis, S. Evaluation of the growth parameters of six commercial crossbred pig genotypes Under commercial housing conditions in individual pens. South Afr. J. Anim. Sci. 2003, 33, 11–20. [Google Scholar] [CrossRef] [Green Version]
- Manini, R.; Piva, A.; Prandini, A.; Mordenti, A.; Piva, G.; Dourmad, J. Protein retention in Italian heavy pigs: Development of a factorial approach for the determination of lysine requirement. Livest. Prod. Sci. 1997, 47, 253–259. [Google Scholar] [CrossRef]
- Tagliapietra, F.; Ceolin, C.; Schiavon, S. On-farm estimation of pig growth parameters from longitudinal data of live weight and feed consumption and the use of a mathematical model. Ital. J. Anim. Sci. 2005, 4, 116–118. [Google Scholar] [CrossRef]
- Galassi, G.; Colombini, S.; Malagutti, L.; Crovetto, G.; Rapetti, L. Effects of high fibre and low protein diets on performance, digestibility, nitrogen excretion and ammonia emission in the heavy pig. Anim. Feed Sci. Technol. 2010, 161, 140–148. [Google Scholar] [CrossRef]
- Galassi, G.; Malagutti, L.; Colombini, S.; Rapetti, L.; Gallo, L.; Schiavon, S.; Tagliapietra, F.; Crovetto, G.M. Nitrogen and Energy Partitioning in Two Genetic Groups of Pigs Fed Low-Protein Diets at 130 kg Body Weight. Ital. J. Anim. Sci. 2015, 14, 293–298. [Google Scholar] [CrossRef]
- Wecke, C.; Liebert, F. Lysine requirement studies in modern genotype barrows dependent on age, protein deposition and dietary lysine efficiency. J. Anim. Physiol. Anim. Nutr. 2009, 93, 295–304. [Google Scholar] [CrossRef] [PubMed]
- Noblet, J.; Karege, C.; Dubois, S.; Van Milgen, J. Metabolic utilization of energy and maintenance requirements in growing pigs: Effects of sex and genotype. J. Anim. Sci. 1999, 77, 1208–1216. [Google Scholar] [CrossRef] [PubMed]
- Van Milgen, J.; Bernier, J.F.; Lecozler, Y.; Dubois, S.; Noblet, J. Major determinants of fasting heat production and energetic cost of activity in growing pigs of different body weight and breed/castration combination. Br. J. Nutr. 1998, 79, 509–517. [Google Scholar] [CrossRef] [PubMed] [Green Version]
- Wood, J.; Lambe, N.; Walling, G.; Whitney, H.; Jagger, S.; Fullarton, P.; Bayntun, J.; Hallett, K.; Bunger, L. Effects of low protein diets on pigs with a lean genotype. Carcass composition measured by dissection and muscle fatty acid composition. Meat Sci. 2013, 95, 123–128. [Google Scholar] [CrossRef] [PubMed]
- Dourmad, J.; Guillou, D.; Sève, B.; Henry, Y. Response to dietary lysine supply during the finishing period in pigs. Livest. Prod. Sci. 1996, 45, 179–186. [Google Scholar] [CrossRef]


| Feeding Strategy | p Values | Sex | p Value | ||||||||||
|---|---|---|---|---|---|---|---|---|---|---|---|---|---|
| Item | C | OA | YA | GW | SEM 1 | C vs. OA | C vs. YA | YA vs. GW | Gilts | Barrows | SEM | Sex | Sex × Treatment |
| SID lysine intake 2, g/d | 14.6 | 11.3 | 24.3 | 23.0 | 0.70 | 0.007 | <0.001 | 0.21 | 18.0 | 18.6 | 0.38 | 0.05 | 0.007 |
| SID lysine marginal intake 2, | |||||||||||||
| per day, g/d | 12.9 | 9.6 | 22.3 | 21.0 | 0.68 | 0.006 | <0.001 | 0.05 | 16.2 | 16.7 | 0.37 | 0.049 | 0.041 |
| per gram of protein deposited, g/g | 0.110 | 0.099 | 0.154 | 0.155 | 0.009 | 0.14 | <0.001 | 0.89 | 0.126 | 0.133 | 0.008 | 0.002 | 0.022 |
| SID lysine consumed in excess 3, g/d | −1.48 | −2.26 | 4.36 | 4.19 | 1.14 | 0.35 | <0.001 | 0.84 | 0.85 | 1.55 | 1.03 | 0.002 | 0.21 |
| Lysine losses and retention 4, g/d: | |||||||||||||
| basal GIT losses | 1.08 | 1.09 | 1.36 | 1.32 | 0.02 | 0.77 | <0.001 | 0.15 | 1.20 | 1.23 | 0.01 | 0.08 | 0.035 |
| integumental losses | 0.17 | 0.17 | 0.17 | 0.19 | 0.001 | 0.51 | 0.81 | <0.001 | 0.18 | 0.18 | 0.001 | 0.07 | 0.51 |
| retained | 8.39 | 6.94 | 10.40 | 9.76 | 0.44 | <0.001 | <0.001 | 0.06 | 8.94 | 8.81 | 0.40 | 0.39 | 0.34 |
| SID lysine requirement 5, g/d: | |||||||||||||
| maintenance | 1.67 | 1.68 | 2.05 | 2.01 | 0.03 | 0.81 | <0.001 | 0.31 | 1.83 | 1.87 | 0.02 | 0.07 | 0.029 |
| protein deposition (Pd) | 14.37 | 11.86 | 17.92 | 16.81 | 0.77 | <0.001 | <0.001 | 0.06 | 15.32 | 15.16 | 0.71 | 0.53 | 0.18 |
| total | 16.04 | 13.54 | 18.82 | 19.97 | 0.76 | <0.001 | <0.001 | 0.06 | 17.16 | 17.03 | 0.67 | 0.65 | 0.15 |
| SID lysine efficiencies 6: | |||||||||||||
| total efficiency | 0.576 | 0.616 | 0.432 | 0.428 | 0.024 | 0.050 | <0.001 | 0.83 | 0.522 | 0.504 | 0.02 | 0.007 | 0.81 |
| marginal efficiency | 0.650 | 0.725 | 0.472 | 0.469 | 0.025 | 0.009 | <0.001 | 0.91 | 0.566 | 0.538 | 0.016 | 0.032 | 0.66 |
Publisher’s Note: MDPI stays neutral with regard to jurisdictional claims in published maps and institutional affiliations. |
© 2022 by the authors. Licensee MDPI, Basel, Switzerland. This article is an open access article distributed under the terms and conditions of the Creative Commons Attribution (CC BY) license (https://creativecommons.org/licenses/by/4.0/).
Share and Cite
Schiavon, S.; Malgwi, I.H.; Giannuzzi, D.; Galassi, G.; Rapetti, L.; Carnier, P.; Halas, V.; Gallo, L. Impact of Rearing Strategies on the Metabolizable Energy and SID Lysine Partitioning in Pigs Growing from 90 to 200 kg in Body Weight. Animals 2022, 12, 689. https://doi.org/10.3390/ani12060689
Schiavon S, Malgwi IH, Giannuzzi D, Galassi G, Rapetti L, Carnier P, Halas V, Gallo L. Impact of Rearing Strategies on the Metabolizable Energy and SID Lysine Partitioning in Pigs Growing from 90 to 200 kg in Body Weight. Animals. 2022; 12(6):689. https://doi.org/10.3390/ani12060689
Chicago/Turabian StyleSchiavon, Stefano, Isaac Hyeladi Malgwi, Diana Giannuzzi, Gianluca Galassi, Luca Rapetti, Paolo Carnier, Veronika Halas, and Luigi Gallo. 2022. "Impact of Rearing Strategies on the Metabolizable Energy and SID Lysine Partitioning in Pigs Growing from 90 to 200 kg in Body Weight" Animals 12, no. 6: 689. https://doi.org/10.3390/ani12060689
APA StyleSchiavon, S., Malgwi, I. H., Giannuzzi, D., Galassi, G., Rapetti, L., Carnier, P., Halas, V., & Gallo, L. (2022). Impact of Rearing Strategies on the Metabolizable Energy and SID Lysine Partitioning in Pigs Growing from 90 to 200 kg in Body Weight. Animals, 12(6), 689. https://doi.org/10.3390/ani12060689